Highlights from the NA61/SHINE experiment ††thanks: Presented at Quark Matter 2022, 5 April 2022, Kraków, Poland
Abstract
The NA61/SHINE experiment is a fixed-target, broad acceptance facility at the CERN SPS. This contribution summarizes the most recent results from the strong interactions NA61/SHINE programme and presents news on the detector upgrade in preparation for the future data taking. The strong interactions programme consists in a two-dimensional scan in beam momentum (from 13 to 150/158 GeV/, from 5.1 to 17.3 GeV) and system size (, , , reactions). The experiment searches for the second-order critical end-point in the temperature versus baryo-chemical potential phase diagram and studies the properties of the onset of deconfinement discovered by its predecessor, NA49 at the CERN SPS. The presented results include multiplicity ratios as a function of energy and system size, singly and multi-strange hadron production in reactions, multiplicity and net-charge fluctuations measured by higher order moments in , and collisions, proton and charged hadron intermittency in and reactions, HBT measurements in and collective electromagnetic effects in collisions.
1 Introduction
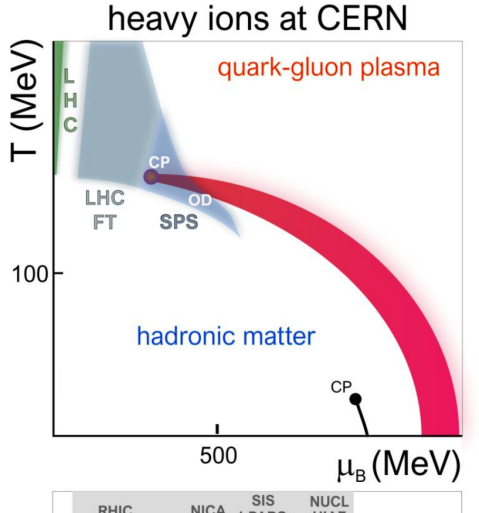
The NA61/SHINE experiment at the CERN SPS owes its name (SPS Heavy Ion and Neutrino Experiment) to a two-fold experimental programme. On the one hand it conducts precise spectra measurements necessary for cosmic ray and neutrino experiments. On the other, it investigates the onset of deconfinement (OD) discovered by its predecessor, the NA49 experiment at the CERN SPS [1] and searches for the critical point (CP) of the strongly interacting matter.
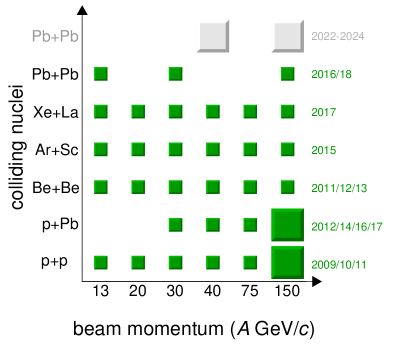
The latter part of the programme, the strong interactions programme, is the subject of the present paper. Within it, NA61/SHINE performed a two-dimensional scan of system size and collision energy (Fig. 1 left). This corresponds to scanning the phase diagram of the strongly interacting matter [2] (Fig. 1 right). It should be noted that due to the search for CP, which involves fluctuation variables, it is paramount to minimize system volume fluctuations and consequently the experiment focuses mainly on central collisions. Hence the system size scan as opposed to the more usual centrality scan.
2 Identified hadron spectra in and collisions
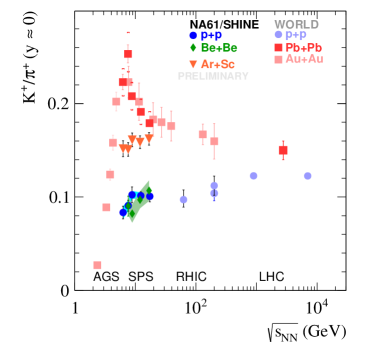
The published, new results on identified hadron spectra in collisions [3] and preliminary results on identified hadron spectra in collisions are discussed in detail in Ref. [4]. Figure 2 shows the summary of these studies, the system size and energy dependence of the ratio in midrapidity. A pronounced ‘horn’ in / collisions, associated with the OD [5], is clearly visible. There are, however, some unexpected features in this dependence. First, collisions do not follow a smooth increase with energy, but rather an abrupt change of the trend at SPS energies. Second, collisions feature similar ratio values to , while collisions have no horn structure, but at the top SPS energy converge to similar (large) ratio values as the collisions. These two observations can be attributed [6] respectively to two transitions between domains of dominance of specific hadron production mechanisms: from hadron resonances to strings when changing collision energy for small systems and from strings to QGP fireball (onset of fireball) when changing system size at large energies. These new NA61/SHINE data allow for the first time to sketch such a diagram of high-energy nuclear collisions and emphasize how important the SPS energy range is.
3 Search for the critical point
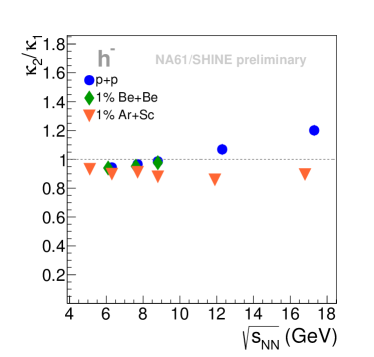
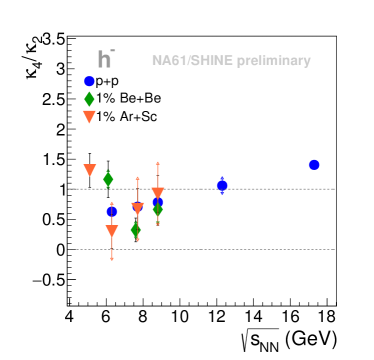
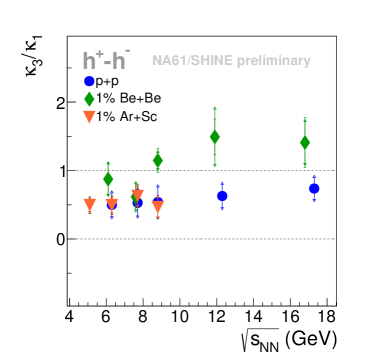
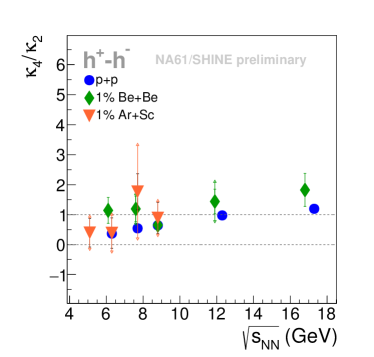
Preliminary results on multiplicity fluctuations of charged hadrons and net-charge fluctuations of charged hadrons, measured as the ratios of cumulants [7] of the order up to 4, are shown respectively in Fig. 4 and Fig. 4. No structure indicating the CP is visible. While ratio is consistent for all measured systems, interesting system size dependence is observed for multiplicity and net-charge ratios. In the first case there is an increasing difference with collision energy between small systems ( and ) and the system. In the second case there is a difference between and other systems, again increasing with . Work is still ongoing to get more data points for and systems.
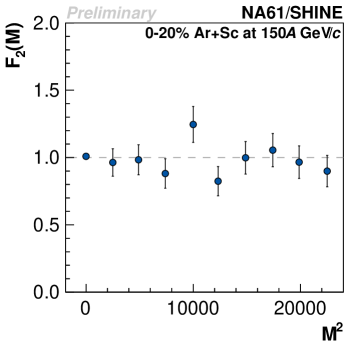
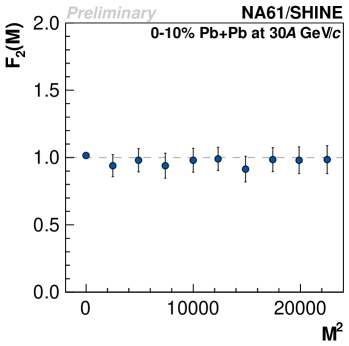
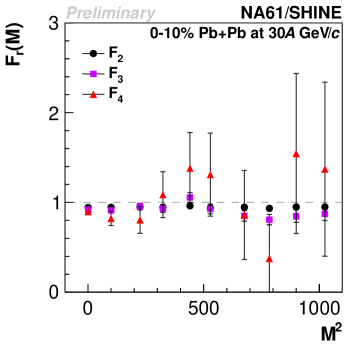
Another phenomenon frequently associated with the critical point of strongly interacting matter is intermittency. In this analysis transverse momentum space in midrapidity is divided into cells in which particles are counted to calculate scaled factorial moments . For the system experiencing critical behaviour, the theory predicts [8] specific power-law scaling of the moments as a function of the number of cells : . Figure 6 shows preliminary results on the proton intermittency in central and collisions at respectively and beam momenta. Figure 6 shows results for charged hadron intermittency in central collisions at beam momentum up to the fourth scaled factorial moment. These analyses feature statistically independent points and instead of the (, ) cells, cumulative variables are used to remove dependence of the moments on the momentum distribution [9]. While no indication of the critical point is visible in these analyses, a considerable progress is presently being accomplished in order to provide a more advanced methodology, more sensitive to intermittency in the presence of sizeable non-critical background [10].
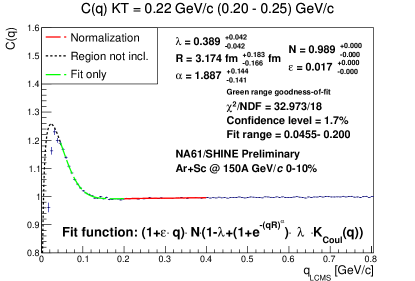
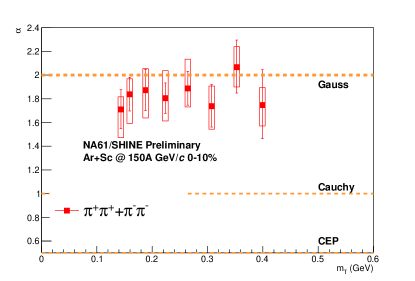
The last CP-related results are symmetric Levy HBT correlations for same-charge pion pairs in central collisions at beam momentum shown in Fig. 7. Here instead of a usual Gaussian source shape, a more general Levy-stable distribution is used. Its parameter describes the shape of the source: for the source is Gaussian, for we have a Cauchy distribution and the 3D Ising model with random external field predicts for a critical system. From the plot it is clear that there is no indication of the CP for central collisions at the top SPS energy.
4 Spectator-induced electromagnetic effects in collisions
Figure 9 shows the first time ever observation of spectator-induced electromagnetic effects in peripheral small systems ( collisions) at the CERN SPS. The effect is visible as a depletion of the ratio for small transverse momenta and pion rapidities close to the beam rapidity. Even at intermediate centrality, i.e. with a small spectator system, the effect is strong enough to break isospin symmetry. Spectator-induced electromagnetic effects provide information on the space-time evolution of the system [11], partially complementary to the femtoscopy.
5 New data on hadron spectra in reactions
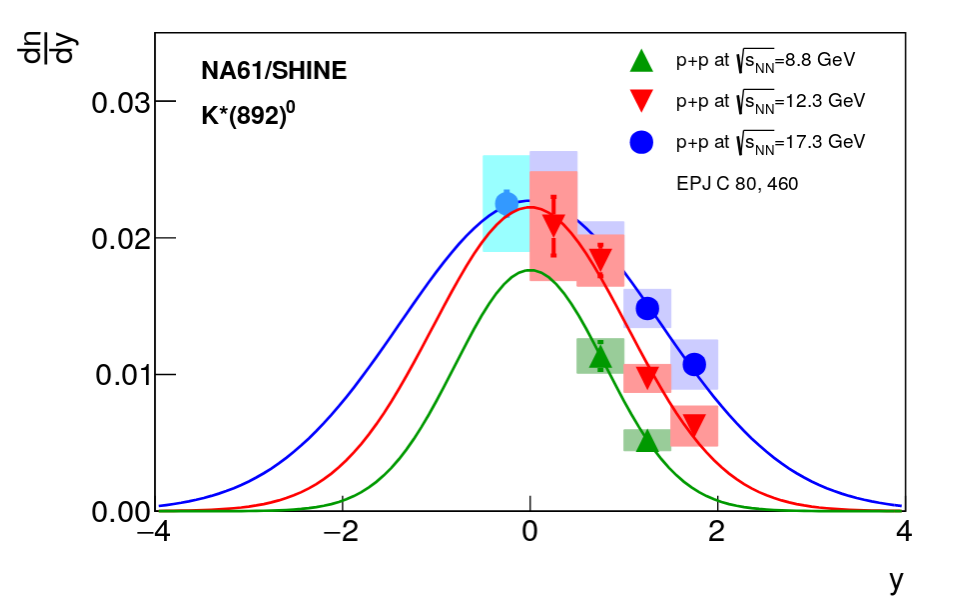
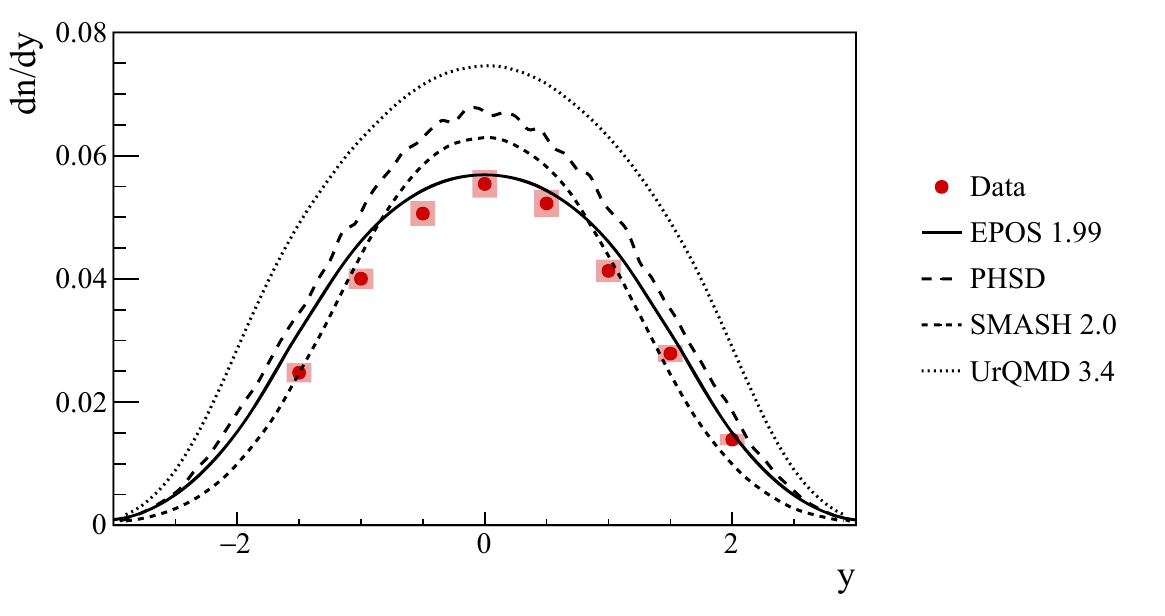
The new results on hadron spectra in collisions are also discussed in more detail in Ref. [4]. Here only two most recent results on rapidity spectra of neutral kaons are presented in Fig. 9: the at 40 and beam momenta [12] compared to [13] and the at compared to model predictions [14]. These data will on the one hand serve as reference for future data from larger systems and on the other hand serve as input to models, which struggle to describe the strangeness production at SPS energies. The latter is visible in the right plot of Fig. 9.
6 Hardware upgrade and future measurements
All of the above results were possible thanks to the versatility of the NA61/SHINE detector system. The spectrometer based on large-volume time projection chambers (TPC) features large acceptance covering the full forward hemisphere down to . The latter is feasible due to the fixed-target setup and the magnetic field oriented perpendicular to the beam direction. During the CERN Long Shutdown 2, the whole system underwent an upgrade including construction of a new Vertex Detector, new Beam Position Detectors, new Time-of-Flight detectors, larger forward calorimeter (Projectile Spectator Detector), new trigger and data acquisition system and most importantly replacement of the TPC read-out electronics to increase the data rate tenfold to 1 kHz.
The upgrade was necessary to perform the first ever open charm measurement at the SPS energies, which is the main goal of NA61/SHINE data taking in years 2022–2024 (Fig. 1 left, grey boxes). The latter is motivated by 3 questions:
-
•
What is the mechanism of open charm production?
-
•
How does the onset of deconfinement impact open charm production?
-
•
How does the formation of quark-gluon plasma impact production?
In order to answer these questions it is necessary to know the full phase space production of pairs, for which model predictions vary by 2 orders of magnitude [15].
Acknowledgements: This work was supported by the Polish Minister of Education and Science (contract No. 2021/WK/10).
References
- [1] NA49, C. Alt et al., Phys. Rev. C77, 024903 (2008).
- [2] F. Becattini et al., Phys.Rev. C73, 044905 (2006).
- [3] NA61/SHINE, A. Acharya et al., Eur. Phys. J. C 81, 73 (2021).
- [4] M. Lewicki, these proceedings.
- [5] M. Gazdzicki and M. I. Gorenstein, Acta Phys.Polon. B30, 2705 (1999).
- [6] E. Andronov et al., (2022), arXiv:2205.06726.
- [7] https://mathworld.wolfram.com/Cumulant.html.
- [8] N. G. Antoniou et al., Phys. Rev. Lett. 97, 032002 (2006).
- [9] A. Bialas and M. Gazdzicki, Phys. Lett. B 252, 483 (1990).
- [10] N. Davis, poster at this conference, https://indico.cern.ch/event/895086/timetable/.
- [11] V. Ozvenchuk et al., Phys. Rev. C 102, 014901 (2020).
- [12] NA61/SHINE, A. Acharya et al., Eur. Phys. J. C 82, 322 (2022).
- [13] NA61/SHINE, A. Aduszkiewicz et al., Eur. Phys. J. C 80, 460 (2020).
- [14] NA61/SHINE, A. Acharya et al., Eur. Phys. J. C 82, 96 (2022).
- [15] NA61/SHINE Collaboration, A. Aduszkiewicz, CERN Report No. CERN-SPSC-2018-008. SPSC-P-330-ADD-10 (2018).