Insight-HXMT observation on 4U 1608–52: evidence of interplay between thermonuclear burst and accretion environments
Abstract
A type-I burst could influence the accretion process through radiation pressure and Comptonization both for the accretion disk and the corona/boundary-layer of an X-ray binary, and vice versa. We investigate the temporal evolution of a bright photospheric radius expansion (PRE) burst of 4U 1608–52 detected by Insight-HXMT in 1–50 keV, with the aim of studying the interplay between the burst and persistent emission. Apart from the emission from the neutron star (NS) surface, we find the residuals both in the soft (3 keV) and hard (10 keV) X-ray band. Time-resolved spectroscopy reveals that the excess can be attributed to an enhanced pre-burst/persistent emission or the Comptonization of the burst emission by the corona/boundary-layer. The Comptonization model is a convolution thermal-Comptonization model (thcomp in XSPEC) and the Comptonization parameters are fixed at the values derived from the persistent emission. We find, during the PRE phase, after the enhanced pre-burst/persistent emission or the Comptonization of the burst emission is removed, the NS surface emission shows a plateau, and then a rise until the photosphere touches down to the NS surface, resulting in a flux peak at that moment. We speculate that the findings above correspond to that the obscured lower part of the NS surface by the disk is exposed to the line of sight due to the inner disk evaporation by the burst emission. The consistency between the model and convolution thermal-Comptonization model indicates the interplay between thermonuclear bursts and accretion environments. These phenomena did not usually show up by the conventional blackbody model fitting, which may be due to low count rate and narrow energy coverage in previous observations.
1 Introduction
Type-I X-ray burst, also named thermonuclear bursts, are triggered by unstable thermonuclear burning of the accreted fuel from a low-mass X-ray binary (LMXB) hosting a neutron star (NS) (for reviews, see Lewin et al., 1993; Cumming, 2004; Strohmayer & Bildsten, 2006; Galloway et al., 2008). Since its first detection in 1975 from 3A 1820–30, so far there are 116 Galactic X-ray binaries observed to produce thermonuclear bursts111https://personal.sron.nl/jeanz/bursterlist.html, manifesting a sudden increase in the X-ray luminosity followed by an exponential decay and with a typical duration about tens seconds. The most luminous bursts are the photospheric radius expansion (PRE) events, for which the peak flux reaches the Eddington luminosity of the NS.
Among some of the thousands of observed bursts (Galloway et al., 2020), observations on bursters by RXTE (in’t Zand et al., 2013; Worpel et al., 2013; Ballantyne & Strohmayer, 2004; Keek et al., 2014), INTEGRAL (Sánchez-Fernández et al., 2020), NICER (Keek et al., 2018, 2018a), AstroSat (Bhattacharyya et al., 2018) and Insight-HXMT (Chen et al., 2018, 2019), revealed interactions between the burst emission and the accretion environment: the continuum spectrum was observed to have an enhancement at soft X-ray and/or a shortage at hard X-rays (Worpel et al., 2013, 2015; Chen et al., 2012; Ji et al., 2013). Such spectral deviations are considered as burst-induced and might be relevant to disk reflection, accretion rate increase, and corona cooling (Ballantyne & Strohmayer, 2004; Keek et al., 2014; Degenaar et al., 2018).
Moreover, the reflection spectrum, consisting of discrete lines and a hump peaking at 20–40 keV, is interpreted as disk refection of an illuminant from the corona/boundary-layer. The burst emission could also serve as the illuminant to the disk, and a reflection component is correspondingly observed during the burst. However, so far only iron line is firmly detected during bursts, specifically during the long-duration superbursts (Ballantyne & Strohmayer, 2004; Keek et al., 2014). The observations above are the influence of the bursts on the accretion environment; however, there are few observational results reported related to the burst spectral change caused by the accretion disk/corona.
4U 1608–52 is a prolific burster located at the Galactic plane (Belian et al., 1976). More than 100 type-I X-ray bursts, inhabited its outbursts which have a typical frequency of once per 1–2 years since its discovery, were regularly observed. The distance was estimated as 2.9–4.5 kpc based on the peak flux pf PRE bursts 1.2–1.5 (e.g. Galloway et al., 2008; Poutanen et al., 2014). Its spin is around =619 Hz (Muno et al., 2001; Galloway et al., 2008), based on the burst oscillation detection.
In this present investigation, we provide a broad-band spectral view of 4U 1608–52 during its 2020 outburst observed by NICER and Insight-HXMT, both for its outburst and burst emission. We first describe the data reduction procedure of NICER and Insight-HXMT in Section 2. We then present an in-depth spectral analysis and model parameters of its outburst emission in Section 3.1, burst lightcures and spectral evolution in Section 3.2 and Section 3.3. Finally, we summarize our results and discuss their implications in Section 4.
2 Observations and Data reduction
2.1 Insight-HXMT
Hard X-ray Modulation Telescope (HXMT, also dubbed as Insight-HXMT, Zhang et al., 2020) excels in its broad energy band (1–250 keV) and a large effective area in hard X-rays energy band. It carries three collimated telescopes: the High Energy X-ray Telescope (HE; poshwich NaI/CsI, 20–250 keV, 5000 cm2), the Medium Energy X-ray Telescope (ME; Si pin detector, 5–40 keV, 952 cm2) and the Low Energy X-ray telescope (LE; SCD detector, 1–12 keV, 384 cm2). Under the quick read-out system of Insight-HXMT detectors, there is little pile-up effect event at the PRE burst peak. Insight-HXMT Data Analysis software (HXMTDAS) v2.04 are used to analyze the data. The data are reduced following the recommended procedure of the Insight-HXMT Data Reduction Guide v2.04222http://hxmtweb.ihep.ac.cn/SoftDoc.jhtml, which are screened in the standard criterion include in Insight-HXMT pipelines: lepipeline, mepipeline and hepipeline.
Two bursts were detected by three-payloads of Insight-HXMT from 4U 1608–52 in its 2020 outburst, as shown in Table 1. However, the second burst, which is only half bright as the first one, did not fall into the good-time-interval of LE; thus we only analyzed the first burst occurred at MJD 59069.770768 in this work.
The persistent spectra adapted the GTI exclude the time span before the burst peak time 100 s and after the burst peak time 200 s. The persistent spectra of LE are rebinned by ftool grppha with minimum of 100 counts per grouped bin. For the ME, the spetcra are binned up by a factor 20, due to its background is comparable with the source emission.
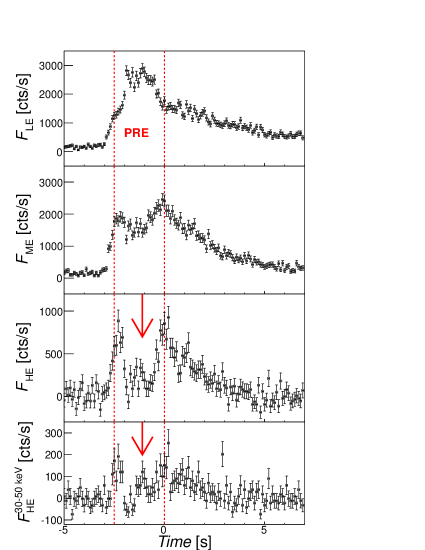
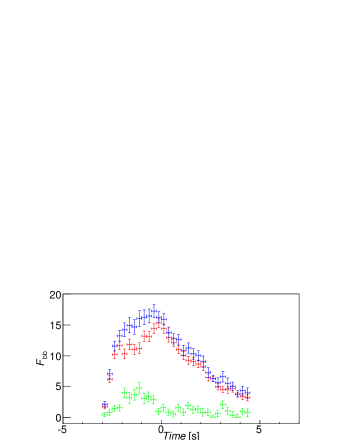
For the burst, we perform the time-resolved spectroscopy with a time resolution of 0.25 s, and define the time of the bolometric flux peak as a time reference (0 point in Fig. 1 and Fig. 3). The burst spectra are rebinned by ftool grppha with minimum of 10 counts per grouped bin.
In the calibration experiments on ground and the first two years in orbit, the recommend energy band for spectral fitting of LE is 1-10 keV, except very bright sources with a flux brighter than several Crab. After the midyear of 2019, the recommend band is shrunken to 2-10 keV, which mostly dues to the poor background estimation because of an increase of detector temperatures and something else. However, in the burst spectral analysis, we take the pre-burst emission as background, so we extend the energy band to 1-10 keV in burst spectra fitting, but still adapt 2-10 keV in persistent emission spectral fitting. We notice that, the LE spectral residuals of the persistent emission have rather complex structures in the energy band 1.5 keV, where the bursts have only a few data points. We also use the 2-10 keV to analyze the burst spectra, and get the roughly consistent results within parameter’s error bar. It is a similar consideration that we extend the ME band to 8–30 keV and the HE band to 25–50 keV in the burst spectra fitting. In short, for the persistent emission spectra fitting of LE and ME, the energy bands are limited to 2–10 keV and 10–20 keV; for the burst spectra fitting of LE, ME and HE, the energy bands used are 1–10 keV and 8–30 keV and 25–50 keV respectively.
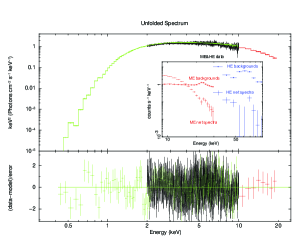
During fittings of the persistent emission, the LE data in 2–10 keV and ME data in 10–20 keV are used, while the ME data 20 keV and the HE spectra are not used to fit because of faint source flux and strong background. As shown in Fig. 2, the persistent emission detected by ME in 20–30 keV and HE in 25–100 keV is very weak compared with the background. Most of these spectral channels are close to or fainter than the systematic uncertainty of the background (1%); e.g., for the count rate detected by HE in 30–50 keV, the background of 120 cts/s is comparable to the detected count rate of 123 cts/s. Thus the persistent emission has a count rate of 3 cts/s which is close to the systematic uncertainty of the estimated background. In addition, we added a systematic uncertainty of 1% to the Insight-HXMT spectra in 1–100 keV, to account for systematic uncertainties in the detector calibrations (Li et al., 2020).
2.2 NICER
On 2020 August 8, within the same day when Insight-HXMT detected the burst from 4U 1608–52, NICER also observed the same source. The OBSID is 3657026501, with a good time interval 2 ks and a count rate 900 cts/s in the 0.3–12 keV band. However, the NICER missed the type-I X-ray burst because of an observation gap.
The NICER data are reduced using the pipeline tool nicerl2333https://heasarc.gsfc.nasa.gov/docs/nicer/nicer_analysis.html in NICERDAS v7a with the standard NICER filtering and using ftool XSELECT to extract lightcurves and spcectra. The background is estimated using the tool nibackgen3C50 (Remillard et al., 2022). The Focal Plane Module (FPM) No. 14 and 34 are removed from the analysis because of increased detector noise. The response matrix files (RMFs) and ancillary response files (ARFs) are generated with the ftool nicerrmf and nicerarf. The spectra are rebinned by ftool ftgrouppha (Kaastra & Bleeker, 2016) optimal binning algorithm and plus minimum of 25 counts per grouped bin. Other rebin method, e.g., minimum of 100 counts per grouped bin by ftool grppha, are adapted. As expected, the fit results are consistent with each other within parameter’s error bar.
For the ISM absorption, we use tbabs in the spectral model and wilm abundances (Wilms et al., 2000). To erase the residuals 1 keV, three absorption edges are added in spectra fitting: 0.56 keV, 0.71 keV, and 0.87 keV. We added a systematic uncertainty of 1% to the NICER spectra.
From NICER and Insight-HXMT lightcurves, the none-burst/persistent emission is stable in our observations. We jointly fit the persistent spectra observed with NICER and Insight-HMXT, as shown in Fig. 2. The joint fit of the spectra covers an energy band of 0.4–10 keV, 2–10 keV and 10–20 keV for NICER, LE and ME, respectively.
The spectra are fitted with XSPEC v12.11.1 and the model parameters are estimated with a 68% confidence level (1 ).
3 Analysis and Results
3.1 None-burst/persistent emission detected by NICER and Insight-HXMT
The jointed NICER and Insight-HXMT data in a broader energy range 0.4–20 keV, give us an opportunity to utilize a more physics meaningful model to fit the persistent emission, rather than the simplified models, i.e., a simple photon power law, a power law with high energy exponential rolloff (cutoffpl in xspec) and a broken power law (bknpow in xspec). We fit the joint of NICER and Insight-HXMT (LE and ME) spectrum with an absorbed convolution thermal Comptonization model (with an input seed photon spectrum diskbb), available as thcomp (a more accurate version of nthcomp) (Zdziarski et al., 2021) in XSPEC, which is described by the optical depth , electron temperature , scattered/covering fraction .
The hydrogen column (tbabs in XSPEC) accounts for both the line of sight column density and as well any intrinsic absorption near the source. The seed photons are in a shape of diskbb, since the thcomp model is a convolution model and the fraction of Comptonization photons is also given in the model.
Normalization constants are included during fittings to take into account the inter-calibrations of the instruments. We keep the normalization factor of the LE data with respect to the ME and NICER data to unity.
Using the model above, we find an acceptable fit:=0.95 (d.o.f. 846; Fig. 2 and Table 3), with the inner disc radius and scattered/covering fraction are found to be km (with distance 4 kpc and inclination angel 40 degree) and , respectively. The derived hydrogen column density is 1.3, which agrees with values previously reported in a range of 0.9–1.5 (PenninxW et al., 1989; Armas Padilla et al., 2017). The thcomp parameters, and are well consistent with a previous outburst in soft state of 4U 1608–52 (Armas Padilla et al., 2017), which derived the parameters were derived with the nthcomp model. The inferred bolometric flux in 1–100 keV is . The constant of ME and NICER is 0.930.02 and 1.050.01 respectively.
Using model of cons*tbabs*(diskbb+nthcomp) to fit the spectra, i.e., non-convolutional Comptonization model, we get a similar results for both the corona and the disk temperatures but with a smaller normalization of the disk. The shortage of the disk normalization than the convolution model is corresponding to the missing part of the disk emission which is supposed to be scattered in the corona.
Another assumption that the seed photons of the Comptonization are from the NS surface, i.e., the diskbb component is substituted by a blackbody component in the aforementioned convolution model, is also attempted. Taking this approach, spectral fits yield a roughly same thcomp parameters but with =1.12 (the same d.o.f.) and soft residuals 2 keV. Furthermore, the derived blackbody radius is km, which is far greater than the NS radius. A hybrid model (Armas Padilla et al., 2017), i.e., three-component model (diskbb+thcomp*bb or bb+thcomp*diskbb) is not attempted, since the above two-component model is able to fit the data.
Since there are no iron emission line or reflection bump above 10 keV, no reflection model are used for the spectrum fitting.
3.2 Burst lightcurves by Insight-HXMT
We show the LE/ME/HE lightcurves in Fig. 1 with a time resolution of 0.1 s. The burst profiles exhibit a typically fast rise and slow (exponential) decay in the soft X-ray band, and manifest a plateau in soft X-ray band (LE) and two peaks in hard X-ray band (ME&HE), which is a typical characteristic of a PRE burst.
In the middle of the PRE phase with a constant luminosity , the burst emission has the lowest blackbody temperature, which could cause a dip in the HE lightcurves. However, interestingly, there is a peak/excess in the HE lightcurves. For the highest 6 points in HE lightcurves in its whole energy band (20–250 keV), the hard excess is 222.339.3 cts/s with 5.6 detection; meanwhile, the burst emission for HE (for a blackbody with a temperature of 2.0 keV and a bolometric flux of an Eddington luminosity) should be less than 35 cts/s in this energy band. The hard excess in 30–50 keV is 71.518.0 cts/s with 4 detection; meanwhile, the burst emission should be negligible with 0.1 cts/s in this energy band.
This hard X-ray excess in the lightcurve suggests that there is another provenance except for the burst, which is also visible during the burst spectra analysis below.
3.3 Broad-band spectra of burst emission by Insight-HXMT
When we fit the burst spectra, we estimate the background using the emission before the burst, i.e., assuming the persistent emission is unchanged during the burst. To account for the effective area calibration deviation, a constant is added to the model. At the first attempt, for LE, the constant is fixed to 1, the others are variable during spectra fitting. The fits indicate that most of the constants of HE and some of the constant of ME are not convergent, owing to the low-significance data. Under this situation, the constant of ME&HE is fixed at 1 for the combined-spectra fitting.
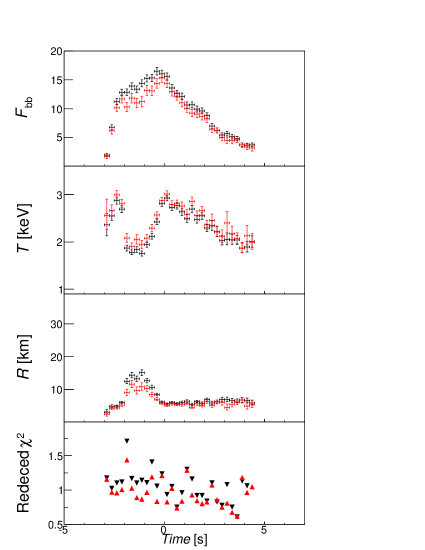
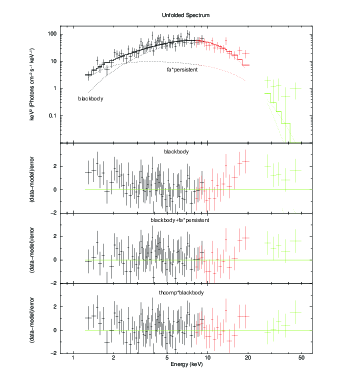
We follow the classical approach to X-ray burst spectroscopy by subtracting the persistent spectrum and fitting the net spectrum with an absorbed blackbody. In the decay phase, such a spectral model generally results in an acceptable goodness-of-fit, with a mean reduced 1.0 (d.o.f. 20–60). However, we note that a significant residuals are shown below 3 keV and above 10 keV, as shown in the left panel of Fig. 4, especially the spectra in the PRE phase, the reduced are above 1.5 (d.o.f. 60–80).
To erase the residuals, we first consider the model. Following Worpel et al. (2013) we then include an addition component for fitting the variable persistent emission. We assume that during the burst the spectral shape of the persistent emission is unchanged, and only its normalization (known as a factor) is changeable. As reported earlier by RXTE and NICER, the model provides a better fit than the conventional one (absorbed blackbody). We compare the above two models using the F-test. In some cases, the model significantly improves the fits with a p-value .
As shown in left panel of Figure 3, the spectral fitting results from these two models have differences mainly around the PRE phase. By considering an additional factor , the burst blackbody flux tends to slightly decrease, and the temperature becomes higher but the radius shrinks. The factor reaches a maximum of when the radius reaches its peak. During the PRE phase, the radius is up to km, which is two times larger than the radius measured at touch-down time km (assuming a distance of 4 kpc). This is typical to a moderate photospheric expansion with a bolometric burst peak flux in 0.1–100 keV.
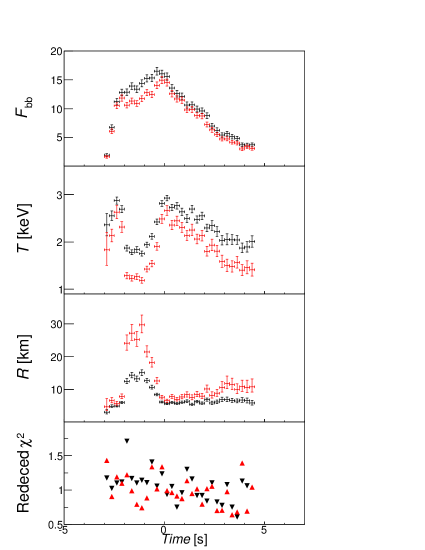
Since the burst photons could also be affected by the corona/boundary-layer, we thus check if the model used in the persistent emission could be same with the burst emission. By taking the pre-burst emission as background emission, the burst spectra are fitted by the model tbabs*thcomp*bb, in which the thcomp parameters are fixed at the persistent emission fit results. Thus convolution thermal Comptonization model (with an input seed photon spectra blackbody) has the same d.o.f with the canonical blackbody model, and a more d.o.f. than the model. The bb and thcomp represents the burst emission from the NS photosphere and a corona/boundary-layer influence on the burst emission. This model allows us to evaluate the contribution from both the up-scattered by the corona/boundayr-layer and direct photons from the NS surface.
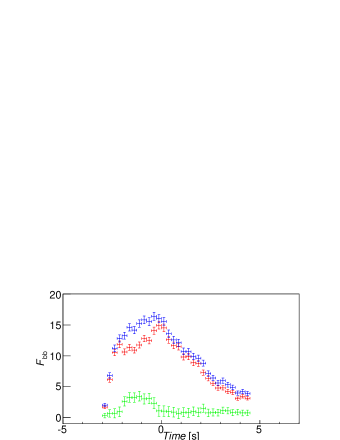
In the PPE phase, this model provides the best fit and yields physically acceptable spectral parameters; the obtained best-fit parameters are given in the right panel of Fig. 3. We find that this convolved thermal-Comptonization model provides an equally good results with model but with a more d.o.f., and statistically preferred to the model in the middle of PRE phase (with a coolest blackbody temperature). However, in the rising and decay part, such model has a bigger reduced than the model and even the canonical blackbody model, which may indicates that the burst emission suffers few Comptonization during this phase.
As mentioned above, the free/unfixed parameters include the blackbody temperature and the normalization . The trend of the parameters are similar with the model, but with a greater change. Compared to the model results, the maximum radius is up to km, the minimum temperature is low to keV.
Other scenarios, i.e., burst reflection by the disk, NS atmosphere model carbatm/hatm (Suleimanov et al., 2011, 2012, 2018) in Xspec, are also tried to fit the burst spectra, as we did in Chen et al. (2019). However, neither could alleviate the residuals at soft X-ray and hard X-ray bands simultaneously.
For the hard X-ray excess detected in the lightcurve during the PRE phase, we calculate and find that the persistent emission has not enough flux to build the enhancement. We fake the HE spectra using the aforementioned model parameters of the persistent emission, the HE flux of the persistent emission model in 20–250 keV and 30–50 keV is 3 cts/s and 0.7 cts/s. Taking into the factor account, this model predicted enhancement flux only equivalent to one tens of the hard excess. The spectra residuals in hard X-ray band are also visible in the middle panel of Fig. 4 ( model to fit the burst spectra in the PRE phase). The hard X-ray excess also disfavours the reflection model because of the faint persistent emission in hard X-ray band.
4 Discussion
In this work, we have presented a spectral analysis of a PRE burst and persistent emission from 4U 1608–52 in its 2020 outburst observed by NICER and Insight-HXMT. The persistent emission is well fitted by an absorbed convolution thermal-Comptonization model, in which 77% disk emission is up-scattered by the corona/boundary-layer. The X-ray burst shows a significant spectral deviation/excess both at 3 keV and 10 keV from an absorpted blackbody in the PRE phase. This excess is consistent with that the burst emission is up-scattered by the corona/boundary-layer, only part of the burst emission without Comptonization is detected, which mimics the Comptonization of the disk emission in the persistent emission.
4.1 X-ray continuum
Based on LE&ME lightcurves and spectral fitting results, the burst locates at the high/soft state (banana state). Previous works have attempt to fit the spectra with thermal (diskbb or/and blackbody) plus a Comptonization model, rather than a convolution thermal-Comptonization model, which will cause an underestimation of the thermal emission. In this work, adapting thermal-Comptonization model thcomp in XSPEC, the fit results indicate that most of the disk emission is involved in Compton upscattering.
Broadly speaking, in an accreting low-magnetic field NS, except for the emission from the NS surface, there are at least two geometrically distinct regions to generate X-ray emission (see the review by Done et al., 2007): in the accretion disc and the boundary/spreading layer (BL/SL) (similar to the corona of the case of an accreting black hole). BL is supposed to spread in large radial extent in the disc midplane; whereas SL has a narrower spread but spreads over a considerable height from the equatorial plane toward higher stellar latitudes. There are claimed judgment criteria for BL and SL based on temporal (Gilfanov et al., 2003) and spectral (Grebenev & Sunyaev, 2002; Suleimanov & Poutanen, 2006) characteristics.
In the burst review, during the decay part of the burst, the burst emission is well fitted by a blackbody and no strong comptonization/up-scattered emission detected. Thus the hot electrons plasma should not have a significant coverage for the NS surface. Add that into the consideration with a big scattering factor 0.77 (the hot electrons plasma on the disk in the persistent emission), the corona-like geometry of the BL is favoured.
We find that the persistent emission is 4.8% and the corona/boundary-layer temperature is 3.02 keV, which is in the range of Comptonizing temperature expected for NS LMXBs in the soft state (Armas Padilla et al., 2017). Meanwhile, the scattering factor is 0.77, which is too large for the corona/boundary-layer with a lamp-post geometry. Given those above, we prefer the corona/boundary-layer with a slab/sandwich geometry, as shown in Figure 7. Regarding that the temperature and optical depth deviates from the corona canonical value, we also prefer anther corona pattern–a so-called warm layer (Zhang et al., 2000) with temperature 2–3 keV and optical depth 5–10, which is produced by the magnetic reconnection. The outburst spectral evolution and its understandings will be given in our forthcoming paper.
4.2 Enhanced Persistent Emission up to 50 keV
In several bursters, during the low/hard state, decrease/deficit in the hard X-ray band (30–50 keV) have been observed in short-duration bursts which happened in the low-hard state (Chen et al., 2012 and reference therein). It is expected that the burst emission (2–3 keV), which is relatively cooler than the corona (tens keV), cause the change in the corona structure or temperature.
In this work, conversely, an enhancement hard X-ray emission are observed during a short-duration burst, which is first reported in GS 1826–238 by BeppoSAX in 30–60 keV (in’t Zand et al., 1999). However, these two sets of bursts located different spectral state of LMXBs. In both cases, the soft X-ray showers of the burst may manifest as an enhancement of the input seed photons but not a sufficient cooler upon the corona.
Compared with the disk component of the persistent emission, the count rate of the burst at the PRE phase is 4 times more. The emergent photons of the burst could be up-scattered to higher energy by the corona/boundary-layer. For the comptonization of the burst during PRE phase, i.e., a blackbody with temperature 1.22 keV and normalization 1.33, and a hot corona with temperature of 3 keV, optical depth 10.2 and cover-factor 0.76, we fake a spectrum induced by the inverse Compton scattering of the blackbody emission and get a count rate 289 cts/s in the energy band of 30–50 keV. Thus, the up-scattered photons of the burst do cause an enhancement hard X-ray emission.
Based on the burst spectra fit results, the enhancement hard X-ray emission could be related to the up-scattered burst emission by the corona/boundary-layer, just like the situation in the persistent emission, rather than enhancement accretion rate manifesting itself by elevating persistent emission with unaltered spectral shape (Worpel et al., 2013, 2015).
4.3 Dynamical evolution of the disk geometry
As a common sense, the burst emission has an increasing and decreasing area during its rise and decay phase, which corresponding the hot spot spreading in the NS surface. Meanwhile, there are at least two moments when the hot spot covers that whole NS surface, the photoshphere lift-up point and the touch-down point for the PRE burst. As shown in Figure 1 of Shaposhnikov et al. (2003), the hot-spot spreads on the NS surface and then lifts up the photonsphere, i.e., from ’a’ stage to ’b’ stage in the Figure. There should be a moment that hot spot covers that whole NS surface in the rise phase and vice versa in the decay phase. However, there are some PRE bursts with a short increase time, i.e., that the increase time is too short for telescope to accumulating enough counts in the first moment when the hot spot covers that whole NS surface.
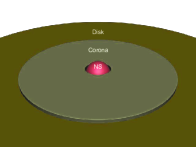
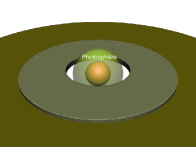
In practice, the latter is usually used to derive the NS radius. As shown in Figure 5, at the touch-down point, the burst emission reaches its peak flux, both for the model and convolution thermal-Comptonization model. A dynamical evolution of the disk geometry could cause this phenomenon, i.e., the lower NS hemisphere, which is obscured before the burst (the burst PRE phase), appears from the disk after the burst-disk interaction, as shown in Figure 1 of Shaposhnikov et al. (2003) and Figure 7 in this work.
In theory, Poynting-Robertson drag could drain the inner-accretion-disk by taking away the momentum of the accretion matter hence enlarging the local accretion rate (in’t Zand et al., 2013; Worpel et al., 2013, 2015), which is faster than it is being refilled (Stahl et al., 2013; Fragile et al., 2020). At this moment, the inner part of the disk is hollowed out by the burst emission.
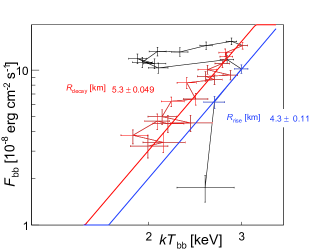
The flux-temperature diagram of the burst also indicates that the inner disk radius change causes a bigger visible part of the NS surface. If the whole NS surface shows up as a single-temperature blackbody and a constant color correction factor, the burst flux should scale as in the flux-temperature diagram, and the slope represents the emitting area in the double logarithmic coordinates (Gver et al., 2012). As shown in Figure 6, the rising phase and decaying phase obey different . We fit the two sets with , the blackbody radius of the rising and decaying phase is 4.30.11 km and 5.30.05 km with kpc.
Assuming the NS radiates at the Eddington limit in the PRE phase and the disk reaches the NS surface before the PRE phase, the blackbody flux ratio detected at the rising phase and decaying phase is positively associated with inclination angel , i.e., (Shaposhnikov et al., 2003; Shaposhnikov & Titarchuk, 2004). The inclination angel is estimated as 70∘. However, this result is bigger than the value 30∘–40∘ derived from the spectral fit results on an outburst of 4U 1608–52 by a reflection model (Degenaar et al., 2015).
4.4 Corona/boundary-layer reacting on burst
The interaction between the burst and inhabited persistent emission was first studied from the long-duration, brightest and most vigorous PRE bursts with moderate/super expansions in 4U 1820–30 and 4U 1636–536 (Ballantyne & Strohmayer, 2004; Keek et al., 2014) (a factor of 10–104 increases in emission area). Then in short-duration bursts, this interaction was mainly observed as the persistent spectral change, rather than the burst spectral change, i.e., enhancement accretion rate, deficit at hard X-ray band, reflection by the disk and driven outflow.
Type-I X-ray burst happens on the NS surface, which is also in the accretion environment. In principle, the burst spectrum may be influenced due to the Comptonization of the burst photons by the surrounding corona/boundary-layer (Chen et al., 2019). A Comptt component was reported in bursts of 4U 1608–52 from RXTE observations above 3 keV (Kajava et al., 2017). However, their approach resembled the model since the Comptt component is added in the spectra fitting. In this work, the persistent emission is well fitted by a convolution thermal-Comptonization model. As a result, given the similarity, for the burst, adapting the convolution model with the parameters in the persistent emission fitting but with a blackbody emission, this could also fit the short-duration burst spectra in the PRE phase. The goodness of the fit are comparable with the model, but with a colder and larger in the middle of the PRE phase. If this is the case, the radius of the photosphere is underestimated with the canonical blackbody model or the model.
In principle, the interaction between burst and accretion environment, might be expected to have spectral evolution for both of the burst emission and accretion emission during burst, with spectral shape deviation from pure blackbody and the model of the pre-burst emission. The short duration and rapid spectral change limits the accumulated time and photon counts, which in turn requires larger detection area and broad band energy coverage which may be satisfied by the next generation of Chinese mission of so-called eXTP (enhanced X-ray Timing and Polarimetry mission) (Zhang et al., 2019) or a contemporary joint observation of the burst by NICER and Insight-HXMT.
References
- Armas Padilla et al. [2017] Armas Padilla, M., Ueda, Y., Hori, T., Shidatsu, M., Munoz-Darias, T., 2017, MNRAS, 467, 290
- Ballantyne & Strohmayer [2004] Ballantyne, D. R., & Strohmayer, T. E. 2004, ApJL, 602, L105
- Bhattacharyya et al. [2018] Bhattacharyya, S. Yadav, J. S., Sridhar, Navin, et al. 2018, ApJ, 860, 88
- Belian et al. [1976] Belian, R. D., Conner, J. P., & Evans, W. D. 1976, ApJ, 206, L135
- Chen et al. [2012] Chen, Y. P., Zhang, S., Zhang, S. N., et al. 2012, ApJL, 752, 34
- Chen et al. [2018] Chen, Y. P., Zhang, S., Qu, J. L., Zhang, S. N., et al. 2018, ApJL, 864, 30
- Chen et al. [2019] Chen, Y. P., Zhang, S., Zhang, S. N., et al. 2019, Journal of High Energy Astrophysics, 24, 23
- Cumming [2004] Cumming, A. 2004, Nucl. Phys. B Proc. Suppl., 132, 435
- Degenaar et al. [2015] Degenaar, N., Miller, J. M., Chakrabarty, D., Harrison, F. A., Kara, E., & Fabian, A. C. 2015, MNRAS, 451, L85
- Degenaar et al. [2018] Degenaar, N., Ballantyne, D. R., Belloni, T., et al. 2018, SSRv, 214, 15
- Done et al. [2007] Done, C., Gierliński, M., Kubota, A. 2007, A&AR, 15, 1
- Fragile et al. [2020] Fragile, P. C., Ballantyne, D. R., & Blankenship, A. 2020, NatAs, 4, 541
- Galloway et al. [2008] Galloway, D. K., Muno, M. P., Hartman, J. M., et al. 2008, ApJS, 179, 360
- Galloway et al. [2020] Galloway, D. K., In’t Zand, J., Chenevez, J., et al. 2020, ApJS, 249, 32
- Gver et al. [2012] Gver, T., Psaltis, D., & Zel, F. 2012, ApJ, 747, 76
- Gilfanov et al. [2003] Gilfanov, M.; Revnivtsev, M.; Molkov, S.Gilfanov et al. 2003, A&A, 410, 217
- Grebenev & Sunyaev [2002] Grebenev, S. A., & Sunyaev, R. A. 2002, AstL, 28, 150
- in’t Zand et al. [1999] in’t Zand, J. J. M., Heise, J., Kuulkers, E., et al. 1999, A&A, 347, 891
- in’t Zand et al. [2013] in’t Zand, J. J. M., Galloway, D. K., Marshall, H. L., et al. 2013, A&A,553, A83
- Ji et al. [2013] Ji, L., Zhang, S., Chen, Y. P., et al. 2013, MNRAS, 432, 2773
- Kaastra & Bleeker [2016] Kaastra, J. S.; Bleeker, J. A. M. 2016, A&A, 587, A151
- Kajava et al. [2017] Kajava, J. J. E., Koljonen, K. I. I., Nttil, J., Suleimanov, V., & Poutanen, J. 2017, MNRAS, 472, 78
- Keek et al. [2014] Keek, L., Ballantyne, D. R., Kuulkers, E., & Strohmayer, T. E. 2014b, ApJL, 797, L23
- Keek et al. [2018] Keek, L., Arzoumanian, Z., Bult, P., et al. 2018, ApJL, 855,4
- Keek et al. [2018a] Keek, L., Arzoumanian, Z., Chakrabarty, D., et al. 2018, ApJL, 856,37
- Lewin et al. [1993] Lewin, W. H. G., van Paradijs, J., & Taam, R. E. 1993, Space Sci. Rev., 62, 223
- Li et al. [2020] Li, X. B., Li, X. F., Tan, Y. et al. 2020, JHEA, 27, 64
- Muno et al. [2001] Muno, M. P., Chakrabarty, D., Galloway, D. K., & Savov, P. 2001, ApJ, 553, L157
- PenninxW et al. [1989] PenninxW., Damen E., van Paradijs J., Tan J., Lewin W. H. G., 1989, A&A, 208, 146
- Poutanen et al. [2014] Poutanen, J., Nttil, J., Kajava, J. J. E. et al. 2014, MNRAS, 442, 3777
- Sánchez-Fernández et al. [2020] Sánchez-Fernández C., Kajava J. J. E., Poutanen J., et al., 2020, A&A, 634, A58
- Remillard et al. [2022] Remillard, R. A., Loewenstein, M., Steiner, J. F. et al. 2022, AJ, 163, 130
- Suleimanov & Poutanen [2006] Suleimanov, V., & Poutanen, J. 2006, MNRAS, 369, 2036
- Shaposhnikov et al. [2003] Shaposhnikov, N., Titarchuk, L., Haberl, F., 2003, ApJL, 593, L35
- Shaposhnikov & Titarchuk [2004] Shaposhnikov, N., & Titarchuk, L. 2004, ApJ, 606, L57
- Stahl et al. [2013] Stahl, A., Kluniak, W., Wielgus, M., & Abramowicz, M. 2013, A&A, 555, A114
- Strohmayer & Bildsten [2006] Strohmayer, T., & Bildsten, L. 2006, New views of thermonuclear bursts (Compact stellar X-ray sources), 113, 156
- Suleimanov et al. [2011] Suleimanov, V., Poutanen, J., Werner, K. 2011, A&A, 527, A139
- Suleimanov et al. [2012] Suleimanov, V., Poutanen, J., Werner, K. 2012, A&A, 545, A120
- Suleimanov et al. [2018] Suleimanov, V., Poutanen, J., Werner, K. 2018, A&A, 619, A114
- Wilms et al. [2000] Wilms, J., Allen, A., & McCray, R. 2000, ApJ, 542, 914
- Worpel et al. [2013] Worpel, H., Galloway, D. K., & Price, D. J. 2013, ApJ, 772, 94
- Worpel et al. [2015] Worpel, H., Galloway, D. K., & Price, D. J. 2015, ApJ, 801, 60
- Zhang et al. [2000] Zhang, S. N., et al., 2000, Science, 287, 1239
- Zhang et al. [2014] Zhang, S., L,u F. J., Zhang, S. N. et al. in Space Telescopes and Instrumentation 2014: Ultraviolet to Gamma Ray, Proc. SPIE, Vol. 9144 (2014) p. 914421
- Zhang et al. [2019] Zhang, S. N., Santangelo, A., Feroci, M., et al. 2019, Science China Physics, Mechanics & Astronomy, Volume 62, Issue 2, article id. 29502, 25
- Zhang et al. [2020] Zhang, S.-N., Li, T.-P., Lu, F.-J., et al. 2020, SCPMA, 63, 249502
- Zdziarski et al. [2021] Zdziarski, A. A., Szanecki, M., Poutanen, J., Gierlinski, M., & Biernacki, P. 2021, MNRAS, 492, 5234
| obsid | Start Time | Elapsed Time (s) | LE GTI (s) | ME GTI (s) | Burst peak time (MJD) |
|---|---|---|---|---|---|
| P030402100401∗ | 59069.63746 (2020-08-08T15:16:50) | 14708 | 2480 | 3750 | 59069.77077 |
| P030402100602 | 59079.83751 (2020-08-18T20:04:55) | 11617 | 120 | 480 | 59079.85655 |
-
This work.
-
Note:
Both bursts are detected by the three payloads of Insight-HXMT. However, the second bursts, which is only half bright as the first one, did not located the good-time-interval.
| obsid | Start Time | Elapsed Time (s) | GTI (s) |
|---|---|---|---|
| 3657026501 | 59069.61551 (2020-08-08T14:43:40) | 3600 | 1707 |
| keV | keV | |||||
| 802/846 |