Broadened profiles of Diffuse Interstellar Bands
Abstract
The paper describes profile broadening and peak wavelength variation of diffuse interstellar bands (DIBs) measured for 46 lines of sight, probably caused by physical properties of intervening clouds. Full width at half maximum of four studied diffuse bands (5780, 5797, 6196 and 6614 Å) demonstrate strong variability sometimes doubling the features’ width. Despite the high magnitude of the effect, our current analysis is restricted to the strongest diffuse bands because the weaker ones require a much higher S/N ratio. The profile broadening in the studied DIBs moves the profile’s centers towards longer wavelengths, probably due to the excitation of higher levels of the P branch of the unknown molecular carrier. Moreover, diffuse bands are broader in clouds with abundantly populated vibrationally excited states of the hydrogen molecules, i.e. DIB’s broadening correlates with the rotational temperature estimated on H2 =2 vibrational level. However, objects demonstrating extremely broadened profiles of DIBs are scarce. The extreme peculiarity of DIBs’ profiles was detected in Herschel 36. Here we show the gradual growths of the widths of diffuse bands, confirmed in spectra from different instruments.
keywords:
ISM: atoms – lines and bands1 Introduction
The paper concerns physics and chemistry of the interstellar medium (ISM) —which consists of several components: gas atoms, molecules, dust grains. Overall it addresses a scientifically very challenging issue of identifying (very likely molecular) carriers of the puzzling spectral features known, since nearly 100 years, as diffuse interstellar bands (DIBs). See Krełowski (2018) for a recent review. The only almost confirmed carrier of a few near infrared diffuse bands is fullerene C (Campbell et al. 2015) but the variability of the intensity ratio of features, assigned to this molecule, is still waiting for an explanation (Galazutdinov et al. (2017, 2020); Galazutdinov & Krełowski 2017).
DIBs are believed to be carried by complex chemical species, including prebiotic ones, synthesized and preserved in the hostile conditions of translucent interstellar clouds. The idea of their molecular origin is supported by presence of substructures inside DIB profiles, discovered by Sarre et al. (1995) and by Kerr et al. (1998); for weak diffuse bands see Galazutdinov, LoCurto & Krełowski (2008); for broad diffuse bands see Galazutdinov et al. (2020). A vast majority of DIBs are narrow, though much broader than atomic lines, shallow features and thus an analysis of their profile shapes requires a very high resolution and S/N ratio. High precision DIB profiles may play a decisive role in the carrier’s identification. However, the studied line of sight must demonstrate the lack of Doppler splitting in lines of interstellar atoms and simple radicals to secure the intrinsic profile of a diffuse band. There are more than 200 molecular species discovered (mostly in radio) due to rotational transitions; a vast majority of them being carbon–bearing (organic) ones. The list of DIBs, seen in absorption, reaches now 560 entries (Fan et al., 2019).
Experiments show that spectra of suspected molecules contain usually one strong and several weak features. It is very challenging to relate weak DIBs to the strong ones and thus to divide them into “families”, likely sharing the same carrier. Their profiles can vary with temperature (kinetic and rotational) in the way characteristic to a given species. Changes of profiles may lead to different central wavelengths. It is important to relate DIB profiles (their widths, substructure patterns and intensities) to relative abundances of CH, CH+, CN and rotational temperatures of the C2 and C3 molecular species; perhaps also to that of the CN. Diffuse bands carriers are not known, thus any relation with other measurable interstellar parameters/features may give a clue about the origin of these features.
The results published during the last two decades (e.g. Krełowski & Greenberg (1999), Galazutdinov et al. (2006), Galazutdinov, LoCurto & Krełowski (2008), and Krełowski et al. (2015)) demonstrate red- and blue-shifts of some DIBs in relation to atomic lines (i.e. not caused by the Doppler effect) as well as changes of their profiles, which vary from one to another specific environment. This was already supported by finding a relation between rotational temperatures of simplest carbon chains and profile shape of the 6196 DIB (Kaźmierczak et al., 2009).
In Kaźmierczak et al. (2010) authors reported that width and shape of 6196 and 5797 Å DIB profiles depend on the gas kinetic and rotational temperatures of C2 molecule; the profiles are broader because of the higher values of temperature. However, this phenomena is not common for all DIBs: e.g. 4964 and 5850 Å features do not exhibit detectable broadening.
In a vast majority of cases one can observe reddened stars through several clouds threaded on their sightlines. This leads to ill–defined averages which closely resemble each other. On the other hand, if a star is seen through a single cloud, its interstellar spectrum looks “peculiar”. Such spectra are especially interesting as they are apparently formed in a specific volume, i.e. in reasonably homogeneous physical conditions. This concerns e.g. the above mentioned wavelength shifts. The latter are especially evident in the unique object —Herschel 36 (Dahlstrom et al., 2013; Oka et al., 2013). DIBs in its spectrum exhibit extremely uncommon profiles, in particular showing extended red wings. Identified interstellar lines, as shown by Dahlstrom et al., are sharp and free of Doppler splitting. Several DIB profiles, observed along the specific sightline (to Herschel 36), show unusually broadened profiles (e.g. the major 5780 DIB).
The presence of substructures in profiles of diffuse bands is the common property which can be useful for identifying their origin by comparing astrophysical data with laboratory gas phase spectra, as for example the carbon chains or Polycyclic Aromatic Hydrocarbons —PAHs (Salama et al., 1999; Motylewski et al., 2000).
It is important to check the behaviour of identified and unidentified interstellar spectral features, especially if they are observed in single clouds, where the physical conditions are as homogeneous as possible. Such sightlines should be carefully selected and confirmed by atomic/molecular lines, seen in high resolution spectra, as free of Doppler splitting.
2 Observational material
The spectra we selected do not show evident Doppler split in atomic/molecular lines of interstellar origin observed with instruments enlisted below. Usually we use the Ki 7699 Å and CH 4300 Å lines. Intensity of these lines generally demonstrate quite good correlation with those of DIBs. However, we have to emphasize that with increasing spectral resolution one can resolve additional Doppler components in atomic and/or molecular lines; in diffuse bands it becomes very difficult and in case of extinction or polarization (caused by dust grains) —impossible. Nevertheless, variability of the full width at the half maximum (FWHM) of diffuse bands reported in this study is not caused by the presence of several clouds with different radial velocities.
The observational data have been collected using several high resolution, echelle spectrographs:
-
•
UVES (Ultraviolet and Visual Echelle Spectrograph) fed by the 8m Kueyen VLT mirror (Dekker et al., 2000). The spectral resolution is up to R=80,000 in the blue range and R=110,000 in the red one. The telescope size allows to get high S/N ratio spectra of even pretty faint stars. The selected spectra have been collected in the frame of the Large Program EDIBLES (ESO Diffuse Interstellar Bands Large Exploration Survey) and our previous study (Siebenmorgen et al. 2020) where we provide online access to the analyzed UVES data.111https://vizier.u-strasbg.fr/viz-bin/VizieR?-source=J/A+A/641/A35
-
•
Some southern objects were studied with the aid of Feros - fiber fed echelle spectrograph (Kaufer et al. 1999) at the ESO’s La Silla observatory in Chile. Feros provides the resolving power R/ of 48,000 and allows to get the whole available spectral range (3700 – 9200 Å, divided into 37 orders) recorded in a single exposure.
-
•
ESPaDOnS spectrograph (Echelle SpectroPolarimetric Device for the Observation of Stars)222https://www.cfht.hawaii.edu/Instruments/Spectroscopy/Espadons/ is the bench-mounted high-resolution echelle spectrograph/spectropolarimeter) attached to the 3.58 m Canada-France-Hawaii telescope (CFHT) at Mauna Kea (Hawaii, USA). It is designed to obtain a complete optical spectrum in the range from 3,700 to 10,050 Å. The whole spectrum is divided into 40 échelle orders. The resolving power is about 68,000.
-
•
The CFHT coudé spectrograph (Gecko)333https://www.cfht.hawaii.edu/Instruments/Spectroscopy/Gecko, an echelle spectrograph optimized for use with a single spectral order from the 316 groove/mm echellette mosaic and providing resolving power / up to 120,000. Order sorting is achieved with interference filters or by one of three variable grisms. An image slicer is used to optimize the throughput of the instrument.
-
•
HARPS spectrograph (Mayor et al., 2003), fed by the 3.6m ESO telescope at La Silla observatory with resolving power R=115,000.
-
•
MIKE spectrograph (Bernstein et al. 2003) fed by the Magellan/Clay telescope. The spectral resolution with a 0.355 arcs slit ranges from 56,000 on the blue side (3600-5000 Å) to 77,000 on the red side (4800-9400 Å).
-
•
The Bohyunsan Echelle Spectrograph (BOES) of the Korean National Observatory (Kim et al., 2007) is installed at the 1.8m telescope of the Bohyunsan Observatory in Korea. The spectrograph has three observational modes allowing resolving powers of 30,000, 45,000, and 90,000. In any mode, the spectrograph covers the whole spectral range of 3500 to 10,000 Å, divided into 75 – 76 spectral orders.
-
•
The Sandiford Cassegrain Echelle Spectrometer (McCarthy et al. 1993) fed by 2.1-meter Otto Struve Telescope at McDonald Observatory (Texas, USA). The instrument has a resolving power R = 60,000 for two CCD pixels and provides continuous wavelength coverage below 8000 Å.
| star | Sp/L | V | B-V | D(Gaia) | FWHM | FWHM | FWHM | FWHM | ||||
| [mag] | [mag] | [pc] | [Å] | [km/s] | [Å] | [km/s] | [Å] | [km/s] | [Å] | [km/s] | ||
| 23180e | B1III | 3.86 | 0.02 | 330 | 5780.41 | 103 | 5797.01 | 29 | 6613.58 | 41 | 6195.97 | 19 |
| 22951u | B0.5V | 4.97 | -0.06 | 370 | 5780.39 | 102 | 5797.02 | 35 | 6613.55 | 41 | 6195.95 | 18 |
| 24263u | B3.5V | 5.77 | 0.03 | 225 | 5780.43 | 103 | 5797.05 | 35 | 6613.57 | 42 | 6195.99 | 18 |
| 24398b | B1Ib | 2.85 | 0.12 | 260 | 5780.38 | 103 | 5797.02 | 36 | 6613.56 | 42 | 6195.92 | 19 |
| 27778m | B3V | 6.34 | 0.16 | 210 | 5780.43 | 105 | 5797.01 | 34 | 6613.57 | 43 | 6195.94 | 20 |
| 30492u | B9.5V | 9.02 | 0.28 | 435 | 5780.44 | 104 | 5797.01 | 34 | 6613.57 | 42 | 6195.97 | 19 |
| 36695u | B9IV | 5.34 | -0.18 | 440 | 5780.44 | 102 | 5797.11 | 53 | 6613.63 | 52 | 6195.92 | 20 |
| 36982u | B1.5V | 8.46 | 0.11 | 410 | 5780.84 | 127 | 5797.2 | 60 | 6613.77 | 57 | 6195.98 | 27 |
| 37020e | B0V | 6.73 | 0.02 | 380 | 5780.84 | 120 | 6195.97 | 17 | ||||
| 37021e | B1V | 7.96 | 0.24 | 375 | 5781.10 | 134 | ||||||
| 37022m | O8V | 5.13 | 0.02 | 400 | 5780.88 | 118 | 6196.03 | 24 | ||||
| 37023e | B1.5V | 6.70 | 0.09 | 440 | 5780.89 | 127 | 6196.00 | 19 | ||||
| 37041u | O8V | 6.30 | -0.09 | 335 | 5780.74 | 120 | ||||||
| 37042s | O9.2Iab | 6.38 | -0.09 | 420 | 5780.65 | 116 | ||||||
| 37061e | O9V | 6.83 | 0.22 | 415 | 5780.92 | 124 | 5797.16 | 50 | 6613.96 | 74 | 6196.04 | 28 |
| 37128u | B0Ia | 1.69 | -0.18 | 330Ca | 5780.77 | 123 | 6613.87 | 63 | ||||
| 37130u | B9V | 10.10 | 0.05 | 395 | 5780.92 | 130 | 5797.12 | 46 | 6613.83 | 64 | 6195.94 | 26 |
| 37903b | B3V | 7.83 | 0.11 | 400 | 5780.92 | 130 | 5797.12 | 46 | 6613.83 | 64 | 6195.94 | 26 |
| 66194u | B3V | 5.81 | -0.09 | 405 | 5780.44 | 109 | 5797.05 | 42 | 6613.50 | 41 | 6195.93 | 20 |
| 110432u | B0.5IV | 5.31 | 0.27 | 440 | 5780.45 | 102 | 5797.02 | 34 | 6613.58 | 41 | 6195.97 | 18 |
| 110715u | B9V | 8.65 | 0.38 | 525 | 5780.34 | 103 | 5796.99 | 36 | 6613.57 | 43 | 6195.95 | 17 |
| 133518e | B2IV | 6.39 | -0.10 | 610 | 5780.45 | 102 | 5797.06 | 36 | 6613.61 | 46 | 6195.96 | 18 |
| 143275b,s | B0.3IV | 2.32 | -0.12 | 210Ca | 5780.44 | 97 | 5796.99 | 34 | 6613.65 | 52 | 6195.94 | 23 |
| 144217h | B1V | 2.62 | -0.07 | 235Ca | 5780.43 | 103 | 5797.00 | 33 | 6613.52 | 40 | 6195.94 | 20 |
| 144470b | B1V | 3.97 | -0.05 | 140 | 5780.46 | 102 | 5797.04 | 34 | 6613.59 | 45 | 6195.97 | 21 |
| 145502m | B2V | 4.00 | 0.05 | 140 | 5780.43 | 104 | 5797.03 | 36 | 6613.57 | 43 | 6195.95 | 21 |
| 147165h | B1III | 2.89 | 0.13 | 100: | 5780.50 | 106 | 5797.07 | 39 | 6613.58 | 44 | 6195.95 | 22 |
| 147888u | B3V | 6.74 | 0.31 | 125 | 5780.55 | 108 | 5797.06 | 37 | 6613.71 | 53 | 6195.97 | 24 |
| 147889h | B2.5V | 7.90 | 0.83 | 135 | 5780.64 | 113 | 5797.07 | 41 | 6613.59 | 46 | 6195.95 | 24 |
| 147932u | B5V | 7.27 | 0.32 | 125 | 5780.59 | 116 | 5797.09 | 42 | 6613.67 | 53 | 6195.94 | 22 |
| 147933e | B1V | 5.05 | 0.17 | 140 | 5780.55 | 109 | 5797.08 | 42 | 6613.64 | 51 | 6195.93 | 25 |
| 148184e | B2V | 4.43 | 0.28 | 150 | 5780.41 | 95 | 5797.08 | 43 | 6613.56 | 45 | 6195.94 | 25 |
| 148579u | B8V | 7.32 | 0.26 | 140 | 5780.57 | 111 | 5797.11 | 45 | 6613.73 | 55 | 6195.96 | 25 |
| 148605u | B3V | 4.79 | -0.07 | 125 | 5780.60 | 108 | 5797.10 | 40 | 6613.70 | 59 | 6195.94 | 21 |
| 149757e | O9.2IV | 2.56 | 0.02 | 135 | 5780.40 | 105 | 5797.01 | 36 | 6613.54 | 42 | 6195.95 | 24 |
| 154445u | B1IV | 5.61 | 0.12 | 250 | 5780.40 | 100 | 5797.03 | 35 | 6613.55 | 40 | 6195.96 | 17 |
| 163800h | O7.5III | 7.00 | 0.27 | 1310 | 5780.41 | 104 | 5797.00 | 33 | 6613.53 | 41 | 6195.94 | 18 |
| 164906u | B1IV | 7.38 | 0.23 | 1345 | 5780.44 | 105 | 5797.04 | 33 | 6613.58 | 42 | 6195.97 | 17 |
| 170634u | B6.5V | 9.85 | 0.58 | 440 | 5780.41 | 101 | 5797.03 | 43 | 6613.53 | 44 | 6195.90 | 20 |
| 170740u | B2V | 5.72 | 0.24 | 225 | 5780.45 | 102 | 5797.02 | 32 | 6613.57 | 41 | 6195.97 | 18 |
| 179406h | B2.5II | 5.34 | 0.13 | 290 | 5780.40 | 101 | 5797.02 | 31 | 6613.57 | 39 | 6195.96 | 17 |
| 184915u | B0.5III | 4.96 | -0.03 | 505 | 5780.44 | 102 | 5797.07 | 36 | 6613.57 | 40 | 6195.93 | 16 |
| 185418u | B1IV | 7.49 | 0.15 | 705 | 5780.42 | 101 | 5797.04 | 34 | 6613.57 | 41 | 6195.97 | 17 |
| 185859b | B0Iab | 6.59 | 0.37 | 1035 | 5780.42 | 105 | 5797.00 | 35 | 6613.54 | 43 | 6195.92 | 18 |
| 203532m | B3.5IV | 6.38 | 0.13 | 290 | 5780.35 | 99 | 5797.01 | 36 | 6613.56 | 44 | 6195.92 | 17 |
| 210121u | B3.5V | 7.68 | 0.16 | 335 | 5780.50 | 97 | 5797.05 | 40 | 6613.61 | 50 | 6195.96 | 22 |
| 34078b | O9.5V | 5.96 | 0.22 | 389 | 5780.45 | 109 | 5797.04 | 51 | 6613.52 | 51 | 6195.83 | 23 |
| 152218f | O9V | 7.57 | 0.21 | 1591 | 5780.36 | 105 | 5797.00 | 48 | 6613.47 | 45 | 6195.81 | 21 |
| 152076f | B0/1III | 8.90 | 0.20 | 1674 | 5780.32 | 103 | 5796.97 | 39 | 6613.47 | 46 | 6195.82 | 20 |
| 152200f | O9.7IV(n) | 8.39 | 0.10 | 1447 | 5780.36 | 106 | 5797.00 | 47 | 6613.50 | 47 | 6195.84 | 22 |
| 152233h | O6II(f) | 6.59 | 0.13 | 1436 | 5780.30 | 104 | 5796.97 | 41 | 6613.43 | 45 | 6195.81 | 20 |
| 152234f | B0.5Ia | 5.45 | 0.19 | 1823 Ca | 5780.32 | 105 | 5796.96 | 45 | 6613.47 | 46 | 6195.82 | 23 |
| 152246f | O9IV | 7.29 | 0.16 | 1886 | 5780.33 | 104 | 5796.99 | 43 | 6613.48 | 45 | 6195.83 | 21 |
| 152314f | O9IV | 7.75 | 0.22 | 1392 | 5780.33 | 108 | 5796.96 | 47 | 6613.48 | 47 | 6195.82 | 21 |
| (Å) | FWHM(km/s) | ||
|---|---|---|---|
| min | max | min | max |
| 5780.34 | 5781.10 | 95 | 134 |
| 5796.99 | 5797.20 | 29 | 60 |
| 6613.52 | 6613.96 | 39 | 74 |
| 6195.90 | 6196.04 | 16 | 28 |
We processed raw data and made measurements in the reduced spectra with our interactive analysis software DECH444http://www.gazinur.com/DECH-software.html. For the DECH data reduction, we averaged bias images for subsequent correction of all other images. The scattered light was determined as a complex shaped two-dimensional surface function, which is individually calculated for each stellar and flat-field frame by a 2D cubic-spline approximation over areas of minima between the spectral orders. Then, the pixel-to-pixel variations across the CCD were corrected by dividing all stellar frames by the averaged and normalized flat-field frame. One-dimensional stellar spectra were extracted by simple summation in the cross-dispersion direction along the width of each spectral order. The extracted spectra of the same object, observed in the same night, were averaged to achieve the highest S/N ratio. Fiducial continuum normalization was based on a cubic spline interpolation over the interactively selected anchor points.
3 Results

For our analysis we have selected 46 reddened stars with the lack of strong Doppler split in the interstellar Ki 7700 Å line and/or CH 4300 Å (Table 1). The sample includes the objects from the Orion Trapezium where narrow DIBs are broadened but very weak. Measurements of FWHM (km/s) of 5780, 5797, 6614 and 6196 diffuse bands and the midpoints of FWHM () are given in the same Table. All diffuse bands exhibit more or less significant variability of the profile widths (Table 1, 2). However, our sample is statistically significant thus the inferred relations are important.
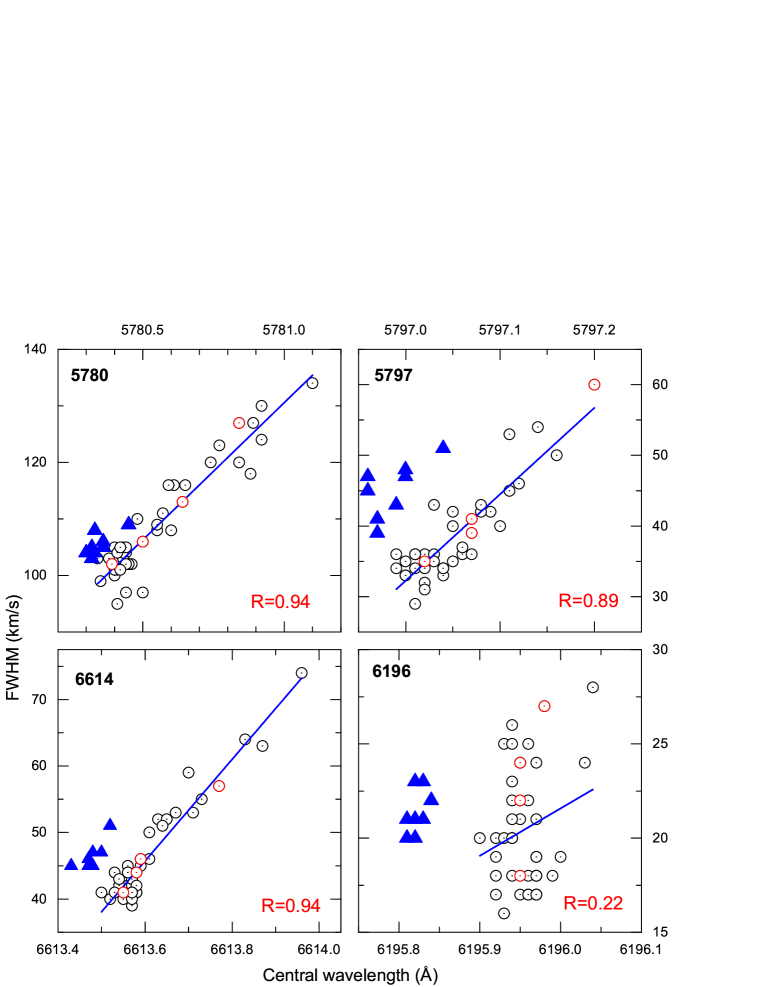
The oldest known two diffuse bands 5780 and 5797 have been demonstrated as being of different origin (Krełowski & Walker (1987), Krełowski & Westerlund (1988)). Their varying strength ratio allows to divide the interstellar clouds into and types. Some of them are shown in Fig. 1, demonstrating “peculiar” behaviour of the 5780 DIB in certain objects. The depicted ones represent extreme or types, i.e. the 5780/5797 strength ratio is very high or low. Apparently the same DIB may be narrower or broader (depending on the line of sight); since the depicted targets do not show strong Doppler split in interstellar Ki line, this must be caused by physical parameters of the intervening objects.
Among the observed objects one can see evident positive correlation between the FWHM and the depicted in Fig. 2. Three of them increase their width propagating towards longer wavelengths, probably due to the excitation of higher and higher levels of the P branch of the unknown molecular carrier. The same effect is evident for 6196 DIB too (see Fig.4) but its extended red wing in most of the cases does not reach the 50% depth of the feature (see below) and, therefore the midpoint of the FWHM is almost stationary and resulting formal correlation is low (R=0.22, see Fig. 2).
A particular problem is so called blue-shift of some diffuse bands reported for HD 34078 and several stars in Sco OB1 association (Galazutdinov et al. 2006, 2008; Krełowski et al. 2019b). The blue-shift does not resemble the red-shift effect, i.e. it is not an extension of the profile’s blue wing but is rather a displacement of the entire profile (see e.g. Fig.5 in Krełowski et al. 2019b). We suggest that blue-shift may have surprisingly simple explanation. The "interstellar" wavelength scale based on the strongest component of CH 4300 or KI 7698 line might be slightly incorrect for these objects. Indeed, all objects demonstrating the blue-shift also exhibit some weak component in the left side of their CH and/or KI profile. At the moment, there are known very few objects with evident blue-shift of DIB profiles, thus the extension of the sample is necessary for the decisive identification of the origin of the blue-shift.
Table 1 contains data of the central wavelength measured for 5780, 5797, 6614 and 6196 DIBs as well as their FWHM. This is evidently variable (see Fig. 1). Moreover, the width of 5797, 5780, and 6614 DIBs increases to the longer wavelength side what is shown in the gradual move of the to the red with increasing the width of diffuse bands.
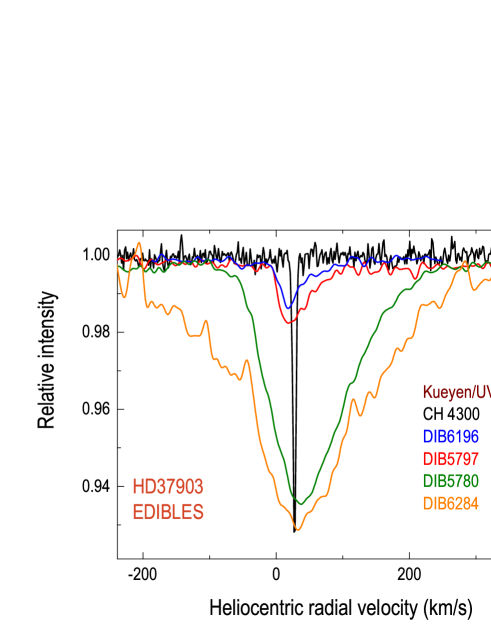
An additional effect, moving the central wavelengths of diffuse bands to the right (red-shift), is observed in some targets. An example is shown in Fig. 3. A vast majority of DIBs are very weak in the spectra of stars like HD 37903 with low or moderate reddening magnitude. Only the relatively broad DIBs, such as 5780 and 6284, remain strong; and they are also red shifted. The red-shift phenomenon is observable only in these broad DIBs. The central wavelengths of the weak narrow diffuse bands seem even to be slightly blue-shifted. Figure 3 demonstrates the DIB positions in the heliocentric radial velocity scale, compared to the interstellar CH (4300.3 Å) interstellar line.

The rest of narrow diffuse bands are most likely broadened though not shifted. However, narrow DIBs in the extreme type objects are so weak, that any conclusions concerning them must be considered as hardly reliable. A much higher S/N ratio would be of great importance.
4 Molecular hydrogen
| star | T01 [K] | T [K] | reference |
|---|---|---|---|
| HD 27778 | 555 | — | Jensen et al. (2010) |
| HD 37061 | — | 2088231 | Gnaciński (2009) |
| HD 37903 | 678 | 1779210 | Gnaciński (2011) |
| HD 147888 | 423 | 791128 | Gnaciński (2013) |
| HD 185418 | 1009 | — | Jensen et al. (2010) |
Gnaciński et al. (2016) analyzed correlation between temperature of H2 and equivalent widths of some diffuse bands normalized by the total amount of interstellar hydrogen EW(DIB)/N(H). It was shown that in most cases the EW(DIB)/N(H) and temperatures are anti-correlated. Here we are focused on the comparison of temperature of molecular hydrogen with the peak wavelength variation and broadening of diffuse bands.
The H2 absorption lines from vibrationally excited levels can be seen in some HST (Hubble Space Telescope) ultraviolet spectra. We used the temperatures of para —H2 on the =2 vibrational level, calculated using linearization of the Boltzmann equation and linear regression as described by Gnaciński (2011). These temperatures are presented in Table 3.
The cloud heliocentric radial Doppler velocities of the H2 lines agree with those of atomic Ki lines seen in the UVES spectra. Usually the Doppler velocities of simple radicals (CH, CN) coincide with those of Ki; thus we suggest that DIB carriers are occupying same volumes as the above mentioned species.
It is interesting that difference in the widths of diffuse bands are not caused by the gas kinetic temperature, which is correlated with the hydrogen T01 temperature. The latter originally defined by Spitzer, Dressler, & Upson (1964) describes the equilibrium between ortho and para-H2 and is calculated from the equation:
| (1) |
where N1 and N0 are the number of molecules per cm2 in the levels of angular momentum 1 and 0 respectively, E1 and E0 are the excitation energy of the levels J = 1 and J=0 respectively.
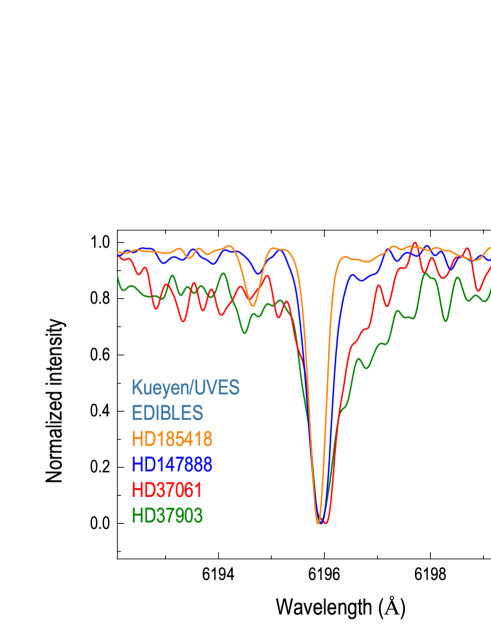
The comparison star HD 185418 that shows relatively narrow diffuse bands has the T01=100 K which is much higher than the T01 temperatures towards HD 147888 or HD 37903 (42 K and 67 K, see Tab. 3). The temperature T01 observed towards HD 27778 is only 55 K. Despite the lack of direct correlation between the DIB’s FWHM and the gas kinetic temperature in the 6196 DIB (Fig. 4), the broadening of line profile is seen mainly for stars with highest T temperatures: HD 37061 and HD 37903. In both of the above objects the 6196 DIB profile shows the extended red wing.
Two comparison stars HD 147888 and HD 185418 show nearly unbroadened profiles of the diffuse interstellar bands. Both stars have UVES and HST high dispersion spectra. We have used HST STIS (Space Telescope Imaging Spectrograph) spectra o59s01010 and o59s01020 to check the presence of H2 lines from vibrationally excited levels in the direction towards HD 147888. For another comparison star, HD 185418, we used the spectra ob2609010, ob2609020, o5c01q010 and obkr1q010. In the direction of both stars no H2 absorption lines from vibrationally excited levels were detected. The H2 is present towards both comparison stars on the ground vibrational level. The column densities of the =0 H2 rotational levels towards these stars were adopted from Jensen et al. (2010).
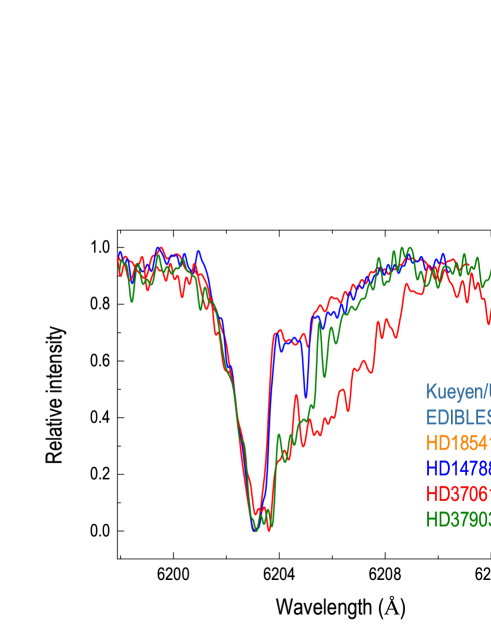
FWHM of the 5780 DIB in both comparison stars are about 100-110 km/s, i.e. smaller than that in “peculiar” targets (Tables 1, 2). Consequently, the broadening of the 6614 and 6203 DIBs (Figs. 5 and 6) is larger for HD 37061 than for HD 37903. The cloud towards HD 37061 has the highest T temperature in our sample. The direction towards HD 147888 shows no broadening of the 6203 DIB, and only slight broadening of 6614 DIB. This is consistent with lower T temperature towards this star.
5 Instrumental comparison
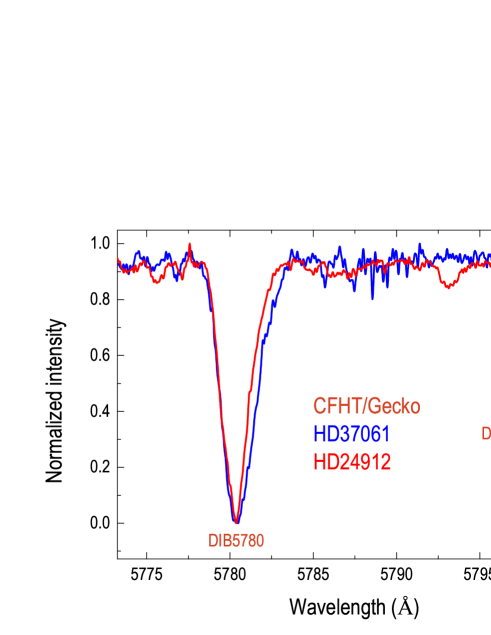
It is an important question whether the observed effects of DIB broadening are real or, perhaps, instrumental. Fortunately, we have in our database spectra of the same targets, acquired using different instruments. We compared the major DIBs: 5780 and 5797 in the spectra of HD 37061 and HD 24912, acquired using the currently decommissioned Gecko spectrograph, fed with the 3.6m CFH telescope at Hawaii. As presented on Fig. 7 the broadening of the 5780 DIB towards HD 37061 is real, independent of the spectrograph used to acquire the spectrum. Let us emphasize that Gecko, being non–echelle, does not allow to shift it’s spectra to the rest wavelength velocity frame, using some identified atomic or molecular interstellar features. Thus Fig. 7 compares only profile widths and shapes.
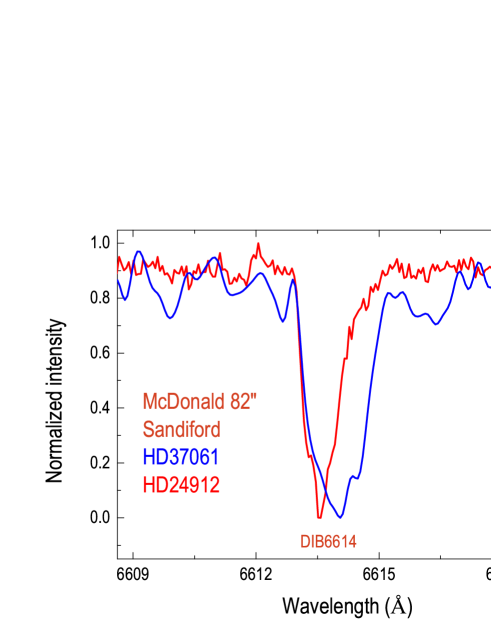
We made a similar check for the 6614 DIB. This time we used spectra from the Sandiford echelle spectrograph fed with the 82" McDonald Observatory telescope. We compared a spectrum of HD 37061 with that of HD 144217 ( cloud standard). Fig. 8 proves that the excessive widths of DIBs in HD 37061 are real, independent of the instrument used. The Sandiford echelle does not cover the whole spectral range, available to ground-based observations. In our spectrum only the Nai doublet is available. Due to its saturation the interstellar rest wavelengths scale cannot be established. Therefore Fig. 8 cannot be used for the estimation of peak wavelength variation of diffuse bands but only for comparison of width and shape of DIBs.
6 Conclusions
The 5780, 5797, 6196, 6203 and 6614 DIBs are formed along the lines of sight where vibrationally excited levels of H2 are abundantly populated which may lead to extended red wings. The broad DIBs (e.g. 5780, 6284) are also shifted to the red. The observed DIBs broadening cannot be explained by unresolved blend of many components originated in different clouds (Fig. 9);
We emphasize that the lack of correlation between FWHM and central wavelength for DIB 6196 (Fig. 2) does not imply that a broadening effect of this DIB does not exist. For example the extended red wing of DIB 6196 does in most cases not reach the 50% depth (Fig. 4). Therefore the midpoint of the FWHM of that band is almost stationary and so is the derived central wavelength despite of the evident broadening.
What really causes the broadening and red-shift of DIB profiles? The answer can not be given before comprehensive identification of the carriers of diffuse bands. There are several possible reasons causing the broadening of diffuse bands (mostly extending the red wing of the profile):
-
•
First of all, the observed profile variations of the DIBs, cannot be caused by thermal Doppler broadening because the observed broadening is not symmetric. Only the long wavelength side of the profile is extended. Also the observed broadening cannot be explained by Doppler splitting (Fig. 9);
-
•
The widths (FWHMs) of the 5780, 6196, 6203 and 6614 DIBs are broadened in clouds where the vibrationally excited levels of molecular hydrogen are populated. The widths of these DIBs are larger for directions with larger T temperatures. However, the hydrogen temperature T01 does not correlate with DIBs’ broadening while kinetic temperature of C2 does (Kaźmierczak et al., 2010). Indeed, DIB profiles may get broad, influenced by the rotational temperatures of homonuclear molecules, such as C2 as it was shown by (Kaźmierczak et al., 2009) and (Kaźmierczak et al., 2010) for 6196 and 5797 Å DIB and the gas kinetic and rotational temperatures of C2 molecule. Unfortunately the bands of C3 molecule are usually below the level of detection in our spectra and thus the possible correlation between kinetic and rotational temperatures of C3 and the width of diffuse bands cannot be studied with the available data. Oka et al. (2010) offered to consider a possible reason for broadening and red shift in terms of rotational excitation of relatively small polar molecules. Marshall, Krełowski & Sarre (2015) considered variations of DIB 6614 and offered an interpretation founded in terms of the population distribution among the rotational, vibrational and potentially low-lying electronic states of a medium-sized (NC 20) planar PAH-type molecule. Profile may depend on the presence of low-lying vibrational/vibronic states of the carrier molecule, i.e. on whether these transitions are significantly wavelength-shifted from the origin band.
-
•
H2 vibrationally excited levels are populated by fluorescence. The broadenings of DIBs may also be caused by fluorescently populated levels. An additional broader discussion was given in Krełowski et al. (2015) where the origin of the red shift, observed in two Orion B1 association stars HD37020 and HD37022 was discussed. Both targets are included in the current sample;
-
•
Another interesting idea is a connection between the behavior of profiles of DIBs and shapes of extinction curves. Red-shift and broadening in molecular electronic bands might be caused by attachment of molecules to a solid substrate (e.g. Tielens et al, 1987). In an environment, rich of dust particles, possibly some DIB carriers can also partially attach to grain surfaces, producing what we observe in broadened DIB profiles and in shapes of extinction curves.

Despite of the lack of decisive explanation of the red-shift phenomena, the observed broadening of diffuse bands can be used as an additional criterion for grouping these features into families, presumably formed by the same molecule. The use for the same purposes of red- or blue-shifts, observed in some diffuse bands, is not so straightforward because the atomic (molecular) lines serving as a reference points for the interstellar wavelength frame and, the carriers of diffuse bands may be occupying different parts of an interstellar cloud.
Acknowledgements
JK, RH and WS acknowledge the financial support of the Polish National Science Centre —the grant UMO-2017/25/B/ST9/01524 for the period 2018 – 2021. GAG acknowledges the financial support of the Ministry of Science and Higher Education of the Russian Federation under the grant 075-15-2020-780 (N13.1902.21.0039)
This research has made use of the services of the ESO Science Archive Facility and the SIMBAD database, operated at CDS, Strasbourg, France (Wanger, 2000). The H2 temperatures were derived from observations made with the NASA/ESA Hubble Space Telescope, and obtained from the Hubble Legacy Archive, which is a collaboration between the Space Telescope Science Institute (STScI/NASA), the Space Telescope European Coordinating Facility (ST-ECF/ESAC/ESA) and the Canadian Astronomy Data Centre (CADC/NRC/CSA).
Data Availability
All data used in this paper were carried out by authors and/or obtained from data archives.
References
- Bailer-Jones et al. (2018) Bailer-Jones, C. A. L., Rybizki, J., Fouesneau, M., et al., 2018, AJ, 156, 58
- Bernstein et al. (2003) Bernstein, R., Shectman, S. A., Gunnels, et al., 2003, SPIE, 4841, 1694
- Campbell et al. (2015) Campbell, E. K., Holz, M., Gerlich, D., et al. 2015, Nature, 523, 322
- Dahlstrom et al. (2013) Dahlstrom, J., York, D.G., Welty, D.E., et al., 2013, ApJ, 773, 41
- Dekker et al. (2000) Dekker, H., D’Odorico, S., Kaufer, A., et al., 2000, SPIE, 4008, 534
- Fan et al. (2019) Fan, H., Hobbs, L. M., Dahlstrom, J. A., et al., 2019, ApJ, 878, 151
- Galazutdinov et al. (2006) Galazutdinov, G. A., Manicó, G., & Krełowski, J., 2006, MNRAS, 366, 1075
- Galazutdinov, LoCurto & Krełowski (2008) Galazutdinov, G. A., LoCurto, G. & Krełowski, J., 2008, ApJ, 682, 1076
- Galazutdinov et al. (2008) Galazutdinov, G. A., LoCurto, G., Han, I., et al. 2008, PASP, 120, 178
- Galazutdinov et al. (2017) Galazutdinov G. A., Shimansky V. V., Bondar A., Valyavin G., Krełowski J., 2017, MNRAS, 465, 3956. doi:10.1093/mnras/stw2948
- Galazutdinov & Krełowski (2017) Galazutdinov G. A., Krełowski J., 2017, AcA, 67, 159. doi:10.32023/0001-5237/67.2.4
- Galazutdinov et al. (2020) Galazutdinov, G., Bondar, A., Lee, B.-C., et al., 2020, AJ, 159, 113
- Galazutdinov et al. (2021) Galazutdinov G. A., Valyavin G., Ikhsanov N. R., Krełowski J., 2021, AJ, 161, 127. doi:10.3847/1538-3881/abd4e5
- Gnaciński (2009) Gnaciński P., 2009, AcA, 59, 325
- Gnaciński (2011) Gnaciński P., 2011, A&A, 532, A122
- Gnaciński (2013) Gnaciński P., 2013, A&A, 549, A37
- Gnaciński et al. (2016) Gnaciński P., Weselak T.; Krelowski J., 2016, AcA, 66, 121
- Herbig & Soderblom (1982) Herbig, G. H. & Soderblom, D. R., 1982, ApJ, 252, 610
- Jensen et al. (2010) Jensen A.G., Snow T.P., Sonneborn G., Rachford B.L., 2010, ApJ, 711, 1236
- Josafatsson & Snow (1987) Josafatsson, K. & Snow, T. P., 1987, ApJ, 319, 436
- Kaufer et al. (1999) Kaufer, A., Stahl, O., Tubbesing, S., et al., 1999, The Messenger, 95, 8
- Kaźmierczak et al. (2009) Kaźmierczak, M., Gnaciński, P., Schmidt, M.R., et al., 2009, A&A, 498, 785
- Kaźmierczak et al. (2010) Kaźmierczak, M., Schmidt, M. R., Galazutdinov, G. A., et al. 2010, MNRAS, 408, 1590
- Kerr et al. (1998) Kerr, T.H., Hibbins, R.E., Fossey, S.J., et al., 1998, ApJ, 495, 941
- Kim et al. (2007) Kim, K.-M., Han, I., Valyavin, G. G., et al., 2007, PASP, 119, 1052
- Krełowski & Walker (1987) Krełowski, J. & Walker, G.A.H., 1987, ApJ, 312, 860
- Krełowski & Westerlund (1988) Krełowski, J. & Westerlund, B.E., 1988, A&A, 190, 339
- Krełowski & Sneden (1995) Krełowski, J. & Sneden, C., 1995, in Tielens & Snow (eds.) “The Diffuse Interstellar Bands”, Kluwer, p. 13
- Krełowski & Greenberg (1999) Krełowski, J. & Greenberg, J.M., 1999, A&A, 346, 199
- Krełowski et al. (2011) Krełowski, J., Galazutdinov, G. & Beletsky, Y., 2011, A&A, 531, 68
- Krełowski et al. (2015) Krełowski, J., Galazutdinov, G. A., Mulas, G. et al., 2015, MNRAS, 451, 3210
- Krełowski (2018) Krełowski, J., 2018, PASP, 130, 1001
- Krełowski et al. (2019a) Krełowski, J., Strobel, A., Galazutdinov, G.A., et al., 2019, MNRAS, 486, 112
- Krełowski et al. (2019b) Krełowski, J., Marić, T., Karipis, A., et al. 2019, AcA, 69, 369
- Marshall, Krełowski & Sarre (2015) Marshall C.C.M., Krelowski J. and Sarre P.J., 2015, MNRAS, 453, 3912
- Mayor et al. (2003) Mayor, M., Pepe, F., Queloz, D., et al., 2003, The Messenger 114, 20
- McCarthy et al. (1993) McCarthy, J. K., Sandiford, B. A., Boyd, et al., 1993, PASP 105, 881
- Megier et al. (2005) Megier, A., Strobel, A., Bondar, A., et al., 2005, ApJ, 634, 451
- Megier et al. (2009) Megier, A., Strobel, A., Galazutdinov, G. A., et al., 2009, A&A, 484, 381
- Motylewski et al. (2000) Motylewski, T., Linnartz, H., Vaizert, O., et al., 2000, ApJ, 531, 312
- Oka et al. (2013) Oka, T., Welty, D.E., Johnson, S., et al., 2013, ApJ, 773, 42
- Salama et al. (1999) Salama, F., Galazutdinov, G.A., Krełowski, J., et al., 1999, ApJ, 526, 265
- Salama (2008) Salama F., 2008, IAU Symp., 251, 357
- Sarre et al. (1995) Sarre, P., Miles, J.R., Kerr, T.H., et al., 1995, MNRAS, 277, L41
- Schmidt et al. (2014) Schmidt, M., Krełowski, J., Galazutdinov, G.A., et al., 2014, MNRAS, 441, 1134
- Siebenmorgen et al. (2020) Siebenmorgen R., Krelowski J., Smoker J., et al. 2020, A&A, 641, 35
- Spitzer, Dressler, & Upson (1964) Spitzer L., Dressler K., Upson W. L., 1964, PASP, 76, 387. doi:10.1086/128122
- Tielens et al. (1987) Tielens A. G. G. M., Allamandola L. J., Hollenbach D. J., et al., 1987, Astrophysics and Space Science Library, Vol. 134, Interstellar Processes, Berlin Springer-Verlag, 397
- Wanger (2000) Wanger, M., Ochsenbein, F., Egret, D., et al., 2000, A&AS, 143, 9
- Zhao et al. (2015) Zhao, D., Galazutdinov, G.A., Linnartz, H., et al., 2015, ApJ, 805, 12