CoTe2: A quantum critical Dirac metal with strong spin fluctuations
Abstract
Quantum critical points separating weak ferromagnetic and paramagnetic phases trigger many novel phenomena. Dynamical spin fluctuations not only suppress the long-range order, but can also lead to unusual transport and even superconductivity. Combining quantum criticality with topological electronic properties presents a rare and unique opportunity. Here, by means of ab initio calculations and magnetic, thermal, and transport measurements, we show that the orthorhombic CoTe2 is close to ferromagnetism, which appears suppressed by spin fluctuations. Calculations and transport measurements reveal nodal Dirac lines, making it a rare combination of proximity to quantum criticality and Dirac topology.
Introduction
In condensed matter physics, interplay between ionic, electronic, and magnetic degrees of freedom can generate many novel phenomena and quasiparticle excitations. Of particular interest have been topologically protected (i.e., by symmetry) band crossings and other electronic features. The field started with the study of topological insulators, then expanded to semimetals, first to 3D Dirac and Weyl points [1] and even to metals [2, 3, 4, 5, 6, 7, 8, 9], leading to unusual magnetotransport properties. The novel physics and rarity of these states, as well as their potential applications [10, 11, 12] have been at the forefront of recent research. This said, more often than not it is difficult to see the effect of topologically nontrivial points in metals because they tend to be shadowed by other, trivial parts of the Fermi surface. In this connection, a search has been underway for metals that possess symmetry-driven planes of degeneracy in the momentum space, which can cross the Fermi level and generate continuous nodal lines of Dirac points directly at the Fermi level [13]. Such metals would have a dramatically larger part of the Fermi surface bearing topological phenomena, and thus have potential for more unusual properties such as 3D quantum anomalous Hall effect [5, 14], tunable Weyl points [15], and “drumhead” surface states [16] that are argued to provide a route to higher temperature superconductivity [17].
Coexistence or proximity of such topological states with other exotic phenomena such as non-trivial spin textures, superconductivity, or quantum criticality can further provide a new route to the properties expected from the interplay of real and momentum space topology, originally discussed in the A-phase of 3He [18, 19]. These promising theoretical proposals have driven and guided recent experimental efforts toward the realization and study of such materials.
Quantum criticality, in particular, zero-temperature magnetic phase transitions, is believed to have connections to several emergent phenomena such as triplet superconductivity [20], non-Fermi liquid scalings [21] and unusual magnetotransport behavior [22]. Some famous examples of such materials are unconventional superconductors (Sr2RuO4 and Fe-based superconductors), skyrmionic materials (MnSi and FeSi) and weak itinerant ferromagnet, and superparamagnets (ZrZn2, Ni3Al, Ni3Ga, Pd). As such, a quantum critical system with a substantial presence of topologically-nontrivial states at the Fermi level would provide a novel materials platform for the study of the interplay of real and momentum space topology, but such materials are quite rare.
In this work, we report the synthesis, and magnetic, thermal and magnetotransport properties of single crystal CoTe2, and argue that it is a quantum critical Dirac metal with Dirac points and multiple nodal lines at the Fermi surface. The material does not show magnetic ordering down to 1.8 K despite the DFT ground state being distinctly ferromagnetic, a hallmark of a magnetic order suppressed by quantum-critical spin fluctuation. We find that CoTe2 is well described by Moriya’s Self-Consistent Renormalization Theory (SCRT) [23], further supporting the conclusion that CoTe2 is close to a ferromagnetic quantum critical point. This is highly interesting for its potential for tuning magnetic correlations in the presence of a unique topological electronic behavior.
Results and Discussion
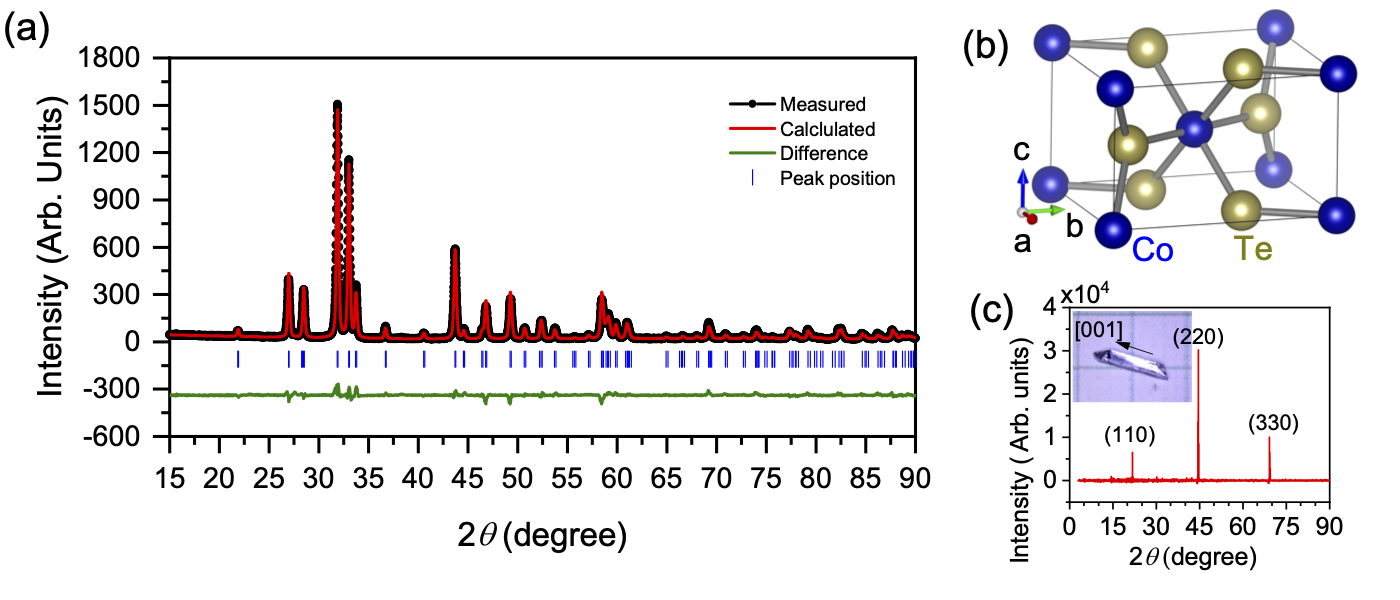
Single crystals of CoTe2 were grown using the Te self flux method as described in the Methods section. CoTe2 has previously been reported in three different space groups [24, 25, 26] so the structure of our bulk crystals was verified using multiple complementary methods: powder and single crystal x-ray diffraction, atomic resolved scanning transmission electron microscopy (STEM), and Raman spectroscopy, all confirming the orthorhombic marcasite structure in space group Pnnm(#58) [see Supplementary Materials (SM) sections S1 to S3 for a full structural description] [27].
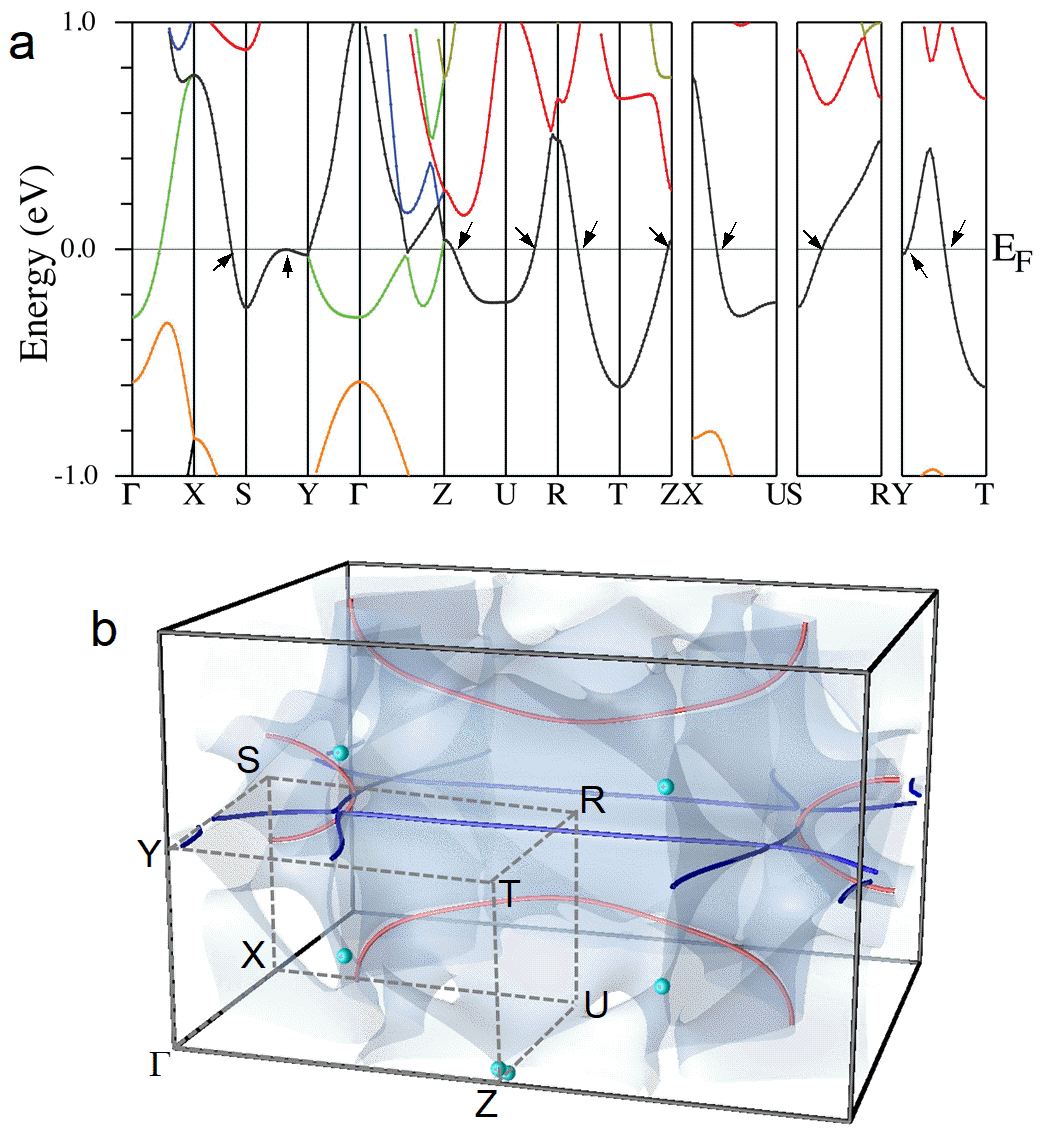
We first start by summarizing the electronic band structure of CoTe Fig. 1 shows the scalar-relativistic (no spin-orbit coupling) band structure along high-symmetry directions and the Fermi surface. The former, depicted in Fig. 1(a), shows a surprisingly large number of degenerate bands, namely along the X-S-Y, Z-U-R-T-Z, X-U, S-R and Y-T lines. To understand this, we recall that CoTe2 crystallizes in an interesting orthorhombic symmetry, Pnnm (#58). This symmetry group is highly asymmorphic: of its 8 symmetry operations half are glide planes. As a result, it has a large number of nodal lines and planes, where all electronic states are doubly degenerate by symmetry. Leonhard analyzed all orthorhombic groups [13] and concluded that for this group there are two such planes, defined by the conditions and respectively, and two lines, Z-T and Z-U. Degenerate planes generate nodal lines on the Fermi surface, which in CoTe2 form two closed loops [shown in Fig. 1(b) as red loops] in the plane and two sets of intersecting infinite lines, plus a small loop around Y (blue) in the one. The two lines identified in Ref. [13] generate two nodal points, shown as two cyan balls near Z in the same figure (note that while these form a quartet of four degenerate points near Z, they do not form, in agreement to the theoretical predictions [13], a closed loop). To the best of our knowledge this is the first direct verification of the Ref. [13]’s predictions for the space group. Note that, in agreement with Ref. [13], the degeneracy is lifted linearly in all directions, providing a large phase space for the Dirac electrons.
In addition, there is a line of accidental degeneracy, where two particular bands of Co origin are allowed to cross (without hybridization) in the plane. This line intersects with the Fermi surface at a Dirac point that sits close (but not exactly at) the center of the -Y-T-Z rectangle, and is also shown in Fig. 1(b) by a cyan ball. This Dirac point is 3D (the degeneracy is lifted linearly in all directions) and strongly tilted.
Last but not least, there is one other special Dirac point in the system. From the topological (in classical sense) point of view an isolated Dirac crossing, by definition, only shows degeneracy at one single point in the Brillouin zone, which can only appear on the Fermi level by accident (DP-0). The next level is a nodal line, i.e., a line of Dirac points, which can cross the Fermi surface at isolated points (DP-1). An even stronger, and much less common, there is a nodal plane generating a line of Dirac points on the Fermi level (DP-2). In our case, we have all of those, plus a special Dirac point on the Fermi surface between S and R. Here, the Dirac degeneracy is protected not only when one component of the wave vector is changing (as in DP-1), or two components (DP-2), but all three components , , and (DP-3). Only when two or more components are varied simultaneously, the degeneracy is lifted (see SM section S4 and Figs. S4 and S5 for details). This is the “strongest” Dirac point that can exist in a 3D system, and it occurs rather rarely in real systems.
Often, presence of the Dirac bands near the Fermi surface gives rise to unusual transport signatures. In clean semimetals, they may give rise to extremely large magnetoresistance (MR), quantum oscillations and non-zero Berry phase [28, 29, 30, 31, 32, 33] (it is to be noted that the extremely large MR and quantum oscillations in semimetals can have also a non-topological origin [34, 35, 36]). However, a combination of multiple Dirac points and lines on the Fermi surface (coming from nodal lines and planes passing through the entire BZ) have rarely been observed and their manifestation in the transport measurements have not been discussed. To this end, we carried out transport measurements on the single crystals of CoTe2. Electrical resistivity of CoTe2 as a function of temperature measured with current () along [001] is depicted in Fig. 2(a) (black curve), which shows a metallic character in the entire temperature range between 1.8 and 300 K, consistent with the calculated electronic structure, and does not show any feature indicative of long range magnetic ordering. Specific heat capacity from 1.8 to 200 K is shown in Fig. 2(b) (black curve), which shows a monotonic change with temperature not showing any sign of long range ordering as in the resistivity measurement. Although no long range magnetic ordering is observed in resistivity and heat capacity measurements, their analysis provide information on the average phonon frequency in terms of the Debye temperature, . The Debye formula for the specific heat as a function of temperature is
| (1) |
where the first term gives the phonon contribution to the specific heat, and is the gas constant. The second term is the Sommerfeld electronic specific heat with the coefficient giving the mass-renormalized density of states. In the low temperature limit this simplifies to,
| (2) |
where the first term is the contribution from acoustic phonons, . Fitting both the full temperature range to Eq. 1 [red curve in Fig. 2(b)], as well as just the low temperature data to Eq. 2 [inset in Fig. 2(b)] yield similar results finding = 275.4 K and mJmol-1K-1 for Eq. 1 and K and mJmol-1K-1 for Eq. 2 and K, indicating that the contribution from optical phonons at lower temperatures is small. This is to be compared with the Sommerfeld coefficient from the unrenormalized DFT density of states, states/eVf.u., mJmol-1K-1, giving a mass renormalization between 60 and 90%; note that if this renormalization were due to electron-phonon coupling the material would have been a good superconductor, so we interpret this as the manifestation of critical spin fluctuations discussed below.
We further analyzed the temperature dependence of the resistivity in terms of the Bloch-Grüneisen (BG) formula[37], where the electrical resistivity is
| (3) |
and is the residual resistivity at . The temperature-dependent term is given by[37, 38],
| (4) |
where is a coefficient describing the scattering rate, is the BG temperature, which is typically close, albeit not always equal to the Debye temperature, is the residual resistivity at , and the exponent takes the value of 2, 3, or 5 depending on the specifics of the electronic interactions present within the material [39, 40, 41]. For standard acoustic phonon scattering, the exponent is 5 and the coefficient is 4.225. Inserting these values for acoustic phonons as well as fixing the of 275.4 K, yields a temperature dependent resistivity in close agreement with experiment. It is known that the resistivity can observe a dependence in the presence of high paramagnetism and large electronic specific heat [41], and further, the assumption that isn’t strictly true [37]. This dependence would take the same form as Eq. 4, with , and where is a constant coefficient describing the scattering rate of the behavior. We find the dependence at low temperature much more accurately reflects the temperature dependence of resistivity [inset in Fig. 2(a)].

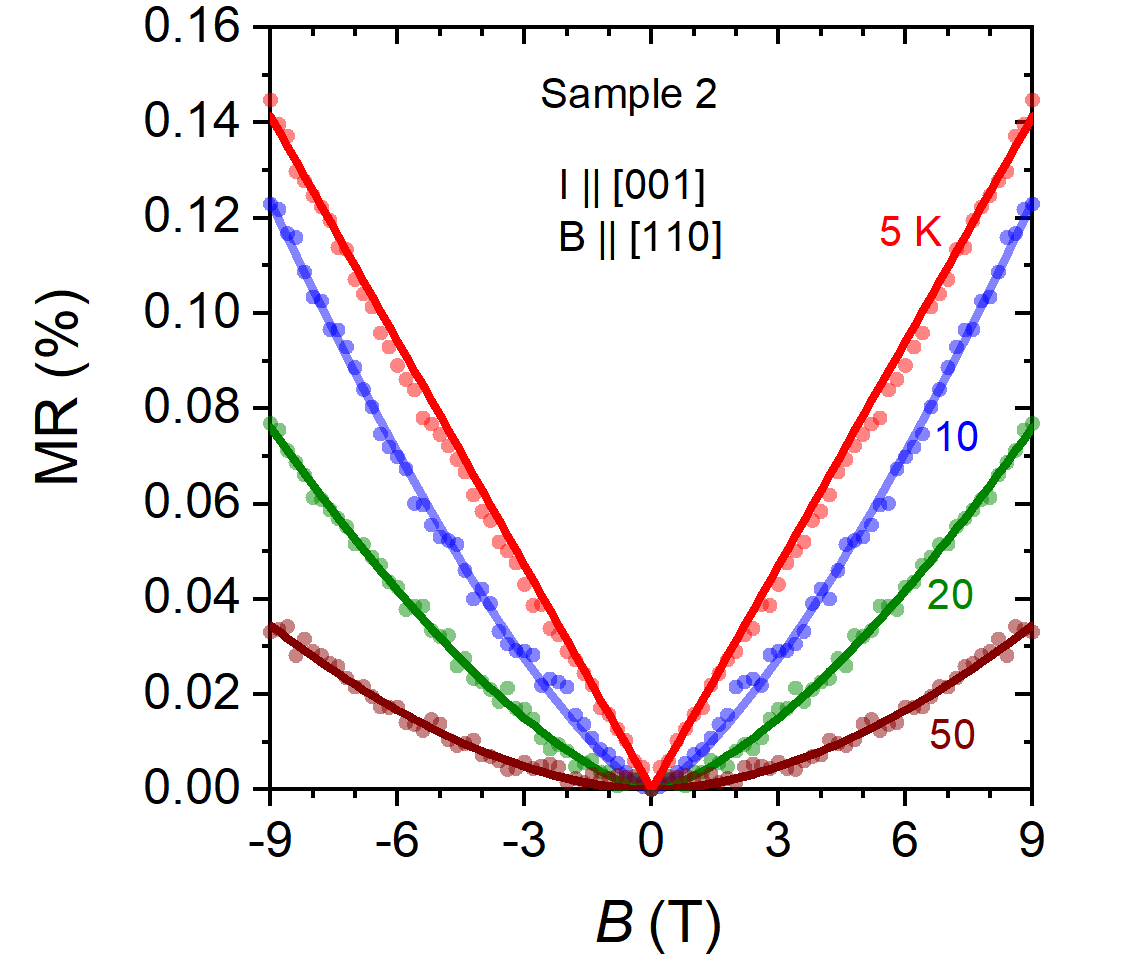
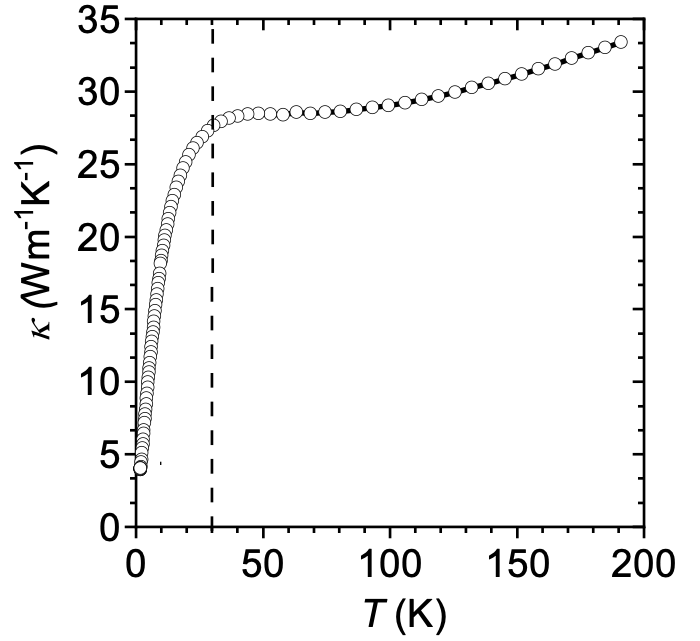
The magnetoresistance (MR), defined as [-]/, for along [001] and the magnetic field along [110] between 1.8 and 30 K, is shown in Fig. 2 (c). The MR in CoTe2 is extremely small but at lower temperatures K it is linear in magnetic field, and non-saturating. The linear behavior gradually changes with temperature. A dependence is observed at 10 K, dependence at 20 K, and finally exhibiting a more conventional dependence at 30 K. We verified this behavior in more than one samples from different growth batches (see Fig. S6).The linear MR is an interesting property and has been observed in many material systems [42, 43, 44, 45, 46, 47, 48, 49, 50, 51, 43]. However, it is frequently observed and used as evidence for materials exhibiting topological features in their electronic structure [52, 53, 42, 43, 47, 54, 49, 50, 51, 55]. One prevalent non-topological reason for the linear MR is disorder [46, 45, 53, 56]. But in such a case, the linear MR usually spans a large temperature range unlike the quickly attained quadratic behavior at 30 K in CoTe2. Another widely observed reason for the linear MR is an admixture of a component of the Hall resistivity (which depends linearly on the magnetic field) to the longitudinal resistance caused by inhomogeneities such as density or sample thickness variations [57]. Such variations give rise to a gradient of the (transverse) Hall voltage in the longitudinal direction that will naturally be picked up in measurements of the longitudinal resistance, therefore giving rise to a linear component in the magnetoresistance. In CoTe2, the Hall resistivity is linear at all temperatures measured [Fig. 2(d)] and its influence only at the lower temperatures, where the MR is actually larger, is not consistent with this mechanism. In fact, thermal conductivity measured as a function of temperature (see Fig. S7) shows a sharp drop below about 30 K indicating that Umklapp process is frozen out below this temperature and thus the effect of phonon scattering is smaller at the temperature range where linear MR is observed, consistent with the conclusion drawn from the analysis of the heat capacity data. This observation is indicative that with the increase in temperature phonons may play a role in suppressing the linear MR in CoTe2. As the magnetotransport of such a system with the coexisting nodal points, lines and planes have never been measured and analyzed before, this anomalous magnetotransport behavior of CoTe2 calls for further theoretical and experimental investigations.


To characterize the magnetism in CoTe2 we performed DC magnetic measurements. The blue curve in Fig. 3(a) (plotted in the left axis) shows magnetic susceptibility as a function of temperature between 1.8 and 375 K. The susceptibility increases slowly with decreasing temperature but does not show a sign of a long-range ordering, consistent with resistivity and heat capacity measurements. It neither diverges at lower temperatures as in normal paramagnetic materials. It is an indication that the material tends to order but the ordering is somehow suppressed (by strong spin fluctuations, which we will discuss below). Inverse susceptibility after subtracting a small diamagnetic background ( of 10-5 cm3mol-1F.U.-1) determined from the Curie-Weiss fit to the susceptibility above 50 K (indicated by the red dashed line) is plotted in the right hand axis of Fig. 3(a). Thus obtained inverse susceptibility is linear over a wide range of temperature (down to 25 K) and its fitting to the Curie-Weiss law [red solid line in Fig. 3(a)]:
| (5) |
where is the spin susceptibility, is the Curie constant, and is the Curie-Weiss temperature, yields the effective moment (=) of 1.940 per Co. This agrees reasonably well with the theoretical of 1.732 per Co for the low-spin state () Co4+. obtained from the intercept is K. The sizable positive value indicates the presence of ferromagnetic correlations. Magnetization data ( vs ) depicted in Fig. 3(b) is linear at all temperatures between 1.8 and 300 K indicating that the paramagnetism observed at room temperature, unusually, persists down to the lowest measured temperatures. The fact that despite the large the material does not order down to K indicates strong spin fluctuations.
Additional insight can be gained from the density functional (DFT) calculations. Being mean-field by nature, DFT calculations do not account for fluctuation-driven suppression of magnetic order. Correspondingly, calculating the ferromagnetic total energy in DFT as a function of spin magnetization yields a ferromagnetic ground state with a moment of /Co, also corresponding to (with a typical for DFT hybridization reduction), whose total stabilization energy is however only 6 meV/Co), as shown in Fig. 4. The effect of fluctuations can be approximated by means of Moriya’s SCRT[23, 58]. If the DFT energy is expanded as a polynomial in ,
| (6) |
and there are Gaussian fluctuations of the magnetic moment with an average squared amplitude , then, in SCRT, the renormalized energy is given by
| (7) |
and the renormalized susceptibility is, as usually, . Typically, Moriya’s parameter is comparable with, or somewhat larger than the equilibrium DFT value. Fitting our DFT calculations (the green line in Fig. 4), and assuming fluctuations with , consistent with the DFT moment of , we can reproduce the experimental susceptibility at . Thus, CoTe2 is a material where ferromagnetic order is suppressed by strong spin fluctuations, leaving the ground state on the verge of a magnetic quantum critical phase transition.
Conclusion
To conclude, our measurements and calculations suggest that CoTe2 sports a unique combination of a quantum criticality and multiple nodal Dirac lines. The ferromagnetic order is wholly suppressed, maintaining paramagnetic behavior down to the lowest measured temperatures due to strong spin fluctuation. The calculated bands show that this material has potential for harboring new topological physics, as CoTe2 hosts both nodal Dirac lines, and more conventional Dirac points directly on the Fermi surface, within a single material on the verge of quantum criticality. This study should prompt future investigations into system, for instance, by probing the Dirac dispersions via photoemission and quantum oscillations. A quantum critical point may be reached by doping or pressure to provide further insight into the interplay between magnetism and topological fermions.
Methods
Single crystal growth and x-ray diffraction. Single crystals of CoTe2 were grown by molten metal flux method with Te as a self flux. Co powder (Alfa Aesar; 99.998%), and Te shots (Alfa Aesar; 99.9999%), were loaded in a 2-ml aluminum oxide crucible in a molar ratio of 1:19. The crucible was then sealed in a fused silica ampule under vacuum. The sealed ampule was heated to 800°C over 12 hours, homogenized at 800°C for 10 hours. The furnace was then quickly cooled to 760°C in 2 hours followed by slow cooling to 500°C over 140 hours. Once the furnace reached 500°C, the excess flux was decanted from the crystals using a centrifuge. Well-faceted rectangular crystals as large as 30 mg were obtained. The crystal structure of the compound was first verified by x-ray powder diffraction at room temperature using a Rigaku MiniFlex diffractometer and then by single crystal x-ray diffraction. A few crystals from each growth batch were ground into powder, and x-ray diffraction patterns were collected on those powder samples. Rietveld refinement [59] of powder x-ray pattern was performed using FullProf software [60]. Single-crystal X-ray diffraction data of CoTe2 were collected on a piece of a representative single crystal at room temperature using a Rigaku XtaLAB Synergy-i diffractometer with the HyPix-Bantam direct photon-counting detector. The single-crystal was glued on a loop and mounted on the goniometer head of the diffractometer. The crystal structure of CoTe2 was solved with space group and refined with the SHELX program [61].
STEM Measurements. An FEI Helios NanoLab 660 DualBeam (SEM/FIB) system was used to prepare cross-sectional TEM samples. Electron-beam-induced deposition of Pt was initially deposited on top of the materials to protect the sample surface, followed by 3-m ion-beam induced Pt deposition. To reduce Ga ion damage, 2 kV Ga ion beam was applied to thin the lamella in the final step. An FEI Titan 80-300 STEM/TEM equipped with a probe spherical-aberration corrector was employed to conduct atomic resolved scanning transmission electron microscopy (STEM) imaging.
Raman measurements. Raman measurements of CoTe2 single crystals were performed at room temperature in a backscattering geometry. The sample was excited by a 532 nm laser focused through a 0.75 NA objective lens with 40 magnification. The laser power was measured to be 200 W before the objective. Scattered light was collected through the same lens and directed to an imaging spectrograph. Rejection of the laser is accomplished using a pair of long pass dielectric filters that allow measurement of Raman scattered light down to 75 cm-1.
Magnetic, transport and thermal measurements. Electronic transport measurements were conducted within the 9-T Quantum Design PPMS with the DC resistivity option. Samples were polished to dimensions of approximately 1.000.400.12 mm with the long axis corresponding to the [001] direction. An excitation current of 4 mA was used for all measurements. Electrical contacts were affixed using Epotek H20E silver epoxy and 25 m Pt wires with typical contacts resistances of 10 , such that current was directed along the [001] direction. In magnetoresistance measurements, the contact misalignment was corrected by field symmetrizing (for MR) and antisymmetrizing (for Hall) the measured data. Magnetization measurements were made using a Quantum Design VSM SQUID in the field-cooled mode. Heat capacity was measured with the Quantum Design PPMS. The thermal conductivity was measured via the Quantum Design PPMS Thermal Transport Option (TTO) where the sample was polished to a rectangular bar and mounted with the standard TTO thermometer shoes. The sample geometry yielded a cross-sectional area of 0.747 mm2 with thermometer lead separation of 1.628 mm. The applied heat current was directed along the c-axis of the sample with the heat pulses maintained at 3% of the sample temperature for each temperature setpoint measured.
First-principles Calculations. Most calculations were performed using the all-electron linearized augmented plane wave code WIEN2k[62] with gradient approximation for the exchange-correlation energy[63], including the results shown in Figs. 1 and 3. For control purposes, some calculations were performed using projected augmented wave pseudo-potential code VASP[64]. Fig. S4 was generated using the Full Potential Local Orbitals (FPLO)[65] package (agreement of the results from WIEN2k was verified).
Acknowledgements
The authors thank Binghai Yan for insightful discussions. N.J.G acknowledges the support from the NSF CAREER award DMR-2143903. Crystal growth part of the work at George Mason University was supported by the U.S. Department of Energy, Office of Science, Basic Energy Sciences, Materials Science and Engineering Division. I.I.M. acknowledges support from the U.S. Department of Energy through the grant No. DE-SC0021089. M.P.G. acknowledges the Alexander von Humboldt Foundation, Germany and IFW-Dresden, Germany for the equipment grants. R.G. thanks UGC-Nepal for the fellowship with award number MRS-77/78 S & T -119. Magnetic characterization at G.U. have been supported by the NSF (ECCS-2151809). The acquisition of a Magnetic Property Measurements System (MPMS3, Quantum Design) at G.U. used herein was supported by the NSF (DMR-1828420). H.Z. acknowledges support from the U.S. Department of Commerce, NIST under financial assistance award 70NANB19H138. A.D. acknowledges support from the Material Genome Initiative funding allocated to NIST. J.J. and P.M.V. acknowledge support from the NSF CAREER award DMR-1847782.
References
References
- Armitage et al. [2018] N. P. Armitage, E. J. Mele, and A. Vishwanath, Weyl and Dirac semimetals in three-dimensional solids, Reviews of Modern Physics 90, 15001 (2018).
- Burkov et al. [2011] A. A. Burkov, M. D. Hook, and L. Balents, Topological nodal semimetals, Physical Review B 84, 235126 (2011).
- Kim et al. [2015] Y. Kim, B. J. Wieder, C. L. Kane, and A. M. Rappe, Dirac Line Nodes in Inversion-Symmetric Crystals, Physical Review Letters 115, 036806 (2015).
- Bzdušek et al. [2016] T. Bzdušek, Q. Wu, A. Rüegg, M. Sigrist, and A. A. Soluyanov, Nodal-chain metals, Nature 538, 75 (2016).
- Rhim and Kim [2015] J. W. Rhim and Y. B. Kim, Landau level quantization and almost flat modes in three-dimensional semimetals with nodal ring spectra, Physical Review B 92, 045126 (2015), arXiv:1504.07641 .
- Zhu et al. [2016] Z. Zhu, G. W. Winkler, Q. Wu, J. Li, and A. A. Soluyanov, Triple Point Topological Metals, Physical Review X 6, 031003 (2016).
- Ahn et al. [2018] K.-H. Ahn, W. E. Pickett, and K. W. Lee, Coexistence of Triple Nodal Points, Nodal Links, and Unusual Flat Band in intermetallic APd3 (A=Pb, Sn), Phys. Rev. B 98, 035130 (2018).
- Ghimire et al. [2018] N. J. Ghimire, M. A. Khan, A. S. Botana, J. S. Jiang, and J. F. Mitchell, Anisotropic angular magnetoresistance and Fermi surface topology of the candidate novel topological metal Pd3Pb, Physical Review Materials 2, 081201(R) (2018).
- Khoury et al. [2019] J. F. Khoury, A. J. E. Rettie, M. A. Khan, N. J. Ghimire, I. Robredo, J. E. Pfluger, K. Pal, C. Wolverton, A. Bergara, J. S. Jiang, L. M. Schoop, M. G. Vergniory, J. Mitchell, D. Y. Chung, and M. G. Kanatzidis, A new three-dimensional subsulfide Ir2In8 with Dirac semimetal behavior, Journal of the American Chemical Society 141, 19130 (2019).
- Gilbert [2021] M. J. Gilbert, Topological electronics, Communications Physics 4, 70 (2021).
- Polash et al. [2021] M. M. H. Polash, S. Yalameha, H. Zhou, K. Ahadi, Z. Nourbakhsh, and D. Vashaee, Topological quantum matter to topological phase conversion : Fundamentals , materials , physical systems for phase conversions , and device applications, Materials Science & Engineering R 145, 100620 (2021).
- Kumar et al. [2021] N. Kumar, S. N. Guin, K. Manna, C. Shekhar, and C. Felser, Topological Quantum Materials from the Viewpoint of Chemistry, Chemical Reviews 121, 2780 (2021).
- Leonhardt et al. [2021] A. Leonhardt, M. M. Hirschmann, N. Heinsdorf, X. Wu, D. H. Fabini, and A. P. Schnyder, Symmetry-enforced topological band crossings in orthorhombic crystals : Classification and materials discovery, Physical Review Materials 5, 124202 (2021).
- Xu et al. [2011] G. Xu, H. Weng, Z. Wang, X. Dai, and Z. Fang, Chern Semimetal and the Quantized Anomalous Hall Effect in HgCr2 Se4, Physical Review Letters 107, 186806 (2011).
- Yan and Wang [2016] Z. Yan and Z. Wang, Tunable Weyl Points in Periodically Driven Nodal Line Semimetals, Physical Review Letters 117, 087402 (2016).
- Bian et al. [2016] G. Bian, T.-r. Chang, R. Sankar, S.-y. Xu, H. Zheng, T. Neupert, C.-k. Chiu, S.-m. Huang, G. Chang, I. Belopolski, D. S. Sanchez, M. Neupane, N. Alidoust, C. Liu, B. Wang, C.-c. Lee, H.-t. Jeng, C. Zhang, Z. Yuan, S. Jia, A. Bansil, F. Chou, H. Lin, and M. Z. Hasan, Topological nodal-line fermions in spin-orbit metal PbTaSe2, Nature Communications 7, 10556 (2016).
- Kopnin et al. [2011] N. B. Kopnin, T. T. Heikkil, and G. E. Volovik, High-temperature surface superconductivity in topological flat-band systems, Physical Review B 83, 220503 (2011).
- Volovik [2012] G. E. Volovik, The Universe in a Helium Droplet (Oxford University Press, Oxford, 2012).
- Volovik [2007] G. E. Volovik, Quantum Phase Transitions from Topology., in Momentum Space in Quantum Analogues: From Phase Transitions to Black Holes and Cosmology, Lecture Notes in Physics, edited by W. G. Unruh and R. Schützhold (Springer, Berlin Heidelberg, 2007) pp. 31–73.
- Singh and Mazin [2002] D. J. Singh and I. I. Mazin, Competition of Spin Fluctuations and Phonons in Superconductivity of ZrZn2, Physical Review Letters 88, 187004 (2002).
- Stewart et al. [2002] J. R. Stewart, B. D. Rainford, R. S. Eccleston, and R. Cywinski, Non-Fermi-Liquid Behavior of Electron-Spin Fluctuations in an Elemental Paramagnet, Physical Review Letters 89, 186403 (2002).
- Mazin et al. [2004] I. I. Mazin, D. J. Singh, and A. Aguayo, Density functional calculations near ferromagnetic quantum critical points, in Physics of Spin in Solids: Materials, Methods and Applications (Springer, Dordrecht, 2004) pp. 139–154.
- Moriya [1985] T. Moriya, Spin Fluctuations in Itinerant Electron Magnetism (Springer, Verlag, Berlin, Heidelberg, New-York, 1985).
- Brostigen and Kjekshus [1970] G. Brostigen and A. Kjekshus, Compounds with Marcasite Type Crystal Structure V. The crystal structure of FeS2, FeTe2, and CoTe2, Acta Chemica Scandinavica 24, 1925 (1970).
- Cheda et al. [1986] J. A. R. Cheda, E. F. Westrum, and F. Gronvold, Heat Capacity and Other Thermodynamic Properties of CoTe2 from 5 to 1030 K and of CoTe2. 315 from 300 to 1040 K, Monatshefte fur Chemie 117, 1223 (1986).
- Ma et al. [2018] H. Ma, W. Dang, X. Yang, B. Li, Z. Zhang, P. Chen, Y. Liu, Z. Wan, Q. Qian, J. Luo, K. Zang, X. Duan, and X. Duan, Chemical Vapor Deposition Growth of Single Crystalline CoTe2 Nanosheets with Tunable Thickness and Electronic Properties, Chemistry of Materials 30, 8891 (2018).
- [27] NIST disclaimer: Certain commercial equipment, instruments, or materials are identified in this paper in order to specify the experimental procedure adequately. Such identifications are not intended to imply recommendation or endorsement by the National Institute of Standards and Technology (NIST), nor it is intended to imply that the materials or equipment identified are necessarily the best available for the purpose.
- Ali et al. [2014] M. N. Ali, J. Xiong, S. Flynn, J. Tao, Q. D. Gibson, L. M. Schoop, T. Liang, N. Haldolaarachchige, M. Hirschberger, N. P. Ong, and R. J. Cava, Large, non-saturatingmagnetoresistance inWTe2, Nature 514, 205 (2014).
- [29] N. J. Ghimire, Y. Luo, M. Neupane, D. J. Williams, E. D. Bauer, and F. Ronning, Magnetotransport of single crystalline NbAs, Journal of Physics: Condensed Matter 27, 152201.
- Liang et al. [2015] T. Liang, Q. Gibson, M. N. Ali, M. Liu, R. J. Cava, and N. P. Ong, Ultrahigh mobility and giant magnetoresistance in the Dirac semimetal Cd3As2, Nature Materials 14, 280 (2015), arXiv:1404.7794 .
- Ghimire et al. [2016] N. J. Ghimire, A. S. Botana, D. Phelan, H. Zheng, and J. F. Mitchell, Magnetotransport of single crystalline YSb, Journal of Physics Condensed Matter 28, 19 (2016).
- Burkov [2014] A. A. Burkov, Anomalous Hall Effect in Weyl Metals, Phys. Rev. Lett. 113, 187202 (2014).
- H. et al. [2013] M. H., B. M.S., T. M., K. Y., B. C., K. Y., N. N., H. H.Y., and T. Y., Detection of Berry’s Phase in a Bulk Rashba Semiconductor, Science 342, 1490 (2013).
- Luo et al. [2016] Y. Luo, R. D. McDonald, P. F. Rosa, B. Scott, N. Wakeham, N. J. Ghimire, E. D. Bauer, J. D. Thompson, and F. Ronning, Anomalous electronic structure and magnetoresistance in TaAs2, Scientific Reports 6, 27294 (2016).
- Sun et al. [2016] S. Sun, Q. Wang, P.-J. Guo, K. Liu, and H. Lei, Large magnetoresistance in LaBi: origin of field-induced resistivity upturn and plateau in compensated semimetals, New Journal of Physics 18, 082002 (2016), arXiv:1601.04618 .
- He et al. [2016] J. He, C. Zhang, N. J. Ghimire, T. Liang, C. Jia, J. Jiang, S. Tang, S. Chen, Y. He, S. K. Mo, C. C. Hwang, M. Hashimoto, D. H. Lu, B. Moritz, T. P. Devereaux, Y. L. Chen, J. F. Mitchell, and Z. X. Shen, Distinct Electronic Structure for the Extreme Magnetoresistance in YSb, Physical Review Letters 117, 267201 (2016).
- Ziman [2001] J. M. Ziman, Electrons and Phonons: The Theory of Transport Phenomena in Solids (Oxford University Press, 2001) reprint ed.
- Bid et al. [2006] A. Bid, A. Bora, and A. K. Raychaudhuri, Temperature dependence of the resistance of metallic nanowires of diameter nm: Applicability of Bloch-Grüneisen theorem, Physical Review B Review B 74, 035426 (2006).
- Cvijovic [2011] D. Cvijovic, The Bloch – Grüneisen function of arbitrary order and its series representations, Theoretical and Mathematical Physics 166, 37 (2011).
- Wilson [1938] A. H. Wilson, The electrical conductivity of the transition metals, Proc. R. Soc. Lond. A 157, 580 (1938).
- Barber [1937] W. G. Barber, The contribution of the electrical resistance of metals from collisions between electrons, Proc. R. Soc. Lond. A 158, 383 (1937).
- Zhang et al. [2011] W. Zhang, R. Yu, W. Feng, Y. Yao, H. Weng, X. Dai, and Z. Fang, Topological Aspect and Quantum Magnetoresistance of - Ag2Te, Physical Review Letters 106, 156808 (2011).
- Wang and Lei [2012] C. M. Wang and X. L. Lei, Linear magnetoresistance on the topological surface, Physical Review B 86, 035442 (2012).
- Khouri et al. [2016] T. Khouri, U. Zeitler, C. Reichl, W. Wegscheider, N. E. Hussey, S. Wiedmann, and J. C. Maan, Linear Magnetoresistance in a Quasifree Two-Dimensional Electron Gas in an Ultrahigh Mobility GaAs Quantum Well, Phys. Rev. Lett. 117, 256601 (2016).
- Kozlova et al. [2012] N. V. Kozlova, N. Mori, O. Makarovsky, L. Eaves, Q. D. Zhuang, A. Krier, and A. Patanè, Linear magnetoresistance due to multiple- electron scattering by low-mobility islands in an inhomogeneous conductor, Nature Communications 3, 1097 (2012).
- Xu et al. [1997] R. Xu, A. Husmann, T. F. Rosenbaum, M.-L. Saboungi, J. E. Enderby, and P. B. Littlewood, Large magnetoresistance in non-magnetic silver chalcogenides, Nature 390, 57 (1997).
- Zhao et al. [2015] Y. Zhao, H. Liu, J. Yan, W. An, J. Liu, X. Zhang, H. Wang, Y. Liu, H. Jiang, Q. Li, Y. Wang, X.-z. Li, D. Mandrus, X. C. Xie, M. Pan, and J. Wang, Anisotropic magnetotransport and exotic longitudinal linear magnetoresistance in WTe2 crystals, Physical Review B 92, 041104 (2015).
- Feng et al. [2015] J. Feng, Y. Pang, D. Wu, Z. Wang, H. Weng, J. Li, X. Dai, Z. Fang, Y. Shi, and L. Lu, Large linear magnetoresistance in Dirac semimetal Cd3As2 with Fermi surfaces close to the Dirac points, Physical Review B 92, 081306(R) (2015).
- Novak et al. [2015] M. Novak, S. Sasaki, K. Segawa, and Y. Ando, Large linear magnetoresistance in the Dirac semimetal TlBiSSe, Phys. Rev. B 91, 041203(R) (2015).
- Tang et al. [2011] H. Tang, D. Liang, R. L. J. Qiu, and X. P. A. Gao, Linear Magneto-Resistance in Topological Insulator Bi2Se3 Nanoribbons, ACS nano 5, 7510 (2011).
- Gusev et al. [2013] G. M. Gusev, E. B. Olshanetsky, Z. D. Kvon, N. N. Mikhailov, and S. A. Dvoretsky, Linear magnetoresistance in HgTe quantum wells, Phys. Rev. B 87, 081311(R) (2013).
- Abrikosov [1998] A. A. Abrikosov, Quantum magnetoresistance, Phys. Rev. B 58, 2788 (1998).
- Hu and Rosenbaum [2008] J. Hu and T. F. Rosenbaum, Classical and quantum routes to linear magnetoresistance, Nature 7, 697 (2008).
- Fang et al. [2015] C. Fang, Y. Chen, H.-y. Kee, and L. Fu, Topological nodal line semimetals with and without spin-orbital coupling, Physical Review B 92, 081201 (2015).
- Leahy et al. [2018] I. A. Leahy, Y.-p. Lin, P. E. Siegfried, A. C. Treglia, J. C. W. Song, R. M. Nandkishore, and M. Lee, Nonsaturating large magnetoresistance in semimetals, PNAS 115, 10570 (2018).
- Parish and Littlewood [2003] M. M. Parish and P. B. Littlewood, Non-saturating magnetoresistance in heavily disordered semiconductors, Nature 426, 162 (2003).
- Bruls et al. [1981] G. J. C. L. Bruls, J. Bass, A. P. van Gelder, H. van Kempen, and P. Wyder, Linear Magnetoresistance Caused by Sample Thickness Variations, Physical Review Letters 46, 553 (1981).
- Larson et al. [2004] P. Larson, I. I. Mazin, and D. J. Singh, Magnetism, critical fluctuations, and susceptibility renormalization in Pd, Phys. Rev. B 69, 064429 (2004).
- McCusker et al. [1999] L. B. McCusker, R. B. Von Dreele, D. E. Cox, D. Louër, and P. Scardi, Rietveld refinement guidelines, J. Appl. Cryst. 32, 36 (1999).
- Rodriguez-carvajal [1993] J. Rodriguez-carvajal, Recent advances in magnetic structure determination by neutron powder diffraction, Physica B 192, 55 (1993).
- Sheldrick [2008] G. M. Sheldrick, A short history of SHELX, Acta Crystallographica A64, 112 (2008).
- Blaha and al. [2001] P. Blaha and E. al., An Augmented Plane Wave Plus Local Orbitals Program for Calculating Crystal Properties (Vienna University of Technology, Austria, 2001) p. (Austria: Vienna University of Technology).
- Perdew et al. [1996] J. P. Perdew, K. Burke, and M. Ernzerhof, Generalized gradient approximation made simple, Physical Review Letters 77, 3865 (1996), arXiv:0927-0256(96)00008 [10.1016] .
- Kresse and Furthmüller [1996] G. Kresse and J. Furthmüller, Efficient iterative schemes for ab initio total-energy calculations using a plane-wave basis set, Physical Review B 54, 11169 (1996).
- Koepernik and Eschrig [1999] K. Koepernik and H. Eschrig, Full-potential nonorthogonal local-orbital minimum-basis band-structure scheme, Physical Review B 59, 1743 (1999).
Supplementary Information for:
CoTe2: A quantum critical Dirac metal with strong spin fluctuations
Peter E. Siegfried, Hari Bhandari, Jeanie Qi, Rojila Ghimire, Jayadeep Joshi, Zachary T. Messegee, Willie Beeson, Kai Liu, Madhav Prasad Ghimire, Yanliu Dang, Huairuo Zhang, Albert Davydov, Xiaoyan Tan, Patrick M. Vora, Igor I. Mazin, and Nirmal J. Ghimire
S1 X-ray diffraction
| Formula | CoTe2 |
|---|---|
| Crystal system | Orthorhombic |
| Temperature (K) | 293 |
| (Å) | 0.71073 |
| Space group | Pnnm |
| Unit cell , , (Å) | 5.3176(10), 6.3186(2), 3.8864(10) |
| V, (Å3) | 130.582(6) |
| Z | 2 |
| Crystal size (mm3) | 0.082, 0.126, 0.065 |
| , g cm-3 | 7.989 |
| , mm-1 | 28.074 |
| , deg | 36.265 |
| Reflections collected | 2277 |
| 0.0286 | |
| Unique reflections | 357 |
| Parameters refined | 12 |
| ,w [] | 0.0278, 0.0751 |
| Diff. peak and hole, e (Å-3) | 2.227, –3.577 |
| Goodness-of-fit | 1.192 |
| Atom | Wyck.Site | Occupancy | |||
|---|---|---|---|---|---|
| Co | 2 | 0 | 0 | 0 | 1.00 |
| Te | 4 | 0.21949(6) | 0.36340(5) | 0 | 1.00 |
| U11 | U22 | U33 | U23 | U13 | U12 |
|---|---|---|---|---|---|
| (Å2) | (Å2) | (Å2) | (Å2) | (Å2) | (Å2) |
| 0.0094(4) | 0.0077(4) | 0.0091(4) | 0 | 0 | -0.0002(3) |
| 0.0064(2) | 0.0057(2) | 0.0075(2) | 0 | 0 | -0.00073(7) |
S2 STEM Measurements
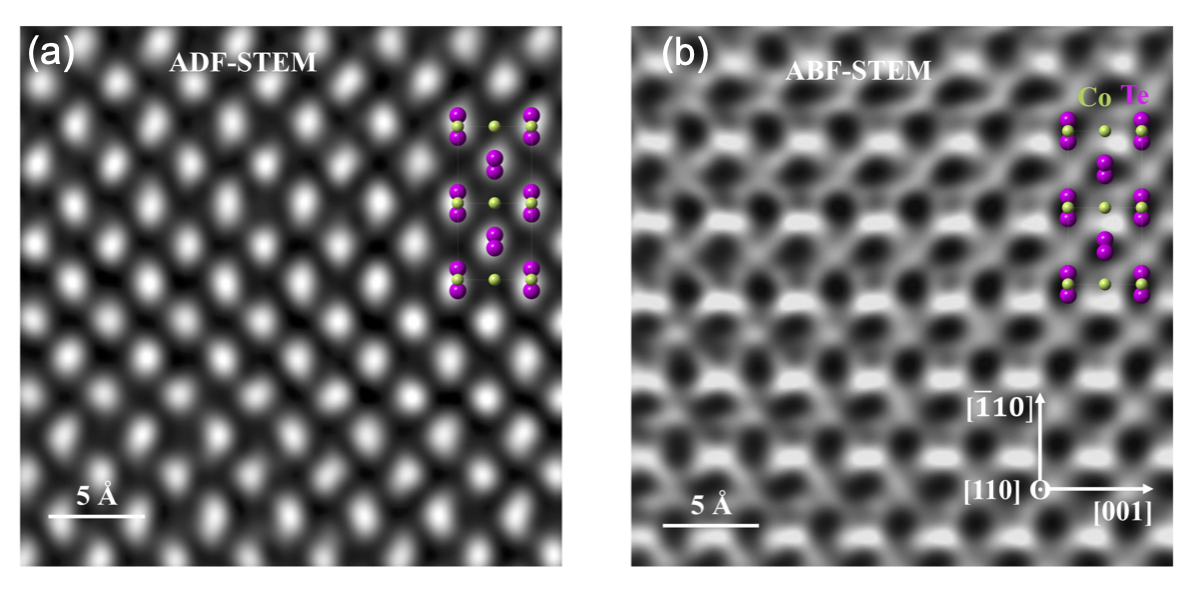
Figure S2 shows the atomic resolved annular dark-field (ADF) and annular bright-field (ABF) STEM images which were taken simultaneously along the [110] zone-axis. The inserted atomic model of CoTe2 with the space group matches well with the atomic images.
S3 Raman Measurements
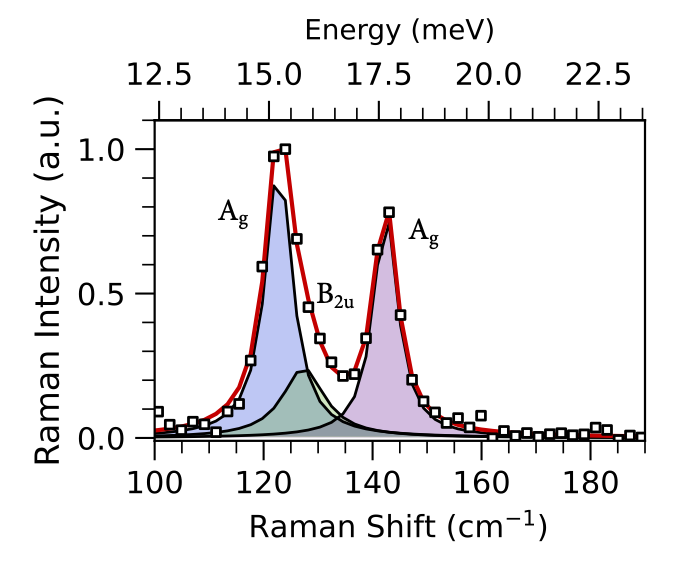
Raman spectrum of CoTe2 is presented in Fig. S3. The phonon mode frequencies are determined by fitting the data to a sum of three Lorentzians. The spectrum is dominated by two modes at 122.79 cm-1 and 142.41 cm-1 to which we assign Ag symmetry based on our DFT calculations (Table S2). There is additional spectral weight between these two modes that can be accounted for with a third Lorentzian centered at 127.32 cm-1. While no Raman active modes are expected here, DFT calculations do predict a mode of B2u symmetry. We therefore suggest this feature is a B2u symmetry mode activated by disorder.
| Experiment | DFT Calculation | ||
|---|---|---|---|
| Mode Frequency (cm-1) | Symmetry | Mode Frequency (cm-1) | Symmetry |
| 122.79 0.15 | Ag | 127.4524 0.9480 | Ag |
| 127.32 1.43 | B2u | 130.7357 0.6270 | B2u |
| 142.41 0.08 | Ag | 144.7070 0.0288 | Ag |
S4 First-principles Calculations
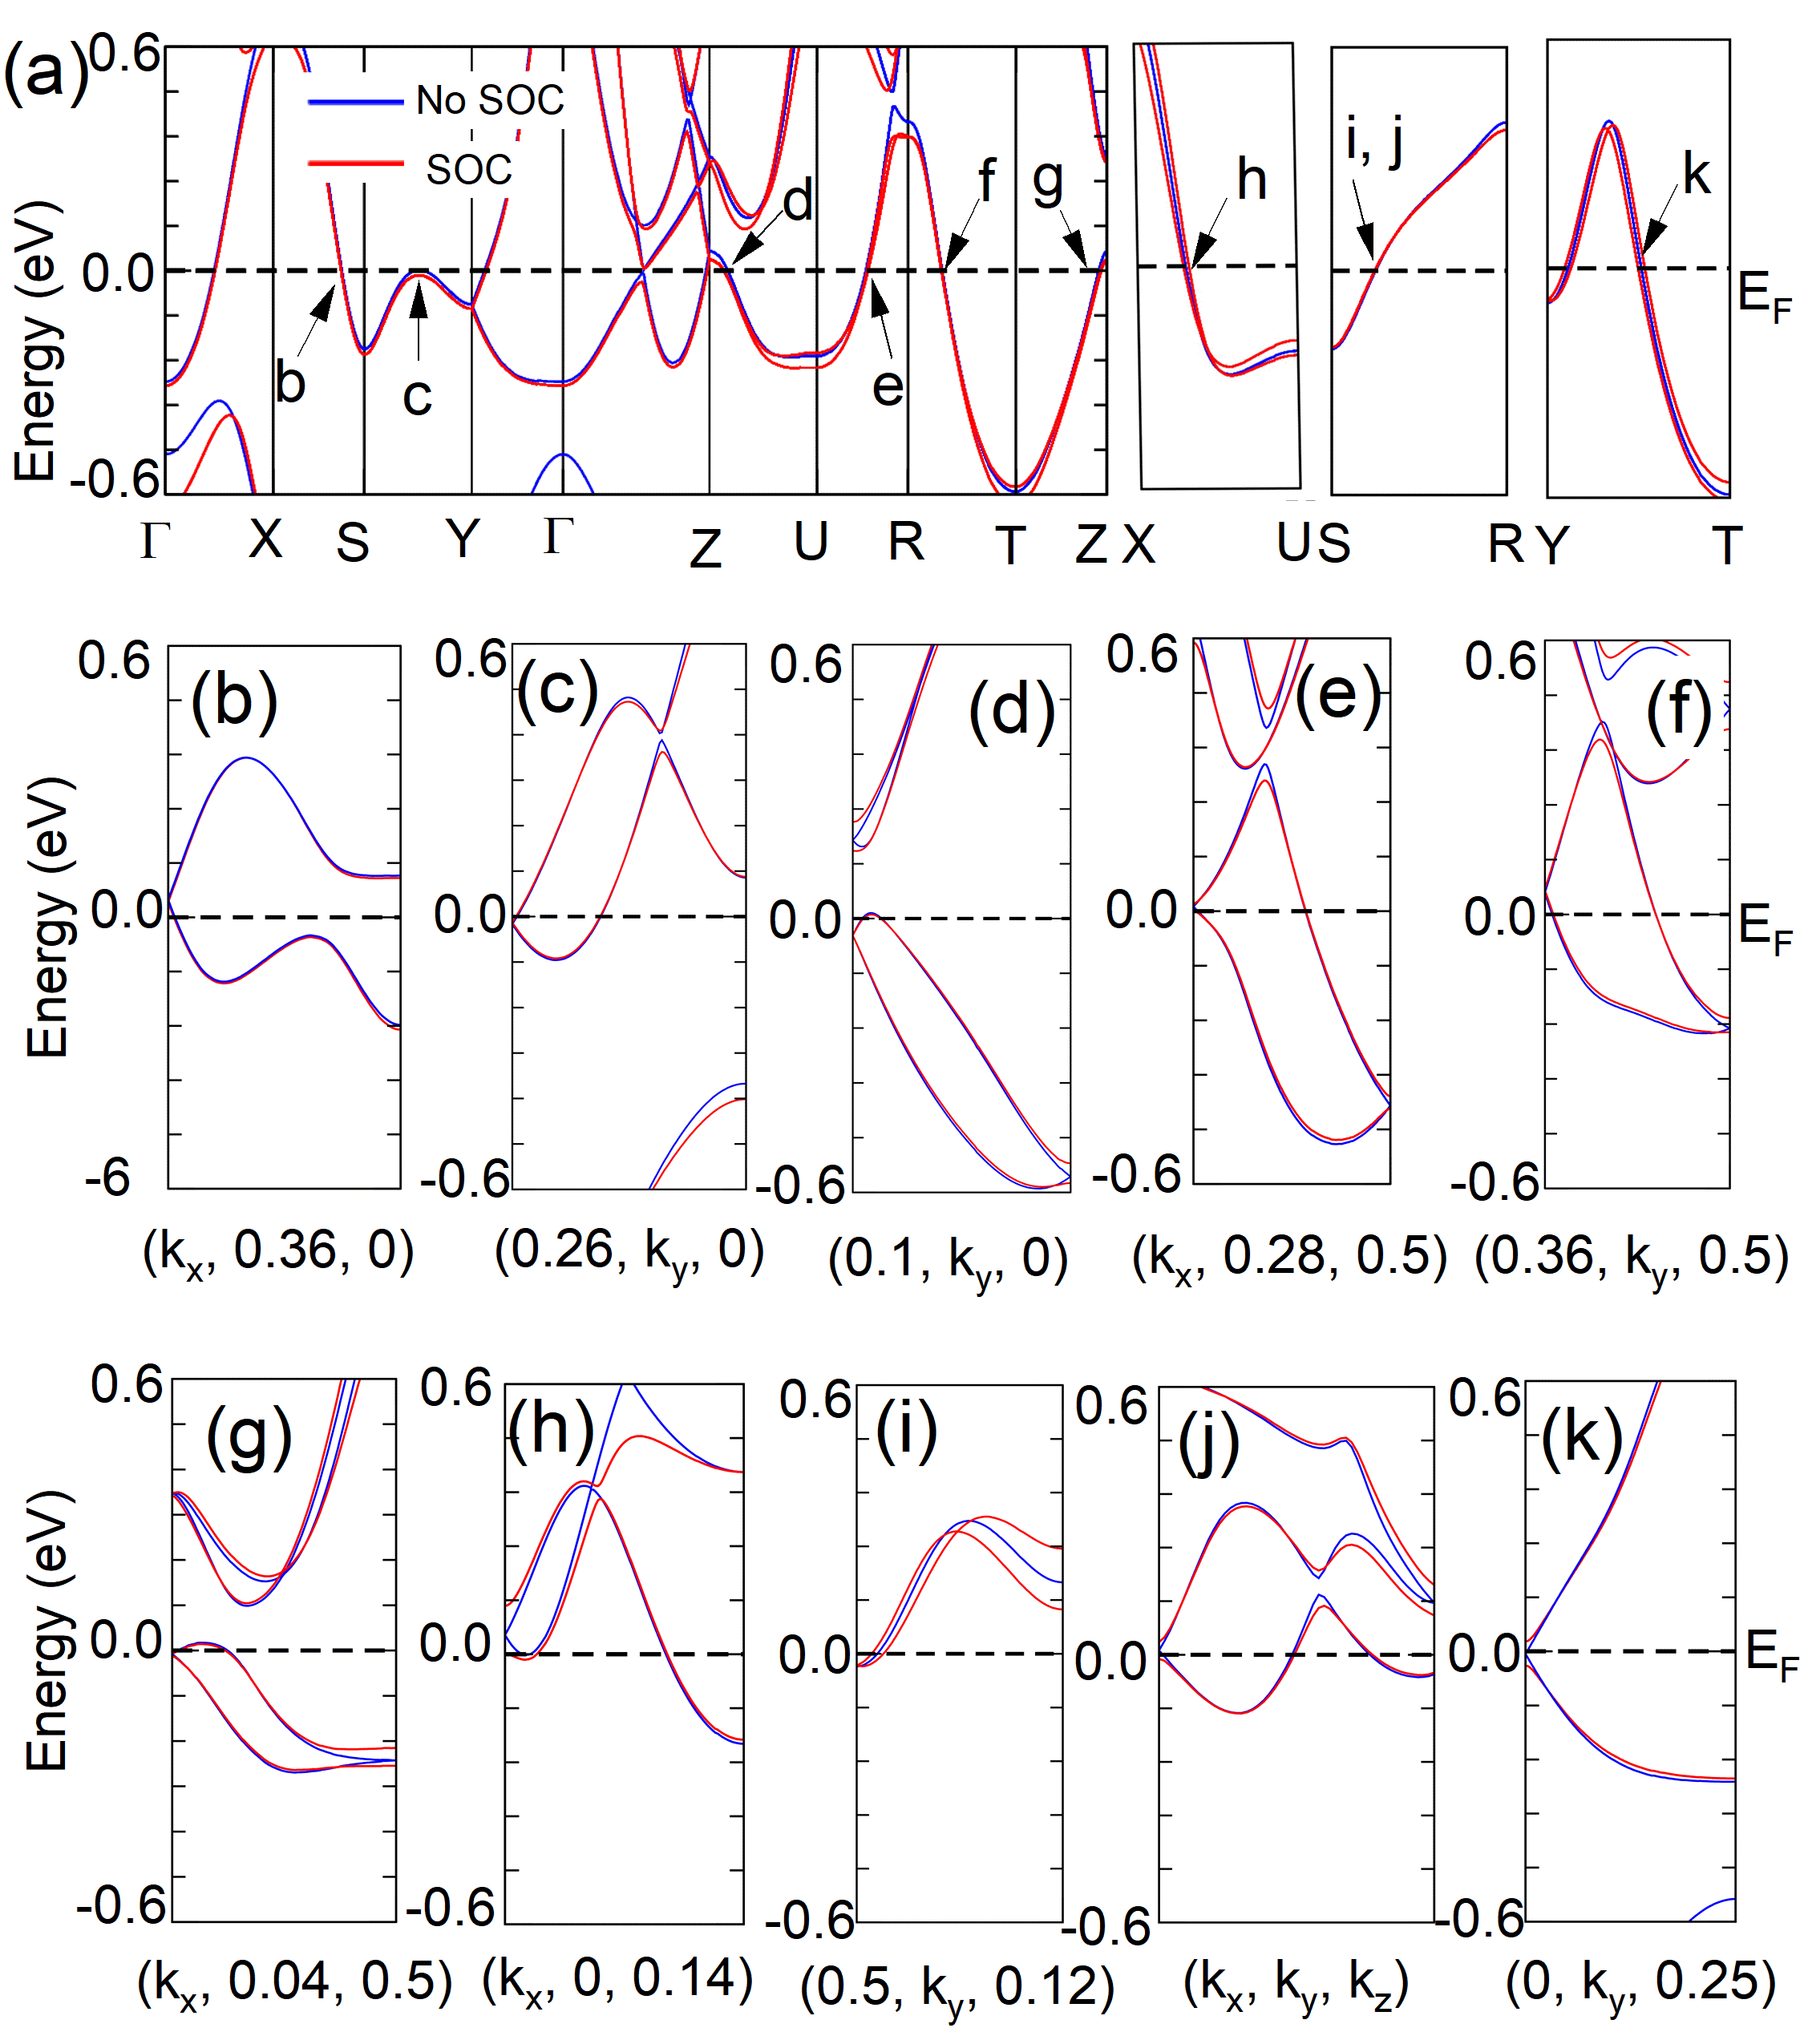
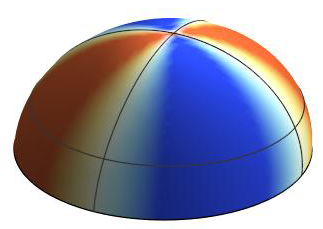
Figure S4(a) shows the band structure calculated with (red lines) and without (blue lines) spin-orbit coupling (SOC) [the latter is the same as the one presented in Fig. 1(a) in the main text]. Bands along the maximum-splitting directions are shown in Figs. S4(b-k) from the corresponding points labelled as b-k in Panel (a) showing how the band degeneracy is lifted when moved away from these points forming the nodal lines at the Fermi surface depicted by the red and blue lines in Fig. 1(b) in the main text. It is to be noted that the Dirac point between S and R labelled by i, j in Panel (a) is a special point where the bands remain degenerate along , , and as shown in Fig. S4(i) (moving along ; same behavior is observed moving along , and that are not shown here). The the degeneracy is lifted in-between as shown by a representative plot calculated from (0.3, 0.5, 0.14) to (0, 0, 0.25) and schematically illustrated by the four-fold symmetry in Fig. S5. The Dirac points b, c and i in Fig. S4(a) [see Figs. S4(b, c and i)] are symmetry protected and do not open gap with SOC, consistent with the prediction of ref. 13. SOC opens gaps at all other Dirac points indicated in Fig. S4(a) [see Figs. S4(d, e, f, g, h, j, and k)].
S5 Magnetoresistance and Thermal Conductivity
