Dynamic polarizability of the 85Rb -state in 1064 nm light
Abstract
We report a measurement of the dynamic (ac) scalar polarizability of the state in 85Rb atoms at a laser wavelength of 1064 nm. Contrary to a recent measurement in Phys. Rev. A 104, 063304 (2021), the experiments are performed in a low-intensity regime in which the ac shift is less than the state’s hyperfine structure, as utilized in numerous experiments with cold, trapped atoms. The extracted ac polarizability is a.u., within the uncertainty of the aforementioned previous result. The calibration of the 1064 nm light intensity, performed by analyzing light shifts of the D1 line, is the main source of uncertainty. Our results are useful for applications of the Rb state in metrology, quantum sensing, and fundamental-physics research on Rydberg atoms and molecules.
I Introduction
Precision measurements of atomic structure and properties are of major importance for a wide range of applications including optical atomic clocks Ludlow et al. (2015); Bloom et al. (2014); Martin et al. (2018), quantum computing and simulations Saffman (2016); Morgado and Whitlock (2021), and field sensing Sedlacek et al. (2012); Holloway et al. (2014); Anderson et al. (2020, 2021). Atom-field interactions are an essential tool in a variety of these topics, as quite often it is required to trap neutral atoms, perform optical or microwave excitations and enhance or mitigate certain effects. Shifts of atomic energy levels due to the ac Stark effect Delone and Krainov (1999); Gerginov and Beloy (2018); Martin et al. (2019), , can be listed among such effects and are described (in terms of the local field intensity ) by
| (1) |
where is the ac polarizability of an atomic state at the wavelength of the applied field, , is the speed of light, and is the vacuum permittivity. Determination of is crucial for applications of certain atomic or molecular states that involve atom-field interactions Marinescu et al. (1994a); Safronova et al. (2006); Topcu and Derevianko (2013); Le Kien et al. (2013) including laser cooling and trapping Metcalf and van der Straten (1999), quantum control Patsch et al. (2018); Cardman and Raithel (2020) and optical clocks Ludlow et al. (2015); Bloom et al. (2014); Martin et al. (2018).
In this paper, we report a measurement of for the state of 85Rb atom at nm. This wavelength is widely used for optical dipole traps and lattices for both neutral atoms Grimm et al. (2000) and ions Weckesser et al. (2021) because it is a commonly available wavelength emitted at high optical powers from diode and Nd:YAG fiber lasers. A recent measurement at this wavelength yielded a result of (in atomic units) Cardman et al. (2021a). The experiment in Cardman et al. (2021a) was performed at an intensity on the order of 100 GW/m2, which is high enough to decouple the hyperfine (HF) structure and to cause large broadening due to photoionization (PI), as 1064 nm is above the PI threshold of the state (1251.52 nm). However, it is not always desirable Saffman (2016) or even practical to conduct experiments under such high-intensity conditions. In the present work, we therefore perform two-photon spectroscopy of the ac Stark effect of the state and measure at low intensity of the 1064-nm light, where HF interactions are on the same order as the light shifts.
The states of Rb are of general interest for several reasons. Two-photon transitions between the ground, , and states are relatively strong, narrow and can be driven by lasers in readily accessible visible or NIR ranges. These features make the aforementioned transitions attractive in metrology and as frequency references Nez et al. (1993); Touahri et al. (1997); Hilico et al. (1998); Bernard et al. (2000); Terra and Hussein (2016); Martin et al. (2018); Quinn (2003). Moreover, Rb atoms in states can be excited into Rydberg and states for studies on three-photon EIT Carr et al. (2012); Thaicharoen et al. (2019), Rydberg molecules Duspayev et al. (2021) and spectroscopy of high-angular-momentum Rydberg states Younge et al. (2010); Cardman et al. (2021b). For the Rb state, the static polarizability Snigirev et al. (2014), the HF structure Nez et al. (1993); Terra (2019), the radiative lifetime Sheng et al. (2008), and, recently, the dynamic polarizability at 1064 nm Cardman et al. (2021a) have been measured. In addition, the large PI cross-section of the state Aymar et al. (1984); Duncan et al. (2001); Cardman et al. (2021a) could be used for generation of ultracold plasmas Pohl et al. (2004); Viray et al. (2020) and experiments on atom-ion interactions Schmid et al. (2010); Secker et al. (2016); Ewald et al. (2019); Dieterle et al. (2021).
II Methods
II.1 Theoretical background
Assuming a linearly polarized field, in Eq. 1 can be expressed as
| (2) |
where and are referred to as scalar and tensor dynamic polarizabilities, respectively, with the latter vanishing for states with . The elements of the second-rank tensor depend on the eigenstates of the Hamiltonian that describes the atom-field interaction. Circular polarization components would require an additional term proportional to the vector polarizability, , which is not included in Eq. 2 because in our experiment the light interacting with the atoms is linearly polarized.
Depending on the strength of the applied field, the system can be dominated by the HF structure of the atom (weak-field case), the atom-light coupling (strong-field case) or reside in the intermediate regime. Comparing the system with an atom in an external magnetic field, the first two cases are analogous to the Zeeman and Paschen-Back regimes of the HF structure, respectively. The weak- and strong-field sets of the eigenstates are generally different. In the weak-field regime, the eigenstates of the Hamiltonian are given by the -basis, with HF quantum numbers and . An ac Stark interaction significantly larger than the HF interaction mixes the states, and the set of time-independent states approaches the -basis, with magnetic quantum numbers and denoting electronic and nuclear spin along the lattice laser’s electric-field direction. In the intermediate lattice-intensity regime the time-independent states transition from the low-field into the high-field basis Chen et al. (2015); Neuzner et al. (2015). Analytical expressions for the elements of can be derived in the weak- and strong-field cases (see, e.g., MacLennan (2021)). Under the presence of level broadening due to PI in the lattice-laser field, and if the tensor contribution of the polarizability is small, the transition of the time-independent states from the into the -basis may be blurred, as is the case for Rb state in 1064-nm light. A previous measurement of Cardman et al. (2021a) has been performed in the strong-field regime. In the present work, we conduct an experiment in the low-field regime. In the case that there are no unaccounted-for systematic errors in either of the measurements, the polarizabilities derived from the data should agree between low- and high-field measurements. The experimental challenges of the present low-field measurement and the methods employed to address them are described in Sec. II.4.
II.2 Experimental setup
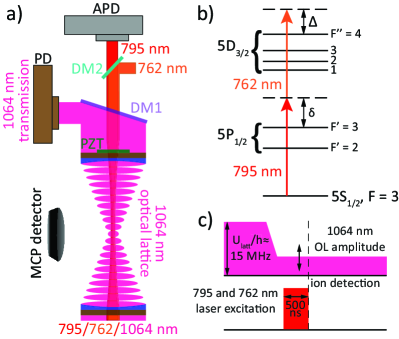
Our measurements are performed using 85Rb atoms cooled within an intracavity optical lattice (OL). Detailed design and characterization of the utilized setup are provided in Chen et al. (2014). The essential aspects of the apparatus are shown in Fig. 1 (a). Rb atoms are cooled and trapped in a 3D magneto-optical trap (MOT), from which they are loaded into a vertically oriented OL formed using a TEM00-mode of a near-concentric in-vacuum optical cavity. The OL laser has a wavelength of 1064 nm, for which is obtained. In addition to generating the light-shifts to be measured, the lattice light also photo-ionizes the atoms, which broadens the atomic levels and serves as a method for -population readout via ion counting.
Two probe-laser beams at 795 nm and 762 nm (powers 1 W and 50 W before the cavity, respectively), are tuned by the means of two optical phase-locked loops (OPLLs) relative to fixed-frequency reference lasers that are locked to the relevant atomic transitions via saturated spectroscopy in Rb vapor cells. The probe lasers are coupled to the cavity to drive atoms from the state to different HF states of the level via the intermediate state, as shown in the level diagram in Fig. 1 (b) (magnetic quantum numbers suppressed in the kets). Throughout the data acquisition, the 795 nm laser is held at a fixed frequency with a detuning of GHz with respect to field-free transition. We scan the 762 nm laser frequency in 250-kHz steps to excite the Rb atoms into different HF states, . The detuning of the two-photon transition from the transition is denoted , as indicated in Fig. 1 (b). We choose sufficiently large such that the observed spectra are the result of pure two-photon transitions without significant influence of the state’s HF structure ( MHz Steck (revision 2021)). Detailed schematics of cavity-mode stabilization and OPLLs are provided in Cardman et al. (2021a).
After 10 ms of OL loading (full OL trap depth for atoms in the -level during the loading stage is MHz), the OL power is ramped down by means of an acousto-optical modulator [not shown in Fig. 1 (a)] to a variable level, during which the 500 ns-long laser excitation is performed [see timing diagram in Fig. 1 (c)]. The ions produced by PI due to 1064 nm light are guided through the electric-potential landscape applied via 6 electrodes [not shown in Fig. 1 (a)] that surround the optical cavity to a multichannel plate (MCP) detector. Ion spectra at each power level of 1064 nm light are recorded for the subsequent analysis of the ac Stark shifts.
The ion signal observed at the lowest powers of 1064 nm light is, in part, attributed to Penning ionization, a process that has been found to be very effective in collisions of atoms in the state Barbier et al. (1987); Barbier and Cheret (1987). Investigation of Penning and other ionization processes Cheret et al. (1982); Barbier et al. (1986) using setups similar to ours is beyond the scope of the present work but could be a topic of future studies.
II.3 1064 nm power calibration
As in similar measurements Dinneen et al. (1992); Duncan et al. (2001), it is important to properly calibrate the 1064 nm light intensity at the location of the atoms, . This is accomplished by measuring the transmitted 1064 nm power after the cavity output port with a photo-diode [PD in Fig. 1 (a)] that is connected to a transimpedance converter with a fixed gain (output voltage divided by photo-current). The transmitted power is proportional to the recorded voltage, denoted . Due to the linearity of the electronic circuit and the proportionality between and the power transmitted through the cavity, it is .
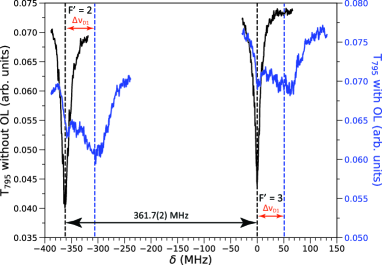
To obtain the calibration factor , we measure 795-nm transmission spectra of the Rb D1 line in the absence of 762 nm light for several OL intensities, for which the corresponding voltages are recorded. To avoid saturation, we decrease the 795-nm power beam to 50 nW as measured in front of the cavity. An avalanche photodetector [APD in Fig. 1 (a)] installed after the cavity output port records the transmission of 795-nm light, (see Fig. 2 for an example). Appropriate dichroic mirrors [DM1 and DM2 in Fig. 1 (a)] eliminate the 762 nm and 1064 nm beams from the 795 nm transmission signal. Using known dynamic scalar polarizabilities of Bonin and Kadar-Kallen (1993); Marinescu et al. (1994b); Arora and Sahoo (2012) and states Neuzner et al. (2015) in 85Rb at 1064 nm, the following expression for the ac Stark shift of the D1 line, , follows from Eq. 1:
| (3) |
The AC shifts are measured by comparing -line spectra with the OL turned off and on, as shown in Fig. 2. The measurements of and corresponding transmitted-power readings then allow us to determine the calibration factor . As the level has two HF states, we determine for each of them by multi-peak Gaussian fits and use both values to extract as a weighted average. This allows us to reduce the uncertainty of . The result for and its uncertainty are shown in Table 1.
The uncertainty in the recorded values and the uncertainty of lead to final uncertainties of , using error propagation Taylor (1996). These are the main sources of uncertainty in the value of obtained in the next section.
II.4 Extracting
We extract ac Stark shifts, , of different HF components of the state by fitting Gaussian multi-peak profiles to the ion spectra. For the latter, we either acquire 5 to 10 scans and average them (at lowest 1064 nm power) or use single scans at good signal-to-noise ratios (at higher 1064 nm power, where PI is the most effective). Due to the HF structure of the Rb state, the spectral lines from the two lowest HF states, and coalesce at lattice depths MHz (see Fig. 3). Therefore, we restrict our data analysis to the and HF states, which are split by 18.6 MHz Nez et al. (1993) and shift linearly with :
| (4) |
with a fitting parameter that is related to as shown below in Eq. 5. Since the measurements are performed at low intensities of 1064 nm light and at large , the excitation of the atoms in the OL field is an off-resonant two-photon excitation in which the intermediate states do not become populated. Hence, ac-Stark-shifts of the states caused by the OL do not enter into Eq. 4, and the polarizability of the -state is not explicitly required. [Note that the experimental intensity calibration factor , which is critical to extract the polarizability, does require the polarizability of the -state.] With the experimental calibration factor , and utilizing the finding that the tensor polarizability is too small to produce measurable effects Cardman et al. (2021a), Eqs. 1 and 4 yield
| (5) |
Since we analyze ac shifts of the two HF states and , the final measurement result is reported in Table 1 as a weighted average over two values.
| Quantity | Value | Source |
|---|---|---|
| 37(3) GW/m2/V | This experiment | |
| 687.3(5) a.u. | Arora and Sahoo (2012) | |
| -1226(18) a.u. | Neuzner et al. (2015) | |
| 5.59(39) MHz/GW/m2 | This experiment | |
| 5.54(39) MHz/GW/m2 | This experiment | |
| -505(84) a.u. | Eq. 5 | |
| -494(83) a.u. | Eq. 5 | |
| -499(59) a.u. | Weighted average |
III Results and Discussion
III.1 Determination of
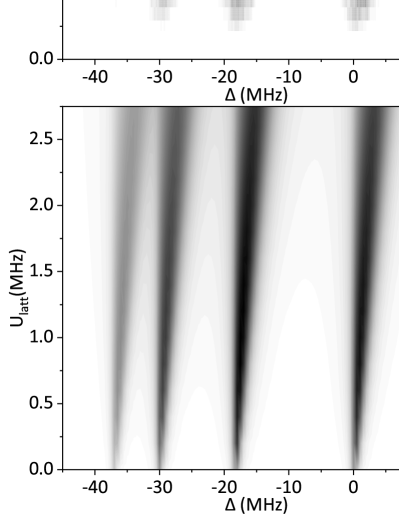
The obtained ion spectra at calibrated are shown in Fig. 3 (a). In a first cursory analysis, we compare the experimental spectra with a numerical simulation. The close resemblance of the experimental data with the results of the numerical simulations in Fig. 3 (b) is apparent. We attribute the larger broadening of the experimental spectra to the combined effects of the linewidths of the excitation lasers (both on the order of several 100 kHz), OL power fluctuations in the field enhancement cavity, and the MOT magnetic fields. The Penning ionization process mentioned in Sec. II.4, which is not included in our simulation, may enhance the experimental level broadening at low lattice depths . Moreover, the dominance of light-shift effects in the present system over Doppler effects has led us to adopt a “frozen” Boltzmann distribution of atoms in the simulation, which does not account for atomic-motion effects in the OL. Apart from the fact that the HF component is somewhat weaker in the experiment than in the simulation, experimental and simulated data exhibit good qualitative agreement.
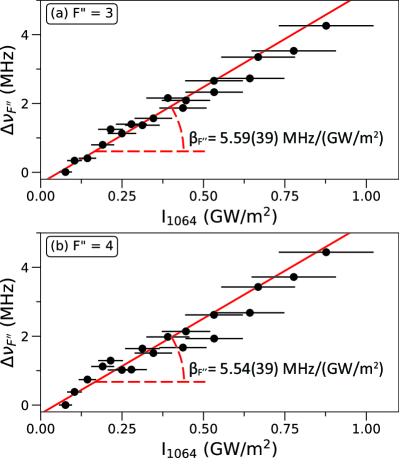
For a quantitative analysis, we extract for the and 4 HF components and follow the procedure described in Sec. II.4. The results (dots) together with the fitting to Eq. 4 (solid lines) are shown in Figs. 4 (a) and (b) for and , respectively. The horizontal error bars are from the calibration of , as explained in Sec. II.3, while the vertical error bars (which are smaller than the dots) reflect statistical uncertainties from the fits to the experimental spectra. It is apparent from Figs. 4 (a) and (b) that the error bars due to the calibration is the dominant source of uncertainty on (see Table 1). We use only the two upper HF levels and for the data analysis because only these levels are well-discerned throughout the range of the applied -values. The lower levels and coalesce already at moderate due to their small HF splitting (see Fig. 3), making the spectral fits unstable for those levels.
The extracted values for of the and 4 HF components as well as their weighted average are listed in Table 1. The final result, a.u., agrees within the uncertainty range with the previously reported value Cardman et al. (2021a). The final uncertainty in the present paper is larger by a factor of 3.5 due to the sensitivity of the result to the calibration error in for the 1064 nm light intensity.
III.2 Discussion of the result for
The value of the present -measurement relies on the fact that it is obtained in a different intensity regime than that used in Cardman et al. (2021a) (low- vs high-intensity limit). The present measurement is performed in the low-intensity regime, in which laser intensities are on the same order of magnitude as in contemporary cold-atom research Anderson et al. (2011); Gross and Bloch (2017); Chomaz et al. (2022); Cardman and Raithel (2020). The present measurement and the measurement in Cardman et al. (2021a) exhibit different sets of systematic uncertainties. The observed agreement in -values, within uncertainty limits, confirms the earlier result Cardman et al. (2021a) and asserts that there are no critical omissions in the systematic effects affecting either of the measurements.
It is noteworthy that a previous theoretical analysis in Cardman et al. (2021a) suggests that the dynamic tensor polarizability of the state, is very small. According to Eq. 2, a substantial would cause a dependence of the ac shifts in Figs. 3 and 4 and of the -values in Table 1 on the upper HF state . Further, a substantial would cause line splittings of the levels in Figs. 3 and 4. The absence of such evidence in the measurements is consistent with . An actual measurement of is hampered, if not made impossible, by the line broadening in Figs. 3 and 4, which is almost entirely due to PI of atoms by the 1064-nm OL light.
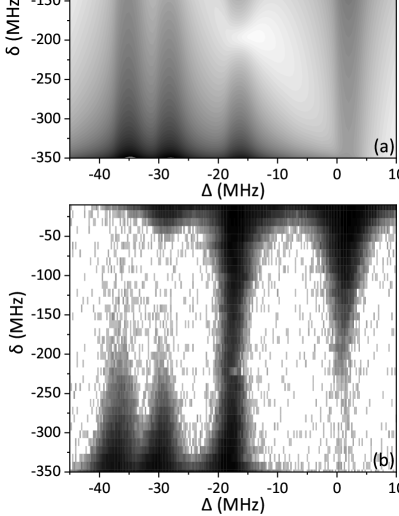
III.3 Quantum interference at
The measurements reported above are performed at a large positive detuning, , from the transition to avoid any influence of the Rb -state HF structure on the result. In order to explore how the HF structure affects the two-color excitation spectra, we have performed additional simulations at MHz with varied between -10 MHz and -350 MHz, scanning most of the range between and . The obtained simulated map is shown in Fig. 5 (a) as a function of and as defined in Fig. 1 (b). In this representation, the -resonances would appear as signal maxima lined up along horizontal lines at MHz and 0 [just off-scale in Fig. 5 (a)], while the -resonances appear as vertical bars at -values given by the respective HF shifts. The signal in Fig. 5 (a) is characterized by some amount of line broadening along due to lattice-induced PI, which sets a floor of several MHz for the linewidth in . When approaching MHz and along the -axis, the signals become stronger and substantially broadened due to the near-resonant excitation of -atoms through the intermediate and levels, respectively. In Fig. 5 (a) we further observe signal dropouts on the and -lines near MHz and MHz. The dropouts are due to quantum interference in the excitation amplitudes of the and HF states. As is varied, the two-photon Rabi frequencies of the excitation channels and vary in relative strength due to their different, -dependent intermediate detunings. For and 3 both two-photon Rabi frequencies are non-zero and have opposite signs in the displayed -range. Hence, at certain values destructive interference must occur, causing the signal dropouts in Fig. 5 (a).
In corresponding experimental data shown in Fig. 5 (b) we generally observe the simulated behavior. Notable differences include the large strength of the -signal throughout the experimental data, as well as differences in the prominence of the signal dropouts caused by the destructive quantum interference. The discrepancies may be caused by optical-pumping and atomic-motion effects, which were both not included in the simulation. An improved numerical model, which is beyond the scope of the present work, may include the center-of-mass dynamics of the atoms on the lattice potentials. Certain techniques from computational molecular dynamics, such as fewest-switches surface-hopping method Tully (1990); Craig et al. (2005), could be employed for this purpose in future studies.
IV Conclusion
In summary, we have reported a measurement of the dynamic polarizability of the Rb state in 1064 nm optical fields in the “Zeeman” regime, where the ac shifts are less than the hyperfine splittings. Our results show that the ac shifts of the HF states approach the HF splittings already at moderate 1064-nm intensities, equivalent to commonly used optical-trap depths. Owing to the large PI cross-section at 1064-nm wavelength, the spectroscopic lines exhibit significant broadening effects. In metrological applications Hilico et al. (1998); Terra and Hussein (2016); Martin et al. (2018); Quinn (2003) of cold Rb atoms in 1064-nm laser traps, both ac shifts and PI broadening will have to be accounted for and minimized as needed. Future studies could be directed towards precise determination of the tensor contribution to the total polarizability, which was neglected in our analysis. To characterize the response of the state to optical fields at a precision sufficient for this purpose, such studies could be performed at wavelengths longer than the PI threshold (1251.52 nm for Rb ). Ac shifts and PI broadening should also be taken into account when using the Rb state as an intermediate excitation level in experiments on Rydberg atoms and molecules Thaicharoen et al. (2019); Duspayev et al. (2021); Younge et al. (2010); Cardman et al. (2021b). Conversely, PI of Rb atoms provides an efficient method to prepare cold ion clouds for research on non-neutral plasmas, allowing studies of highly-excited Rydberg atoms immersed in such plasmas Secker et al. (2016); Ewald et al. (2019); Weber et al. (2012); Anderson et al. (2017); Ma et al. (2020).
ACKNOWLEDGMENTS
This work was supported by the NSF Grant No. PHY-2110049. We would like to thank Dr. Yun-Jhih Chen, Dr. Xiaoxuan Han and Dr. Jamie MacLennan for useful discussions and initial experimental work.
References
- Ludlow et al. (2015) A. D. Ludlow, M. M. Boyd, J. Ye, E. Peik, and P. O. Schmidt, “Optical atomic clocks,” Rev. Mod. Phys. 87, 637–701 (2015).
- Bloom et al. (2014) B. J. Bloom, T. L. Nicholson, J. R. Williams, S. L. Campbell, M. Bishof, X. Zhang, W. Zhang, S. L. Bromley, and J. Ye, “An optical lattice clock with accuracy and stability at the 10-18 level,” Nature 506, 71–75 (2014).
- Martin et al. (2018) K. W. Martin, G. Phelps, N. D. Lemke, M. S. Bigelow, B. Stuhl, M. Wojcik, M. Holt, I. Coddington, M. W. Bishop, and J. H. Burke, “Compact optical atomic clock based on a two-photon transition in rubidium,” Phys. Rev. Applied 9, 014019 (2018).
- Saffman (2016) M. Saffman, “Quantum computing with atomic qubits and Rydberg interactions: progress and challenges,” J. Phys. B 49, 202001 (2016).
- Morgado and Whitlock (2021) M. Morgado and S. Whitlock, “Quantum simulation and computing with Rydberg-interacting qubits,” AVS Quantum Science 3, 023501 (2021).
- Sedlacek et al. (2012) J. A. Sedlacek, A. Schwettmann, H. Kübler, R. Löw, T. Pfau, and J. P. Shaffer, “Microwave electrometry with Rydberg atoms in a vapour cell using bright atomic resonances,” Nat. Phys. 8, 819–824 (2012).
- Holloway et al. (2014) C. L. Holloway, J. A. Gordon, S. Jefferts, A. Schwarzkopf, D. A. Anderson, S. A. Miller, N. Thaicharoen, and G. Raithel, “Broadband Rydberg atom-based electric-field probe for SI-traceable, self-calibrated measurements,” IEEE Trans. Antennas Propag. 62, 6169–6182 (2014).
- Anderson et al. (2020) D. A. Anderson, R. E. Sapiro, and G. Raithel, “Rydberg atoms for radio-frequency communications and sensing: Atomic receivers for pulsed rf field and phase detection,” IEEE Aerosp. Electron. Syst. Mag. 35, 48–56 (2020).
- Anderson et al. (2021) D. A. Anderson, R. E. Sapiro, and G. Raithel, “A self-calibrated SI-traceable Rydberg atom-based radio frequency electric field probe and measurement instrument,” IEEE Trans. Antennas Propag. 69, 5931–5941 (2021).
- Delone and Krainov (1999) N. B. Delone and V. P. Krainov, “AC Stark shift of atomic energy levels,” Physics-Uspekhi 42, 669–687 (1999).
- Gerginov and Beloy (2018) V. Gerginov and K. Beloy, “Two-photon optical frequency reference with active ac Stark shift cancellation,” Phys. Rev. Applied 10, 014031 (2018).
- Martin et al. (2019) K. W. Martin, B. Stuhl, J. Eugenio, M. S. Safronova, G. Phelps, J. H. Burke, and N. D. Lemke, “Frequency shifts due to Stark effects on a rubidium two-photon transition,” Phys. Rev. A 100, 023417 (2019).
- Marinescu et al. (1994a) M. Marinescu, H. R. Sadeghpour, and A. Dalgarno, “Dynamic dipole polarizabilities of rubidium,” Phys. Rev. A 49, 5103 (1994a).
- Safronova et al. (2006) M. S. Safronova, B. Arora, and C. W. Clark, “Frequency-dependent polarizabilities of alkali-metal atoms from ultraviolet through infrared spectral regions,” Phys. Rev. A 73, 022505 (2006).
- Topcu and Derevianko (2013) T. Topcu and A. Derevianko, “Dynamic polarizability of Rydberg atoms: Applicability of the near-free-electron approximation, gauge invariance, and the dirac sea,” Phys. Rev. A 88, 042510 (2013).
- Le Kien et al. (2013) F. Le Kien, P. Schneeweiss, and A. Rauschenbeutel, “Dynamical polarizability of atoms in arbitrary light fields: general theory and application to cesium,” Eur. Phys. J. D 67, 92 (2013).
- Metcalf and van der Straten (1999) H. Metcalf and P. van der Straten, Laser Cooling and Trapping, Vol. 3 (Springer-Verlag, New York, 1999).
- Patsch et al. (2018) S. Patsch, D. M. Reich, J.-M. Raimond, M. Brune, S. Gleyzes, and C. P. Koch, “Fast and accurate circularization of a Rydberg atom,” Phys. Rev. A 97, 053418 (2018).
- Cardman and Raithel (2020) R. Cardman and G. Raithel, “Circularizing Rydberg atoms with time-dependent optical traps,” Phys. Rev. A 101, 013434 (2020).
- Grimm et al. (2000) R. Grimm, M. Weidemüller, and Y. B. Ovchinnikov, “Optical dipole traps for neutral atoms,” Adv. At. Mol.,Opt. Phys., 42, 95–170 (2000).
- Weckesser et al. (2021) P. Weckesser, F. Thielemann, D. Hoenig, A. Lambrecht, L. Karpa, and T. Schaetz, “Trapping, shaping, and isolating of an ion Coulomb crystal via state-selective optical potentials,” Phys. Rev. A 103, 013112 (2021).
- Cardman et al. (2021a) R. Cardman, X. Han, J. L. MacLennan, A. Duspayev, and G. Raithel, “ac polarizability and photoionization-cross-section measurements in an optical lattice,” Phys. Rev. A 104, 063304 (2021a).
- Nez et al. (1993) F. Nez, F. Biraben, R. Felder, and Y. Millerioux, “Optical frequency determination of the hyperfine components of the 5S1/2-5D3/2 two-photon transitions in rubidium,” Opt. Comm. 102, 432–438 (1993).
- Touahri et al. (1997) D. Touahri, O. Acef, A. Clairon, J.-J. Zondy, R. Felder, L. Hilico, B. de Beauvoir, F. Biraben, and F. Nez, “Frequency measurement of the 5S1/2(F = 3)-5D5/2(F = 5) two-photon transition in rubidium,” Opt. Comm. 133, 471–478 (1997).
- Hilico et al. (1998) L. Hilico, R. Felder, D. Touahri, O. Acef, A. Clairon, and F. Biraben, “Metrological features of the rubidium two-photon standards of the BNM-LPTF and Kastler Brossel laboratories,” Eur. Phys. J. AP 4, 219–225 (1998).
- Bernard et al. (2000) J. E. Bernard, A. A. Madej, K. J. Siemsen, L. Marmet, C. Latrasse, D. Touahri, M. Poulin, M. Allard, and M. Têtu, “Absolute frequency measurement of a laser at 1556 nm locked to the 5-5 two-photon transition in 87Rb,” Opt. Comm. 173, 357–364 (2000).
- Terra and Hussein (2016) O. Terra and H. Hussein, “An ultra-stable optical frequency standard for telecommunication purposes based upon the two-photon transition in rubidium,” Appl. Phys. B 122, 27 (2016).
- Quinn (2003) T. J. Quinn, “Practical realization of the definition of the metre, including recommended radiations of other optical frequency standards (2001),” Metrologia 40, 103–133 (2003).
- Carr et al. (2012) C. Carr, M. Tanasittikosol, A. Sargsyan, D. Sarkisyan, C. S. Adams, and K. J. Weatherill, “Three-photon electromagnetically induced transparency using Rydberg states,” Opt. Lett. 37, 3858–3860 (2012).
- Thaicharoen et al. (2019) N. Thaicharoen, K.R. Moore, D.A. Anderson, R.C. Powel, E. Peterson, and G. Raithel, “Electromagnetically induced transparency, absorption, and microwave-field sensing in a Rb vapor cell with a three-color all-infrared laser system,” Phys. Rev. A 100, 063427 (2019).
- Duspayev et al. (2021) A. Duspayev, X. Han, M. A. Viray, L. Ma, J. Zhao, and G. Raithel, “Long-range Rydberg-atom–ion molecules of Rb and Cs,” Phys. Rev. Research 3, 023114 (2021).
- Younge et al. (2010) K. C. Younge, S. E. Anderson, and G. Raithel, “Adiabatic potentials for Rydberg atoms in a ponderomotive optical lattice,” New J. Phys. 12, 023031 (2010).
- Cardman et al. (2021b) R. Cardman, J. L. MacLennan, S. E. Anderson, Y.-J. Chen, and G. A. Raithel, “Photoionization of Rydberg atoms in optical lattices,” New J. Phys. 23, 063074 (2021b).
- Snigirev et al. (2014) S. Snigirev, A. Golovizin, D. Tregubov, S. Pyatchenkov, D. Sukachev, A. Akimov, V. Sorokin, and N. Kolachevsky, “Measurement of the 5D-level polarizability in laser-cooled Rb atoms,” Phys. Rev. A 89, 012510 (2014).
- Terra (2019) O. Terra, “Absolute frequency measurement of the hyperfine structure of the 5S1/2 – 5D3/2 two-photon transition in rubidium using femtosecond frequency comb,” Measurement 144, 83–87 (2019).
- Sheng et al. (2008) D. Sheng, A. Pérez Galván, and L. A. Orozco, “Lifetime measurements of the states of rubidium,” Phys. Rev. A 78, 062506 (2008).
- Aymar et al. (1984) M. Aymar, O. Robaux, and S. Wane, “Central-field calculations of photoionisation cross sections of excited states of Rb and Sr+ and analysis of photoionisation cross sections of excited alkali atoms using quantum defect theory,” J. Phys. B 17, 993–1007 (1984).
- Duncan et al. (2001) B. C. Duncan, V. Sanchez-Villicana, P. L. Gould, and H. R. Sadeghpour, “Measurement of the Rb (5 D5/2) photoionization cross section using trapped atoms,” Phys. Rev. A 63, 043411 (2001).
- Pohl et al. (2004) T. Pohl, T. Pattard, and J. M. Rost, “Coulomb crystallization in expanding laser-cooled neutral plasmas,” Phys. Rev. Lett. 92, 155003 (2004).
- Viray et al. (2020) M. A. Viray, S. A. Miller, and G. Raithel, “Coulomb expansion of a cold non-neutral rubidium plasma,” Phys. Rev. A 102, 033303 (2020).
- Schmid et al. (2010) S. Schmid, A. Härter, and J. H. Denschlag, “Dynamics of a cold trapped ion in a Bose-Einstein condensate,” Phys. Rev. Lett. 105, 133202 (2010).
- Secker et al. (2016) T. Secker, R. Gerritsma, A. W. Glaetzle, and A. Negretti, “Controlled long-range interactions between Rydberg atoms and ions,” Phys. Rev. A 94, 013420 (2016).
- Ewald et al. (2019) N. V. Ewald, T. Feldker, H. Hirzler, H. A. Fürst, and R. Gerritsma, “Observation of interactions between trapped ions and ultracold Rydberg atoms,” Phys. Rev. Lett. 122, 253401 (2019).
- Dieterle et al. (2021) T. Dieterle, M. Berngruber, C. Hölzl, R. Löw, K. Jachymski, T. Pfau, and F. Meinert, “Transport of a single cold ion immersed in a Bose-Einstein condensate,” Phys. Rev. Lett. 126, 033401 (2021).
- Chen et al. (2015) Y.-J. Chen, L. F. Gonçalves, and G. Raithel, “Measurement of Rb scalar and tensor polarizabilities in a 1064-nm light field,” Phys. Rev. A 92, 060501(R) (2015).
- Neuzner et al. (2015) A. Neuzner, M. Körber, S. Dürr, G. Rempe, and S. Ritter, “Breakdown of atomic hyperfine coupling in a deep optical-dipole trap,” Phys. Rev. A 92, 053842 (2015).
- MacLennan (2021) J. L. MacLennan, Rydberg Molecules and Excitation of Lattice-Mixed Rydberg States in a Deep Ponderomotive Optical Lattice, Ph.D. thesis, The University of Michigan (2021).
- Chen et al. (2014) Y.-J. Chen, S. Zigo, and G. Raithel, “Atom trapping and spectroscopy in cavity-generated optical potentials,” Phys. Rev. A 89, 063409 (2014).
- Steck (revision 2021) D. A. Steck, “Rubidium 85 D line data,” (revision 2021).
- Barbier et al. (1987) L. Barbier, A. Pesnelle, and M. Cheret, “Theoretical interpretation of Penning and associative ionisation in collisions between two excited rubidium atoms,” J. Phys. B 20, 1249–1260 (1987).
- Barbier and Cheret (1987) L. Barbier and M. Cheret, “Experimental study of Penning and Hornbeck-Molnar ionisation of rubidium atoms excited in a high s or d level (5dnl11s),” J. Phys. B 20, 1229–1248 (1987).
- Cheret et al. (1982) M. Cheret, L. Barbier, W. Lindinger, and R. Deloche, “Penning and associative ionisation of highly excited rubidium atoms,” J. Phys. B 15, 3463–3477 (1982).
- Barbier et al. (1986) L. Barbier, M. T. Djerad, and M. Chéret, “Collisional ion-pair formation in an excited alkali-metal vapor,” Phys. Rev. A 34, 2710–2718 (1986).
- Dinneen et al. (1992) T. P. Dinneen, C. D. Wallace, K.-Y. N. Tan, and P. L. Gould, “Use of trapped atoms to measure absolute photoionization cross sections,” Opt. Lett. 17, 1706–1708 (1992).
- Bonin and Kadar-Kallen (1993) K. D. Bonin and M. A. Kadar-Kallen, “Theory of the light-force technique for measuring polarizabilities,” Phys. Rev. A 47, 944–960 (1993).
- Marinescu et al. (1994b) M. Marinescu, H. R. Sadeghpour, and A. Dalgarno, “Dynamic dipole polarizabilities of rubidium,” Phys. Rev. A 49, 5103–5104 (1994b).
- Arora and Sahoo (2012) B. Arora and B. K. Sahoo, “State-insensitive trapping of rb atoms: Linearly versus circularly polarized light,” Phys. Rev. A 86, 033416 (2012).
- Taylor (1996) J. R. Taylor, An Introduction to Error Analysis: The Study of Uncertainties in Physical Measurements, 2nd ed. (University Science Books, Sausalito, CA, 1996).
- Anderson et al. (2011) S. E. Anderson, K. C. Younge, and G. Raithel, “Trapping Rydberg atoms in an optical lattice,” Phys. Rev. Lett. 107, 263001 (2011).
- Gross and Bloch (2017) C. Gross and I. Bloch, “Quantum simulations with ultracold atoms in optical lattices,” Science 357, 995–1001 (2017).
- Chomaz et al. (2022) L. Chomaz, I. Ferrier-Barbut, F. Ferlaino, B. Laburthe-Tolra, B. L. Lev, and T. Pfau, “Dipolar physics: A review of experiments with magnetic quantum gases,” arXiv:2201.02672 (2022).
- Tully (1990) J. C. Tully, “Molecular dynamics with electronic transitions,” J. Chem. Phys. 93, 1061 (1990).
- Craig et al. (2005) C. F. Craig, W. R. Duncan, and O. V. Prezhdo, “Trajectory surface hopping in the time-dependent Kohn-Sham approach for electron-nuclear dynamics,” Phys. Rev. Lett. 95, 163001 (2005).
- Weber et al. (2012) T. M. Weber, T. Niederprüm, T. Manthey, P. Langer, V. Guarrera, G. Barontini, and H. Ott, “Continuous coupling of ultracold atoms to an ionic plasma via Rydberg excitation,” Phys. Rev. A 86, 020702 (2012).
- Anderson et al. (2017) D. A. Anderson, G. Raithel, M. Simons, and C. L. Holloway, “Quantum-optical spectroscopy for plasma electric field measurements and diagnostics,” arXiv:1712.08717 (2017).
- Ma et al. (2020) L. Ma, E. Paradis, and G. Raithel, “DC electric fields in electrode-free glass vapor cell by photoillumination,” Opt. Express 28, 3676–3685 (2020).