H4M: Heterogeneous, Multi-source, Multi-modal, Multi-view and Multi-distributional Dataset for Socioeconomic Analytics in the Case of Beijing
††thanks: *Corresponding author.
This work is supported in part by The National Natural Science Foundation of China (Grant No. 71871006), in part by ACCESS –- AI Chip Center for Emerging Smart Systems, Hong Kong SAR, Hong Kong Research Grant Council (Grant No. 27206321), and National Natural Science Foundation of China (Grant No. 62122004).
Abstract
The study of socioeconomic status has been reformed by the availability of digital records containing data on real estate, points of interest, traffic and social media trends such as micro-blogging. In this paper, we describe a heterogeneous, multi-source, multi-modal, multi-view and multi-distributional dataset named “H4M”. The mixed dataset contains data on real estate transactions, points of interest, traffic patterns and micro-blogging trends from Beijing, China. The unique composition of H4M makes it an ideal test bed for methodologies and approaches aimed at studying and solving problems related to real estate, traffic, urban mobility planning, social sentiment analysis etc. The dataset is available at: https://indigopurple.github.io/H4M/index.html.
Index Terms:
dataset, real estate, points of interest, traffic, microblog, socioeconomic analytics, computational social scienceBackground & Summary
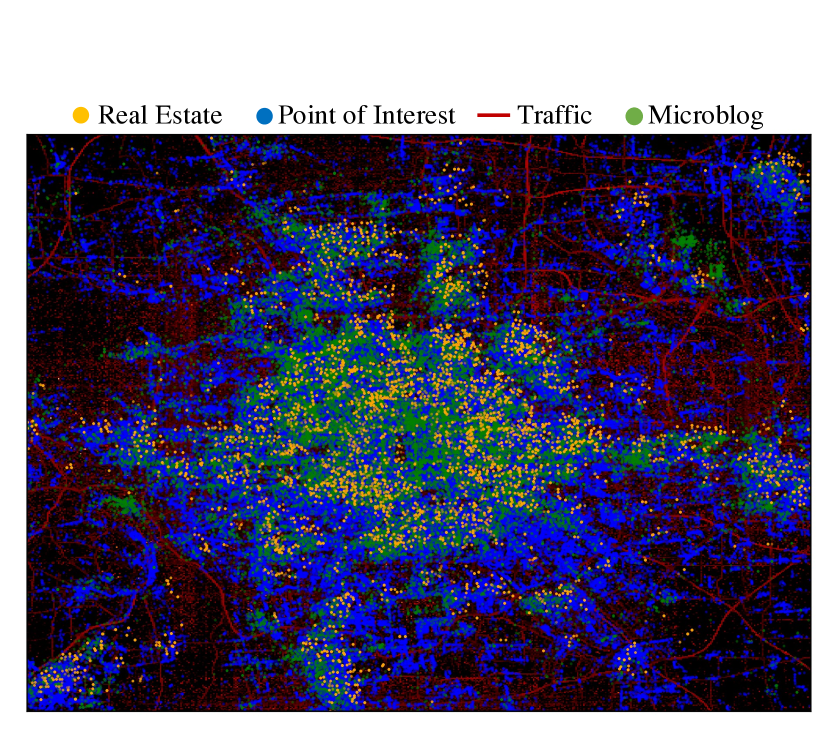
The availability of extensive data has helped provide fundamental and qualitative insights on socioeconomic analytics. This is down to two main factors - global adoption of digital records and the growing use of e-services. As Figure 1 shows, we propose a heterogeneous, multi-source, multi-modal, multi-view and multi-distributional dataset named “H4M”. The mixed dataset contains data on real estate transactions, points of interest, traffic patterns and micro- blogging trends from Beijing, China.
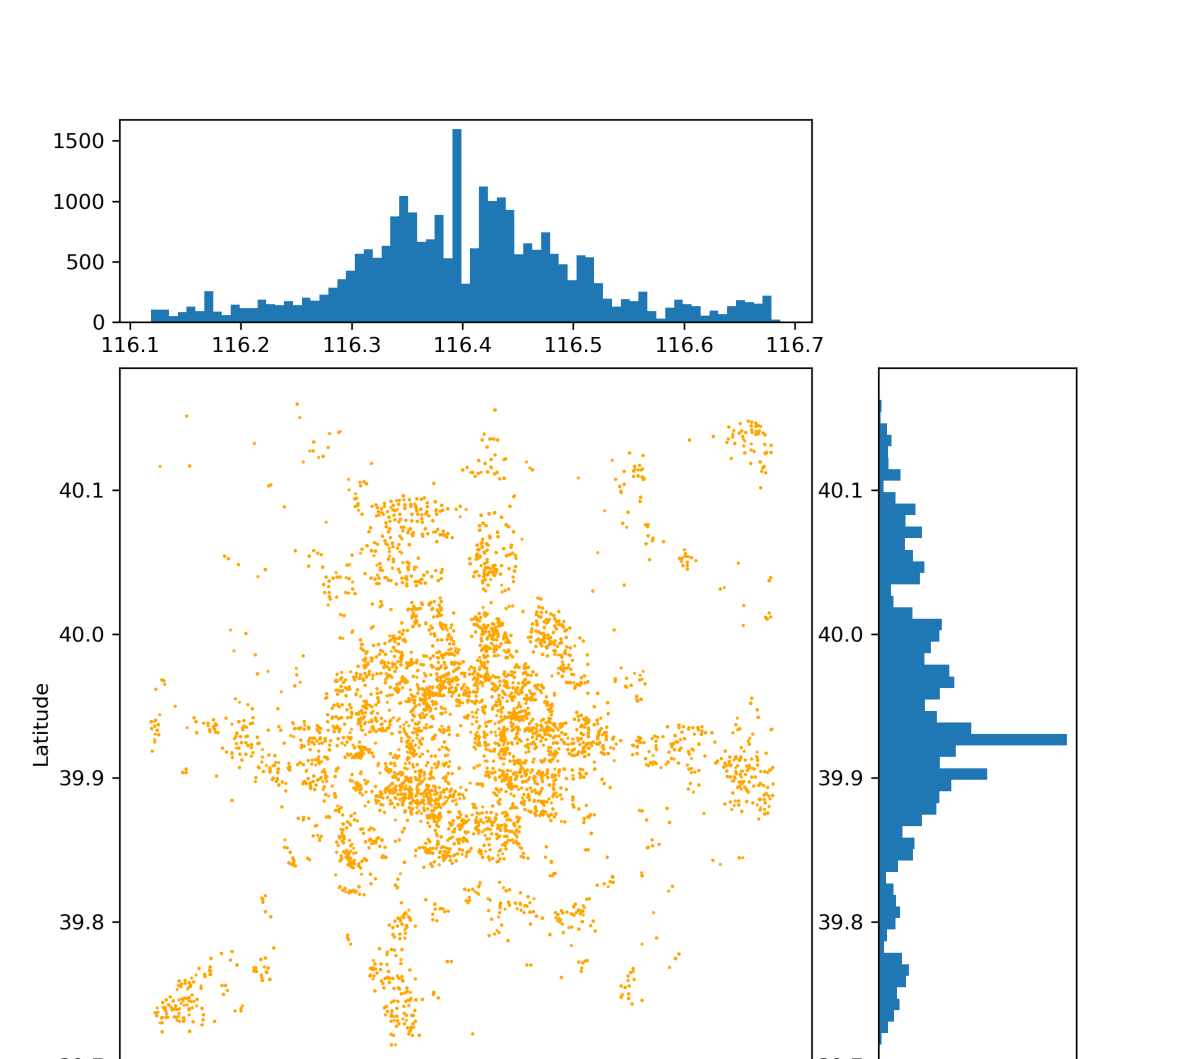
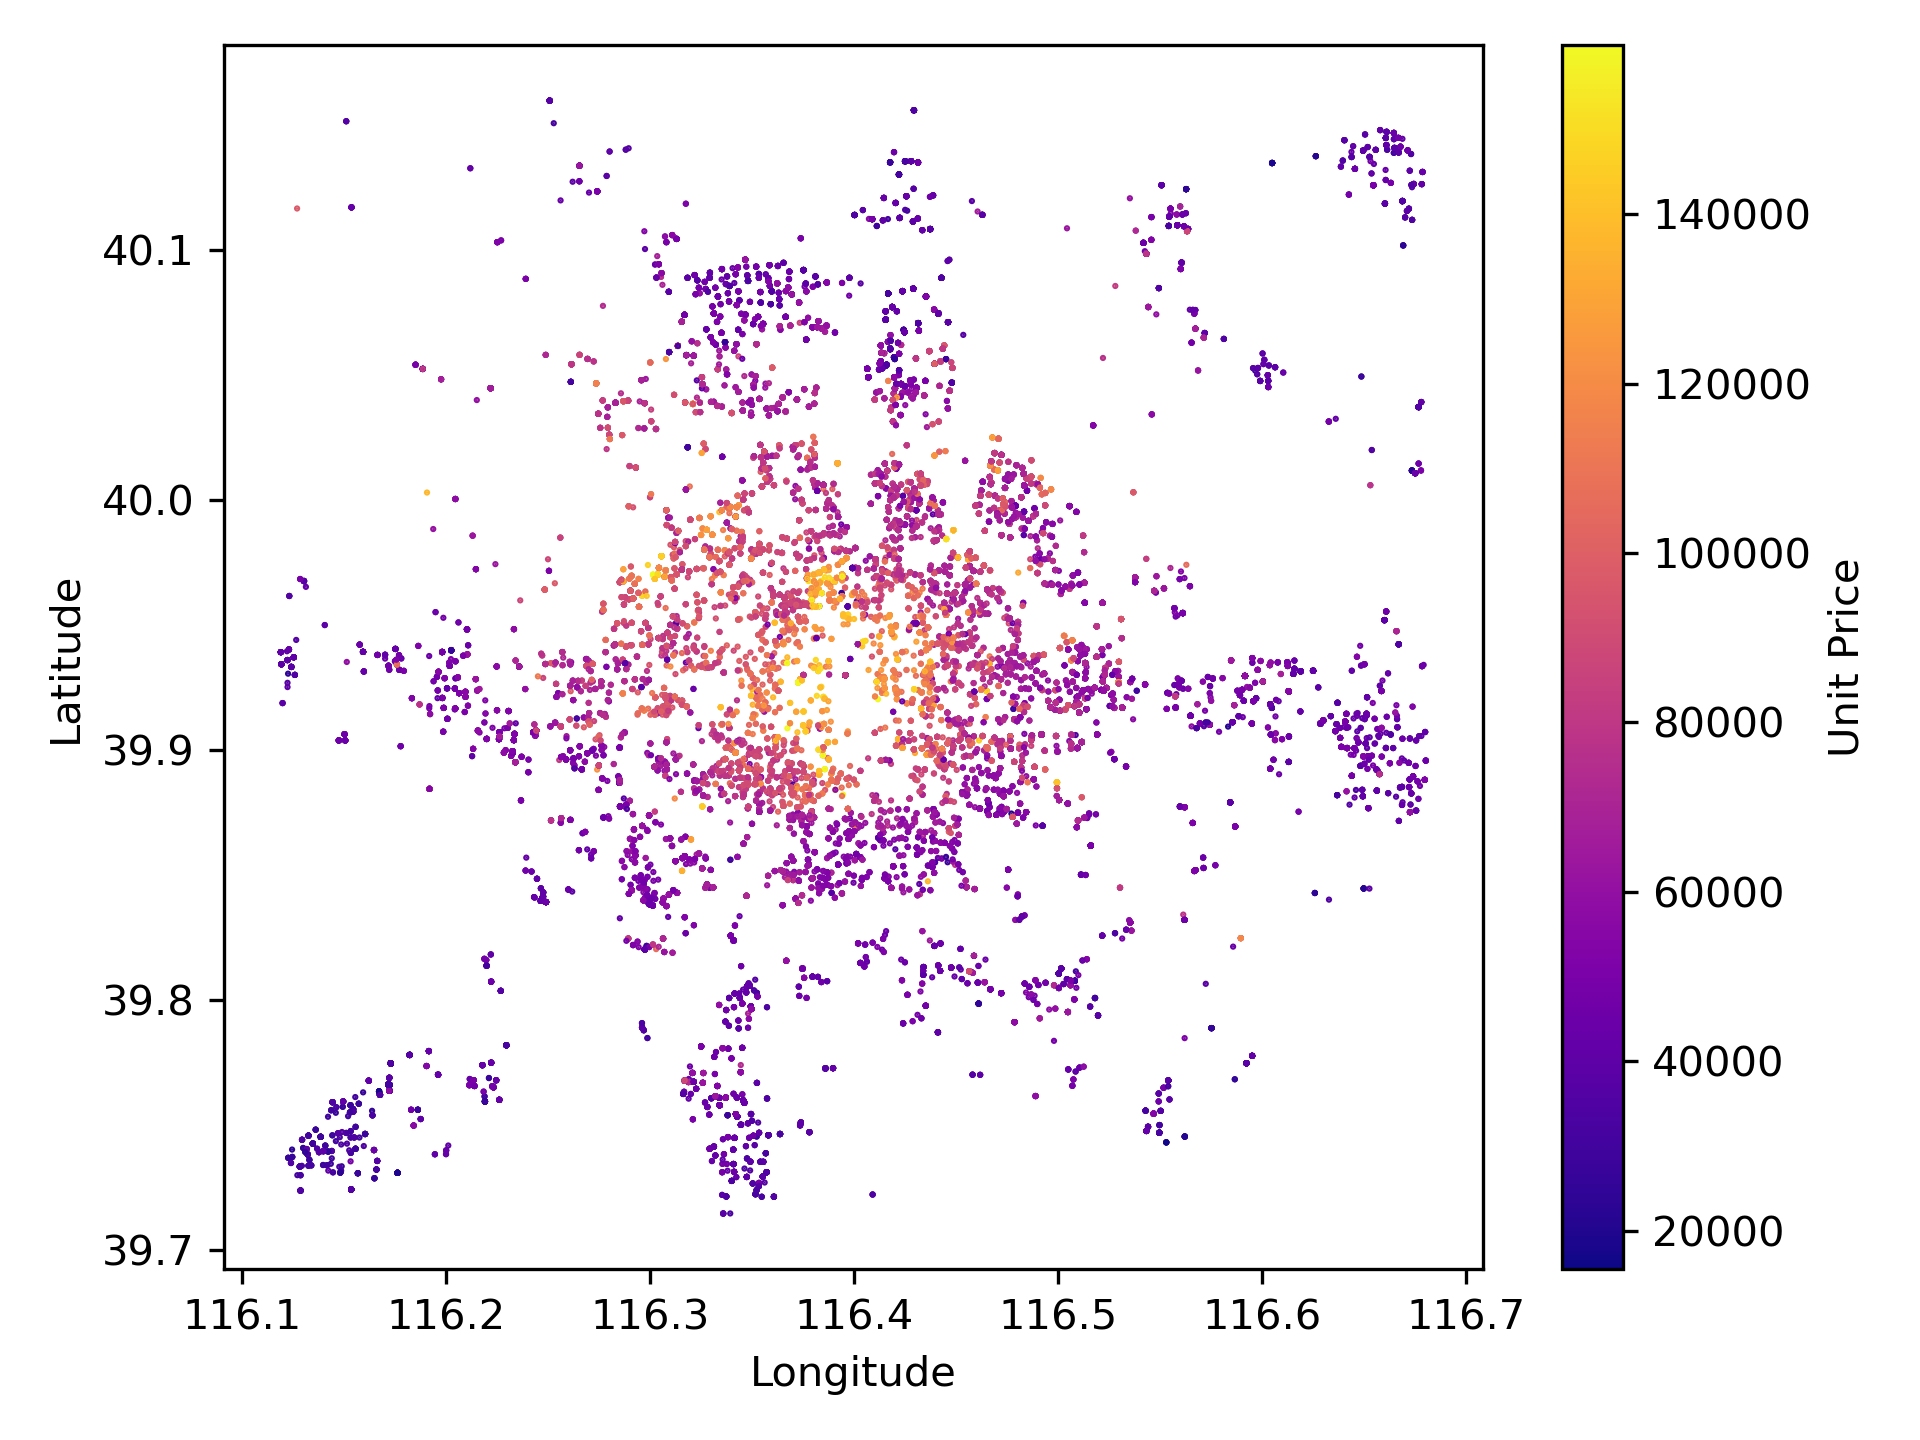
Firstly, the vast amount of data obtained from real estate transaction records can effectively reflect socioeconomic status. Although a previous work [1, 2, 3] helped collect and establish a model for estimation and prediction, the datasets used were either outdated or limited. Due to the rapid expansion and growth of real estate in China, we have been able to collect a large amount of data as shown in Figure 2(a) and Table I.
| Dataset | Lodon [1] | Fairfax [2] | Ames [3] | H4M (Ours) |
| Data | 2,108 | 15,135 | 2,930 | 28,645 |
| Year | 2001 | 2004 - 2007 | 2006 - 2010 | 2017 - 2018 |
| Area | London, UK | Fairfax, Virginia, USA | Ames, Iowa, USA | Beijing, China |
| Dataset | Lagos [4] | H4M (Ours) |
| Data | 157 | 497,256 |
| Types | 9 | 18 |
| Area | Lagos, Nigeria | Beijing, China |
| Dataset | PeMS [5] | Hangzhou [6] | H4M (Ours) |
| Data | 39,000 | 34 | 23,772 |
| Year | 2019 | 2015-2016 | 2017 |
| Area | California, USA | Hangzhou, China | Beijing, China |
| Dataset | Short-Text [7] | WeiboRank [8] | Weibo-COV [9] | H4M (Ours) |
|---|---|---|---|---|
| Data | 4,6345 | 22,620,281 | over 40 million | over 100 million |
| Geolocated | no | no | no | yes |
| Data type | House | Points of Interest | Traffic flow | Microblog |
| Issuer | Lianjia | Baidu Maps | Baidu Maps | Sina Weibo |
| Acquisition | Web crawler | Web crawler | Web crawler | Web crawler |
| Format | JSON | JSON | Pickle | Text |
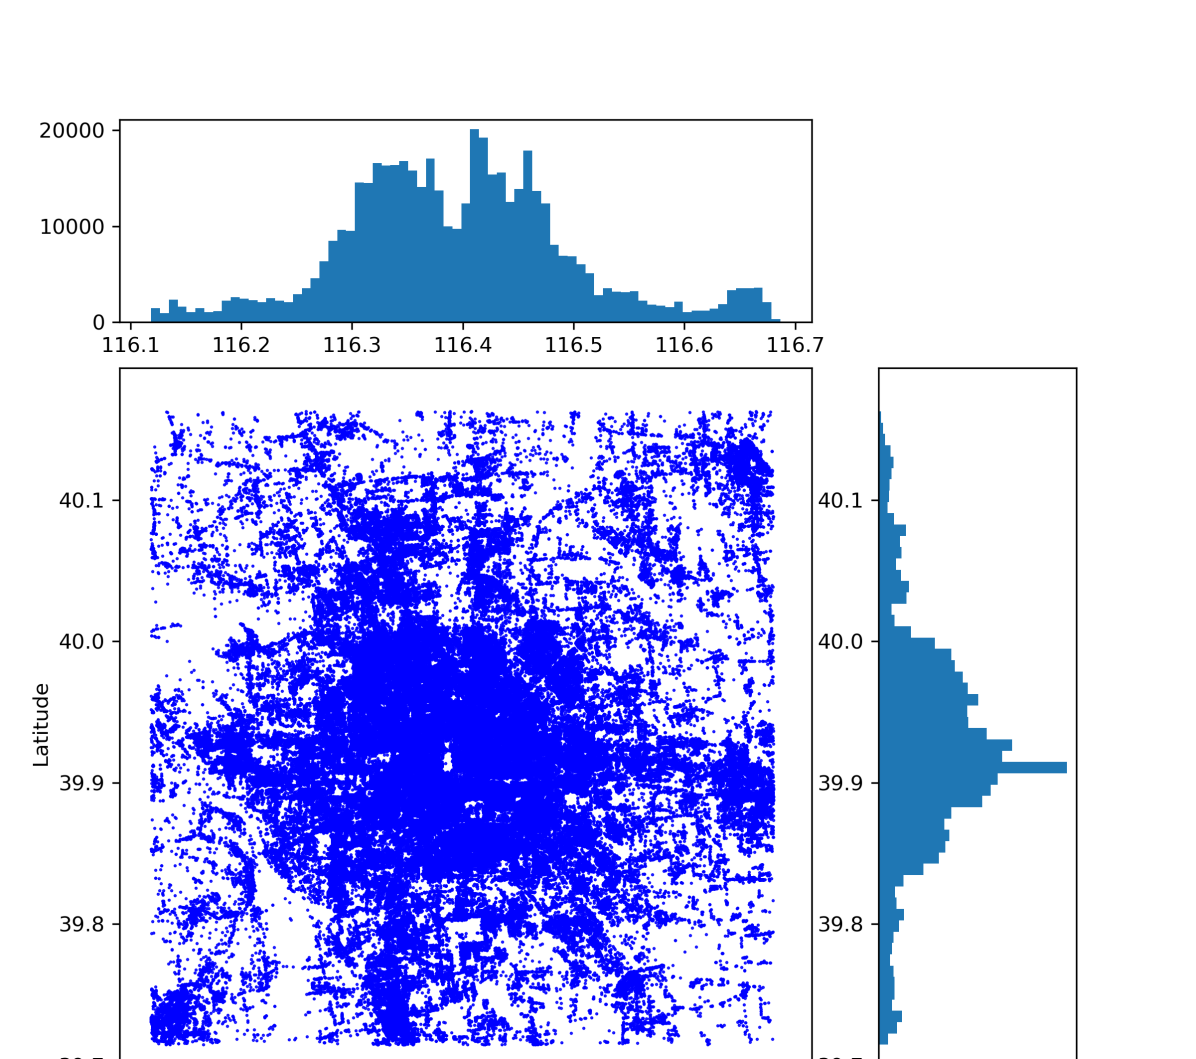
Secondly, the availability of points of interest data has helped define a novel area of research - We are now able to model urban structures and predict socioeconomic indicators [4]. Compared to previous work in this field, our dataset offers more diverse data as shown in Figure 2(b) and Table II.
The Caltrans Performance Measurement System (PeMS) [5] is the most extensively used dataset in traffic flow prediction - the data is collected from California, USA and the existing dataset [6] from China is insufficient. For this reason, we provide traffic flow data with amount in parallel to PeMS, as shown in Figure 2(c) and Table III.
Finally the emergence of geolocated information and social media services like microblogs has provided us opportunities to quantitatively inspect social wellness [10] and also the socioeconomic status of geographical regions [11]. Since the existing datasets [7, 8, 9] did not have the geographic coordinates associated with its posts, we could not geolocate each data point. To overcome this, we collected over 100 million Chinese microblog posts with location coordinates as show in Figure 2(d) and Table IV.
It is important to note that the aforementioned datasets from previous work only offer data related to a single aspect for socioeconomic analytics. Diverse data should be leveraged to guarantee comprehensive analysis. Barlacchi et. al. [12] proposed a multi-source dataset on two geographical areas - the city of Milan and the province of Trentino. This dataset is a multi-source aggregation of telecommunications, weather, news, social network and electricity data. In contrast, H4M comprises of data on real estate, points of interest, traffic and microblogs with geographical coordinates from Beijing, China. Therefore, it intrinsically owns some complex characteristics such as heterogeneous, multi-source, multi-modal, multi-view and multi-distributional.
Heterogeneous
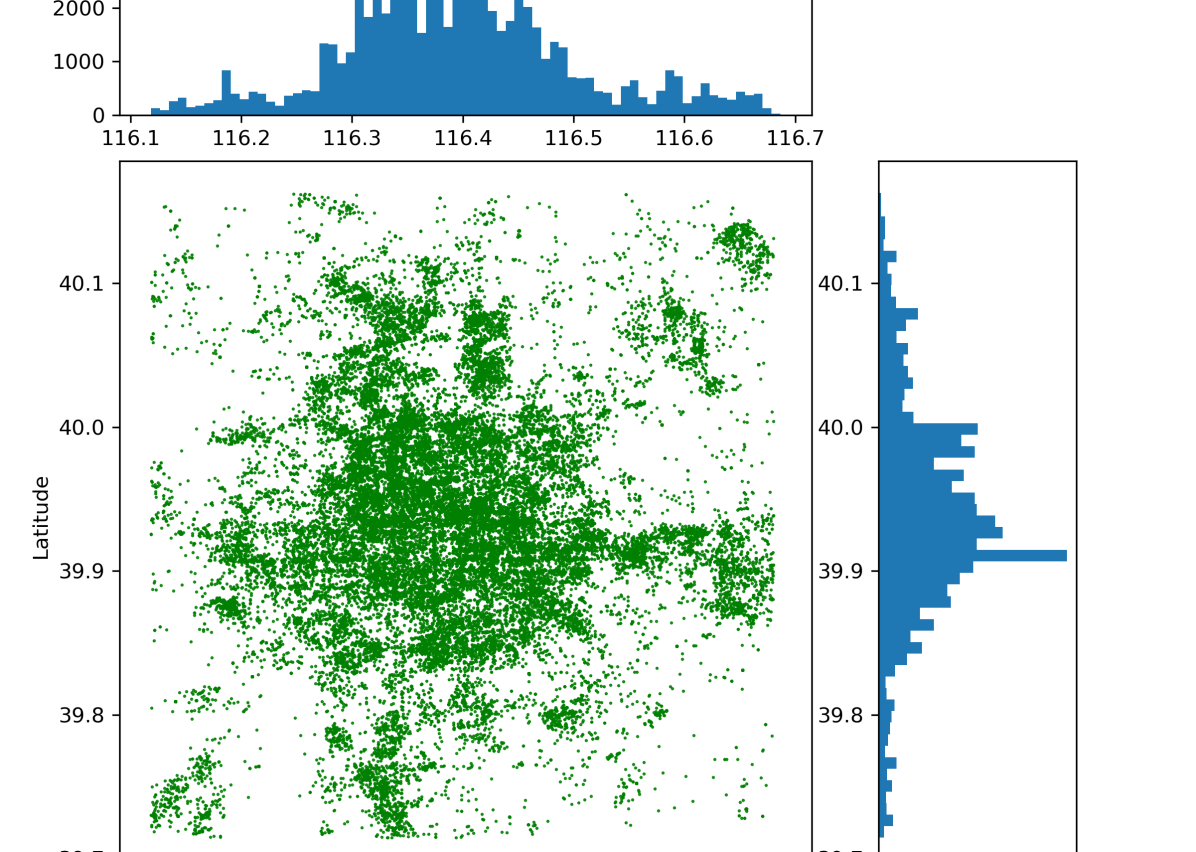
More specifically, H4M contains entries of real estate data, pieces of points of interest, grids of traffic data and over 100 million of microblog posts in Beijing. These are shown in Figure 2 as scatter plots and a heat map. From this we can conclude that the H4M dataset is heterogeneous.
Multi-source
As seen in Table V, by using web crawlers, we access and collect data by scraping a large number of websites. Given that H4M contains data from different souces, we can assume it to be a multi-source dataset.
Multi-modal
As Table V shows, each type of data is stored in a specific format. The data formats used in H4M include JSON, Pickle and plain text thus making H4M multi-modal.
Multi-view
The unique composition of H4M makes it an ideal test bed for methodologies and approaches aimed at studying and solving problems related to diverse and different perspectives including real estate, traffic, urban mobility planning, social sentiment analysis etc. Therefore, the H4M dataset is multi-view.
Multi-distributional
The distributions of real estate, points of interest and microblog data are respectively shown in Figure 2(a), 2(b), 2(d). This represents complicated patterns and are distinguished from each other. Due to the data collection and processing method that is used, the traffic data is uniformly distributed. Therefore, the H4M dataset is multi-distributional.
The intrinsic heterogeneous, multi-source, multi-modal, multi-view and multi-distributional characteristics of H4M make it important and novel for socioeconomic analytics. For instance, the aforementioned characteristics can be an invaluable resource to assess the economic and social value of real estate and thus boost the accuracy of real estate valuation modeling by estimating many factors of property [13]. Moreover, it allows for predicting large-scale traffic congestion based on multi-modal fusion and representation mapping [14].
To conclude, we believe that the “H4M” dataset will aid and encourage researchers to design algorithms capable of exploiting various socioeconomic indicators.
Methods
In this section, we describe the collection and processing methods of our multi-source dataset. After processing, we aggregate all data and associate it with geographical coordinates. This allows for easier comparisons between different areas thus reducing the overload of geographical management. Table V provides an overview of the different data sources and the methods used to process them.
Real Estate
We use a web crawler to browse through Lianjia ‘s website (https://bj.lianjia.com/). The crawler indexes numerous pages on real estate transactions and retrieves them as HTML files. We then decompose the files and identify the relevant transaction data after which they are extracted and collected.
The data from Lianjia contains real estate addresses which is used to send requests to Baidu Maps (https://map.baidu.com/) to obtain geographical coordinates (latitude and longitude) for each housing record. Finally the transaction data is organized and stored as JSON files.
Points of Interest
Using Baidu Maps, we identify and collect points of interest (POI) and their geographical coordinates in Beijing. We then enumerate the POIs and check their points of interest type. The POIs with meaningless types are discarded. The remaining 18 types of points of interest are stored as JSON files.
Traffic
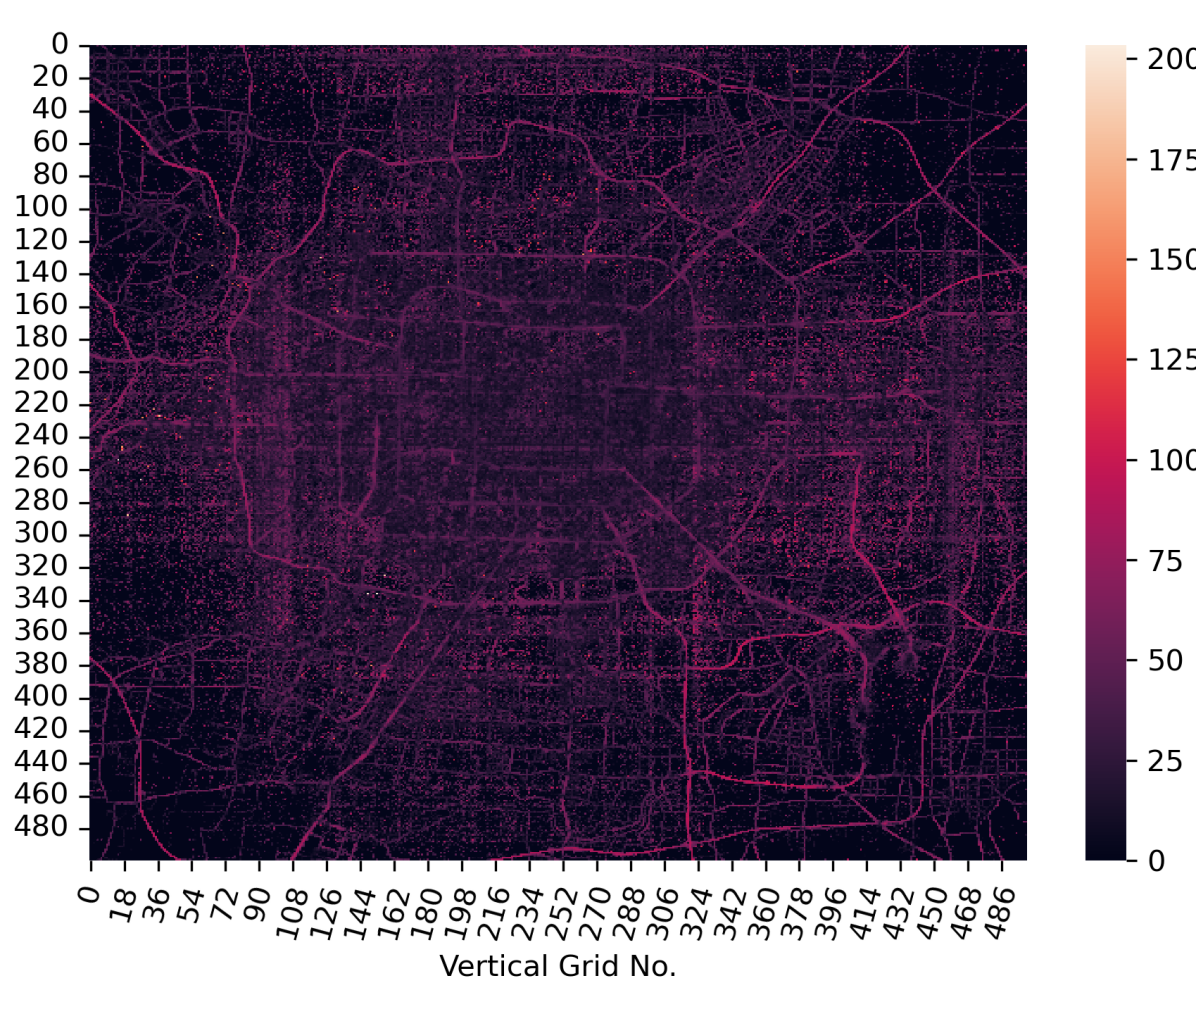
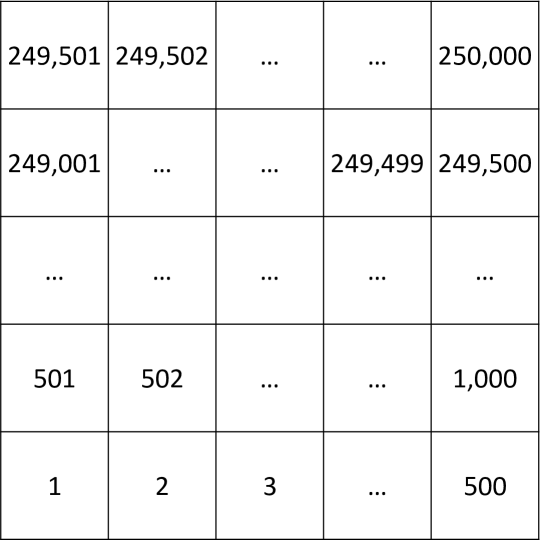
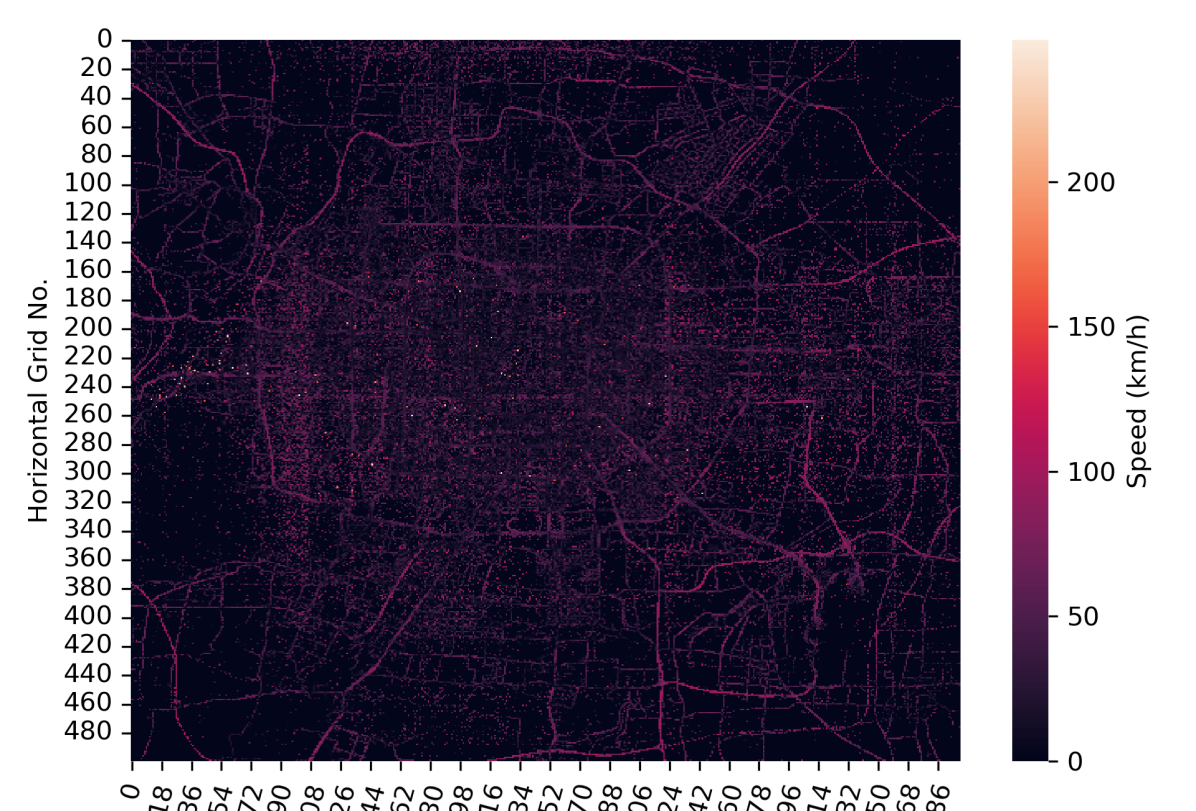
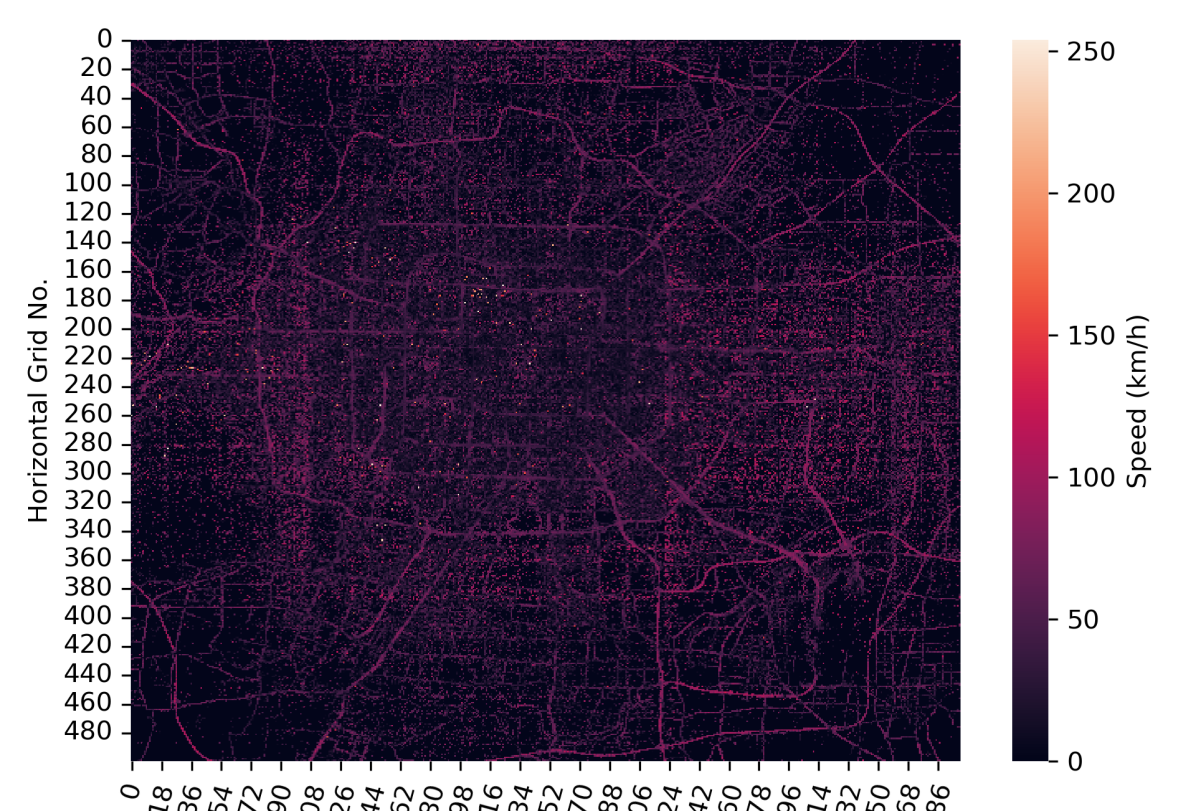
Our traffic flow data is collected from Baidu Maps. The latitudinal and longitudinal values for Beijing and its different regions vary between range , meanwhile latitude values vary in . For convenience, we evenly divide the regions in the above range into grids, as shown in Figure 4. Grids without roads or insufficient traffic data are padded with zero values, and for the remaining 23772 grids, we collect traffic average speed information per minutes from 6 a.m to 12 a.m. These are then stored in Pickle files.
Microblog Posts
We use a web crawler to access the website of Sina Weibo (https://weibo.com/); the most commonly used microblog platform in China. We then identify microblog posts with location information and discard the remaining data points. Finally, over millions microblog posts between September 12 2013 and April 20 2015 are collected and stored as text files.
| Variable | TotalPrice | UnitPrice |
| (thousand RMB) | (in RMB) | |
| Avg | 6,264 | 66,008 |
| Med | 5,000 | 61,880 |
| Std | 4,272 | 25,587 |
| Min | 600 | 13,209 |
| Max | 95,000 | 159,975 |
| Pct25 | 3,750 | 45,694 |
| Pct50 | 5,000 | 61,880 |
| Pct75 | 7,350 | 81,541 |
Technical Validation
An accurate techincal validation of the dataset is limited due to the absence of similar multi-source datasets that are available for comparison. Hence, in this section we propose a statistical and visual characterization with the aim of supporting the naive correctness of the information provided.
Real Estate
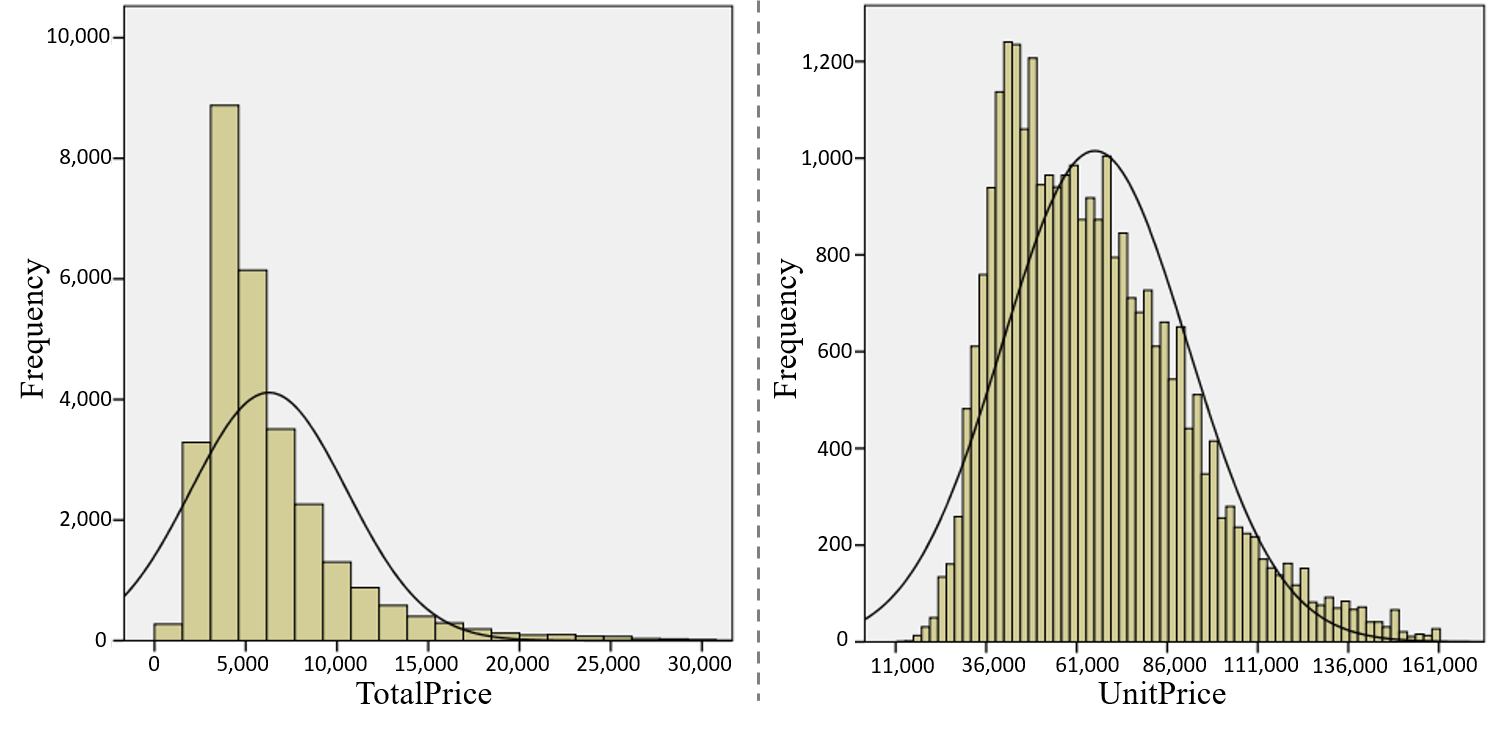
Figure 3 represents the distribution of total price and unit price per square meter of houses in Beijing by histogram with distribution curve. The maximum and minimum values for the total price of house are approximately 6.4 and 1.1 standard deviations away from the mean. The total price distribution has a skewness of 3.24. In comparison, the maximum and minimum values for UnitPrice (price per square meter) approximately 3.7 and 2 standard deviations away from the mean with a skewness of 0.81.
Table VI describes the average, standard deviation, minimum, maximum, 25th percentile, 50th percentile and 75th percentile values of house price in Beijing. Those values are reasonable. Figure 6 shows the geographical distribution and unit price of real estate in Beijing. The houses closer to the city center are more expensive, while the houses in the suburbs far away from the city are rarer and cheaper.
Points of Interest
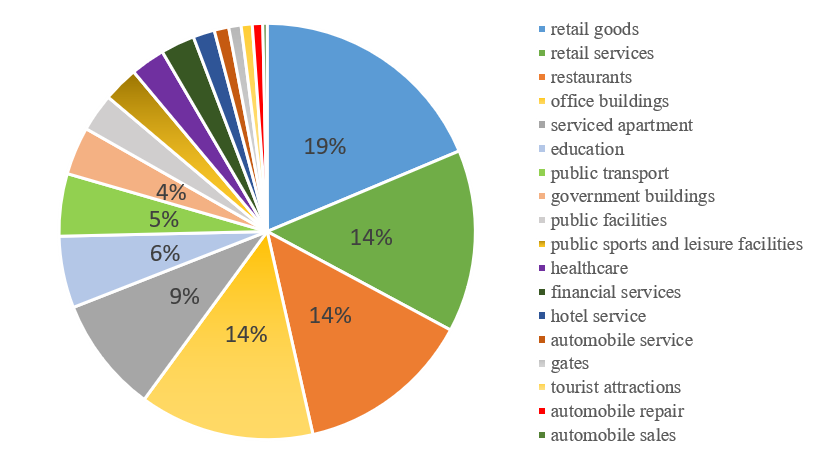
Figure 5 is a pie chart containing the percentages of different points of interest types in Beijing. Going clockwise, Retail goods and services contribute 19 percent and 14 percent of all goods and services. Restaurants, commercial/office buildings and serviced apartments makeup 37 percent of the pie chart. As Beijing’s subway system is the primary mode of public transport in the city, this points of interest type contributes only around 5 percent. All the other points of interest types complete the remaining 25 percent.
Traffic
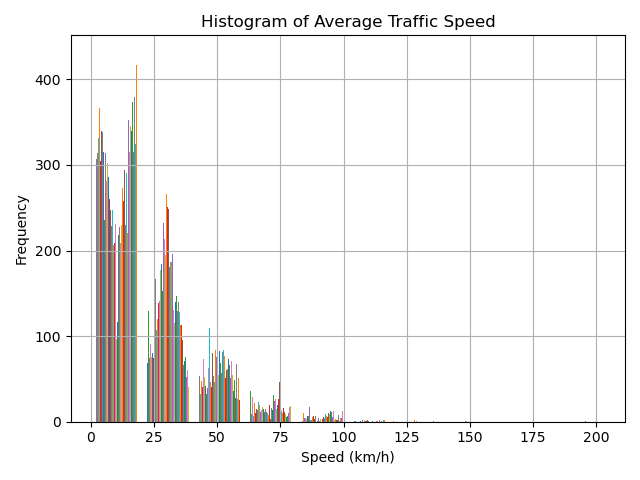
To testify the validation of our collected traffic data, Figure 7 presents the histogram of average traffic speed of a whole day in each grid of Beijing. We observe that most grids load the traffic flow with average speed as km/h, and the average speeds are generally below km/h (except for very few between and km/h). It is reasonable and valid, since generally traffic tends to be concentrated in a few areas; on another hand, the speed limit on Beijing’s roads is generally below km/h, while the maximum speed limit on airport expressways in Beijing is km/h.
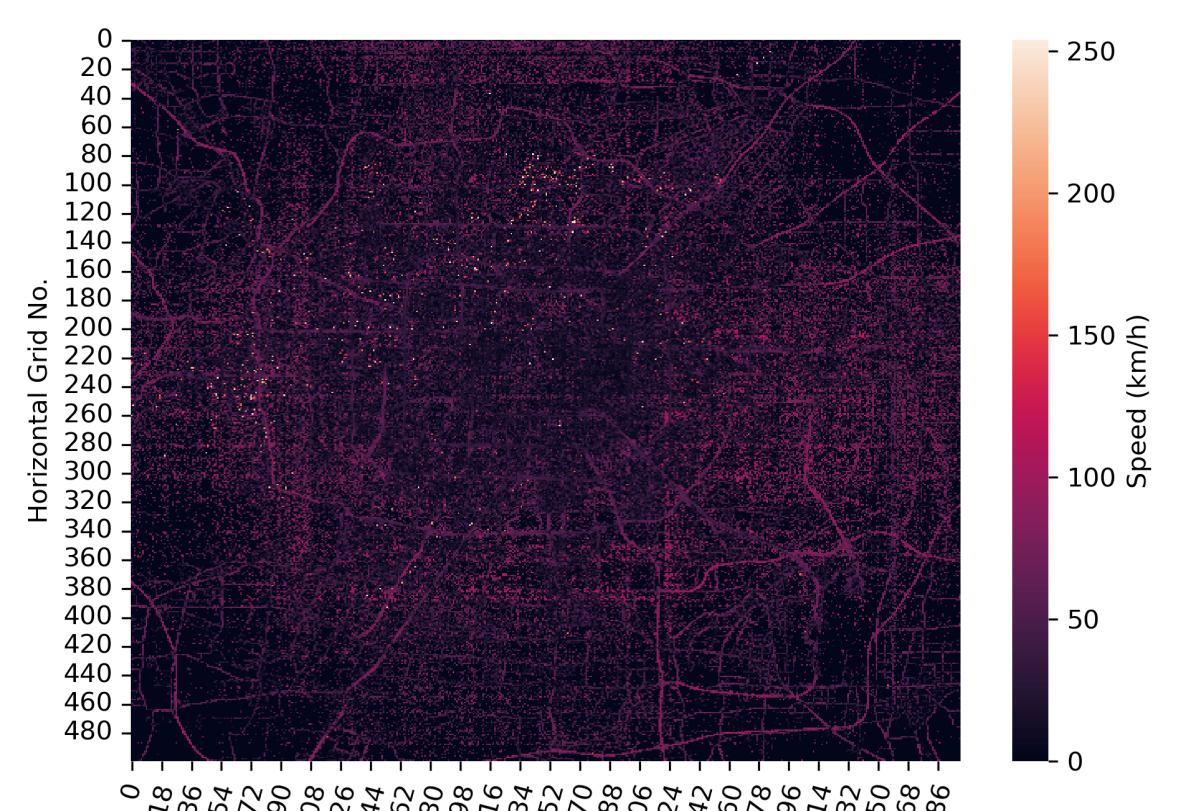
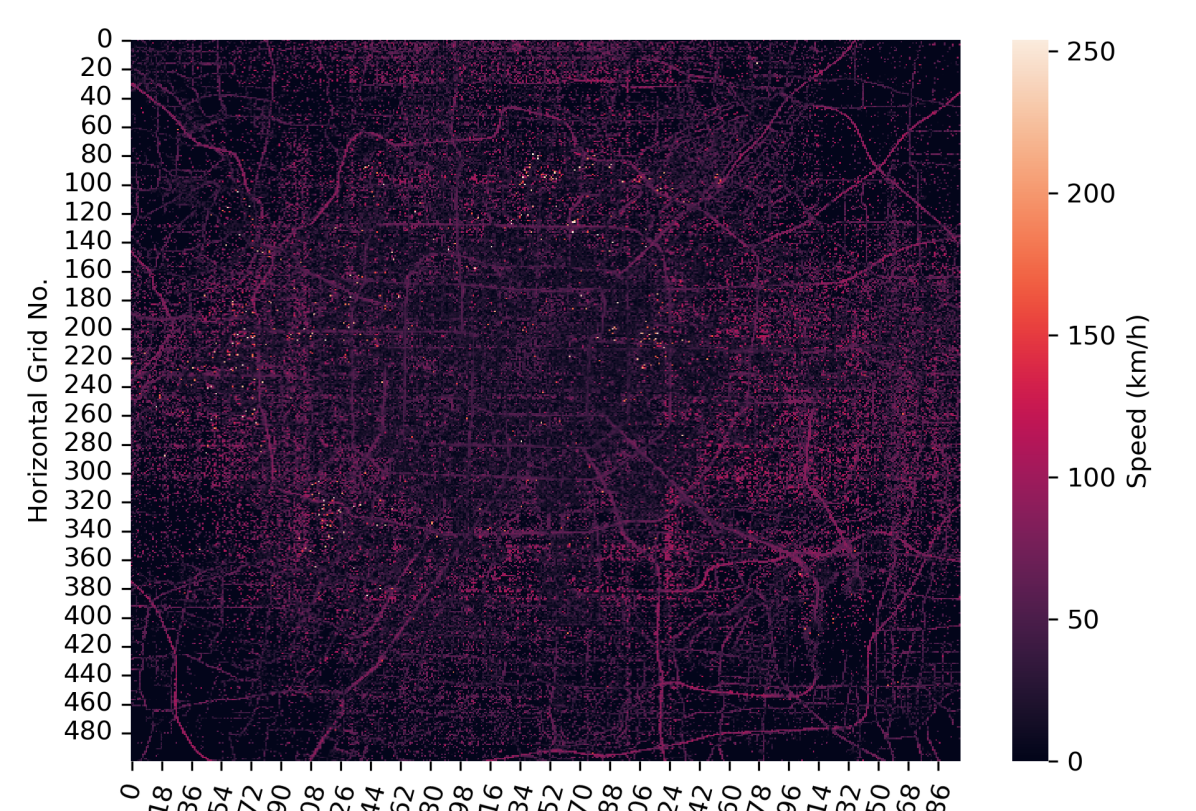
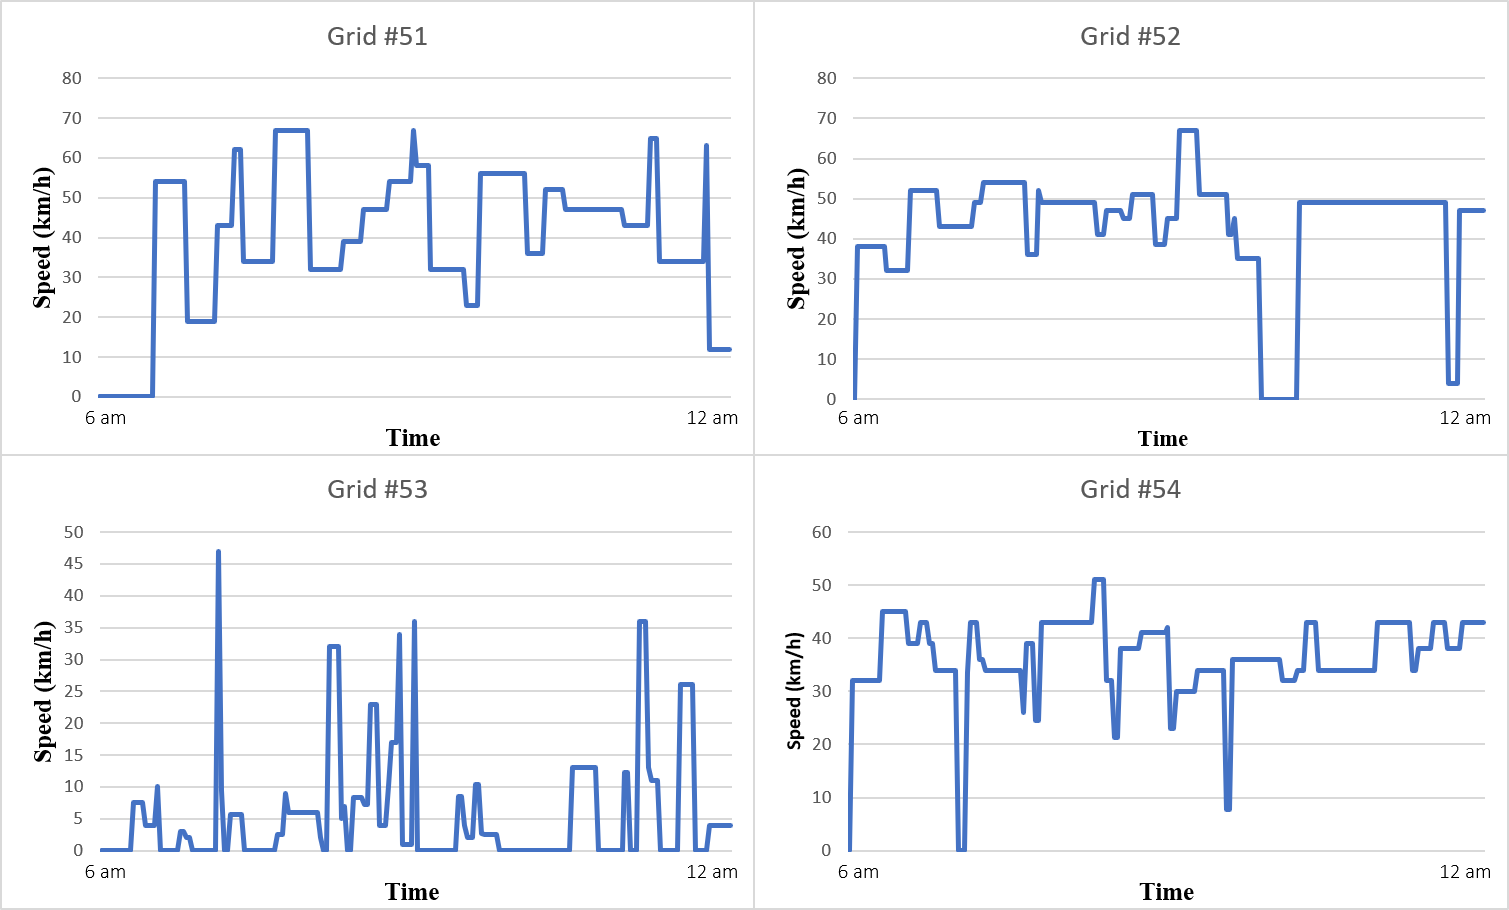
In addition, we visualize the traffic speed at different time in a day as shown in Figure 8. Moreover, we randomly choose 4 grids and visualize the traffic flow in a day as shown in Figure 9. The figure contains traffic patterns for grids 51-54 in Beijing. The Y-axis in each plot is the average speed of traffic in km/h and the X-axis is time. As mentioned earlier, traffic speeds are obtained using a web crawler from Baidu Maps every 5 minutes between 6AM and 12AM. The average speeds early morning and late at night are generally quite high while it drops during the day and in the evening. This can be attributed to vehicular traffic at different times of the day - lower volumes of motor vehicles will result in higher average speeds.
Microblog Posts
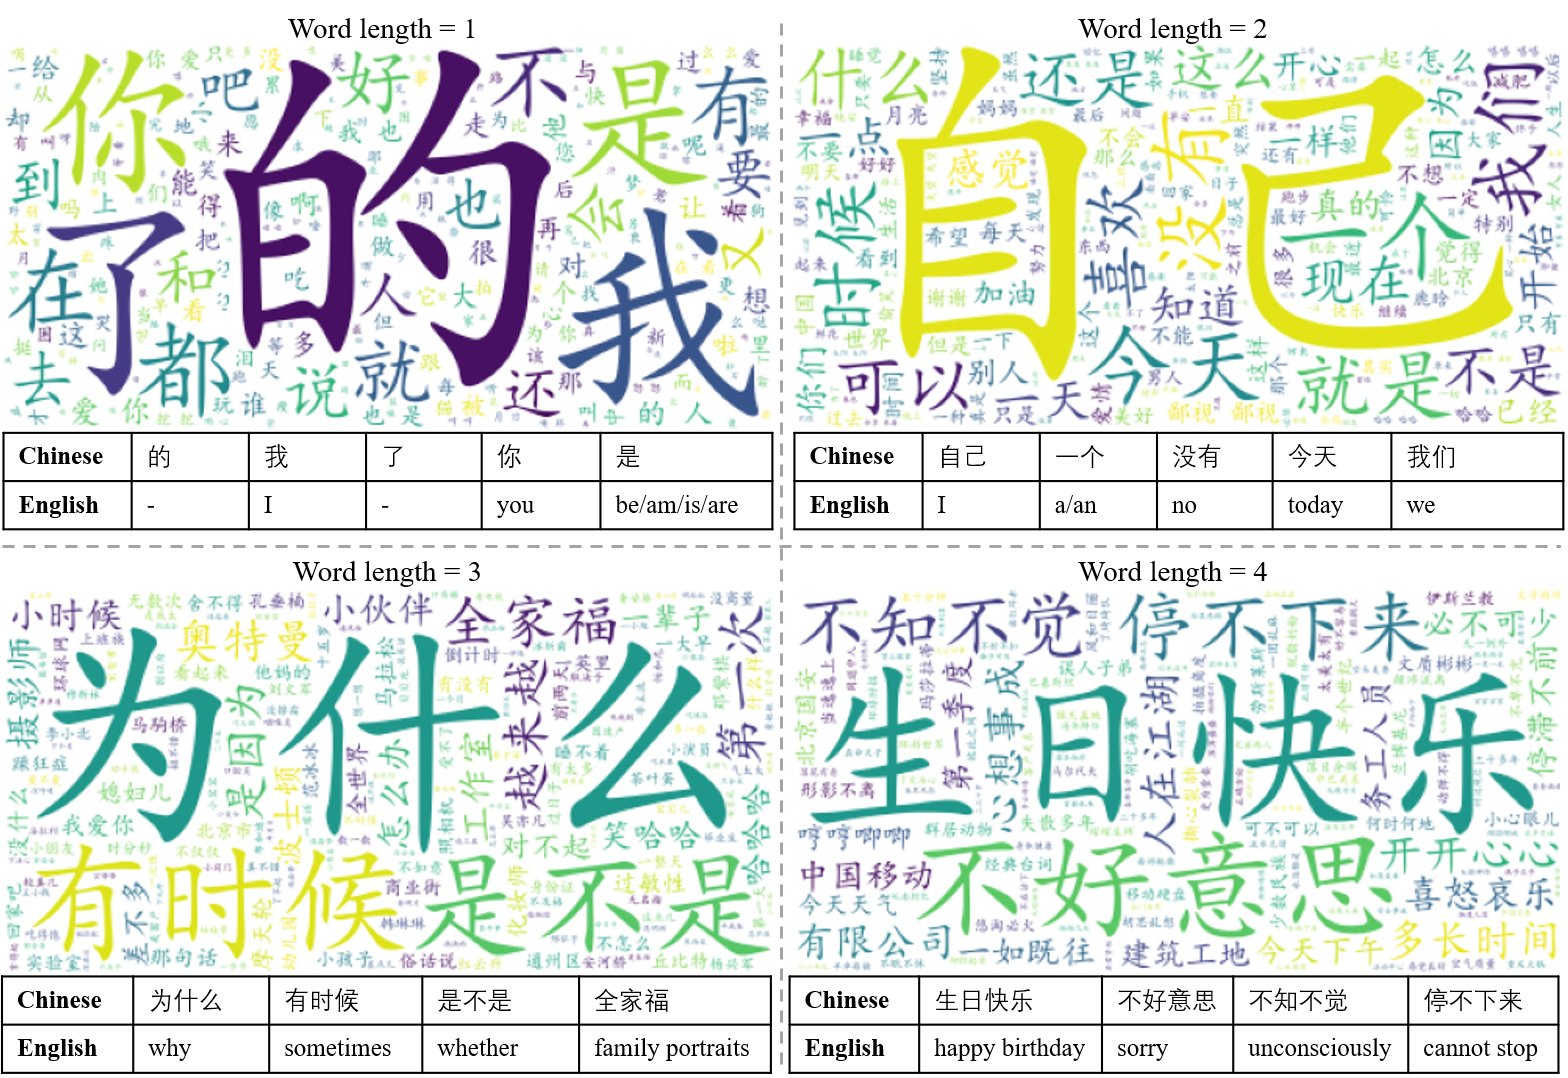
To testify the validation of our collected microblog data, we randomly choose 762 microblog posts from 20 April 2015. For each post, we categorize the words by their length and visualize them as a wordcloud. As seen in Figure 10, the most frequent words in these posts are also the most commonly used Chinese words. This suggests that the data correctly reflects the social media in Beijing.
Advanced Analytics
We comprehensively evaluate the proposed mixed dataset by referring to advanced data analytics conducted in other works. For example, PATE [13] uses the H4M dataset to assess the social and economic value of the real estate in Beijing. By estimating many factors of real estate prices, H4M boosts the accuracy of the price valuation model. Moreover, Zhou et al. [14] leverages the dataset in predicting large-scale traffic congestion based on multi-modal fusion and representation mapping.
By respectively using a single factor and fusing diverse data, the aforementioned works perform ablation study on the dataset. Both studies conclude that the intrinsic heterogeneous, multi-source, multi-modal, multi-view and multi-distributional characteristics of H4M have practical applications and are also beneficial in improving modeling accuracy.
Data Records
In this section, we provide an overview of the data files and their formats. Given the heterogeneous nature of our dataset, it is imperative that we describe each different type of data.
Real Estate
For housing analytics, we crawl through approximately real estate data in Beijing - After cleaning, there are a total of entries. Each entry has variables. The variables are defined below:
-
•
Id: the identity number of the points of interest.
-
•
TotalPrice: selling price of the house in thousand Renminbi (RMB). RMB is the legal currency of China.
-
•
UnitPrice: price per square meter of the house in RMB.
-
•
Year: building year.
-
•
RoomNum: the number of bedrooms in the house.
-
•
HallNum: the number of living and dining rooms in the house.
-
•
KitchenNum: the number of kitchens in the house.
-
•
BathNum: the number of bathrooms in the house.
-
•
Floor: floor on which the house is located. Possible values are: low, middle, high.
-
•
Orientation: the orientation of the house.
-
•
Decoration: type of the house decoration.
-
•
BuildingArea: the building area of the house.
-
•
InsideArea: the inside area of the house.
-
•
Heating: heating mode of the house.
-
•
Elevator: whether there is an elevator in the building. The value is if there exists an elevator along with the house, otherwise.
-
•
Layout: the type, area, orientation and window existence of each division in the house. This variable consists of sub-variables:
-
–
Type: type of the house division.
-
–
Area: area of the house division.
-
–
Orient: orientation of the house division.
-
–
Window: whether there exists a window in the house division. The value is if there exists an elevator along with the house, otherwise.
-
–
-
•
Lat: latitude of the house.
-
•
Lng: longitude of the house.
Points of Interest
In this paper, we crawl through pieces of Beijing points of interest data, and there are pieces varying in types after cleaning. Each data has variables. The variables are defined below:
-
•
Id: the identity number of the points of interest.
-
•
Lat: the latitude of the points of interest.
-
•
Lng: the longitude of the points of interest.
-
•
Type: the type of the points of interest. Possible values are: office buildings, automobile repair, automobile services, automobile sales, public transport, retail goods, retail services, financial services, healthcare, serviced apartments, restaurants, education, public sports and leisure facilities, government buildings, tourist attractions, hotel services, traffic facilities and public facilities.
Traffic
Traffic data is stored as a Pickle file consisting of elements corresponding to different regions in Beijing and each element is a list of values. These values are daily traffic speeds in km/h recorded every minutes (between 6 a.m. and 12 p.m.).
Microblog Posts
There are text files containing over million of microblog posts in Beijing. Each file contains rows with daily posts between September 12, 2013 and April 20, 2015. Each row has space separated values that are as follows:
-
•
The content of the microblog.
-
•
The longitude of the microblog location.
-
•
The latitude of the microblog location.
-
•
The post date and time of the microblog.
| Main text | Longitude | Latitude | Week | Month | Day | Time | Time zone | Year |
|---|---|---|---|---|---|---|---|---|
| 下雨喽,好开心,好凉快… | 116.142647 | 39.729572 | Fri | Sep | 13 | 21:32:14 | +0800 | 2013 |
Usage Notes
House Data
The house data is stored in a JSON file. For instance, reading a piece of house data from the JSON file will output:
{
“Id”: “101087602731”,
“TotalPrice”: “24660”,
“UnitPrice”: “82533”,
“Year”: “2010”,
“RoomNum”: “4”,
“HallNum”: “1”,
“KitchenNum”: “1”,
“BathNum”: “3”,
“Floor”: “low”,
“Orientation”: Southeast,
“Decoration”: “Penthouse/Exquisite Decoration”,
“BuildingArea”: “298.79”,
“InsideArea”: “242.89”,
“Heating”: “Self-heating”,
“Elevator”: “1”,
“Layout”:
{
“Type”: [“living room”, “bedroom A”, “bedroom B”, “bedroom C”, “bedroom D”, “kitchen”, “bathroom A”, …],
“Area”: [68.71, 34.29, 24.12, 14.74, 15.43, 11.87, 10.1, …],
“Orient”: [“South East”, “South”, “East”, “East”, “South East”, “None”, “None”, …]
“Window”: [1, 1, 1, 1, 1, 0, 0, …]
}
“Lat”: 40.006694137576851,
“Lng”: 116.48668712633133
}
Points of Interest
The points of interest data is stored in a JSON file. For instance, reading a piece of points of interest data from the JSON file will output:
{
“Id”: “110107”,
“Lat”: 39.963204,
“Lng”: 116.125696,
“Type”: “office buildings”
}
Traffic Data
The traffic data is stored as a Pickle file. For instance, reading a piece of microblog data from a text file will output:
[0.0, 0.0, 0.0, 10.0, 10.0, 10.0, 0.0, 0.0, 23.0, 23.0, 23.0, 0.0, 6.0, 6.0, 6.0, 28.0, 28.0, 28.0, 26.0, 26.0, 26.0, 6.0, 6.0, 6.0, 23.0, 23.0, 23.0, 30.0, 30.0, 30.0, 30.0, 34.0, 34.0, 34.0, 26.0, 47.0, 47.0, 47.0, 47.0, 13.0, 13.0, 13.0, 15.0, 15.0, 15.0, 38.0, 38.0, …]
Microblog Data
The Microblog data is stored as text files. For instance, reading a piece of microblog data from a text file will output:
下雨喽,好开心,好凉快。我在这里:http://t.cn/z8AUByp 116.142647 39.729572 Fri Sep 13 21:32:14 +0800 2013
For a better understanding, we divide this example into parts and interpret their meaning as Table VII shows.
References
- [1] Binbin Lu, Martin Charlton, Paul Harris, and A Stewart Fotheringham. Geographically weighted regression with a non-euclidean distance metric: a case study using hedonic house price data. International Journal of Geographical Information Science, 28(4):660–681, 2014.
- [2] Byeonghwa Park and Jae Kwon Bae. Using machine learning algorithms for housing price prediction: The case of fairfax county, virginia housing data. Expert systems with applications, 42(6):2928–2934, 2015.
- [3] Dean De Cock. Ames, iowa: Alternative to the boston housing data as an end of semester regression project. Journal of Statistics Education, 19(3), 2011.
- [4] Adedeji O Afolabi, Rapheal A Ojelabi, BA Adewale, Adedotun Akinola, and Adesola Afolabi. Statistical exploration of dataset examining key indicators influencing housing and urban infrastructure investments in megacities. Data in brief, 18:1725–1733, 2018.
- [5] Chao Chen, Karl Petty, Alexander Skabardonis, Pravin Varaiya, and Zhanfeng Jia. Freeway performance measurement system: mining loop detector data. Transportation Research Record, 1748(1):96–102, 2001.
- [6] Yan Tian, Kaili Zhang, Jianyuan Li, Xianxuan Lin, and Bailin Yang. Lstm-based traffic flow prediction with missing data. Neurocomputing, 318:297–305, 2018.
- [7] Hao Wang, Zhengdong Lu, Hang Li, and Enhong Chen. A dataset for research on short-text conversations. In Proceedings of the 2013 Conference on Empirical Methods in Natural Language Processing, pages 935–945, 2013.
- [8] Qing Liao, Wei Wang, Yi Han, and Qian Zhang. Analyzing the influential people in sina weibo dataset. In 2013 IEEE Global Communications Conference (GLOBECOM), pages 3066–3071. IEEE, 2013.
- [9] Yong Hu, Heyan Huang, Anfan Chen, and Xian-Ling Mao. Weibo-cov: A large-scale covid-19 social media dataset from weibo. arXiv preprint arXiv:2005.09174, 2020.
- [10] Daniele Quercia, Jonathan Ellis, Licia Capra, and Jon Crowcroft. Tracking” gross community happiness” from tweets. In Proceedings of the ACM 2012 conference on computer supported cooperative work, pages 965–968, 2012.
- [11] Alejandro Llorente, Manuel Garcia-Herranz, Manuel Cebrian, and Esteban Moro. Social media fingerprints of unemployment. PloS one, 10(5):e0128692, 2015.
- [12] Gianni Barlacchi, Marco De Nadai, Roberto Larcher, Antonio Casella, Cristiana Chitic, Giovanni Torrisi, Fabrizio Antonelli, Alessandro Vespignani, Alex Pentland, and Bruno Lepri. A multi-source dataset of urban life in the city of milan and the province of trentino. Scientific data, 2(1):1–15, 2015.
- [13] Yaping Zhao, Ramgopal Ravi, Shuhui Shi, Zhongrui Wang, Edmund Y Lam, and Jichang Zhao. Pate: Property, amenities, traffic and emotions coming together for real estate price prediction. In IEEE International Conference on Data Science and Advanced Analytics. IEEE, 2022.
- [14] Bodong Zhou, Jiahui Liu, Songyi Cui, and Yaping Zhao. Large-scale traffic congestion prediction based on multimodal fusion and representation mapping. In IEEE International Conference on Data Science and Advanced Analytics. IEEE, 2022.