Original Article \paperfieldJournal Section \corraddressRichard M. Lueptow, Department of Mechanical Engineering, Northwestern University, Evanston, IL 60208, USA. \corremailr-lueptow@northwestern.edu \fundinginfoNSF Grant no. CBET-1929265.
Designing minimally-segregating granular mixtures for gravity-driven surface flows
Abstract
In dense flowing bidisperse particle mixtures varying in size or density alone, smaller particles sink (driven by percolation) and lighter particles rise (driven by buoyancy). But when the particle species differ from each other in both size and density, percolation and buoyancy can either enhance (large/light and small/heavy) or oppose (large/heavy and small/light) each other. In the latter case, a local equilibrium condition can exist in which the two segregation mechanisms balance and particles remain mixed: this allows the design of minimally-segregating mixtures by specifying particle size ratio, density ratio, and mixture concentration. Using experimentally validated DEM simulations, we show that mixtures specified by the methodology remain relatively well-mixed in the thin rapid surface flows characteristic of heaps and tumblers commonly used in industry. Furthermore, minimally-segregating particle mixtures prepared in a fully segregated state in a tumbler mix over time and eventually reach a state of nearly uniform species concentration.
keywords:
segregation, mixing, granular flow, heaps, tumblers, non-segregating1 Introduction
Dense flows of granular materials tend to spontaneously segregate by particle size,[1, 2, 3, 4, 5, 6, 7] density,[8, 9, 10, 11, 12], shape,[13, 14, 15, 16] friction coefficient,[17, 18] or other physical properties, which can be problematic in many industries due to the deleterious impact of inhomogeneity on product quality.[19, 20, 21, 22, 23, 24, 25] Among the particle properties that drive segregation, size and density are usually the dominant factors.[26, 27] In dense flows of size-disperse equal-density particles (S-system), large particles tend to rise as small particles fall through voids, [28, 29, 30] a segregation mechanism known as percolation. For density-disperse equal-size particle mixtures (D-system), segregation is driven by a buoyant force mechanism in which heavy particles sink and light particles rise.[31, 32, 33] When particle species differ from each other in both size and density (SD-system), the two segregation mechanisms interact, resulting in more complicated segregation behavior.[34, 35, 36, 37, 38, 39] Though size and density differences can reinforce each other, i.e., in mixtures of large light particles and small heavy particles, we are interested here in the opposite situation where the two segregation mechanisms oppose each other, i.e., in mixtures of large heavy particles and small light particles, as this case has the potential to reduce species segregation compared to the corresponding pure S- or pure D-system.
Previous studies show that the tendency of spherical particles to sink or rise in a bidisperse mixture can be characterized by the ratios of large to small particle diameter, (subscript for large particles and for small particles), and density, , along with the mixture volume concentration (or equivalently , as +, assuming the solid volume fraction is constant).[40, 41, 42, 43, 44] Unlike size or density segregation alone, where which species rises or sinks depends only on or but does not depend on mixture concentration, the segregation direction in an SD-system can be concentration dependent, and a mixed equilibrium state can exist where the effects of particle size and density differences balance.[26, 45]
Although granular systems are challenging to study analytically compared to fluid flows because governing equations analogous to the Navier-Stokes equations for fluids are not yet fully established (although progress is being made in this direction[46, 47, 48, 49, 50, 51]), granular materials can offer a conceptual advantage compared to fluids. In many systems of practical interest—particularly tumbling and heap formation—the granular flow occurs only in thin regions of rapid flow,[52] even in large-scale industrial processes. Thus, understanding flow and segregation in this thin shear layer provides a key building block for understanding how to scale-up processes of industrial significance.[53] In fact, we recently developed a segregation model based on the continuum advection-diffusion equation[54, 55, 24, 25] that predicts the degree to which two non-cohesive particle species differing in both size and density will segregate in thin rapid surface flows.[56] Specifically, the model predicts a segregation velocity that depends linearly on the local shear rate and quadratically on the species concentration. The segregation velocity is characterized by two empirical coefficients that are functions of and . Streamwise concentration profiles predicted by incorporating this segregation velocity model into a continuum advection-diffusion-segregation transport model match DEM simulation results well for free surface heap flows over a wide range of and . An important feature of the model is the ability to predict the large particle “equilibrium concentration,” , at which size-related percolation and density-related buoyancy offset one another such that the segregation flux of each of the two species is zero.[56, 57] In other words, an initially mixed bidisperse particle mixture does not segregate.
In this paper, we use model predictions for to demonstrate how minimally-segregating granular mixtures can be designed based on appropriate choices of , , and . Particle mixtures prepared near the predicted equilibrium conditions are tested in discrete element method (DEM) simulations for free surface flows on bounded heaps and in rotating tumblers to characterize the degree to which the particles remain mixed. We also provide a limited number of experiments confirming the rotating tumbler simulations. Because flows of granular materials are often restricted to thin regions of rapid surface flow even in large-scale systems, this research offers an approach to intentionally design particle systems for industrial processes for which otherwise segregating particles will become or remain relatively well-mixed.
2 Predicting Non-segregating Mixture Conditions
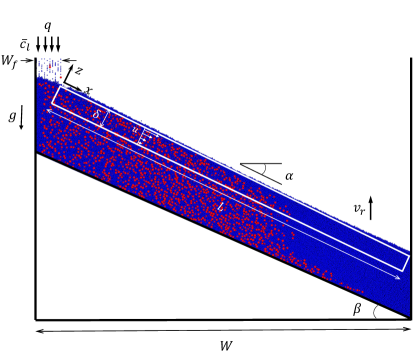
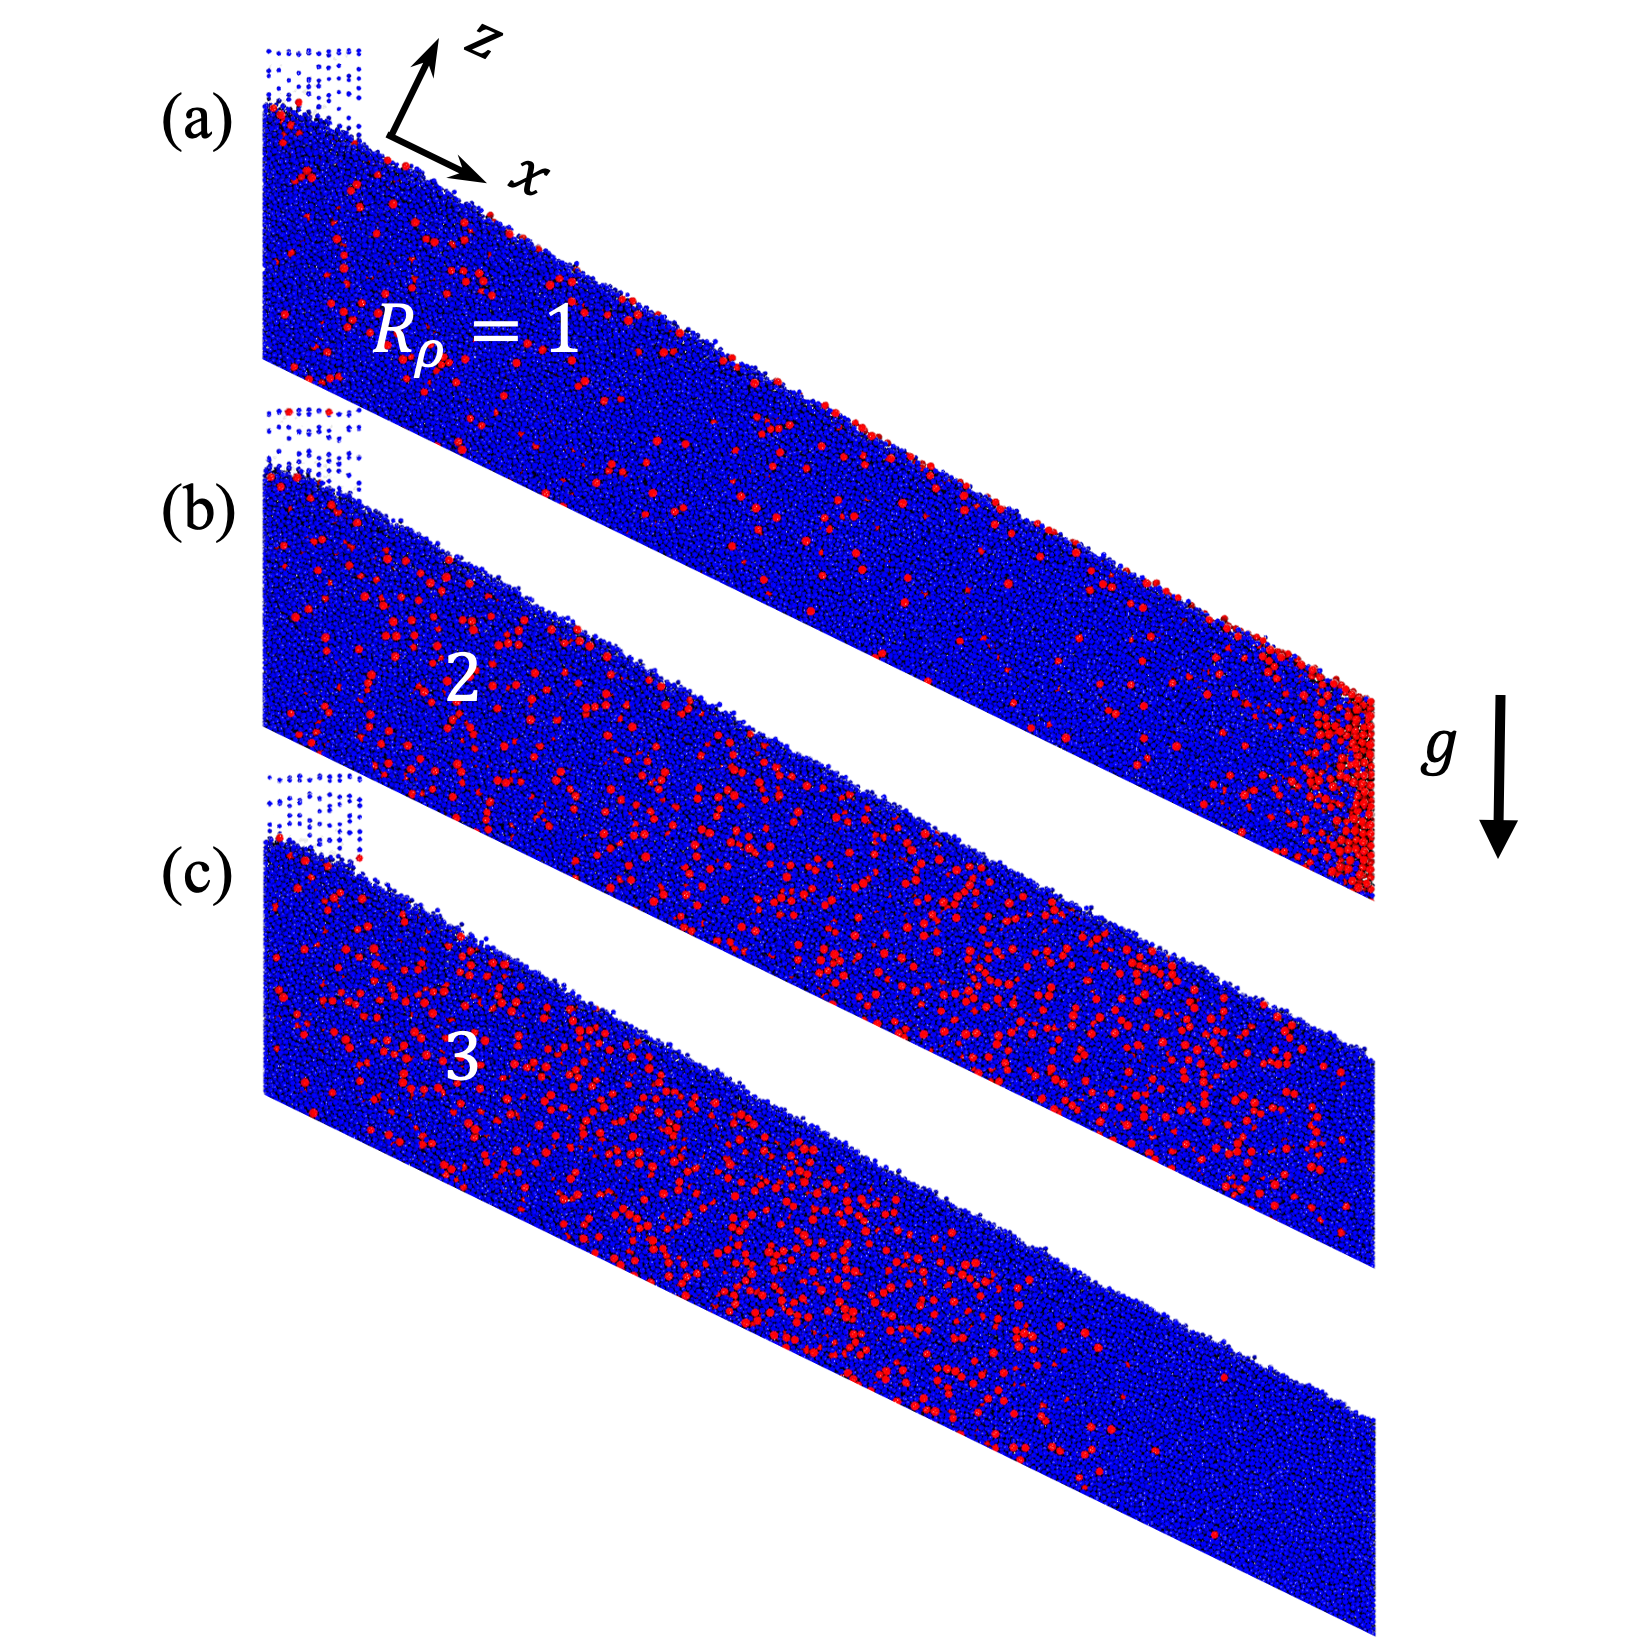
Consider DEM simulations of combined size and density segregation of a bidisperse mixture in a single-sided quasi-2D bounded heap flow. For the example shown in Figure 1, the domain has width and thickness in the -direction. Particles flow down and to the right in a thin flowing layer of length and relatively constant thickness [58] (corresponding approximately to the white rectangle having a depth exaggerated by a factor of about two to make it more visible) and are deposited continuously at a uniform rate onto the static bed. Particles are fed onto the left side of the heap at an effective 2-D flow rate ( is the volumetric feed rate) and with large particle feed concentration , where the bar indicates the feed concentration or the global concentration rather than the local large particle concentration, ; the heap rises with velocity . The coordinate system is rotated by the repose angle, , such that the -axis is in the steamwise direction, the -axis is in the spanwise direction, and the -axis is normal to the free surface. The origin is located on the free surface at the downstream edge of the vertical feed region and rises with the free surface of the heap. To reduce computation time, the bottom wall is inclined at an angle , roughly matching the repose angle . Simulations are performed using our in-house DEM code,[56, 59] which runs on CUDA-enabled GPUs and has been previously validated by heap flow experiments with mm-sized particles.[60, 61] For all simulations, particle-particle and particle-wall contacts use a friction coefficient of , a binary collision time of ms, and a relatively low restitution coefficient of to minimize the downstream flux of bouncing particles.
In the case shown in Figure 1 for large heavy particles (red) with and small light particles (blue) with and , the conditions are such that the small light particles (blue) rise to the surface of the flowing layer. As a result, the small light (blue) particles flow further down the slope to deposit in a nearly pure blue particle region at the downstream end of the heap, while large heavy particles (red) mixed with the small light particles (blue) deposit on the upstream portion of the heap.
The advantage of considering heap flows over other flow configurations (e.g., plane shear flows or chute flows) is that the local shear rate and the particle species concentration vary throughout the length and depth of the flowing layer but remain constant at a particular location in the flow (when analysed in a reference frame that rises with the heap surface at rise velocity, ). As a result, the time-averaged segregation flux ( where is the species-specific velocity in the -direction) for a wide range of flow conditions ( and ) can be obtained at different locations in the flowing layer from just one simulation. However, the full range of local concentrations is not usually realized in a single simulation, especially for weakly segregating mixtures, so typically several simulations are conducted with different large particle feed concentrations, , to provide data covering the full range of possible local concentrations .[44, 56]
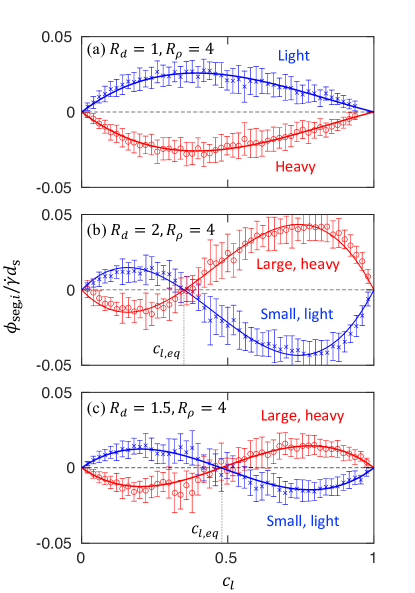
Based on simulations like that shown in Figure 1, the segregation flux dependence on species concentration can be obtained for different values of and for SD-systems. Figure 2 shows the mean scaled segregation flux versus local large particle concentration from heap flow simulations for three (, ) pairs including the example in Figure 1. For all three cases, the average segregation fluxes (data points) for the small light species (blue) and the large heavy species (red) are always equal and opposite at any particular local value of , as expected for the range of size ratios studied.[62] The curves through the data in Figure 2 are best fits of the cubic segregation flux model,[56]
| (1) |
where and are fitting parameters dependent on both and . For D-system segregation with and in Figure 2a, light particles rise and heavy particles sink except at the extremes of concentration, where the flux is zero because only one species is present. The direction of the segregation is reflected by the segregation flux curves that are either positive (upward segregation for light particles) or negative (downward segregation for heavy particles) across the entire bidisperse concentration range. Unlike the ‘unidirectional’ segregation case in Figure 2a, size and density differences compete with each other for and in Figure 2b and for and in Figure 2c, and the segregation direction is concentration dependent. For and small, light particles segregate upward for small values of and downward for large values of . The segregation flux direction reverses at where . For and , a similar situation occurs except that increases to 0.47. In addition, the overall concentration averaged segregation flux is smaller for the case in Figure 2c than the case in Figure 2b due to the near balance between the two segregation mechanisms across the full range of concentrations.
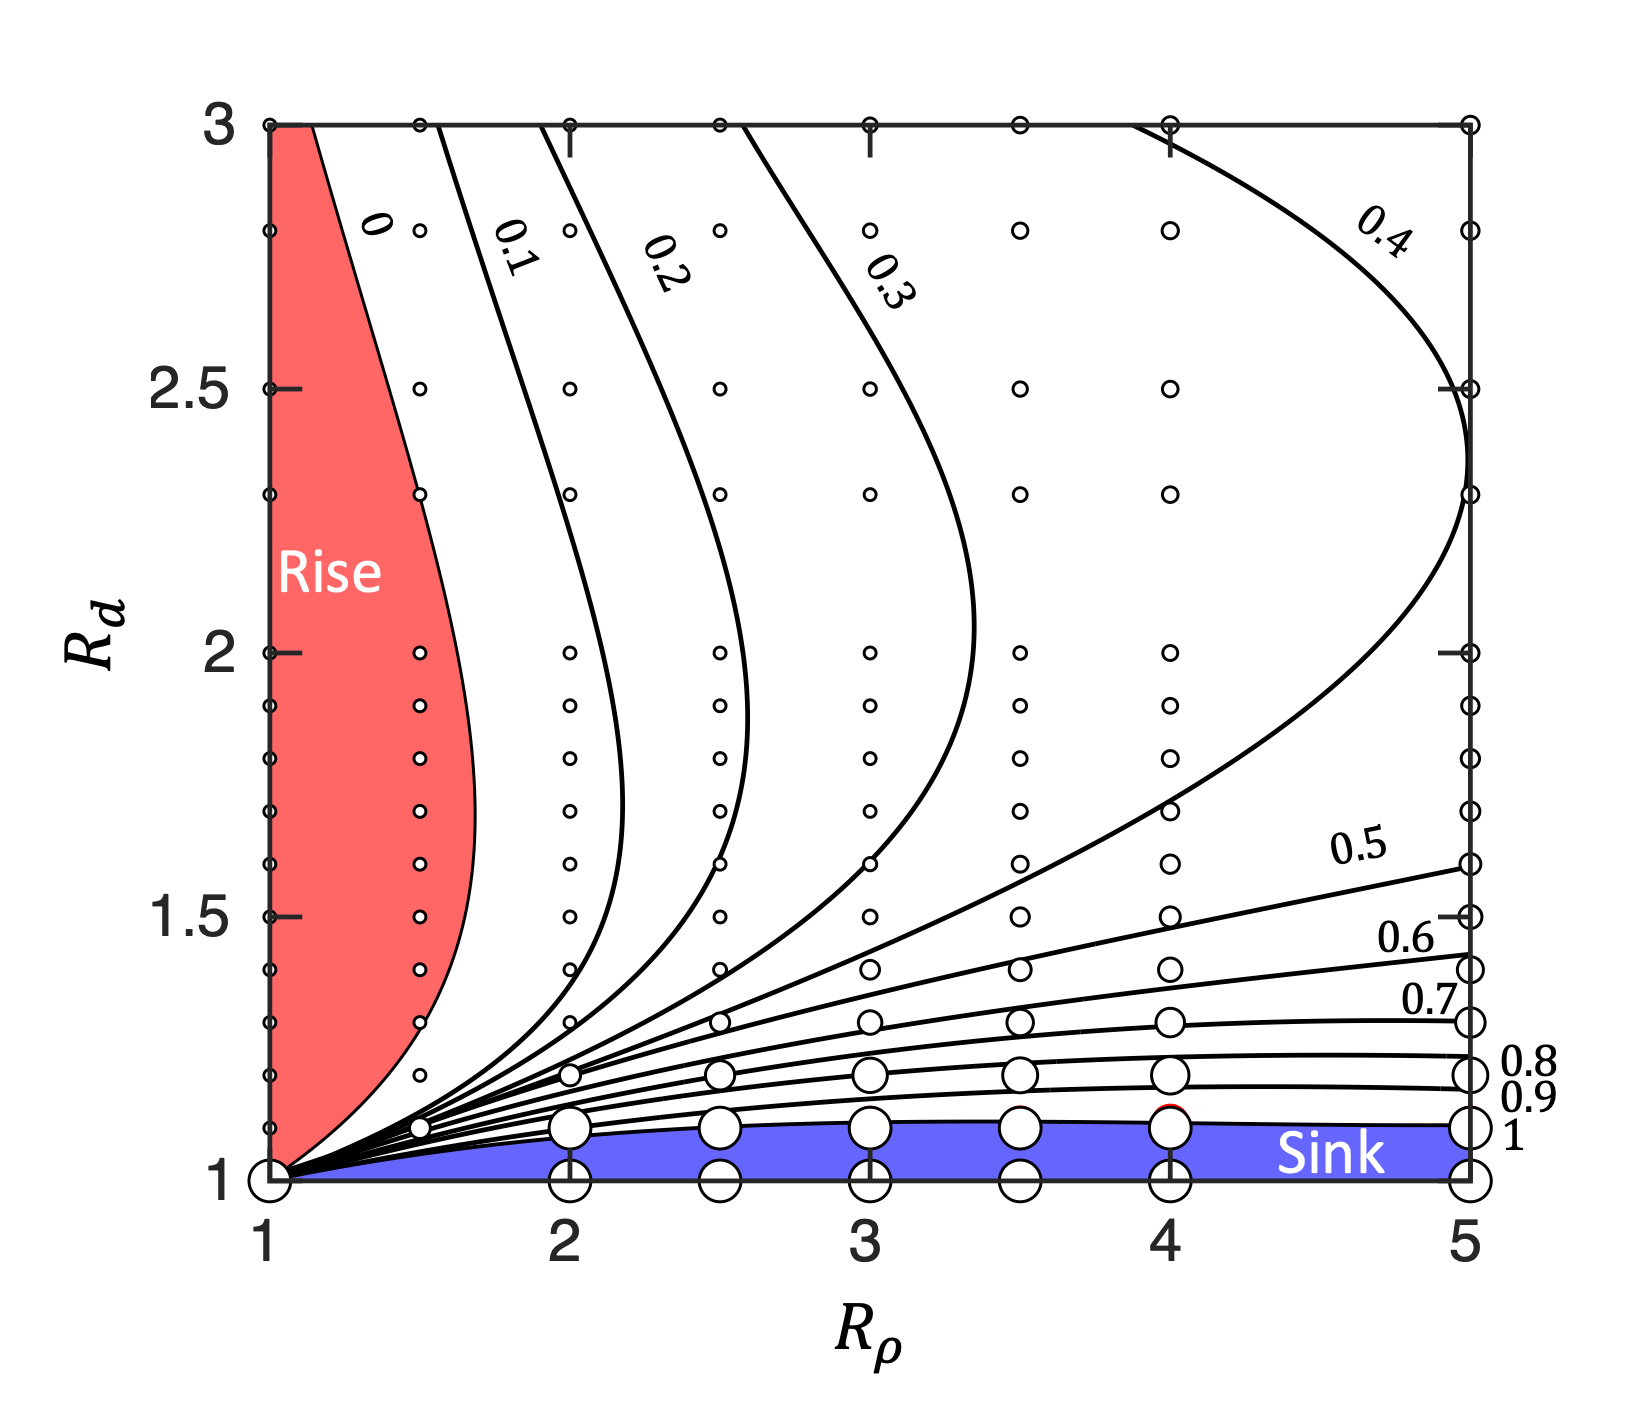
Repeating heap flow simulations like that shown in Figure 1 over many (, combinations results in figures analogous to those in Figure 2 from which can be obtained. Using this approach, the dependence of on and was previously explored for and . [56] Here we extend to and . The curves in Figure 3 are cubic fits to the interpolated data for forced to pass through (, ), where the segregation is necessarily zero. Particles remain mixed along the curve for for the corresponding and . For and combinations to the left of or above the iso-concentration curve for , large particles rise, while large particles sink for combinations to the right of or below the iso-concentration curve for . Along each axis are regions (colored red or blue) where the segregation is uni-directional, corresponding to cases like that shown in Figure 2a. Size segregation dominates regardless of density in a region adjacent to the vertical axis where large particles rise even if they are slightly heavier than the small particles (red), and density segregation dominates in a narrow band adjacent to the horizontal axis where large particles sink because they are heavier than the small particles (blue).
As previously described,[56, 57] Figure 3 allows an approach for the intentional design of bidisperse particle mixtures that avoid segregation. For instance, in many industrial situations the material of each particle species is specified, thereby fixing the density ratio, and the concentration of each species is fixed based on the product requirements. However, the species sizes can be altered by one of several standard processes such as agglomeration or grinding. Thus, it is possible to specify a size ratio for a given density ratio and relative concentration of species that minimizes segregation. For example, suppose that a 20:80 species concentration mixture is required and the density ratio of the two species is . Starting at and reading upward to the contour in Figure 3 indicates that a size ratio of should result in a non-segregating mixture. In the remainder of this paper, we explore this approach to designing minimally-segregating bidisperse particle systems.
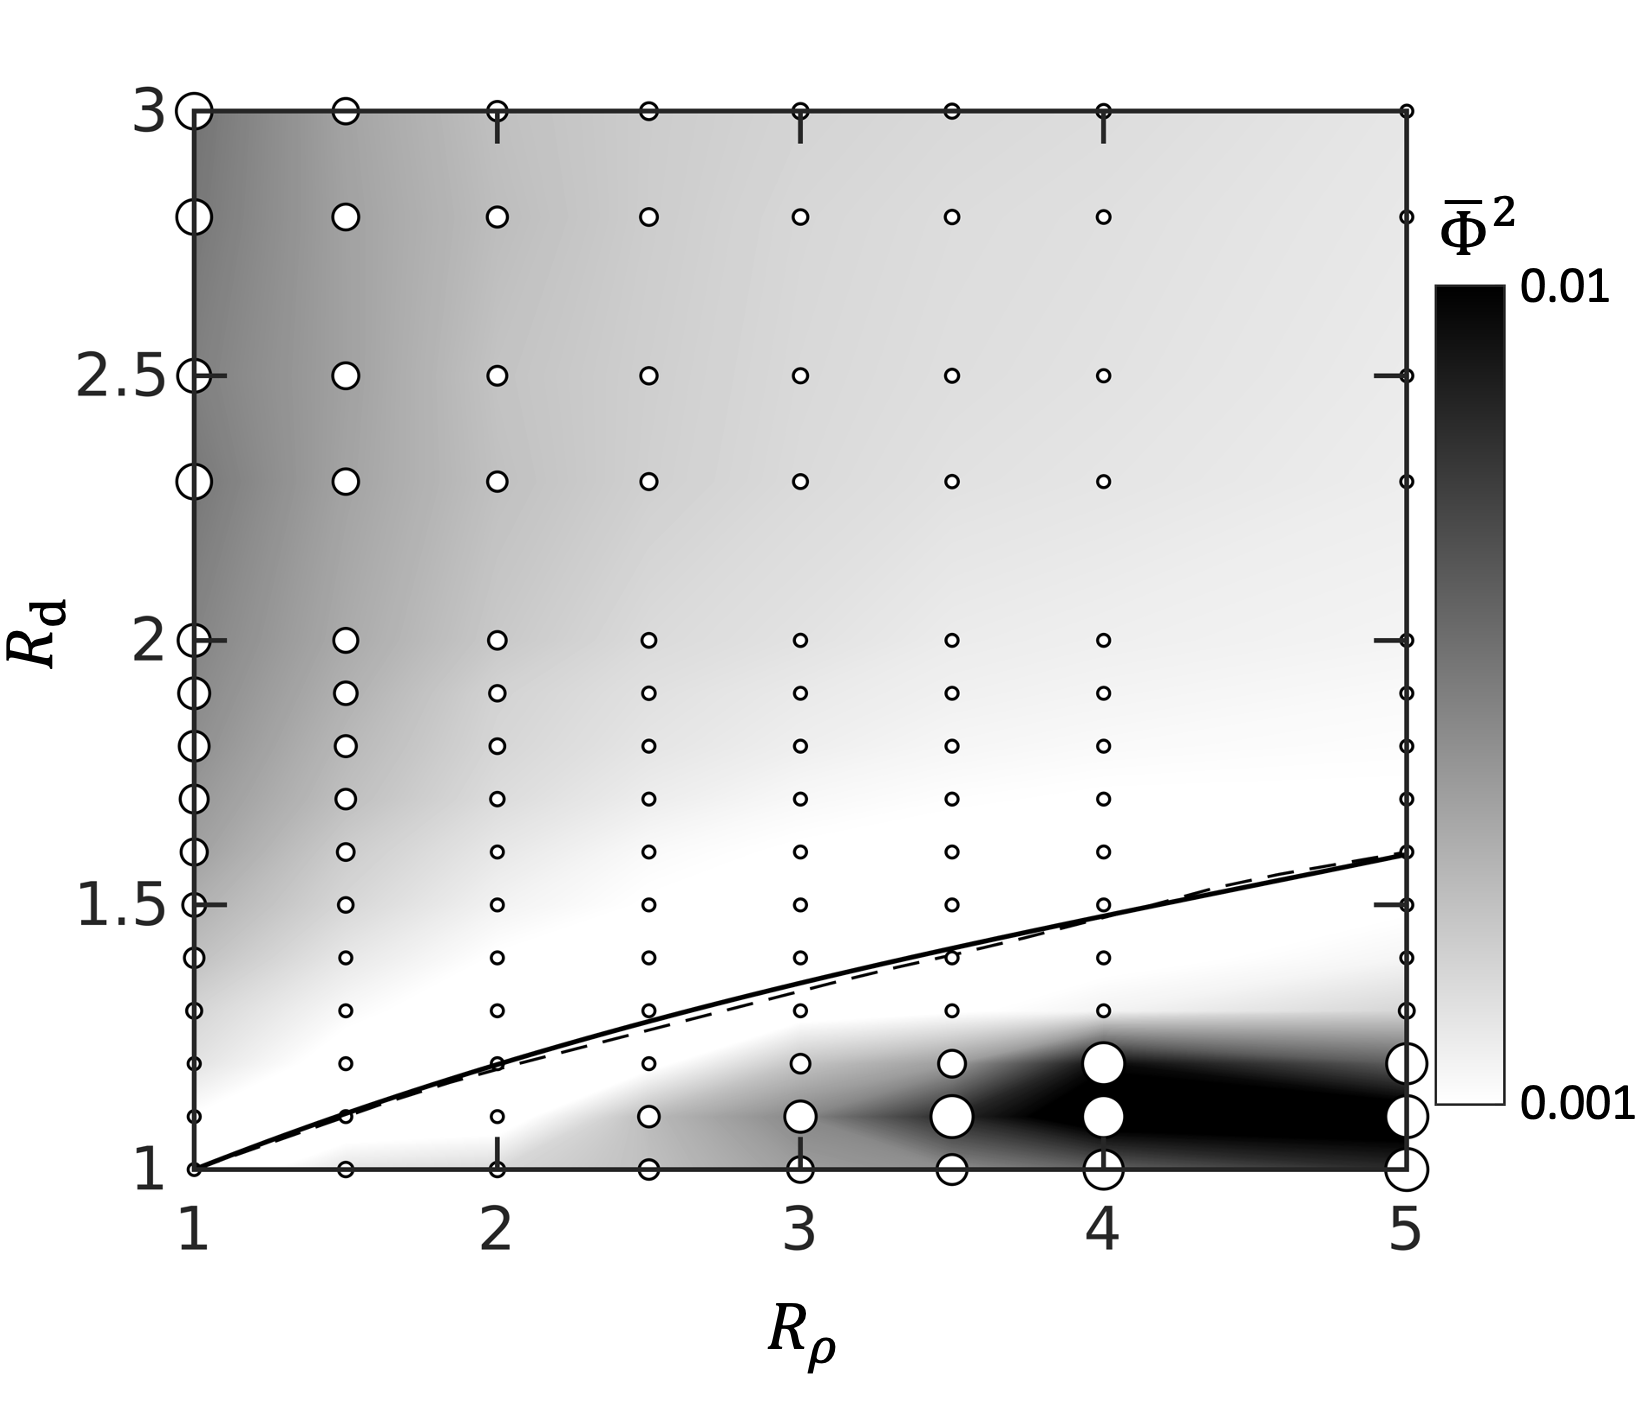
Before continuing with the approach of designing minimally-segregating particle mixtures by using the appropriate combination of , , and , we consider briefly an alternative approach that ignores and is therefore more general. Returning to Figure 2, it is evident that the magnitude of the segregation flux depends on size and density ratios in addition to the mixture concentration. For instance, the segregation flux across all values of for and in Figure 2c is generally less than that for and in Figure 2b. Hence, a system with and would tend to segregate less, regardless of mixture concentration, than a system with and . Using data across the full range of and considered here, we quantify this average tendency toward segregation at a particular combination of and as the square of the dimensionless segregation flux averaged over all possible concentrations,
| (2) |
which is plotted in Figure 4 as a function of size and density ratios. The grayscale reflects the sensitivity of the system to segregation across all possible concentrations . Combinations of and in brighter areas of Figure 4 tend to segregate less across all mixture concentrations, while combinations in darker areas tend to segregate more. The least segregation occurs for combinations of and along the dashed curve, which is calculated as .333For application, the curve can be approximated as a linear function . Interestingly, this curve for the least segregation corresponds closely to the curve from Figure 3 which is reproduced in Figure 4 as the solid curve. This is because the lowest flux magnitudes tend to occur when is around 0.5 as is evident in comparing Figures 2b and 2c.
Figure 4 offers an alternative approach to the one based on Figure 3 where is set to to prevent segregation. This alternative is simply to ignore the mixture concentration and operate in the light colored region of Figure 4 along the dashed curve for the minimum value of . In this case, for a given density ratio for the two particle species, the size ratio would be adjusted to fall on the minimum segregation curve in Figure 4. For instance, for the preceding example with a density ratio , the size ratio should be set to to minimize segregation across all possible concentrations. While this approach will result in more segregation when , it may be easier to implement in some industrial situations. However, since the approach in Figure 3 using is more precise in avoiding segregation than the alternative approach based on Figure 4, we focus on the former in the remainder of this paper.
3 Validating predictions for non-segregating mixtures
The phase diagram in Figure 3 is based on the local segregation flux, and the equilibrium concentration is inherently a local variable at each point within the thin flowing layer typical of many gravity-driven granular flows. However, the requirement that everywhere in the flow to prevent segregation is unlikely to be realized exactly in real systems due to the stochastic nature of granular flows which drives local variations in the mixture concentration, as well as to deviations in the actual velocity profile from that of the bounded heap for which the curves in Figure 3 were obtained. Furthermore, the averaging approach used to obtain Figure 3 and Equation 1 ignores the potential influence of absolute pressure [63] and pressure variation in combination with the effects of the shear rate gradient[64] on segregation. Hence, the question is if a uniformly mixed system with a global concentration of remains mixed or locally segregates across different flow geometries and initial conditions. In this section, we validate and demonstrate the potential for designing minimally-segregating granular mixtures using the approach of specifying , , and (Figure 3) by quantifying and comparing the segregation of particles near the equilibrium conditions shown in Figure 3 predicted by Eq. 1 in bounded heaps and rotating tumblers. The goal is to determine how the local propensity for mixing or segregation shown in Figure 3 affects the global segregation across the entire flow domain.
3.1 Bounded heap flow
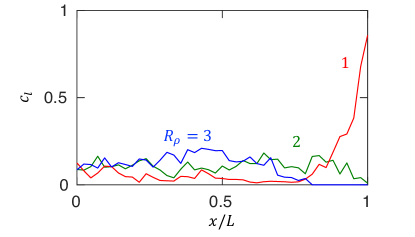
We consider first the global segregation of particle mixtures prepared at the equilibrium concentration (i.e., ) and fed onto a bounded heap. Figure 5 shows the segregation patterns resulting from a feed concentration of , , and three different values of . For large red particles segregate upward to the free surface of the flowing layer and deposit downstream near the endwall, indicating that size-based percolation dominates. Particles remain relatively mixed over most of the heap for , as the two segregation mechanisms nearly balance. Segregation reverses for with small light particles (blue) depositing at the downstream end of the heap as buoyancy dominates over percolation.
To quantify these results, Figure 6 plots streamwise profiles in the deposited heap for the three cases in Figure 5. For (red curve), the concentration of large particles is highest near as they deposit on the downstream portion of the heap along with a few small particles, consistent with Figure 5a. The situation reverses for (blue curve), where a higher fraction of large particles deposit on the upstream portion of the heap, and pure small particles () deposit on the downstream portion, as shown in Figure 5c. For the intermediate density ratio where size and density effects nearly balance, large particles deposit almost uniformly on the heap and the streamwise variation in (green curve) is the smallest of the three cases.
The degree and direction of segregation along the length of the heap is calculated using the signed and scaled standard deviation of the large particle concentration,
| (3) |
where is the number of uniform width bins for calculating at different streamwise positions, is the local depth-averaged volume concentration for particles deposited on the heap below the flowing layer in bin , and is the average value of for . Note that differs slightly from because it excludes the portion of the heap below the feed zone (see Figure 1). The value is essentially the standard deviation of , but with two additional multiplicative terms. The sign function, , indicates the large particle segregation direction: a value of indicates downward segregation resulting in on the upstream portion of the heap and at the downstream end; a value of corresponds to upward segregation resulting in on the upstream portion of the heap and at the downstream end. The term in the denominator normalizes the measured standard deviation by that for perfect segregation. A fully mixed, non-segregating case with large particles depositing uniformly along the surface of the heap has , while for complete segregation, for sinking large particles and for rising large particles.
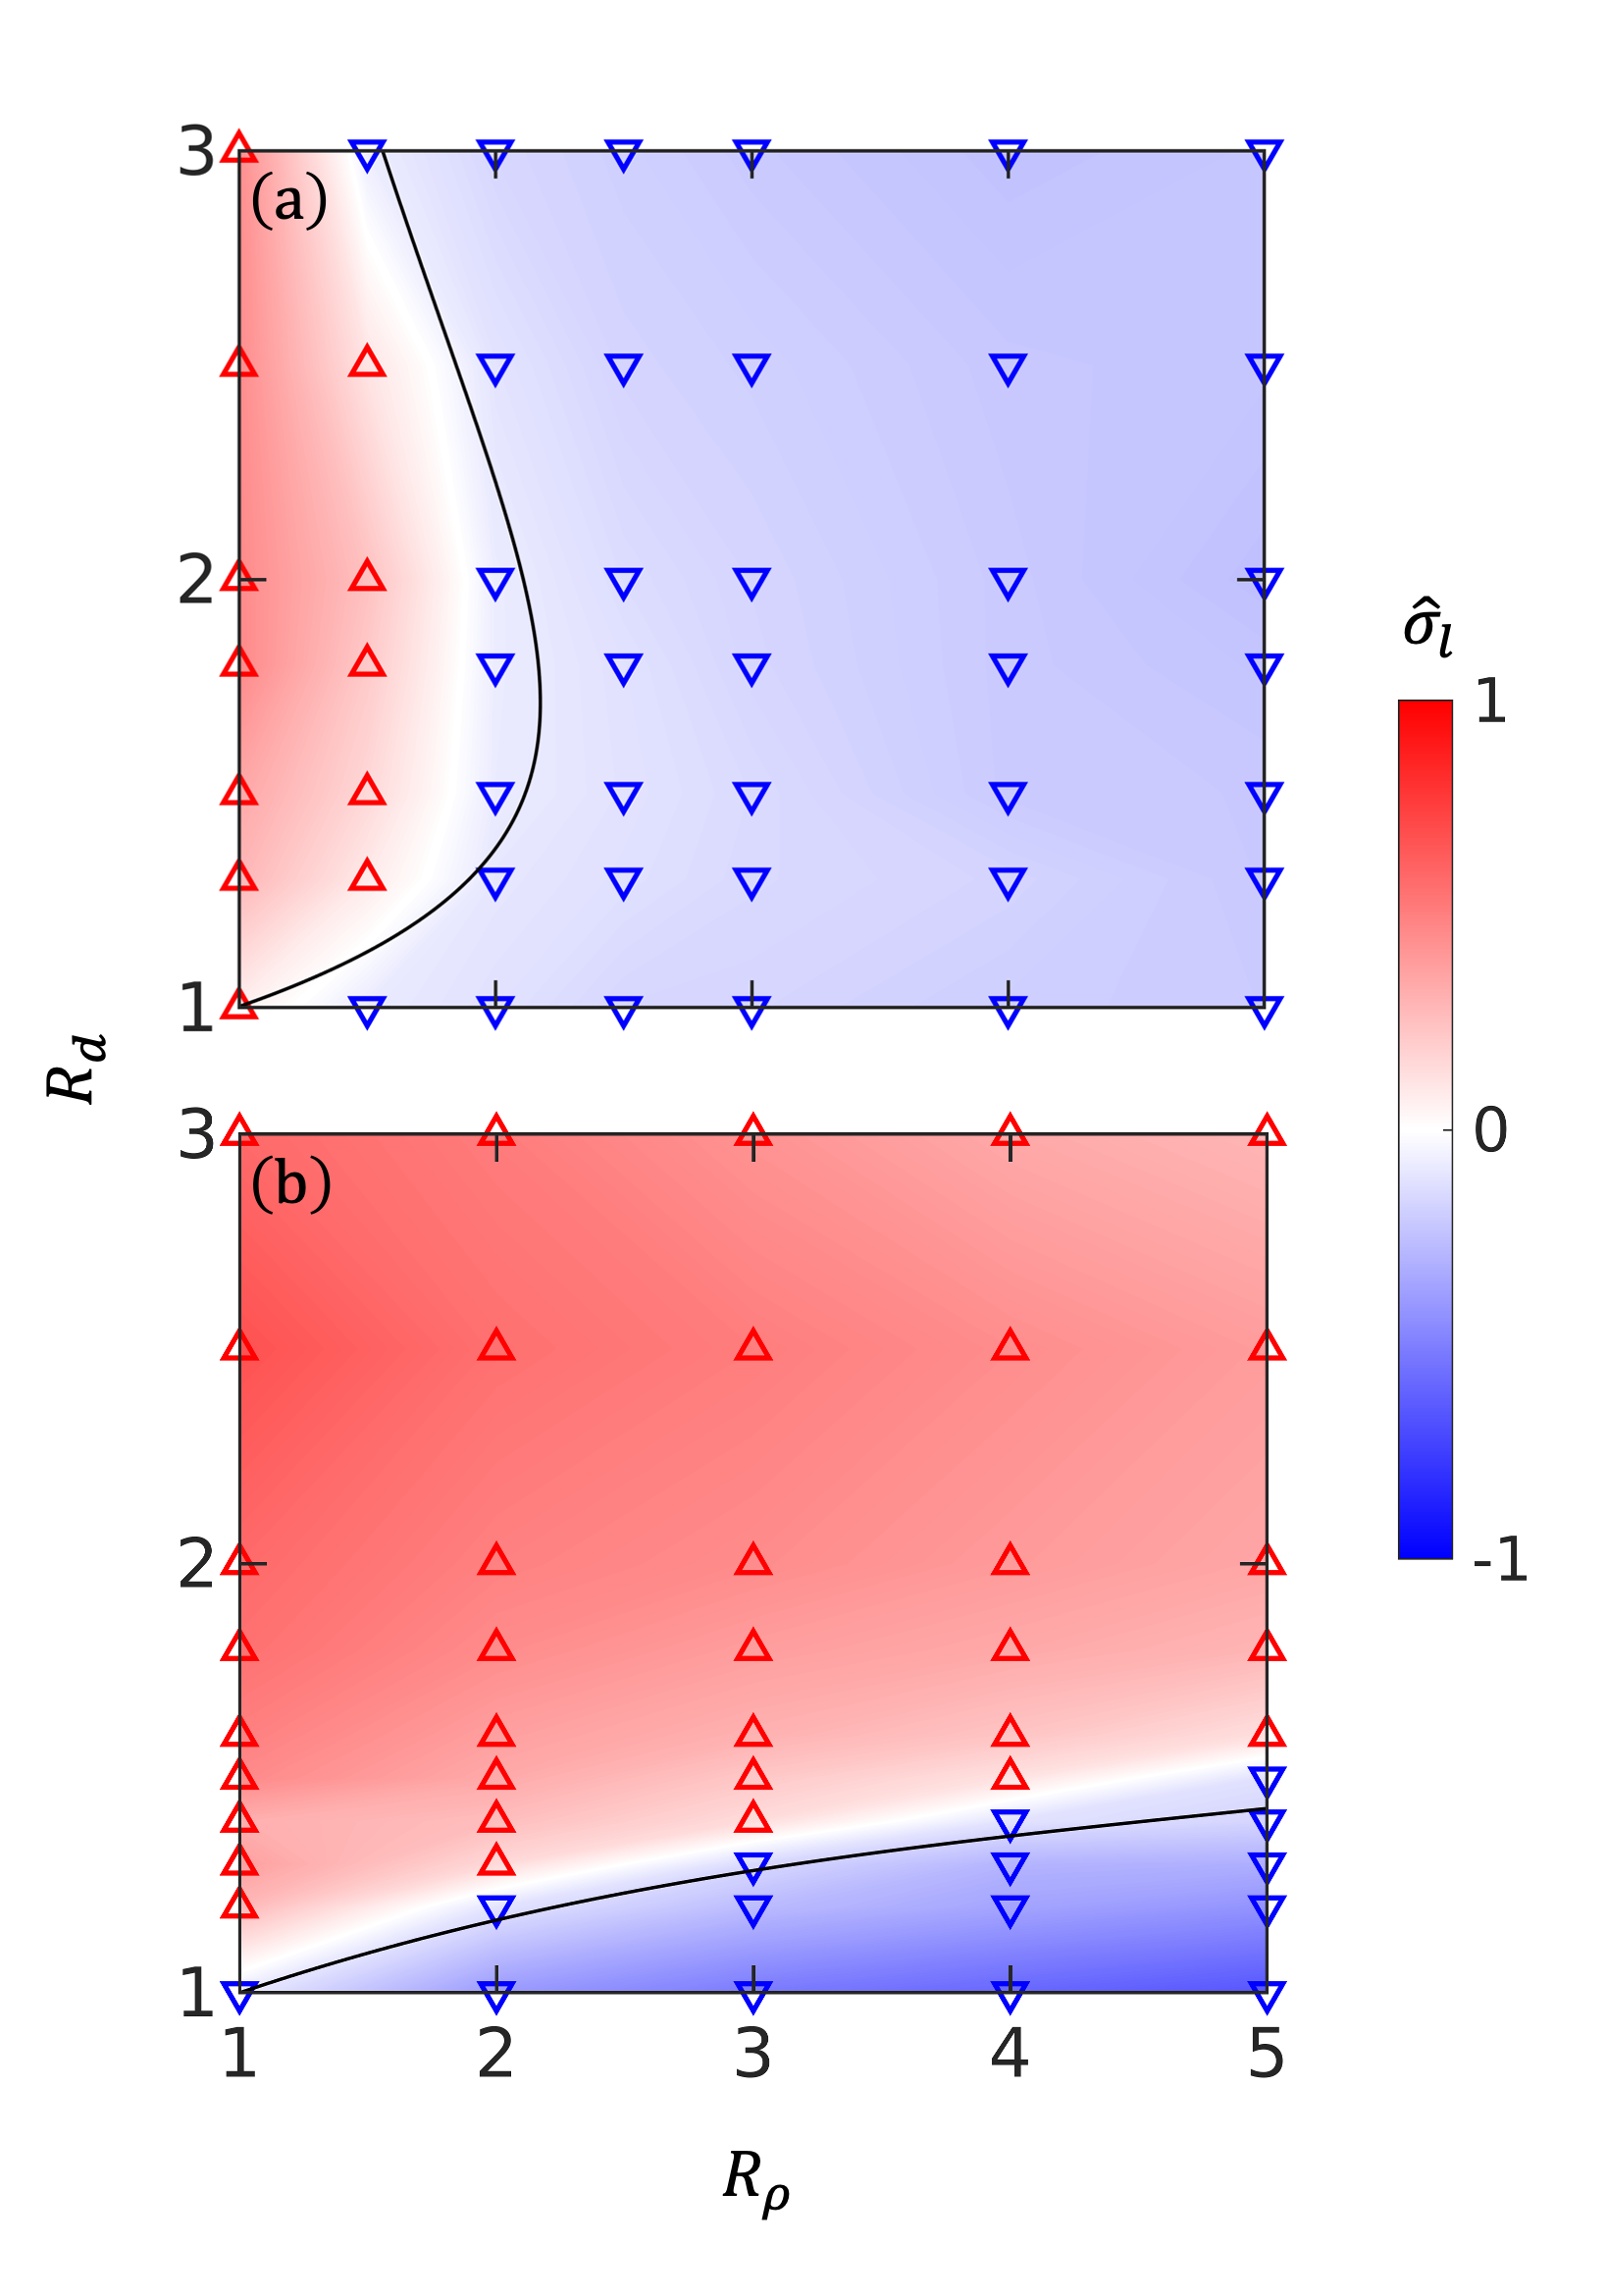
Figure 7 demonstrates how captures the rise-sink transition in heap flow simulations (data points) for 49 (, ) combinations with (Figure 7a) and 50 (, ) combinations with (Figure 7b). Red and blue shading based on interpolating these data corresponds to the degree to which deviates from the perfectly mixed state value of with white corresponding to particles remaining mixed. The predicted equilibrium curve for the local value of from Figure 3, shown by the black curve, corresponds closely to the white region, indicating that particles remain mixed at that feed concentration. In other words, the curve in the -plane along which particles are predicted to locally remain mixed from Figure 3 (black curve) corresponds closely to (,) pairs along which particles remain globally mixed for that feed concentration under heap flow (white region where ). The small deviation of the black curve from the white region could result from many factors including the resolution of data points in the (,) space and fluctuations in the local concentration similar to those observed for the weakly segregating case (green curve) shown in Figure 6.
Particle mixtures with () off the equilibrium curve in Figure 3 segregate, as expected. Conditions below and to the right of the equilibrium curve in the -plane correspond to smaller size ratios and larger density ratios, indicating that large particles sink for these conditions; conditions above and to the left of the equilibrium curve correspond to larger size ratios and smaller density ratios, indicating that large particles rise.
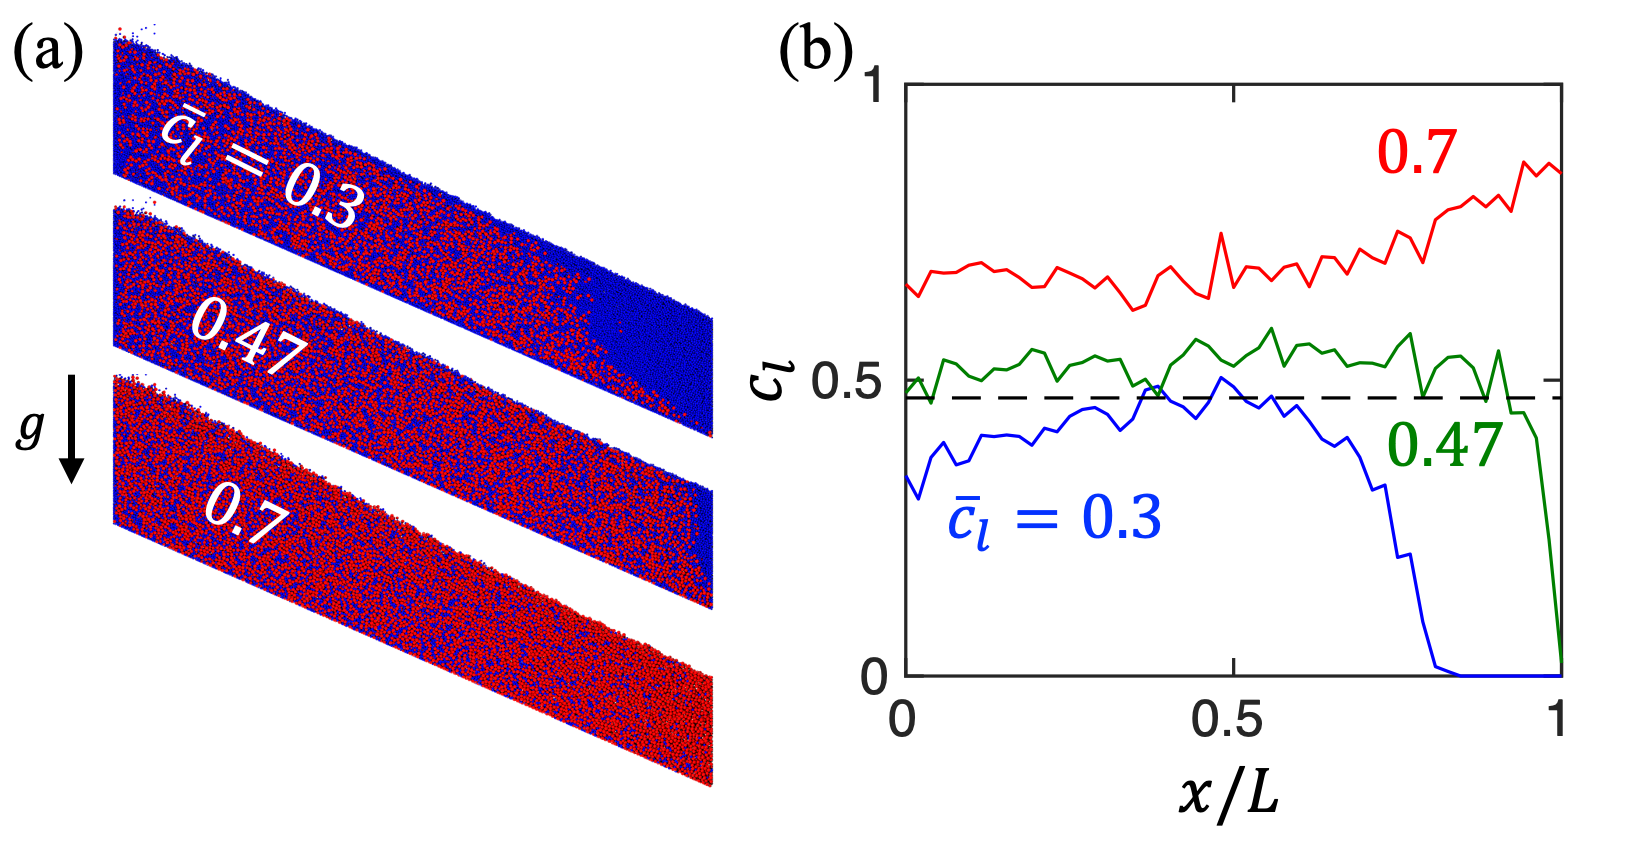
An equivalent alternate description is that if the feed concentration for a particular () pair is above the equilibrium value in Figure 3 (), then the feed concentration is too high to maintain equilibrium, and the large particles will rise resulting in . If the feed concentration for the () pair is below the equilibrium value in Figure 3 (), then the feed concentration is too low to maintain equilibrium, and large particles will sink resulting in . This is evident in the segregation examples with , , and shown in Figure 8. Large heavy particles (red) sink for , depositing on the upstream portion of the heap, whereas for large heavy particles (red) rise, depositing at a higher concentration on the downstream portion of the heap. For particles remain well mixed except near the downstream bounding endwall where decreases somewhat, potentially due to a pressure dependence of the equilibrium concentration that is unaccounted for in Equation (1) and the predictions of Figure 3, as discussed shortly with regard to the rotating tumbler results.
The implication of these results for heap flow is that the local propensity for mixing or segregation as predicted in Figure 3 also reflects the global propensity for mixing or segregation, at least to a first order. The consequence is that if granular material with is mixed at the feed, it remains mixed as it deposits on the heap. In addition, the facts that particles remain relatively mixed for (,) pairs near the equilibrium curve as shown in Figure 7, and that varies smoothly across the (,) space in Figure 7 indicate that slight deviation of from or small fluctuations in do not affect the overall propensity for particles to remain mixed in heap flows for appropriate values of and .
3.2 Rotating tumbler flow
In the previous section, we demonstrated the application of our approach for designing minimally-segregating mixtures to heap flows. Since the data for the local equilibrium concentrations in Figure 3 upon which the approach is based come from segregation in heap flows, its effectiveness is, perhaps, not surprising. The question now is if the equilibrium concentrations obtained from heap flows can be used to identify minimally-segregating mixtures in a flow geometry where the velocity field and boundary conditions differ. Here, we apply the approach to rotating tumbler flow.[34, 27, 65, 25]
Tumblers are used to coat, crush, and mix particles. Unlike bounded heaps where segregation takes place during the short period of time before the particles deposit onto the fixed bed, segregation in rotating tumblers is an ongoing process as particles repeatedly flow down the slope, enter solid-body rotation in the downstream half of the flowing layer, and then re-enter the upper half of the flowing layer after solid body rotation. There is an initial transient as initially mixed particles segregate in the flowing layer and then deposit in a segregated pattern in the first half-rotation, followed by enhanced segregation as the particles repeatedly flow down the surface. A steady segregated pattern is established after only a few tumbler rotations[66, 67, 43] in which segregated particles in the fixed bed enter the flowing layer, flow down the surface, and maintain their segregated pattern upon re-entering the fixed bed.
Here we test the same bidisperse particle mixtures as used in the heap flow simulations described in the previous section, noting that here refers to the overall large particle concentration in the tumbler rather than the feed concentration, as was the case for the heap. The half-full tumbler is cm in radius () and 1.5 cm in length with periodic boundaries in the axial direction to avoid endwall effects. The cylindrical wall of the tumbler is formed from 3 mm particles overlapping by 1.5 mm to reduce slip between the particle bed and the wall. The tumbler rotates clockwise at rev/min. The Froude number is , which corresponds to the flat surface continuous flow regime.[68]
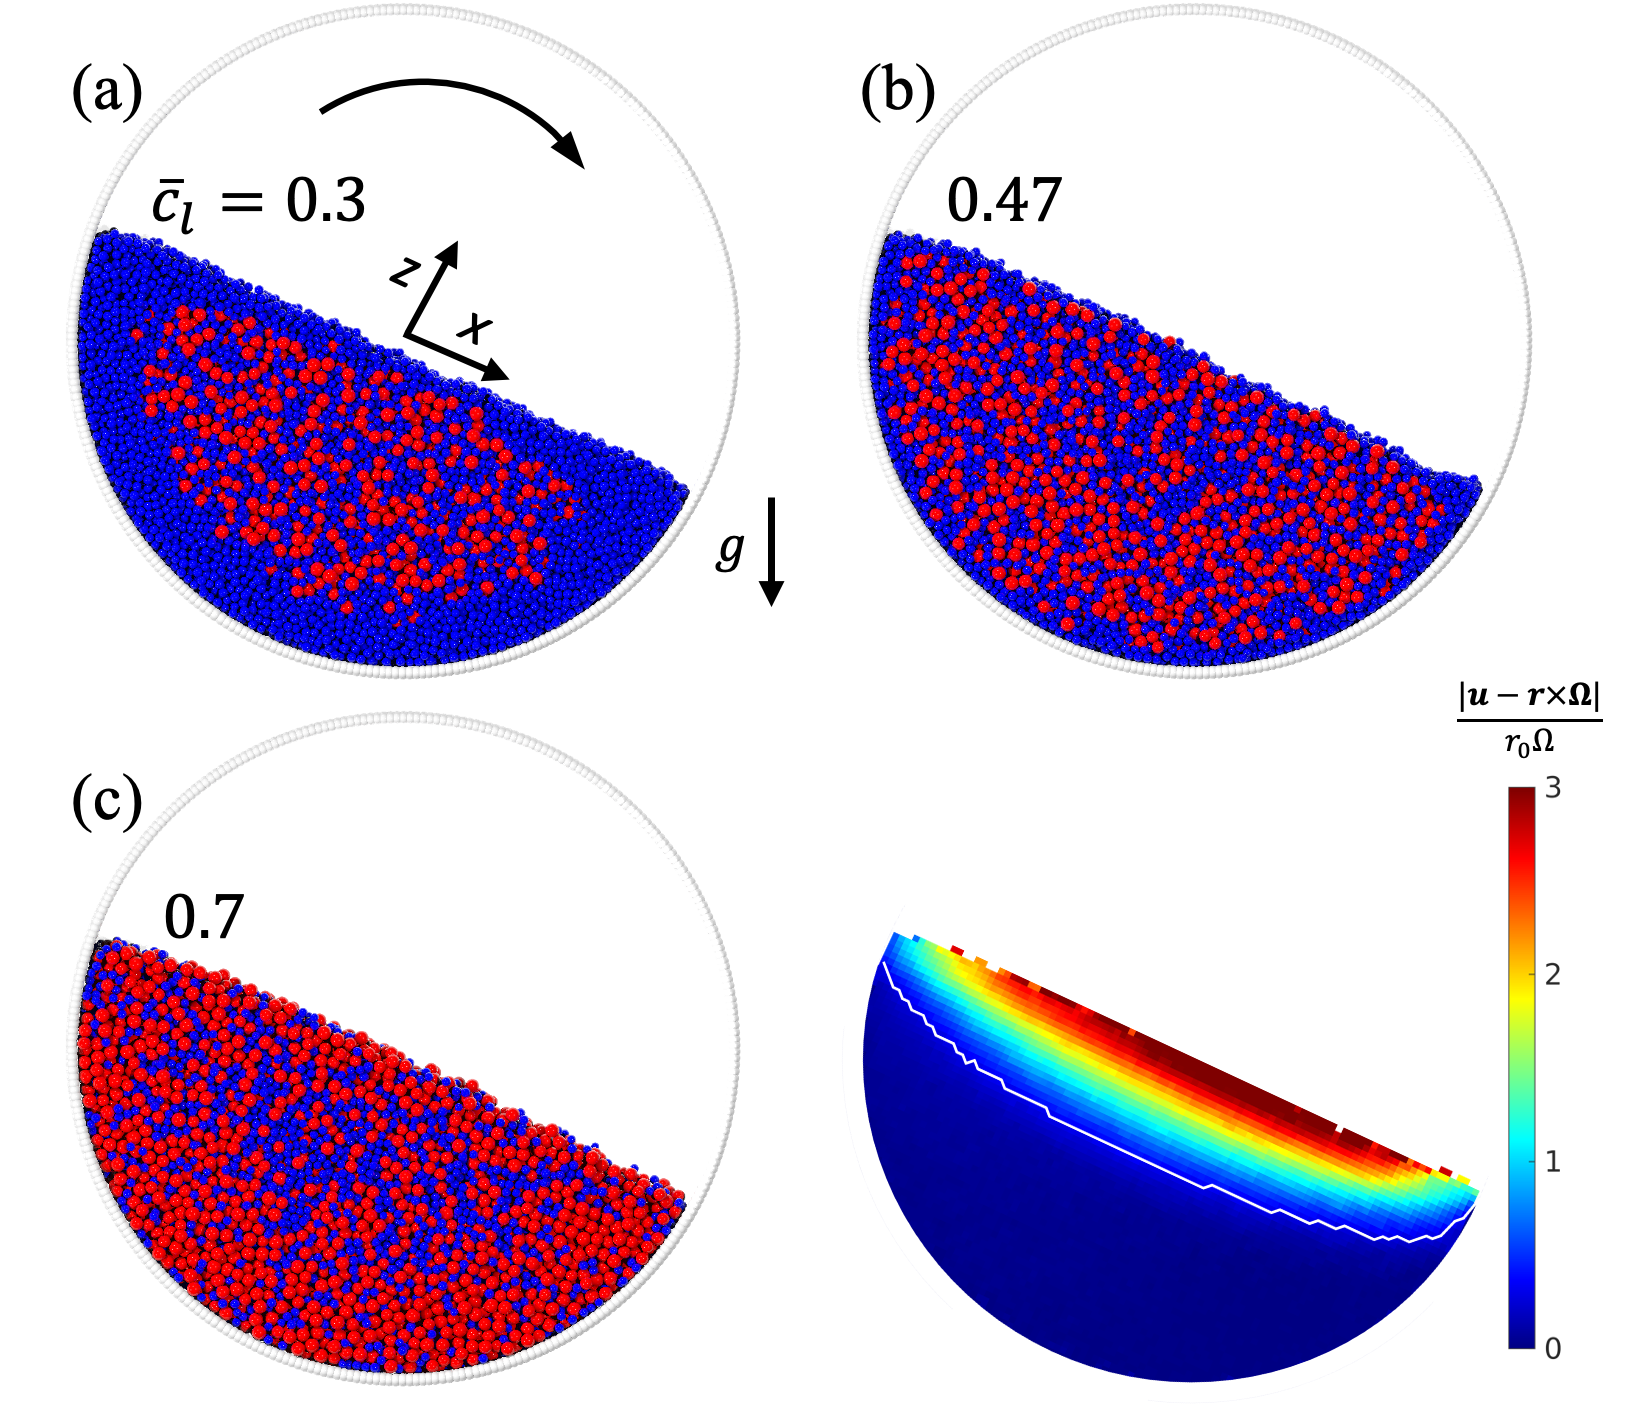
Figure 9 shows examples of the steady segregation pattern after 7 rotations () of the tumbler for the same particle mixtures used in the bounded heap examples in Figure 8 starting with a well-mixed initial condition. The equilibrium concentration of large particles for and is according to Figures 2c and 3. Similar to large heavy particles depositing in the upstream portion of the heap for , large heavy particles sink in the flowing layer and segregate to the core of the tumbler bed for in Figure 9a. Figure 9b shows that for particles remain relatively mixed, as the two segregation mechanisms nearly balance. Segregation is reversed at in Figure 9c as percolation dominates over buoyancy, i.e., large heavy particles segregate to the tumbler periphery analogous to their deposition in the downstream portion of the heap.
For reference, Figure 9d shows the non-dimensional particle speed in the rotating reference frame of the tumbler for , i.e., where is measured in the lab frame. The speed of the particles is largest at the midpoint of the free surface of the flowing layer and decreases with depth. Segregation takes place in the flowing surface layer due to shear; below this layer particles are in near solid-body rotation with the tumbler and do not segregate. The elapsed time between particle passes through the flowing layer (i.e. the solid body rotation residence time) is slightly less than half of the tumbler rotation period, and the time a particle typically spends in the flowing layer is one order of magnitude less than the tumbler rotation period.[69] Similar velocity fields are observed for the other two values of .
The core region of the tumbler bed is typically thought of as the inner part of the bed of particles where small (S-system) or heavy (D-system) particles segregate, which is surrounded by particles of the other species (large or light particles, respectively). It includes particles that are both in the flowing layer and in the fixed bed, i.e. in solid body rotation. This is evident comparing the lower bound of the flowing layer (white contour in Figure 9d) with the extent of large particle rich core region in Figure 9a. The core region spans the lower portion of the flowing layer and the inner portion of the solid body rotation region. This is most easily understood in terms of steady-state pathlines, which are, by definition, circular arcs in the portion of the bed in solid body rotation and generally in the streamwise direction, though slightly curved, in the flowing layer.[8, 27] For steady-state segregation, there is a one-to-one correspondence between the particle species distribution in the fixed bed and that in the flowing layer. Hence, the core region is reflected in both the flowing layer and the bed in solid body rotation with the core center (rotation center of the particles) at the boundary between them along a radial line at . Here, we define the approximate center of the tumbler core as the point where the velocity field is zero (white contour in Figure 9d) at the midpoint of the flowing layer (). For all cases studied here, this location is well approximated by a constant value of .
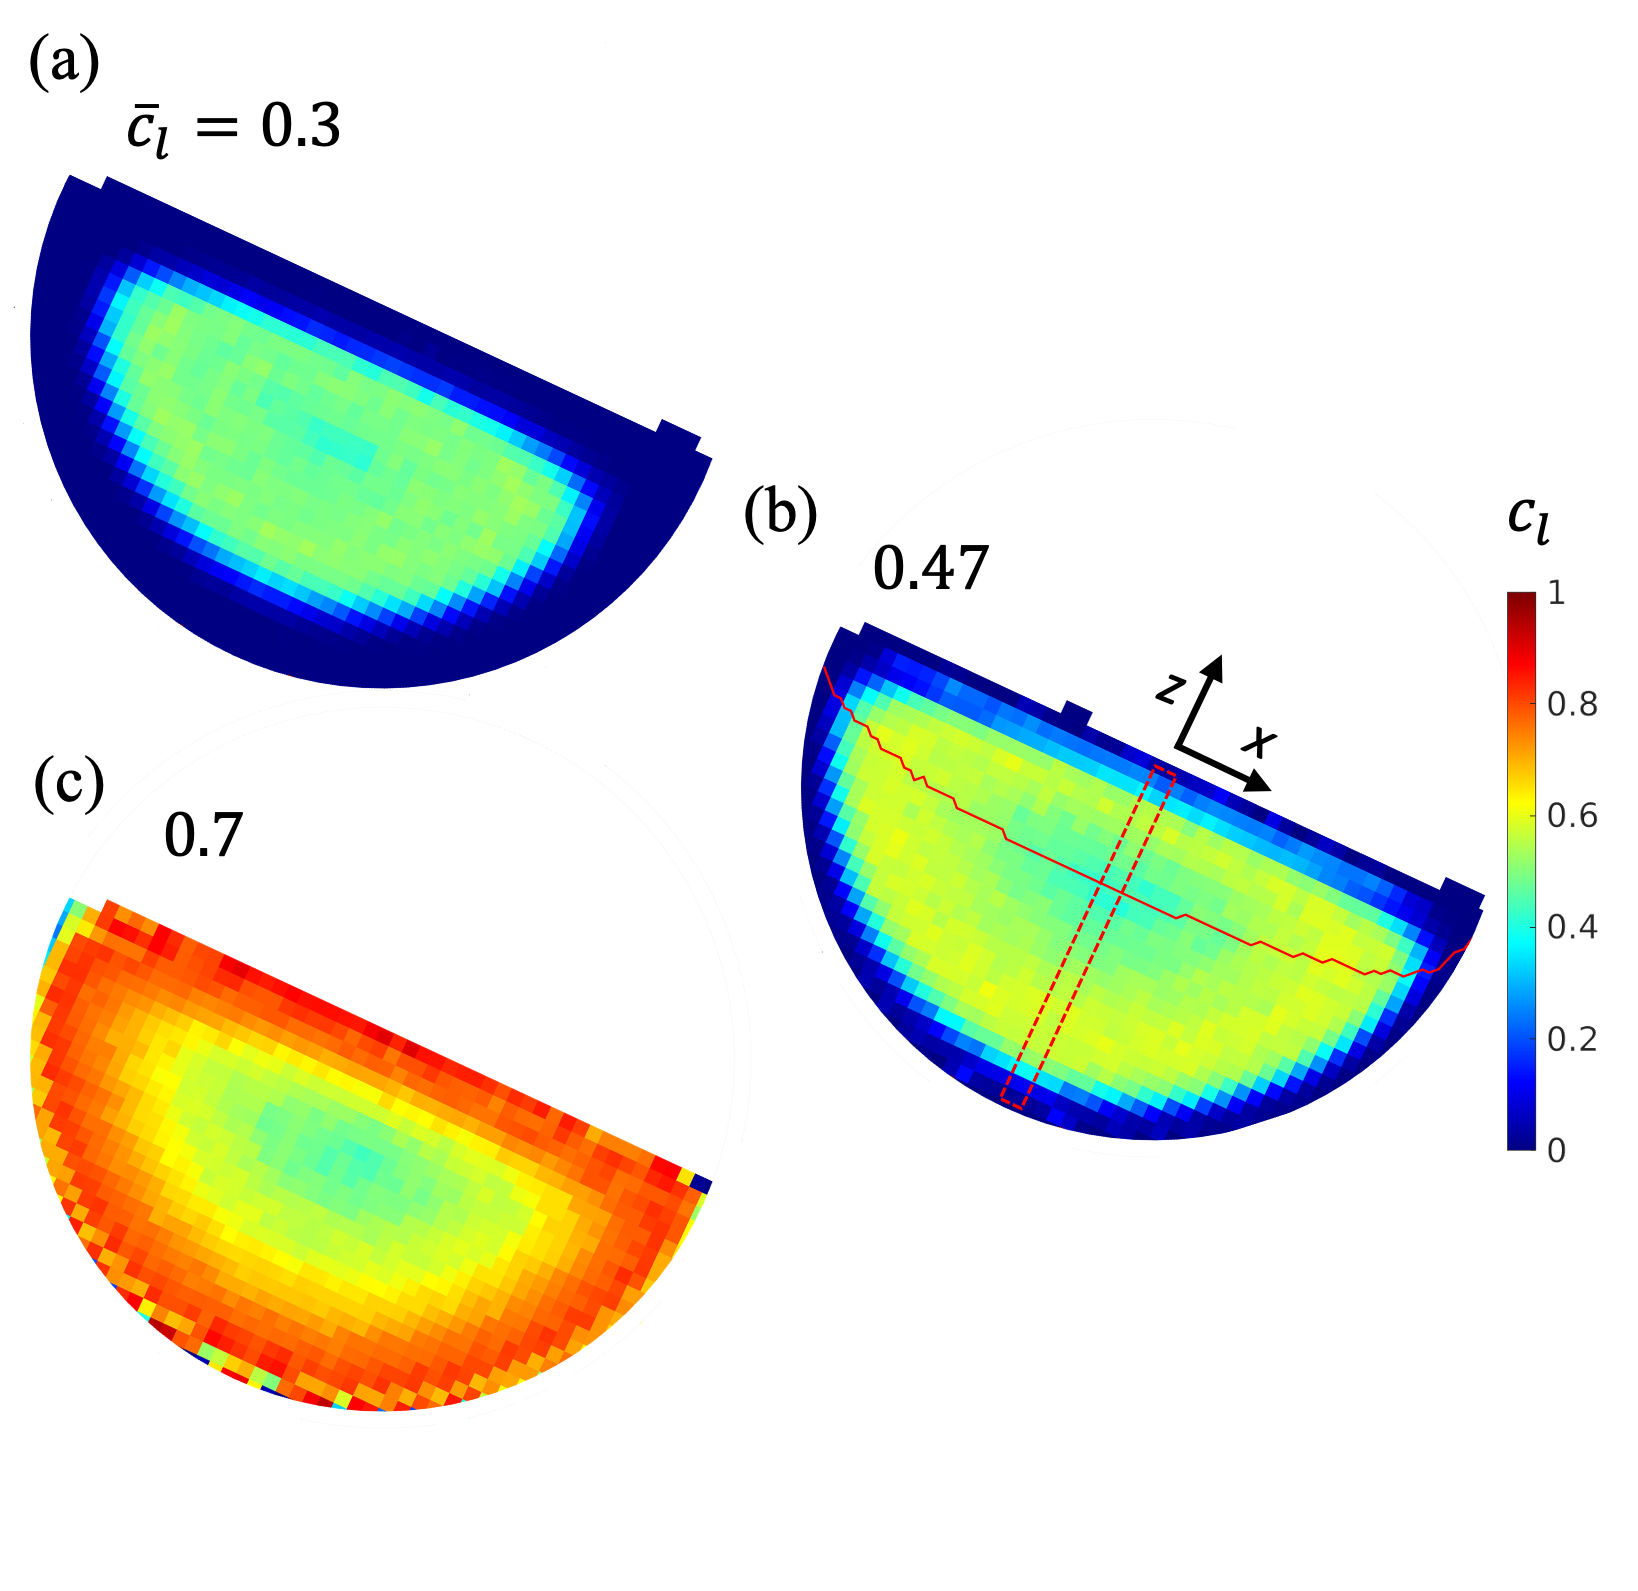
The local concentration of large particles in the three rotating tumbler cases in Figure 9 can be calculated from spatial and temporal averages of simulation data after the system reaches steady-state. Figure 10 shows the steady state concentration of large particles. In the core of the tumbler bed, away from the flowing surface layer and cylindrical tumbler wall, is nearly the same for all three cases, while the concentration surrounding the core and outward to the periphery differs significantly between the three cases. For , at the tumbler periphery is effectively zero, consistent with Figure 9a where small light particles (blue) segregate to the tumbler periphery. In contrast, for the segregation direction is reversed, and increases approaching the tumbler periphery, consistent with an excess of large heavy particles (red) at the periphery in Figure 9c.
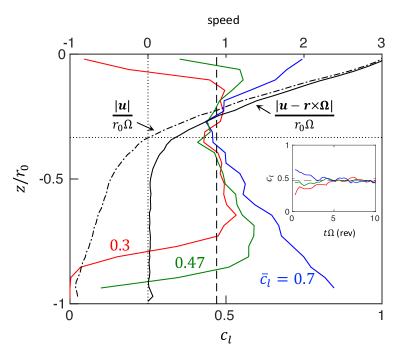
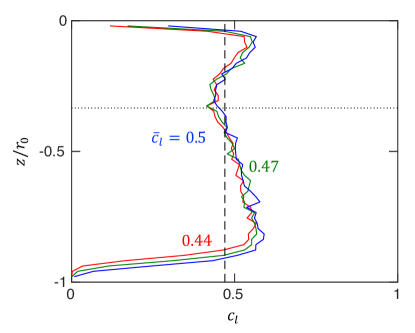
The relationship between the mixture concentration and the flowing layer thickness is depicted on a more quantitative basis in Figure 11. This figure shows the depth profile of the large particle concentration, , along a radius normal to the free surface and averaged across the narrow region within the rectangle in Figure 10b (indicated along the lower horizontal axis), as well as the scaled particle speed in the lab frame and in the rotating tumbler frame (indicated along the upper horizontal axis). Concentration data are excluded for locations where the volume fraction is below 0.3 [corresponding to near the free surface () and near the tumbler wall () due to the overlap of the rectangular averaging regions with the circular boundary of the tumbler].
The concentration profiles for the three cases in Figure 10 have a concentration in the core, corresponding to , that is approximately equal to the equilibrium concentration, , as shown in Figure 11. In particular, the profiles for all three cases overlap and have a minimum value of (dashed vertical line) at (horizontal dotted line), the approximate radial position of the core center. Thus, the center of the core and the region around it is mixed at the equilibrium concentration, , while the particle concentration in the periphery adjusts to a concentration necessary to accommodate the remaining particles, whether they are small particles (Figure 10a) or large particles (Figure 10c).
Keeping in mind that the particles are initially fully mixed, the question arises about how long it takes for the core to reach the equilibrium concentration. To answer this, the inset in Figure 11 shows time series of local concentration at the core center (i.e., at ). The concentration () starts at approximately the initial concentration in each case, and the three curves converge to the equilibrium concentration within five rotations (, or 30 s). This is also about the time necessary for the global segregation pattern to reach steady state.
From the concentration profile for in Figure 11, it is evident that the mixing is imperfect at the equilibrium condition. Nevertheless, is within a relatively narrow range except near the free surface, , and near the tumbler wall, , where it decreases. Note that to a first approximation, the concentration profile in the solid body rotation portion of the particles is simply a stretched reflection of the concentration profile in the flowing layer. This occurs because particles deposit on the steady-state pathlines described earlier. Hence, these decreased concentrations at the surface and the tumbler wall are essentially mirror images of one another. The reduced large particle concentration near the tumbler wall has been noted previously [65, 70] but not explained, to our knowledge. The deviation of from at the top of the flowing layer and near the cylindrical wall may be due to the effect of depth-varying lithostatic pressure, which is unaccounted for in the equilibrium concentration results in Figure 3. An extended discussion of this deviation in is included in Sec. 6.
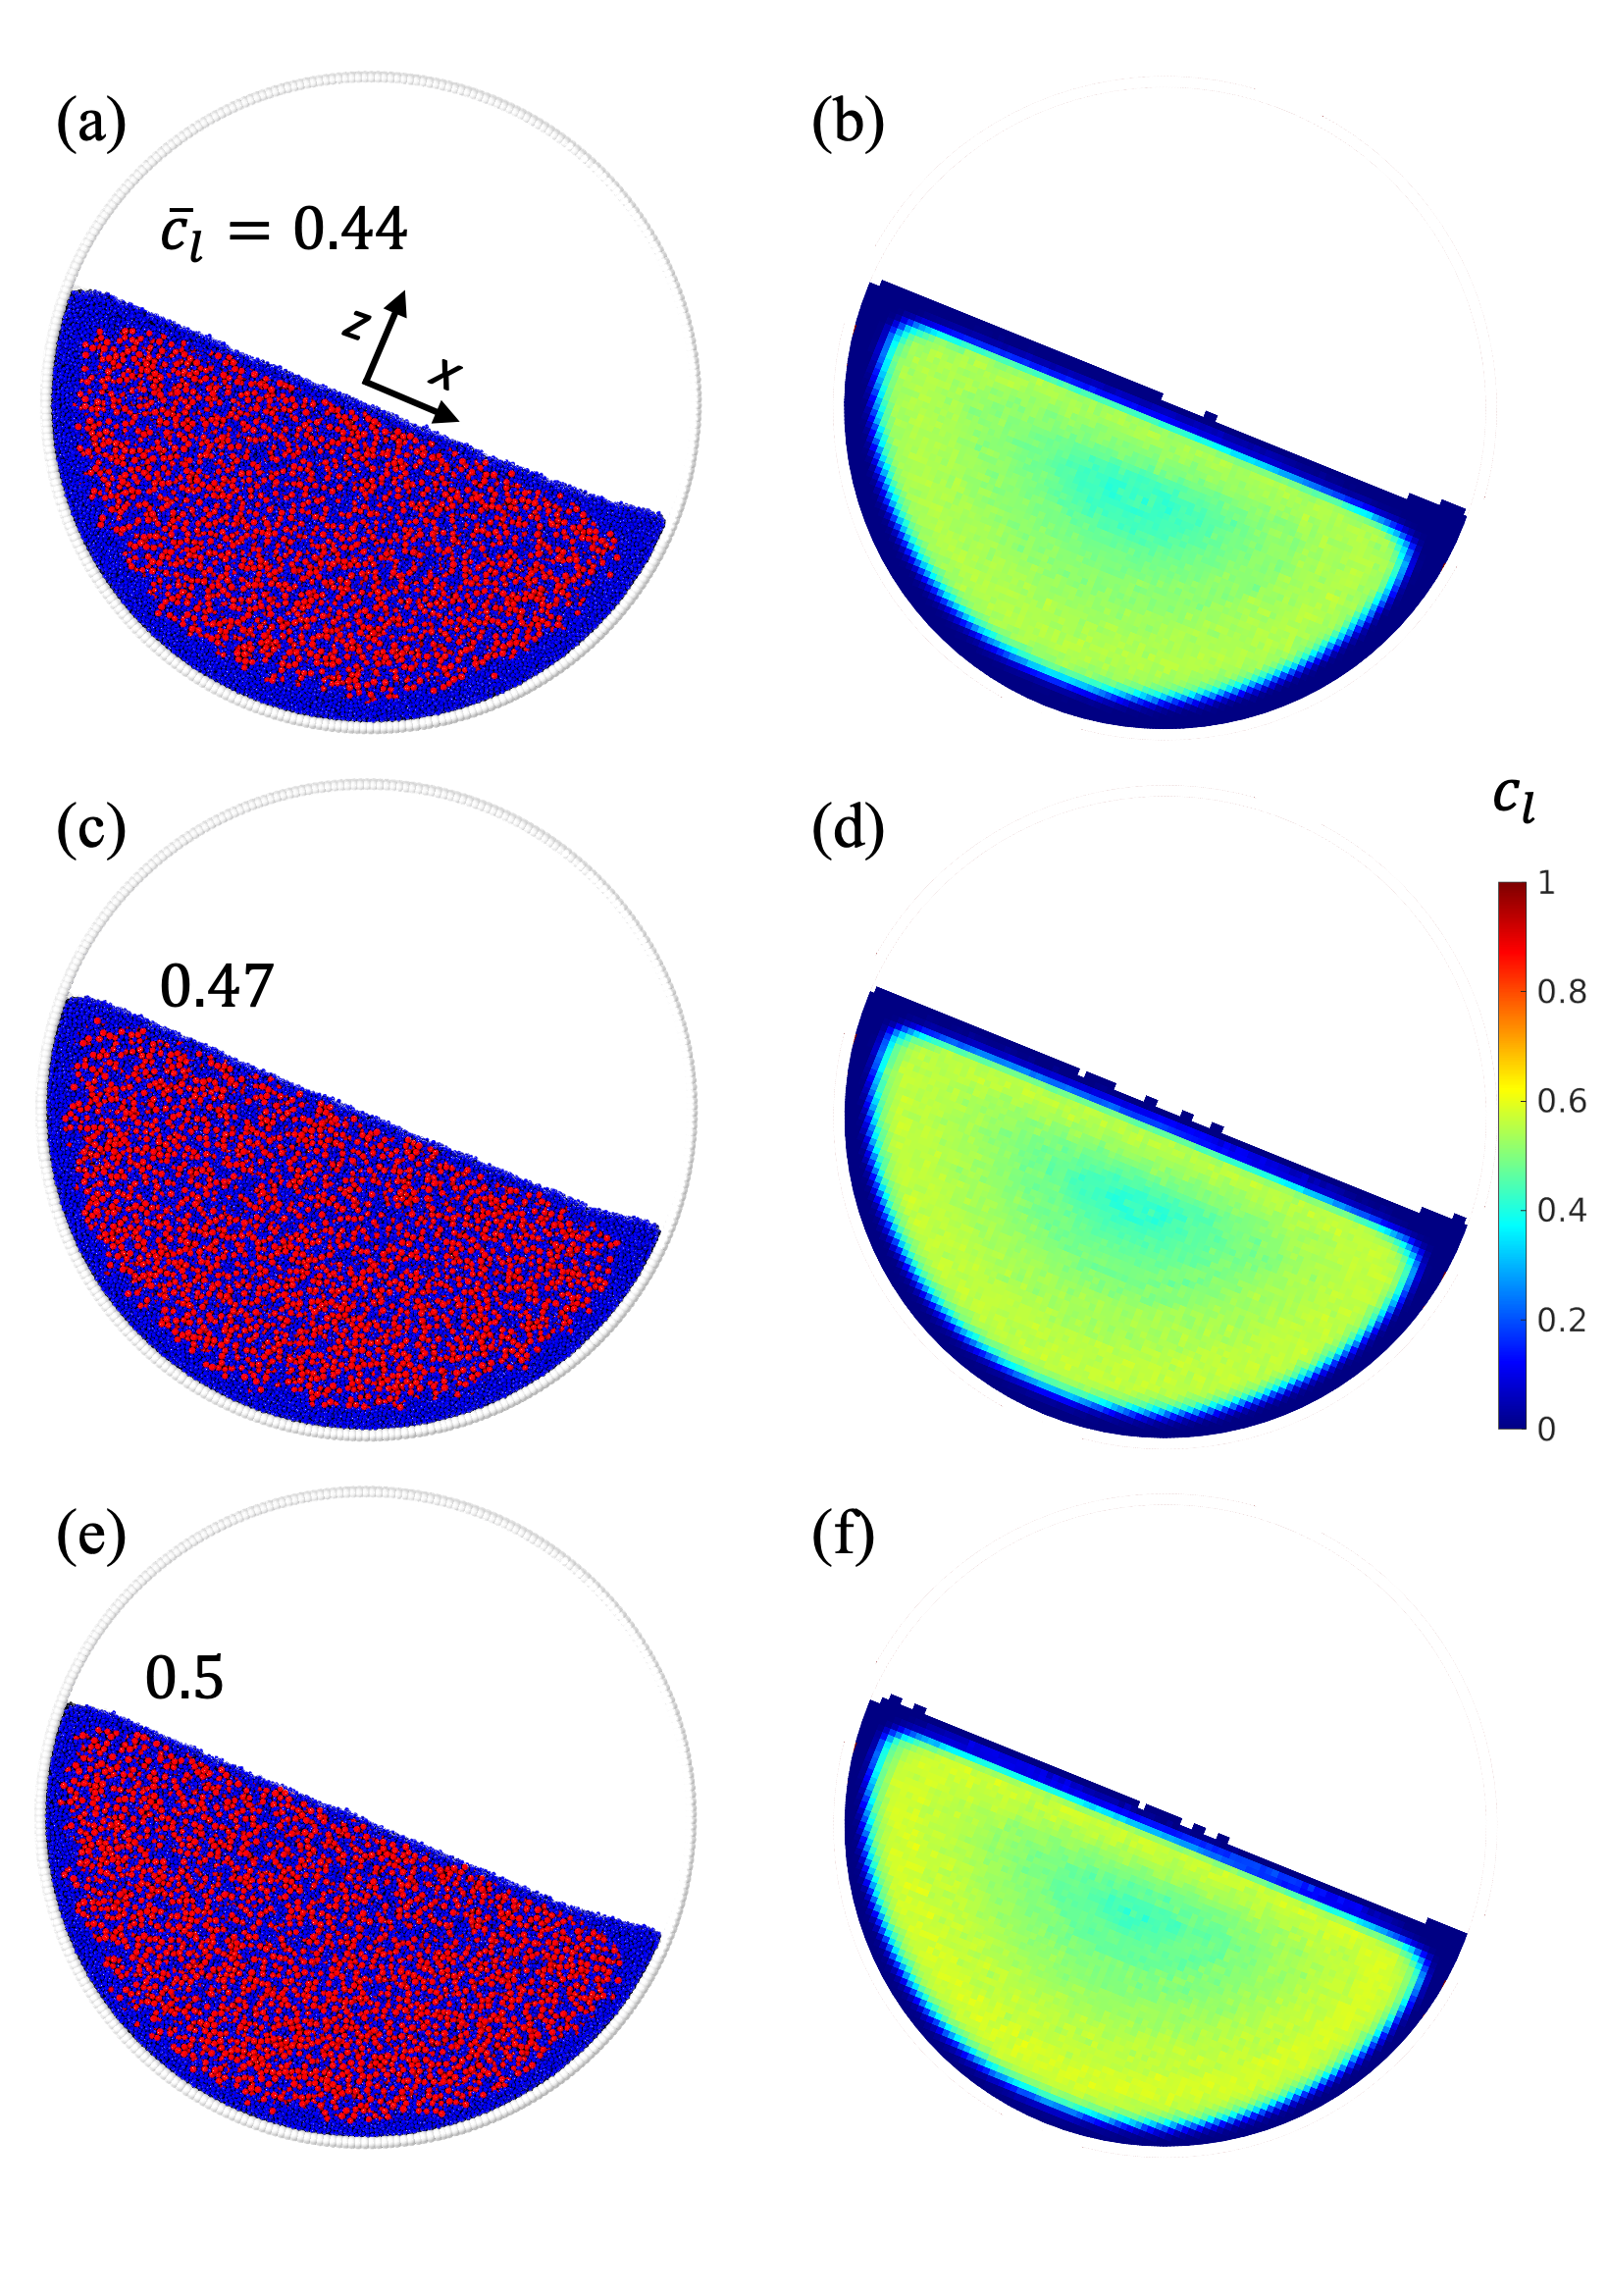
Two significant results are evident in Figures 9-11. First, segregation in a rotating tumbler is significantly reduced for , much like the earlier case of bounded heap flows; second, the particle concentration in the core of the rotating tumbler bed saturates at approximately the equilibrium concentration regardless of . Similar results are also observed for the same size and density ratios (, ) but with smaller absolute particle diameters (i.e., both and are scaled by a factor of two such that ), shown in Figure 12. Particles remain mixed at steady state throughout most of the particle bed, indicating that the relative size of the tumbler compared to the particles is not crucial to the particles remaining mixed at . What is more interesting in this example is that the particles remain reasonably well-mixed not only for in Figure 12c,d, but also for in Figure 12a,b and in Figure 12e,f. Radial concentration profiles for these three cases are shown in Figure 13. The nearly identical concentration profiles indicates that small deviations of from have little influence on the overall mixing of the particles in rotating tumblers. Moreover, the concentration profile for in Figure 11 for is nearly identical to those in Figure 13 for . This is because the particle concentration fields at steady state result from the balance between diffusion flux and segregation flux in the flowing layer. Since both fluxes are proportional to particle diameter,[42] the effects of particle diameter cancel, and the concentration profiles are independent of , resulting in the green curve in Figure 13 matching the green curve in Figure 11 except near the surface and the corresponding region on the tumbler wall. One difference between and is that the layers of nearly pure small particles (small ) at the flowing layer surface and near the tumbler wall are thinner for suggesting that the phenomenon driving this is related to the size of the particles compared to that of the tumbler.
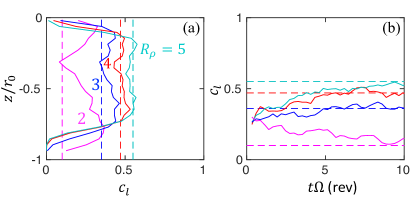
Returning now to the result in Figures 10 and 12 showing that in the core of the tumbler bed regardless of the global concentration of large particles, we consider a different scenario in which the global concentration of large particles is held constant and is varied. Figure 14 compares the radial concentration profiles and time evolution of at the core center with and , for different values of . In steady state is close to (dashed lines) at the core center () for the corresponding (, ) for all four values of , as shown in Figure 14a. This occurs regardless of whether is increasing relative to to reach , as is the case for in Figure 14b, or decreasing from to , as is the case for , 4, 5. However, for cases with further away from as determined by the value of , it takes a longer time to reach equilibrium.
The appearance of the equilibrium concentration in the core independent of appears to be a characteristic of steady-state segregation in tumbler flows. Apparently, as the particle mixture adjusts to its steady-state distribution, the core concentration relaxes to while the “excess” particles (small particles for and large particles for ) are displaced to tumbler periphery where their concentration is enhanced. An explanation is as follows. Starting from a fully mixed condition, during the initial transient upward segregating particles rise in the flowing layer until the concentration in the lower portion of the flowing layer achieves the equilibrium concentration, . Once is established locally at the bottom of the flowing layer, no further segregation occurs in this region. Since this layer with concentration is at the bottom of the flowing layer, it is deposited on the fixed bed at the core, while the particles that have segregated upward in the flowing layer are carried to the periphery of the tumbler to be deposited there. This process is reinforced over several rotations until steady-state is reached, which corresponds to a concentration near in the core. We return to this phenomenon in the next section as a potential method to experimentally determine the equilibrium concentration for arbitrary binary particle mixtures.
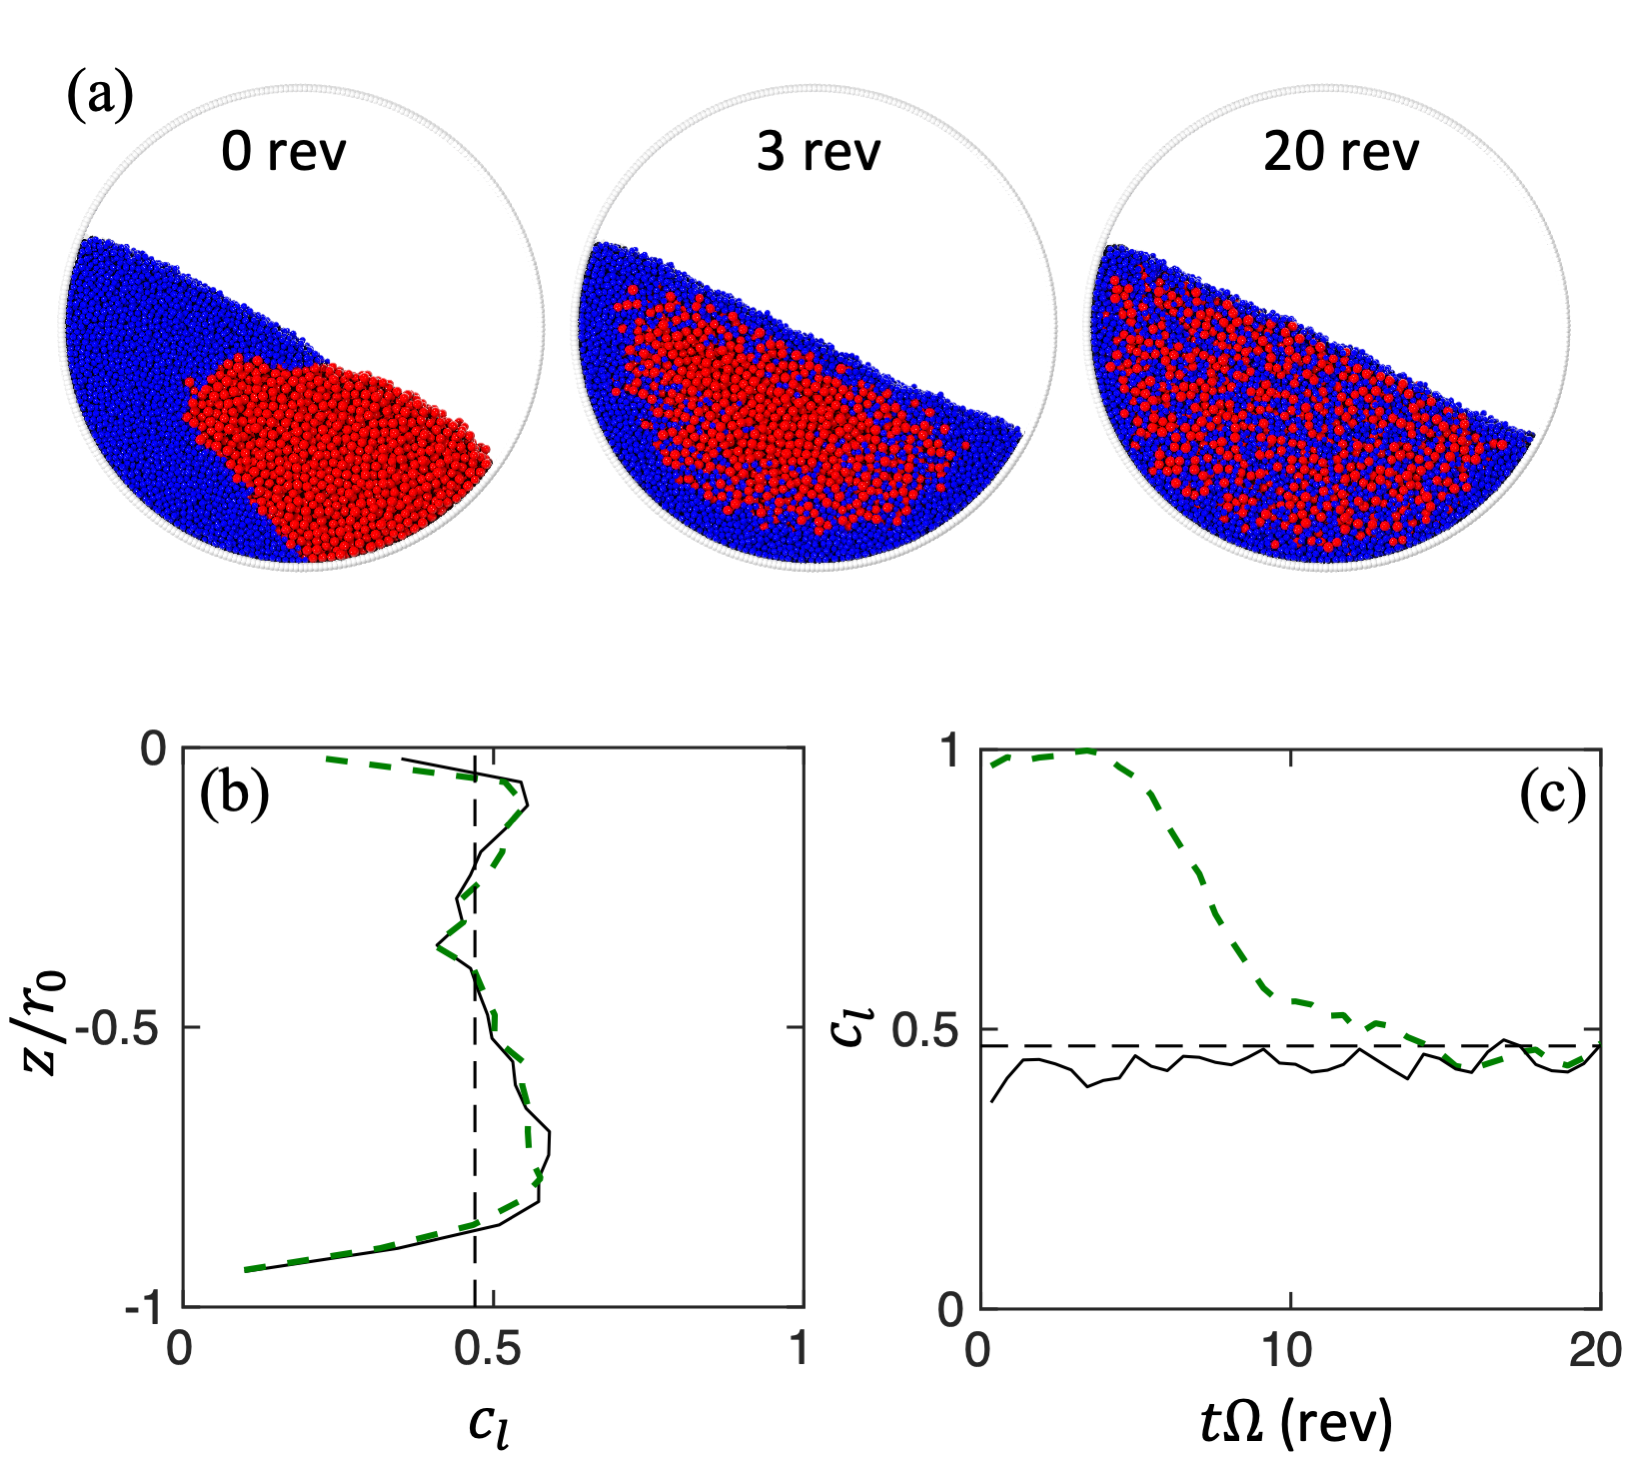
One further consideration is that for the simulations described to this point, particles are initially well-mixed. However, in many practical industrial situations the two particle species are often initially segregated. Figure 15 shows the mixing of the same particle mixture in Figure 9b but starting from an initially fully segregated state shown in Figure 15a at the onset of rotation. After three rotations (18 s) the system forms a core of large particles with small particles at the periphery. After twenty rotations (120 s), despite the initial complete segregation, particles are well mixed at steady state, just as occurs for the initially mixed case. Figure 15b shows that the steady state concentration profiles are identical for the completely segregated and well-mixed initial conditions. However, the initially segregated case takes longer to reach equilibrium (15 rotations, , or 90 s), as shown in Figure 15c. For the well-mixed case with , the mixture almost immediately reaches , although for it takes about 5 rotations (, or 30 s), as shown in Figure 11b. The results in Figure 15 suggest that initial segregation conditions of the mixture or variations in the initial local concentration, with sufficient time, have little influence on the steady state segregation pattern, which always exhibits a concentration in the core that is close to .
4 Method to determine equilibrium concentration
The appearance of in the core of the rotating tumbler bed suggests a simple methodology to experimentally determine for an arbitrary binary particle mixture. The procedure is as follows. Fill a rotating tumbler to half full with an arbitrary concentration binary mixture and tumble until steady state segregation is reached. Remove a sample volume of particles from the core. The measured for the sample should be close to . Then prepare a new mixture at the measured core concentration. It may be necessary to repeat these steps one or two times until no further variation in at the core is observed.
The advantage of this approach is that the sizes and densities of the two particle species need not be known in advance, and, more significantly, no analog to Figure 3 is necessary (which requires many experiments or simulations). This makes the approach applicable for particles that may vary in properties other than just size or density, such as shape. [16] Using this approach, a few simple experiments can determine the equilibrium concentration that minimizes segregation.
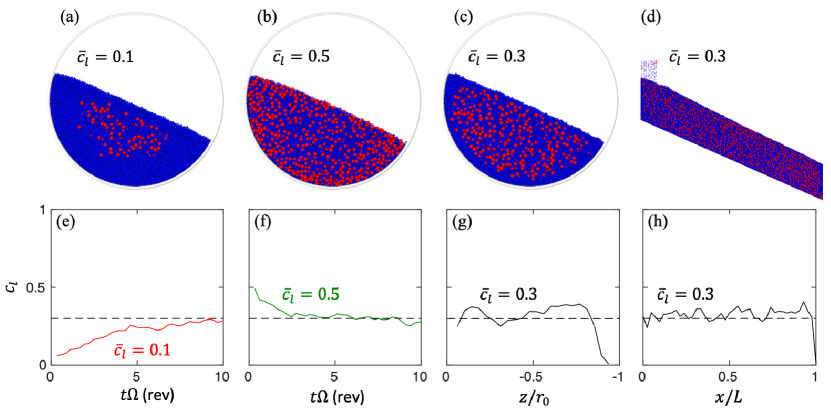
Figure 16 shows DEM simulations demonstrating this approach for determining the equilibrium concentration for example mixtures with and , starting with either of two different initial global concentrations: (Figure 16a) or 0.5 (Figure 16b). Figures 16e,f show that at the core center saturates at about 0.3 (dashed line) for both cases, indicating that , which is close to for and determined from Figure 3. Noting that small deviations in the concentration from the actual value of are inconsequential (see Figure 12), mixtures prepared at the measured are tested in both the rotating tumbler and the bounded heap. Figures 16c,d,g,h show that particles are relatively well-mixed over the two domains. Thus, for these parameters, only one iteration of the rotating tumbler experiment is necessary to narrow in on the approximate value of , whether starting from too low of a concentration (Figures 16a,e) or too high of a concentration (Figures 16b,f). The second iteration, Figures 16c,g confirms the value for . These results indicate that this simple practical approach for finding the equilibrium concentration for arbitrary bidisperse particle mixtures holds substantial promise.
| \headrowmaterial | color | diameter (mm) | density (g/cm3) |
|---|---|---|---|
| steel | dark | 3.14 0.01 | 7.85 0.02 |
| glass | light | 1.54 0.08 | 2.50 0.05 |
5 experiment
Results to this point are based on DEM simulation, which for dense flows is usually quite accurate and relatively insensitive to particle and boundary interaction parameters. To validate the simulations, experiments are performed in a rotating tumbler ( rev/min) with large steel and small clear glass spherical particles. The experimental set-up is similar to that in the simulation in Figure 9, except that the 15 cm diameter tumbler has two flat frictional endwalls made of clear acrylic and separated by 1.2 cm () rather than the periodic endwall condition used in the simulations. One endwall is backlit to aid visualization of the particle distribution through the bulk. With the particle properties given in Table 1, the size ratio of large steel to small glass particles is and the density ratio . The equilibrium concentration according to Figure 3 is .
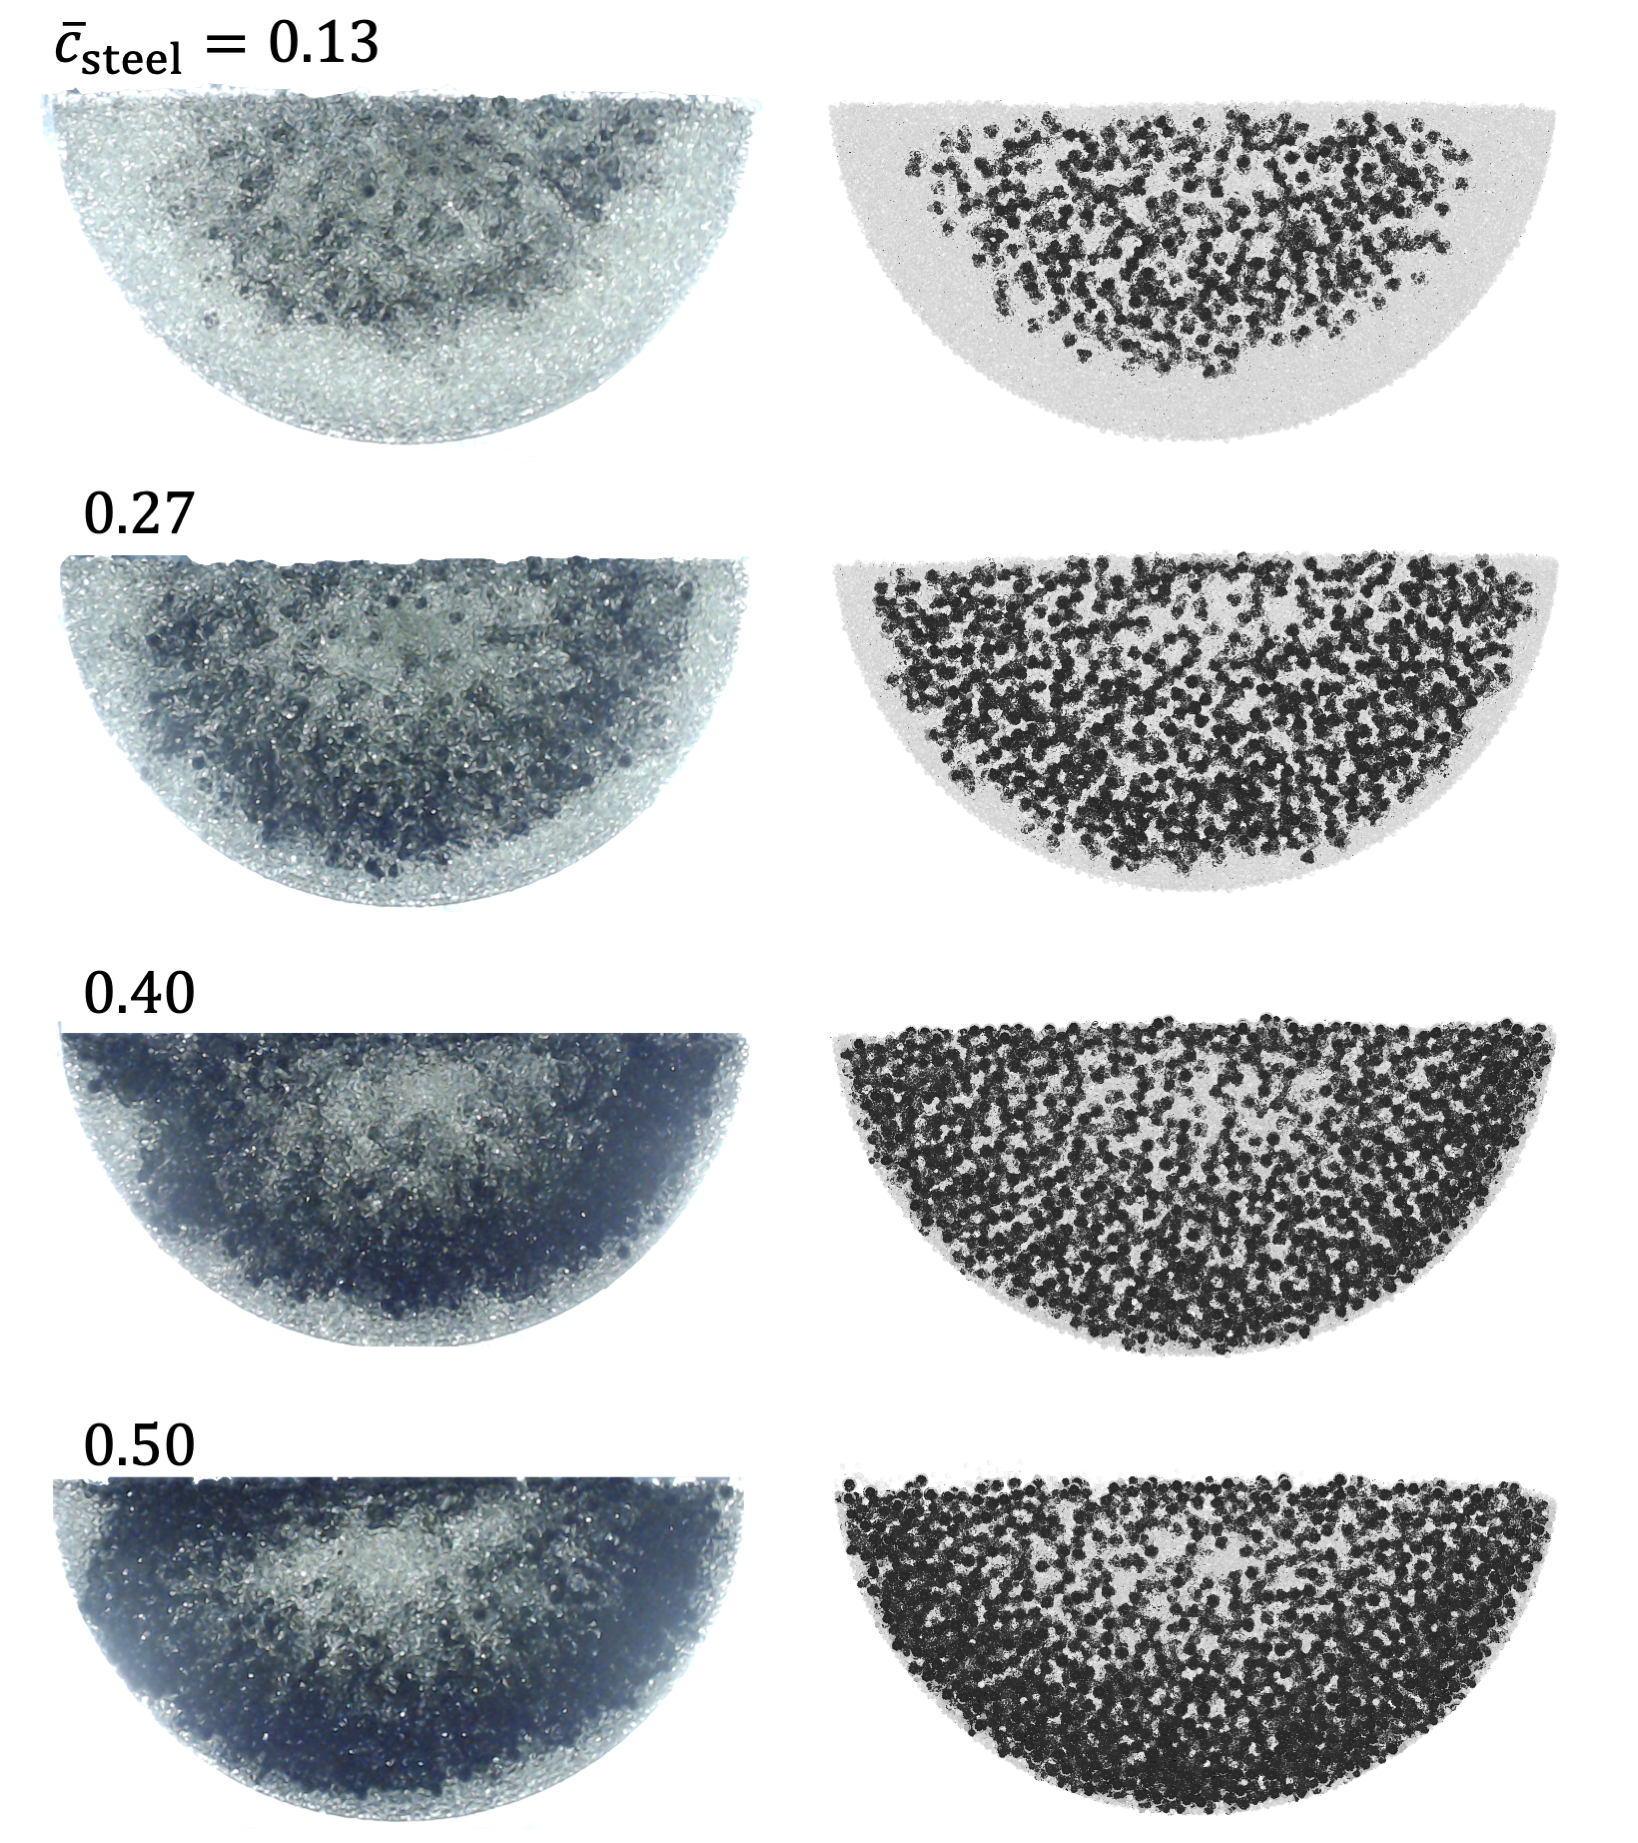
Figure 17 shows images of the segregation pattern from experiment for different global concentrations of large steel particles after 10 minutes of rotation, when the segregation pattern has reached a steady state, as well as DEM results for the same conditions as the experiment. In this case, the DEM simulations include frictional endwalls with separated by 1.2 cm, rather than using a periodic boundary condition as in the other tumbler simulations in this paper.
Although the visualization of the experimental results are less clear than the DEM simulation results, it is evident that the fundamental character of the particle distribution changes from mostly small glass particles surrounding a relatively mixed core at to a generally mixed condition throughout the tumbler at to mostly large steel particles surrounding a somewhat mixed core at and . Focusing first on , which is at the predicted equilibrium concentration from Figure 3, a band of small particles appears at the tumbler periphery for both experiments and simulations, confirming that this phenomenon occurs not only in the simulations but also in the experiments. That said, the degree of mixing is substantially better for than for the lower concentration (), where the band of small particles at the periphery is wide and quite pure, or higher concentrations (, 0.50), where the mixture is dominated by large particles in a wide band near the periphery, although a narrow band of small particles immediately adjacent to the tumbler wall persists in the experiments. Thus, while more work is needed to resolve these discrepancies, the general result of a more mixed state appearing for the equilibrium concentration than other concentrations appears to be the case for these tumbler experiments.
6 discussion
From both the DEM simulation results for rotating tumblers with (Figs. 9-16 and the images from experiment () in Figure 17b, it is evident that the large particle concentration decreases sharply near the tumbler wall such that the overall mixing is imperfect even at the equilibrium concentration (i.e., ). As mentioned earlier, the reduced large particle concentration near the tumbler wall has been noted previously [65, 70] but not explained. A possible explanation is that the equilibrium concentration in Figure 3 derived from depth-averaging heap flow segregation flux data as shown in Figure 2 may not be universal and could additionally vary locally with depth in the flowing layer. Specifically, our recent study on the forces on a single intruder particle in shear flow demonstrates that the equilibrium condition for single intruders depends on the local shear rate gradient and pressure.[64] Given that in free surface flows the streamwise particle velocity exponentially decreases with depth [58] and the local lithostatic pressure linearly increases with depth for a uniform density profile, it is reasonable to infer that the equilibrium concentration associated with non-mixing conditions may vary locally with depth in the flowing layer. As a result, local segregation may occur despite the global concentration satisfying the equilibrium condition. Such local segregation appears to be negligible in heap flows, as the segregation is not fully developed before the particles deposit onto the fixed bed. However, in rotating tumblers, with particles repeatedly segregating in the flowing layer until reaching equilibrium, the variations in the local shear rate gradient and lithostatic pressure through the depth of the flowing layer may have sufficient time to result in greater segregation than in heap flows. This is evident in the concentration profile for in Figure 16g for a rotating tumbler deviating more from than that for a bounded heap flow in Figure 16h.
A second reason for reduced large-particle concentration near the rotating tumbler wall may be the complex flow kinematics at the end of the downstream portion of the flowing layer where particles interact with the cylindrical tumbler wall before entering solid body rotation. The thickness of the small particle band near the tumbler wall decreases somewhat for simulations using smoother tumbler walls, suggesting that particle-wall interactions are important. The effect of the tumbler wall roughness is consistent with previous results indicating how the wall roughness can affect secondary flows in cylindrical tumblers [71] and both secondary flows and segregation in spherical tumblers [72, 73] even far from the tumbler walls.
Despite the visible small particle band at the tumbler wall, evident visually in Figure 9b and in the concentration profile in Figure 11, it is clear that segregation is largely suppressed for in this case. In contrast, for , decreases nearly to zero at the surface of the flowing layer and to zero (pure small particles) in a band at the tumbler periphery. For , increases at the surface of the flowing layer and at the periphery. Thus, despite the deviation of from a uniform value for at the top of the flowing layer and near the cylindrical tumbler wall in this specific case as well as those in (Figs. 12-16), most particles in the tumbler remain relatively well-mixed at the equilibrium concentration, whereas at other concentrations the particles tend to be substantially more segregated.
7 Conclusion
For particle mixtures varying simultaneously in size and density, the two corresponding segregation mechanisms (percolation and buoyancy, respectively) interact with each other resulting in segregation behavior significantly different from size or density segregation alone. In particular, mixtures of large heavy and small light particles can exhibit an equilibrium concentration, , at which the two segregation mechanisms are locally balanced and the net segregation flux is zero. This leads to a methodology in which a particle system can be designed to reduce or even prevent segregation by specifying the optimal combination of particle size ratio , density ratio , and overall mixture concentration .
The near overlap of the equilibrium concentration curves in Figure 7 with the non-segregating region determined from heap flow simulations demonstrates not only the accuracy of the equilibrium conditions predicted in Figure 3 but also the potential for designing minimally-segregating granular mixtures by feeding particles initially mixed at the equilibrium concentration, i.e. . This potential to intentionally design minimally-segregating mixtures also extends to bidisperse particle mixtures in rotating tumblers with global concentration , even when particles are initially segregated. In addition, particles in the tumbler core tend toward the equilibrium concentration even when . This leads to a methodology to experimentally find using a rotating tumbler by measuring the concentration in the core.
Given the similarities in flow kinematics among heap, rotating tumbler, and other geometries where a thin surface layer of particles flows relative to the bulk, we expect that the equilibrium condition in Figure 3 is generally applicable to surface flows in other geometries.[74, 61, 59] However, the equilibrium condition in Figure 3 may not be universal and may change somewhat with flow kinematics, since the solid volume fraction, overburden pressure, shear rate, and shear rate gradient affect particle segregation. For example, the equilibrium condition for equal-volume particle mixtures under vibration is ,[75] which clearly differs from the curve in Figure 3. Likewise, we expect that the equilibrium concentration would be different in wall-driven shear flow between two planes (due to the overburden pressure) [63] or in chute flow where substantial slip can occur at the base of the flow or the velocity exhibits a Bagnold-type profile. Nevertheless, our results demonstrate the potential for specifying particular combinations of particle size ratio, density ratio, and concentration to promote mixing and minimize segregation in granular surface flows. Future studies connecting equilibrium conditions to flow kinematics and achieving a phase diagram analogous to Figure 3 for other flows such as chute flows and boundary-driven (wall or intruder) flows are warranted.
acknowledgements
We gratefully acknowledge helpful discussions with Yi Fan, John Hecht, and Lu Jing. This material is based upon work supported by the National Science Foundation under Grant No. CBET-1929265.
References
- [1] Savage SB, Lun CKK. Particle size segregation in inclined chute flow of dry cohesionless granular solids. J. Fluid Mech. 1988; 189: 311–335.
- [2] Makse HA, Havlin S, King PR, Stanley HE. Spontaneous stratification in granular mixtures. Nature 1997; 386(6623): 379–382.
- [3] May LBH, Golick LA, Phillips KC, Shearer M, Daniels KE. Shear-driven size segregation of granular materials: Modeling and experiment. Phys. Rev. E 2010; 81(5): 051301.
- [4] Golick LA, Daniels KE. Mixing and segregation rates in sheared granular materials. Phys. Rev. E 2009; 80(4): 042301.
- [5] Bhattacharya T, McCarthy JJ. Chute flow as a means of segregation characterization. Powder Technol. 2014; 256: 126–139.
- [6] Khola N, Wassgren C. Correlations for shear-induced percolation segregation in granular shear flows. Powder Technol. 2016; 288: 441–452.
- [7] Fan Y, Jacob KV, Freireich B, Lueptow RM. Segregation of granular materials in bounded heap flow: A review. Powder Technol. 2017; 312: 67–88.
- [8] Khakhar DV, McCarthy JJ, Ottino JM. Radial segregation of granular mixtures in rotating cylinders. Phys. Fluids 1997; 9(12): 3600–3614.
- [9] Tripathi A, Khakhar DV. Density difference-driven segregation in a dense granular flow. J. Fluid Mech. 2013; 717: 643–669.
- [10] Liao CC, Hsiau SS, Nien HC. Density-driven spontaneous streak segregation patterns in a thin rotating drum. Phys. Rev. E 2014; 89(6): 062204.
- [11] Liu S, McCarthy JJ. Transport analogy for segregation and granular rheology. Phys. Rev. E 2017; 96(2): 020901.
- [12] Duan Y, Umbanhowar PB, Ottino JM, Lueptow RM. Segregation models for density-bidisperse granular flows. Phys. Rev. Fluids 2020; 5: 044301.
- [13] Alizadeh M, Hassanpour A, Pasha M, Ghadiri M, Bayly A. The effect of particle shape on predicted segregation in binary powder mixtures. Powder Technol. 2017; 319: 313–322.
- [14] Pereira GG, Cleary PW. Segregation due to particle shape of a granular mixture in a slowly rotating tumbler. Granul. Matter 2017; 19(2): 1–12.
- [15] Lu G, Müller CR. Particle-shape induced radial segregation in rotating cylinders. Granul. Matter 2020; 22(2): 1–14.
- [16] Jones RP, Ottino JM, Umbanhowar PB, Lueptow RM. Predicting segregation of nonspherical particles. Phys. Rev. Fluids 2021; 6(5): 054301.
- [17] Kondic L, Hartley RR, Tennakoon SGK, Painter B, Behringer RP. Segregation by friction. Europhys. Lett. 2003; 61(6): 742.
- [18] Gillemot KA, Somfai E, Börzsönyi T. Shear-driven segregation of dry granular materials with different friction coefficients. Soft Matter 2017; 13(2): 415–420.
- [19] Standish N. Studies of size segregation in filling and emptying a hopper. Powder Technol. 1985; 45(1): 43–56.
- [20] Muzzio FJ, Shinbrot T, Glasser BJ. Powder technology in the pharmaceutical industry: the need to catch up fast. Powder Technol. 2002; 124(1-2): 1–7.
- [21] Ottino JM, Lueptow RM. On mixing and demixing. Science 2008; 319(5865): 912–913.
- [22] Gray JMNT, Kokelaar BP. Large particle segregation, transport and accumulation in granular free-surface flows. J. Fluid Mech. 2010; 652: 105–137.
- [23] Gray JMNT, Ancey C. Multi-component particle-size segregation in shallow granular avalanches. J. Fluid Mech. 2011; 678: 535–588.
- [24] Gray JMNT. Particle segregation in dense granular flows. Annu. Rev. Fluid Mech. 2018; 50: 407–433.
- [25] Umbanhowar PB, Lueptow RM, Ottino JM. Modeling Segregation in Granular Flows. Annu. Rev. Chem. Biomol. Eng. 2019; 10: 129–153.
- [26] Alonso M, Satoh M, Miyanami K. Optimum combination of size ratio, density ratio and concentration to minimize free surface segregation. Powder Technol. 1991; 68(2): 145–152.
- [27] Jain N, Ottino JM, Lueptow RM. Regimes of segregation and mixing in combined size and density granular systems: an experimental study. Granul. Matter 2005; 7(2-3): 69–81.
- [28] Williams JC. The mixing of dry powders. Powder Technol. 1968; 2(1): 13–20.
- [29] Drahun JA, Bridgwater J. The mechanisms of free surface segregation. Powder Technol. 1983; 36(1): 39–53.
- [30] Ottino JM, Khakhar DV. Mixing and segregation of granular materials. Annu. Rev. Fluid Mech. 2000; 32(1): 55–91.
- [31] Ristow GH. Particle mass segregation in a two-dimensional rotating drum. Europhys. Lett. 1994; 28(2): 97.
- [32] Khakhar DV, McCarthy JJ, Ottino JM. Mixing and segregation of granular materials in chute flows. Chaos 1999; 9(3): 594–610.
- [33] Pereira GG, Sinnott MD, Cleary PW, Liffman K, Metcalfe G, Šutalo ID. Insights from simulations into mechanisms for density segregation of granular mixtures in rotating cylinders. Granul. Matter 2011; 13(1): 53–74.
- [34] Metcalfe G, Shattuck M. Pattern formation during mixing and segregation of flowing granular materials. Phys. A: Stat. Mech. Appl. 1996; 233(3-4): 709–717.
- [35] Jenkins JT, Yoon DK. Segregation in binary mixtures under gravity. Phys. Rev. Lett. 2002; 88(19): 194301.
- [36] Félix G, Thomas N. Evidence of two effects in the size segregation process in dry granular media. Phys. Rev. E 2004; 70(5): 051307.
- [37] Tunuguntla DR, Bokhove O, Thornton AR. A mixture theory for size and density segregation in shallow granular free-surface flows. J. Fluid Mech. 2014; 749: 99–112.
- [38] Larcher M, Jenkins JT. The evolution of segregation in dense inclined flows of binary mixtures of spheres. J. Fluid Mech. 2015; 782: 405–429.
- [39] Jing L, Ottino JM, Lueptow RM, Umbanhowar PB. Rising and sinking intruders in dense granular flows. Phys. Rev. Res. 2020; 2(2): 022069.
- [40] Gray JMNT, Thornton AR. A theory for particle size segregation in shallow granular free-surface flows. Proc. R. Soc. A 2005; 461(2057): 1447–1473.
- [41] Tunuguntla DR, Weinhart T, Thornton AR. Comparing and contrasting size-based particle segregation models. Comput. Part. Mech. 2017; 4(4): 387–405.
- [42] Fan Y, Schlick CP, Umbanhowar PB, Ottino JM, Lueptow RM. Modelling size segregation of granular materials: the roles of segregation, advection and diffusion. J. Fluid Mech. 2014; 741: 252–279.
- [43] Schlick CP, Fan Y, Umbanhowar PB, Ottino JM, Lueptow RM. Granular segregation in circular tumblers: theoretical model and scaling laws. J. Fluid Mech. 2015; 765: 632–652.
- [44] Jones RP, Isner AB, Xiao H, Ottino JM, Umbanhowar PB, Lueptow RM. Asymmetric concentration dependence of segregation fluxes in granular flows. Phys. Rev. Fluids 2018; 3(9): 094304.
- [45] Gray JMNT, Ancey C. Particle-size and-density segregation in granular free-surface flows. J. Fluid Mech. 2015; 779: 622–668.
- [46] Jenkins JT, Savage SB. A theory for the rapid flow of identical, smooth, nearly elastic, spherical particles. J. Fluid Mech. 1983; 130: 187–202.
- [47] GDR-MiDi . On dense granular flows. Eur. Phys. J. E 2004; 14: 341–365.
- [48] Pouliquen O, Cassar C, Jop P, Forterre Y, Nicolas M. Flow of dense granular material: towards simple constitutive laws. J. Stat. Mech. Theory Exp. 2006; 2006(07): P07020.
- [49] Jop P, Forterre Y, Pouliquen O. A constitutive law for dense granular flows. Nature 2006; 441(7094): 727–730.
- [50] Kamrin K, Koval G. Nonlocal constitutive relation for steady granular flow. Phys. Rev. Lett. 2012; 108(17): 178301.
- [51] Henann DL, Kamrin K. A predictive, size-dependent continuum model for dense granular flows. Proc. Natl. Acad. Sci. 2013; 110(17): 6730–6735.
- [52] Meier SW, Lueptow RM, Ottino JM. A dynamical systems approach to mixing and segregation of granular materials in tumblers. Adv. Phys. 2007; 56(5): 757–827.
- [53] Ottino JM, Khakhar DV. Scaling of granular flow processes: from surface flows to design rules. AIChE J. 2002; 48(10): 2157–2166.
- [54] Dolgunin VN, Ukolov AA. Segregation modeling of particle rapid gravity flow. Powder Technol. 1995; 83(2): 95–103.
- [55] Dolgunin VN, Kudy AN, Ukolov AA. Development of the model of segregation of particles undergoing granular flow down an inclined chute. Powder Technol. 1998; 96(3): 211–218.
- [56] Duan Y, Umbanhowar PB, Ottino JM, Lueptow RM. Modelling segregation of bidisperse granular mixtures varying simultaneously in size and density for free surface flows. J. Fluid Mech. 2021; 918.
- [57] Duan, Yifei , Umbanhowar, Paul B. , Lueptow, Richard M. . Designing non-segregating granular mixtures. EPJ Web Conf. 2021; 249: 03011.
- [58] Fan Y, Schlick CP, Umbanhowar PB, Ottino JM, Lueptow RM. Kinematics of monodisperse and bidisperse granular flows in quasi-two-dimensional bounded heaps. Proc. R. Soc. A 2013; 469(2157): 20130235.
- [59] Isner AB, Umbanhowar PB, Ottino JM, Lueptow RM. Axisymmetric granular flow on a bounded conical heap: Kinematics and size segregation. Chem. Eng. Sci. 2020; 217: 115505.
- [60] Xiao H, Umbanhowar PB, Ottino JM, Lueptow RM. Modelling density segregation in flowing bidisperse granular materials. Proc. R. Soc. A 2016; 472(2191): 20150856.
- [61] Isner AB, Umbanhowar PB, Ottino JM, Lueptow RM. Granular flow in a wedge-shaped heap: Velocity field, kinematic scalings, and segregation. AIChE J. 2020; 66(5): e16912.
- [62] Prasad I, Santangelo C, Grason G. Subjamming transition in binary sphere mixtures. Phys. Rev. E 2017; 96(5): 052905.
- [63] Fry AM, Umbanhowar PB, Ottino JM, Lueptow RM. Effect of pressure on segregation in granular shear flows. Phys. Rev. E 2018; 97: 062906.
- [64] Jing L, Ottino JM, Lueptow RM, Umbanhowar PB. A unified description of gravity-and kinematics-induced segregation forces in dense granular flows. J. Fluid Mech. 2021; 925.
- [65] Pereira GG, Tran N, Cleary PW. Segregation of combined size and density varying binary granular mixtures in a slowly rotating tumbler. Granul. Matter 2014; 16(5): 711–732.
- [66] Nityanand N, Manley B, Henein H. An analysis of radial segregation for different sized spherical solids in rotary cylinders. Metall. Mater. Trans. B 1986; 17(2): 247–257.
- [67] Cantelaube F, Bideau D. Radial segregation in a 2d drum: an experimental analysis. Europhys. Lett. 1995; 30(3): 133.
- [68] Mellmann J. The transverse motion of solids in rotating cylinders—forms of motion and transition behavior. Powder Technol. 2001; 118(3): 251–270.
- [69] Zaman Z, d’Ortona U, Umbanhowar PB, Ottino JM, Lueptow RM. Slow axial drift in three-dimensional granular tumbler flow. Phys. Rev. E 2013; 88(1): 012208.
- [70] Thomas N, D’ortona U. Evidence of reverse and intermediate size segregation in dry granular flows down a rough incline. Phys. Rev. E 2018; 97(2): 022903.
- [71] d’Ortona U, Thomas N, Lueptow RM. Mechanisms for recirculation cells in granular flows in rotating cylindrical rough tumblers. Phys. Rev. E 2022; 105(1): 014901.
- [72] d’Ortona U, Thomas N, Zaman Z, Lueptow RM. Influence of rough and smooth walls on macroscale flows in tumblers. Physical Review E 2015; 92(6): 062202.
- [73] d’Ortona U, Thomas N, Lueptow RM. Influence of rough and smooth walls on macroscale granular segregation patterns. Physical Review E 2016; 93(2): 022906.
- [74] Deng Z, Fan Y, Theuerkauf J, Jacob KV, Umbanhowar PB, Lueptow RM. Modeling segregation of polydisperse granular materials in hopper discharge. Powder Technol. 2020; 374: 389-398.
- [75] Hong DC, Quinn PV, Luding S. Reverse Brazil nut problem: competition between percolation and condensation. Phys. Rev. Lett. 2001; 86(15): 3423.