figurec
Modelling the Recommender Alignment Problem
Abstract
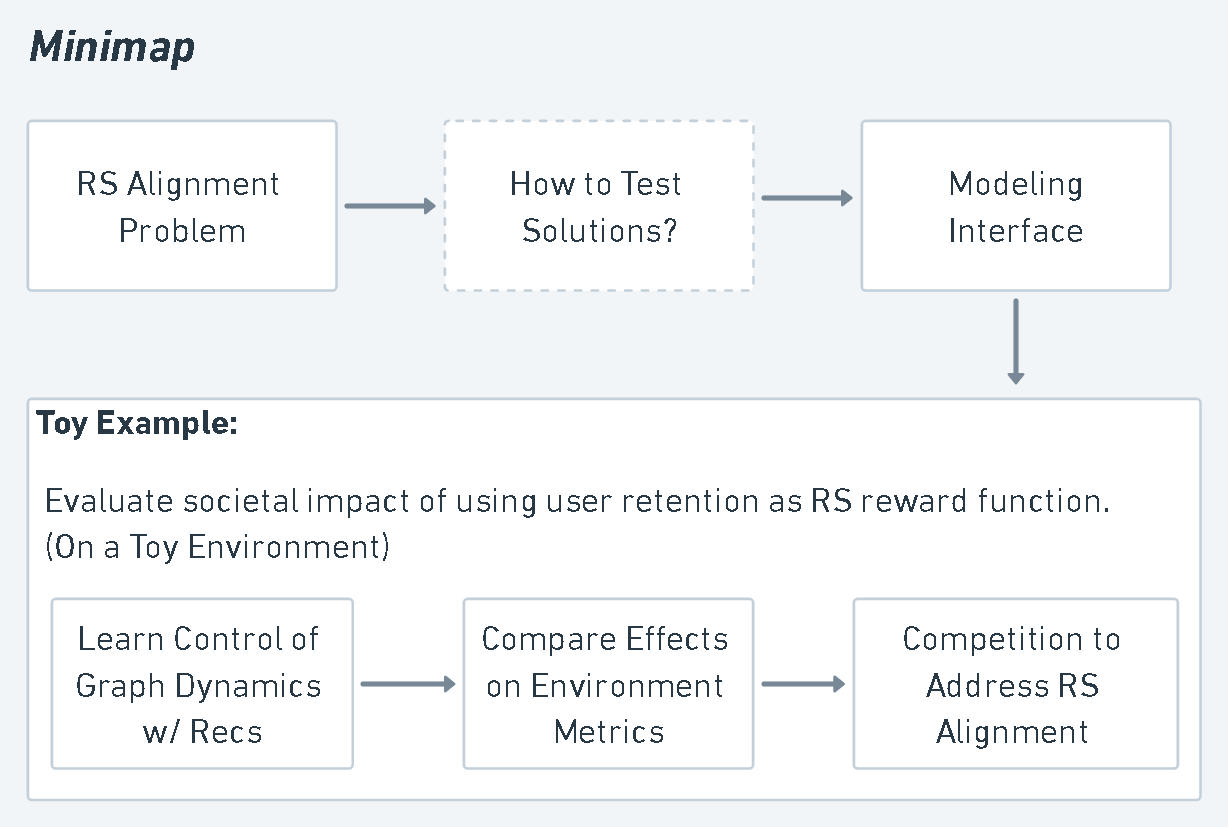
Recommender systems (RS) mediate human experience online. Most RS act to optimize metrics that are imperfectly aligned with the best-interest of users but are easy to measure, like ad-clicks and user engagement. This has resulted in a host of hard-to-measure side-effects: political polarisation [1], addiction [2] [3], fake news [4]. RS design faces a recommender alignment problem: that of aligning recommendations with the goals of users, system designers, and society as a whole. But how do we test and compare potential solutions to align RS? Their massive scale makes them costly and risky to test in deployment. We synthesized a simple abstract modelling framework to guide future work.
To illustrate it, we construct a toy experiment where we ask: "How can we evaluate the consequences of using user retention as a reward function?" To answer the question, we learn recommender policies that optimize reward functions by controlling graph dynamics on a toy environment. Based on the effects that trained recommenders have on their environment, we conclude that engagement maximizers generally lead to worse outcomes than aligned recommenders but not always. After learning, we examine competition between RS as a potential solution to RS alignment. We find that it generally makes our toy-society better-off than it would be under the absence of recommendation or engagement maximizers.
In this work, we aimed for a broad scope, touching superficially on many different points to shed light on how an end-to-end study of reward functions for recommender systems might be done. Recommender alignment is a pressing and important problem. Attempted solutions are sure to have far-reaching impacts. Here, we take a first step in developing methods to evaluating and comparing solutions with respect to their impacts on society.
1 Introduction
Recommender systems (RS) are software systems that assist users in interacting with large spaces of items, usually by presenting them with smaller personalized sets based on information such as past user behavior, user attributes, and features of the underlying items. User experience on social media, content platforms, and online stores is largely determined by RS.
Most recommender systems optimize metrics that are easy to measure and improve, like number of clicks, time spent, or number of daily active users. They are selected to do this by powerful optimization processes involving thousands of engineers and a significant fraction of global computing power. Goodhart’s law [5] states that "when a metric becomes a goal, it ceases to be a good metric". In fact, choosing metrics that are imperfectly aligned with the best-interest of users has resulted in a host of hard-to-measure side-effects like political polarisation [1], addiction [2] [3], fake news [4], fairness [6] and diversity[7] concerns.
Recommender system design faces a recommender alignment problem: that of aligning recommendations with the goals of users, system designers, and society as a whole. We conceive it in analogy to the value alignment problem [8]: that of ensuring that an AI system’s behavior aligns with the values of its principal.
A single reward function that would work for everyone forever is unlikely to exist. Thus a reward function for RS should be adaptive and error-correcting, drawing adjustments in a bottom-up fashion subject to users themselves. For example: recommender systems are currently unopposed in their respective networks. Would enabling competition between RS result in a sufficiently adaptive system?
But how do we test and compare potential solutions to align RS? How can we learn about their impacts on society and emergent effects? The massive scale of these systems makes them costly (due to the amount of resources involved), risky (due to the number of users they impact) and arguably unethical to test in deployment. Modelling and simulation approaches are used under similar constraints to study social dynamics so we consider them suitable for our case as well.
We present a modelling interface: a minimal set of requirements for models, derived from the literature around the societal effects of RS. The interaction between RS and society is a complex, multifaceted topic. What common properties of recommender systems are essential to study alignment, and which ones are domain-specific factors that should be left for implementation? We could find no prior efforts to base ourselves on, so we hope our interface can be relied on for future attempts to evaluate alignment techniques.
Our contributions lie in addressing the following questions. Our modeling interface is concerned with 1, while 2, 3, and 4 concern our toy-experiment.
-
1.
Modeling Interface: How can models focus on dynamics relevant to RS alignment while abstracting over domain-specific factors?
-
2.
Toy environment: How can we evaluate the societal implications of having user retention as the reward function for a recommender?
-
3.
Learning: Can we learn policies that control graph dynamics to optimize arbitrary rewards?
-
4.
Competition: Will competition between RS lead to better outcomes for society than recommender monopolies?
2 Modelling Interface
How can models focus on dynamics relevant to RS alignment, while abstracting over domain-specific factors? Finding no prior efforts to base ourselves on, we present a novel modeling interface intended to inform future modeling work on recommender alignment techniques.
This minimal set of requirements was derived from the literature around the societal effects of RS. We established a minimal set of relevant entities from prior views on RS as multi-stakeholder environments. [9] To abstract interactions between entities, we relied on an existing taxonomy of human interactions with Intelligent Software Agents (ISA). [10]
| Components |
| 1a) | Environment |
| 1b) | Users |
| 1c) | Recommender |
| Interaction |
| 2a) | User-RS interaction |
| 2b) | User-Environment interaction |
| Utility functions |
| 3a) | RS utility |
| 3b) | User utility |
| 3c) | Social utility |
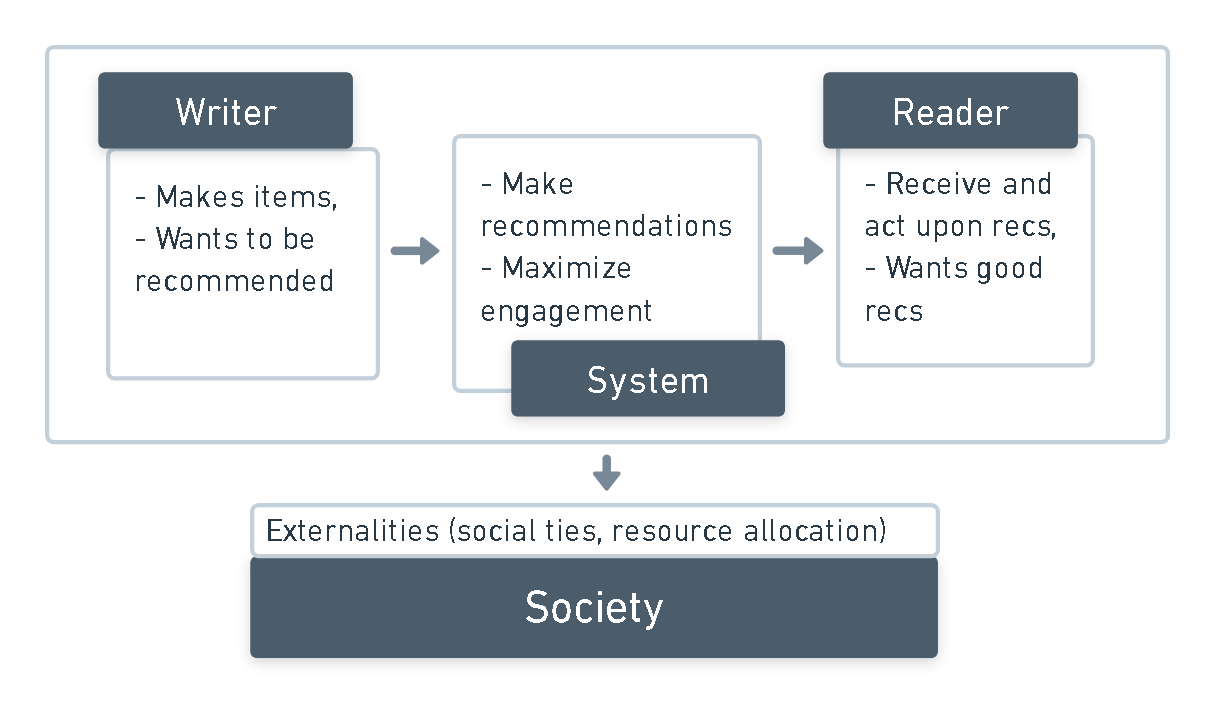
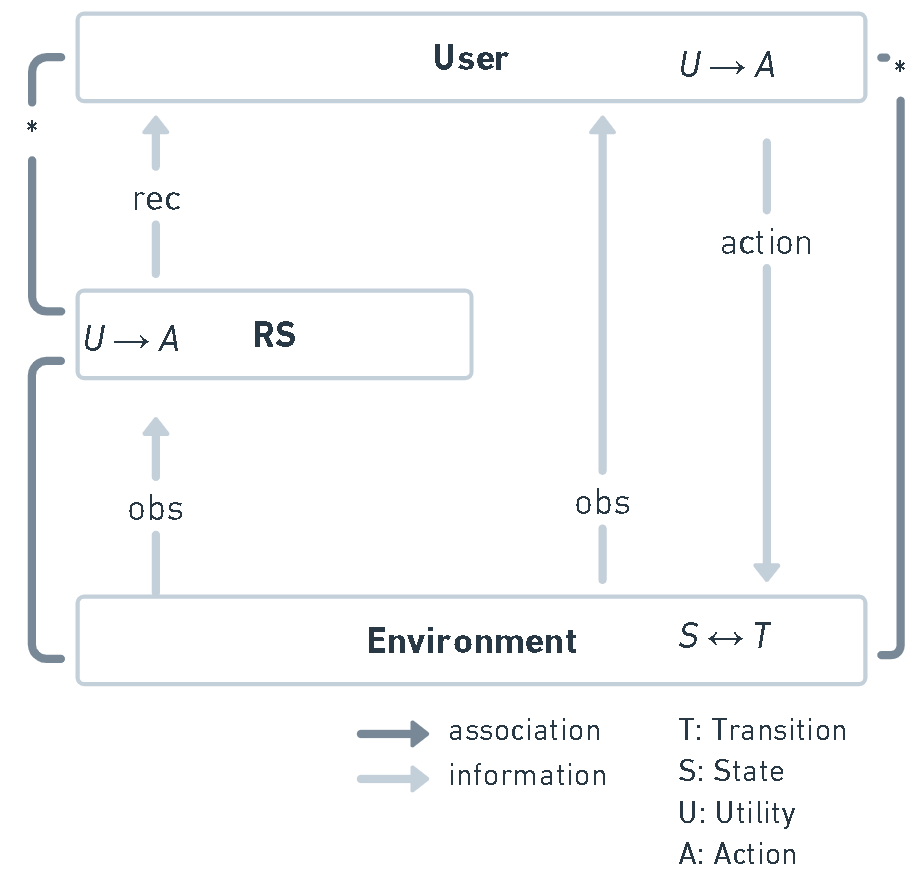
Entities: an Environment, Users with local information and Recommenders with system-level information. An environment should contain the users which act in it and provide observations for users and recommenders. The task of RS is to parse large spaces of items and present personalized subsets to users, who are unable to observe the whole space. It is sensible then to model users with local information and RS with access to more information, or even global information.
User-RS interaction: recommendations. RS mediate the relationship between users and their wider environment. They do this by providing information about it in the form of recommendations. Recommendations can be items of content or other users to interact with (as it happens with friend suggestions in social networks).
User-Environment interaction. The dynamical system of society. People exist and pursue their goals in the world. On social media platforms, experience consists of interacting with other users either directly or by consuming and producing content. The RS largely mediates this experience. Although an increasing part of people’s lives and the economy is conducted online under mediation, the offline world represents a source and sink of externalities away from the reach of RS. As users interact with RS, they change the way they act in the world, and the environment is changed in turn. It’s by measuring this change that we can evaluate the impacts of RS.
Utility functions for recommenders, users, and society. RS are selected by their operators to improve some metric, either by human selection or by reinforcement learning algorithms. In the case of many social media platforms this metric is a proxy that benefits whoever is in charge of the RS - usually related to click-through rate on advertisements or time spent by users on the platform. Defining utility for even a single individual is challenging under the full complexity of the real world. There has been work on optimizing for self-actualization or self-reported well-being, but ultimately, realistic notions of individual utility must include regular feedback and redefinition. A notion of utility for society is even more challenging to achieve. People often have incompatible goals and values that must be traded-off even when making decisions with complete information. Nonetheless, we must assume these can be approximated and represented in models.
3 Experiment: Environment
In this section, we define a concrete model that implements the interface laid out in Section 2. To do this, we extend an existing framework of networked evolutionary game theory [11] where agents play dilemmas of cooperation, periodically rewiring social ties. Our main extension to the original model is allowing arbitrary rewiring policies to be used instead of the original default policy, thus allowing us to delegate the choice of new neighbors to a recommender system. Finally, we obtain baselines for the behavior of the system. To get a comprehensive picture, we simulate the environment as mediated by different fixed rewiring heuristics using the information in strategies and node degrees.
3.1 Definition

There are two types of individuals: cooperators and defectors, we call their strategies and respectively. They engage in social dilemmas of cooperation - specifically 2-player symmetric games - where players can either cooperate or defect when interacting. (see Figure 4) Individuals only interact with their neighbors on the network. Game strategies evolve in the population as users compare fitness and copy their neighbors’ strategies. Individuals can also rewire their social ties if unsatisfied with their neighbors.
Network
Users are connected to one another according to the edges of a network graph where is the set of nodes and is the set of edges. is always initialized as a uniform random graph with average node degree and its topology is allowed to evolve.
Games
Agents interact by playing social dilemmas: symmetric, 2-player, 2x2 matrix games. (as seen in Figure 4) We normalize the difference between mutual cooperation () and mutual defection () to 1, making and , respectively. As a consequence, games can be parameterized by two scalars: payoff (temptation to cheat), which satisfies and payoff (disadvantage of being cheated) satisfies . In this paper, we will focus on the Prisoner’s Dilemma : , as it is the hardest game to solve. We have however, explored the full space of parameters for some experiments.
Evolution
The strategy of a node x evolves through imitation of a neighbor y. A node updates its strategy according to a Fermi update probability (Eq. 1) based on the difference between the fitness of each player ( and ). [12] Fitness corresponds to the cumulative payoffs of a node, resulting from the sum of payoffs from playing each of one’s neighbors.
| (1) |
Rewiring
Given an edge between A and B, we say A is satisfied with the link if B is a cooperator, being dissatisfied otherwise. If A is satisfied, they will keep the link. If dissatisfied, A will compete with B to rewire the link. (Figure 4) The action taken is contingent on the fitness and of A and B respectively. A redirects the link to a new neighbor given by its rewiring strategy with probability p given by Eq. 1. With probability , A either stays linked to B - if A is a cooperator - or B rewires its link with A to one of A’s neighbors. We call this rewiring a structural update.
Time-scale
Strategy evolution and structural evolution can occur at different time-scales, and respectively (if , strategy updates occur twice as often as structural ones). The ratio , leads to different outcomes for cooperation. In realistic situations, the two time-scales should be of comparable magnitude. serves as a measure of agents’ inertia to react to their conditions: large values of reflect populations where individuals - on average - react promptly to adverse ties, whereas smaller values reflect some inertia for rewiring social ties.
| Problem space | Model space |
|---|---|
| Recommenders | Rewiring policies |
| Users | Nodes |
| Environment | Nodes in Network |
| User-environment interaction | 2x2 game with neighbor |
| Item recommendation | Neighbor recommendation |
| User utility | Game payoff |
| Societal utility | Cooperator ratio |
| User engagement with RS | Number of rewires |
3.2 Simulation algorithm
The pseudo code for the update process in our simulations is described in Algorithm 1. is the function that calculates Eq. 1 given A, B, and temperature term . returns the sum of payoffs a node gets after playing a game with each of its neighbors. is the ratio between the timescales of structural evolution and strategy evolution: . is a vector of strategies (taking values in ) and is a vector of rewiring strategies, each of these has a length . A rewiring strategy is a function that provides a recommended node given a focused node and the neighbor being rewired . deletes the edge from G and adds edge .
3.3 Heuristics and Baselines
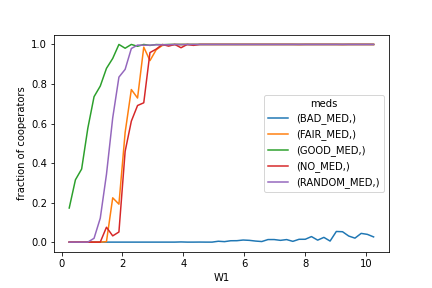
We focus the rest of our simulations on the Prisoner’s Dilemma. We evaluate a small set of recommender heuristics: BAD (always recommends random defectors), RANDOM (always recommends random nodes), GOOD (always recommends random cooperators), NO_MED (local heuristic), and FAIR (recommend random cooperators to cooperators and defectors to defectors). We observe an ordering by speed of convergence towards cooperation.
Local heuristic
The local heuristic corresponds to the default rewiring policy defined in [11]. Given an edge , node rewires to a random neighbor of node . The intuition behind this reasoning is that simple agents, being rational individuals with partial information, are more likely to interact with nearby agents[14]. Moreover, selecting a neighbour of an inconvenient partner is also a good choice, since this partner also tries to establish links with cooperators, making it more likely that the rewiring results in a tie to a cooperator.

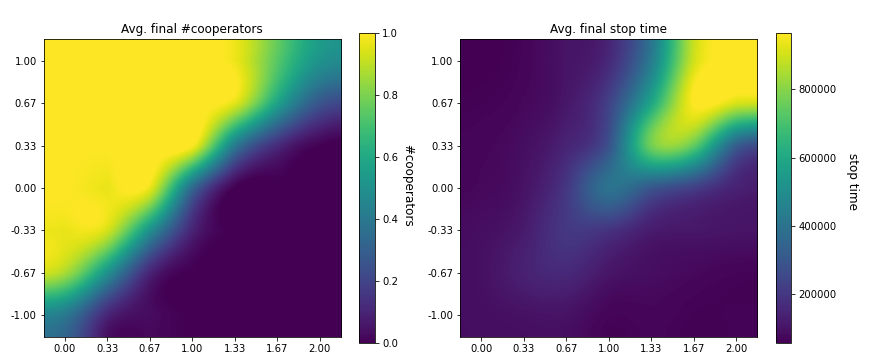
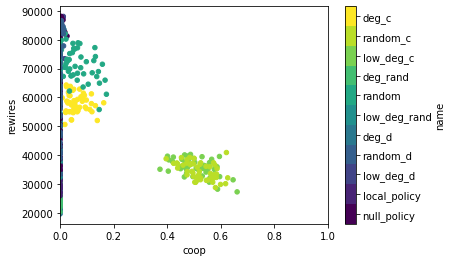
In terms of rewiring, BAD leads to the highest rate, while GOOD produces the lowest, with the remaining mediators being comparable (Fig. 6). One of the reasons is that agents will only want recommendations if the neighbor they’re rewiring is a Defector, so a population with more Defectors will want more rewires, while a population that converges to full Cooperators will cease to want new neighbors.
This means we can expect that recommending Cooperators will drive convergence to cooperation, and that recommending defectors will drive high rewiring numbers until convergence to full defection. From our experiments in the full space of game parameters (not pictured), we observe the Prisoner’s Dilemma is the hardest setting for each of our heuristics and that there is no overwhelming convergence to cooperation in any of them when .
Unexpectedly, we observed FAIR does worse than RANDOM with respect to convergence towards cooperation. We believe this is because defectors and cooperators become segregated making it more difficult for defectors to convert. This hasn’t been tested but we would start by computing modularity-based community finding and measuring the average strategies in each community.
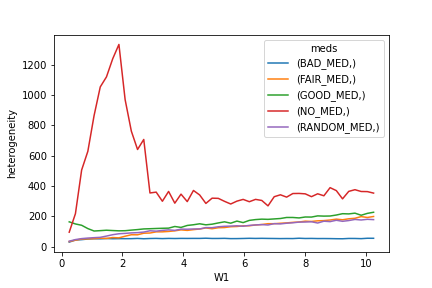
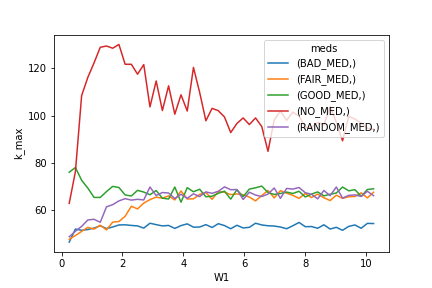
All the heuristics we used were global in scope, having a homogenizing effect, thus NO_MED generally led to higher heterogeneity than any of them.
These initial baselines were obtained from a set of 5 heuristics. The following chapters include a larger set of heuristics based on their strategies and degree information.
For the rest of the experiment, we’ll consider a 3-by-3 space of heuristics plus the null policy (no rewiring) and the local heuristic defined in Section 3.3.
| strat x degree | Low | Random | High |
|---|---|---|---|
| Defectors only | X | X | X |
| Random | X | X | X |
| Cooperators only | X | X | X |
4 Experiment: Learning to Control Graph Dynamics with Recommendations
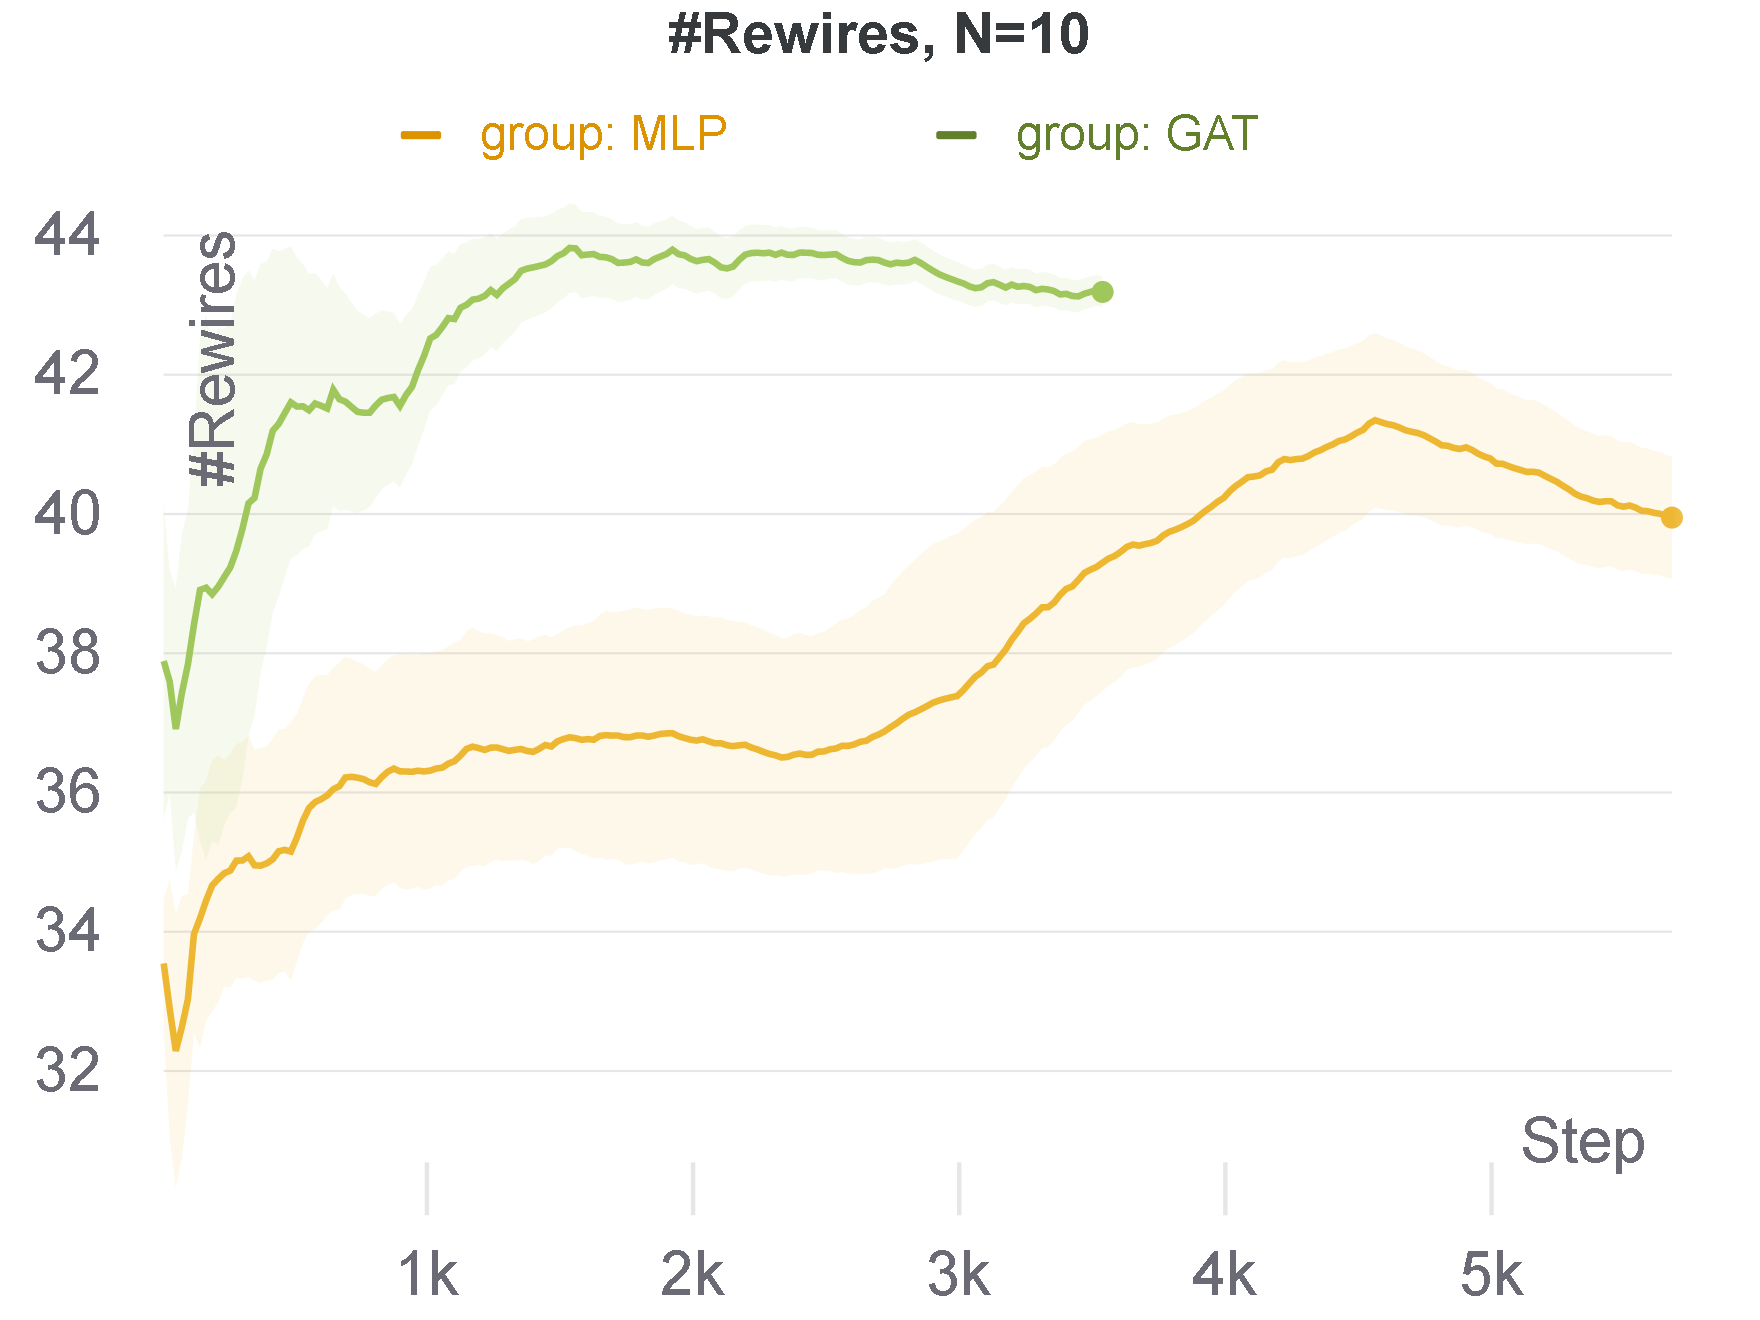
Our goal in this section is to use reinforcement learning to learn two kinds of recommender policies: aligned policies that maximize the final number of cooperators, and engagement-maximizer policies that maximize the number of rewires that take place over runs. We want to learn them so that we can compare their behavior and effects on their environment. Specifically with regards to cooperation, #rewires, and network topology.
4.1 Training Architecture

| N | k | time limit | |
|---|---|---|---|
| 10 | 0.1 | 4 | 1000 |
| 30 | 0.05 | 8 | 3000 |
| 100 | 0.005 | 28 | 10000 |
| 500 | 0.005 | 30 | 30000 |
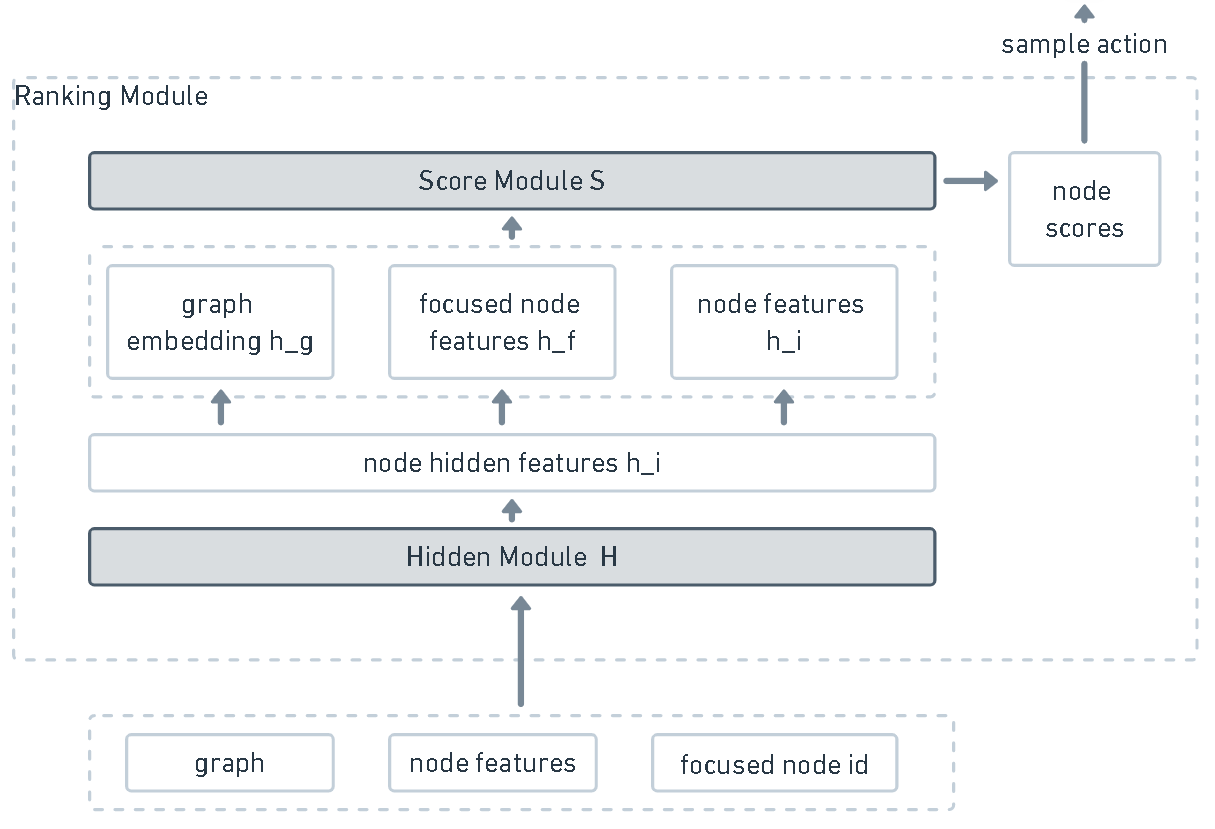
Our recommender policy consists of a ranking module that scores each node in the graph. Scores generate a probability distribution over nodes from which actions are sampled. During training a Multinomial distribution is used, while in evaluation, the action is simply the argmax of scores.
The Ranking Module includes a hidden module that produces node embeddings, and a score module which calculates scores for each node. can be either a MLP (Multi layer perceptron) or a GAT (Graph Attention Network). MLP is faster to train but considers only individual node features, while GAT is more expressive but slower to train, relying on message passing and learning to weigh the contributions of each node’s neighbor.
We picked GAT over GCN because GCN did not pass our preliminary experiments and GAT did. We were unable to parameterize a GCN that could learn a simple function of node features in a Supervised Learning setting. We tried GCN in the following parameter space: ; ; aggregation function ; learning rate ; dropout values .
We hypothesize this was due to the labels for our supervised task depending solely on the nodes own features. GCN would construct node representations by indiscriminately aggregating their neighborhoods, confounding neighbor features with their own. By learning to weigh edges, GAT could selectively focus on the node’s self-edge. For this reason, and given the importance of a node’s own features to our task, we chose to use GAT in our GNN policy.
4.1.1 Modules
A brief explanation of the sub-modules of our Ranking Module.
Input. Input to the ranking module consists of an adjacency matrix , the focused node id , node features (strategy , and normalized node degree), and an action mask that disables invalid actions. (the node itself or nodes that are already neighbors)
Hidden Module. The hidden module computes node hidden features . It can be a MLP or GAT, we study both.
Score Module. The score module is a single-layer MLP that takes the hidden features of each node, concatenated with , those of the focused node, and graph features obtained by summing over all node features. ,
4.2 Training
At each step, the Ranking Module ranks nodes based on their own features, the focused node’s features, and whole-graph features (obtained by aggregating all node features). The MLP hidden layer is unable to use neighborhood information and so it will rely solely on the relationship between features of nodes and graph features. The GAT hidden layer uses neighborhood information and learns to weigh the contributions of each neighbor to a node’s hidden features.
Each of the learning curves plotted in this section is the average of the 3 best runs for that configuration, while the clouds around them delimit maximum and minimum values. In plots for #cooperators, the reward value corresponds to , such that convergence to 1.0 cooperators give 1 reward and to 0.0 cooperators gives -1 reward. One training step corresponds to one batch of environment time-steps, or rewire updates.
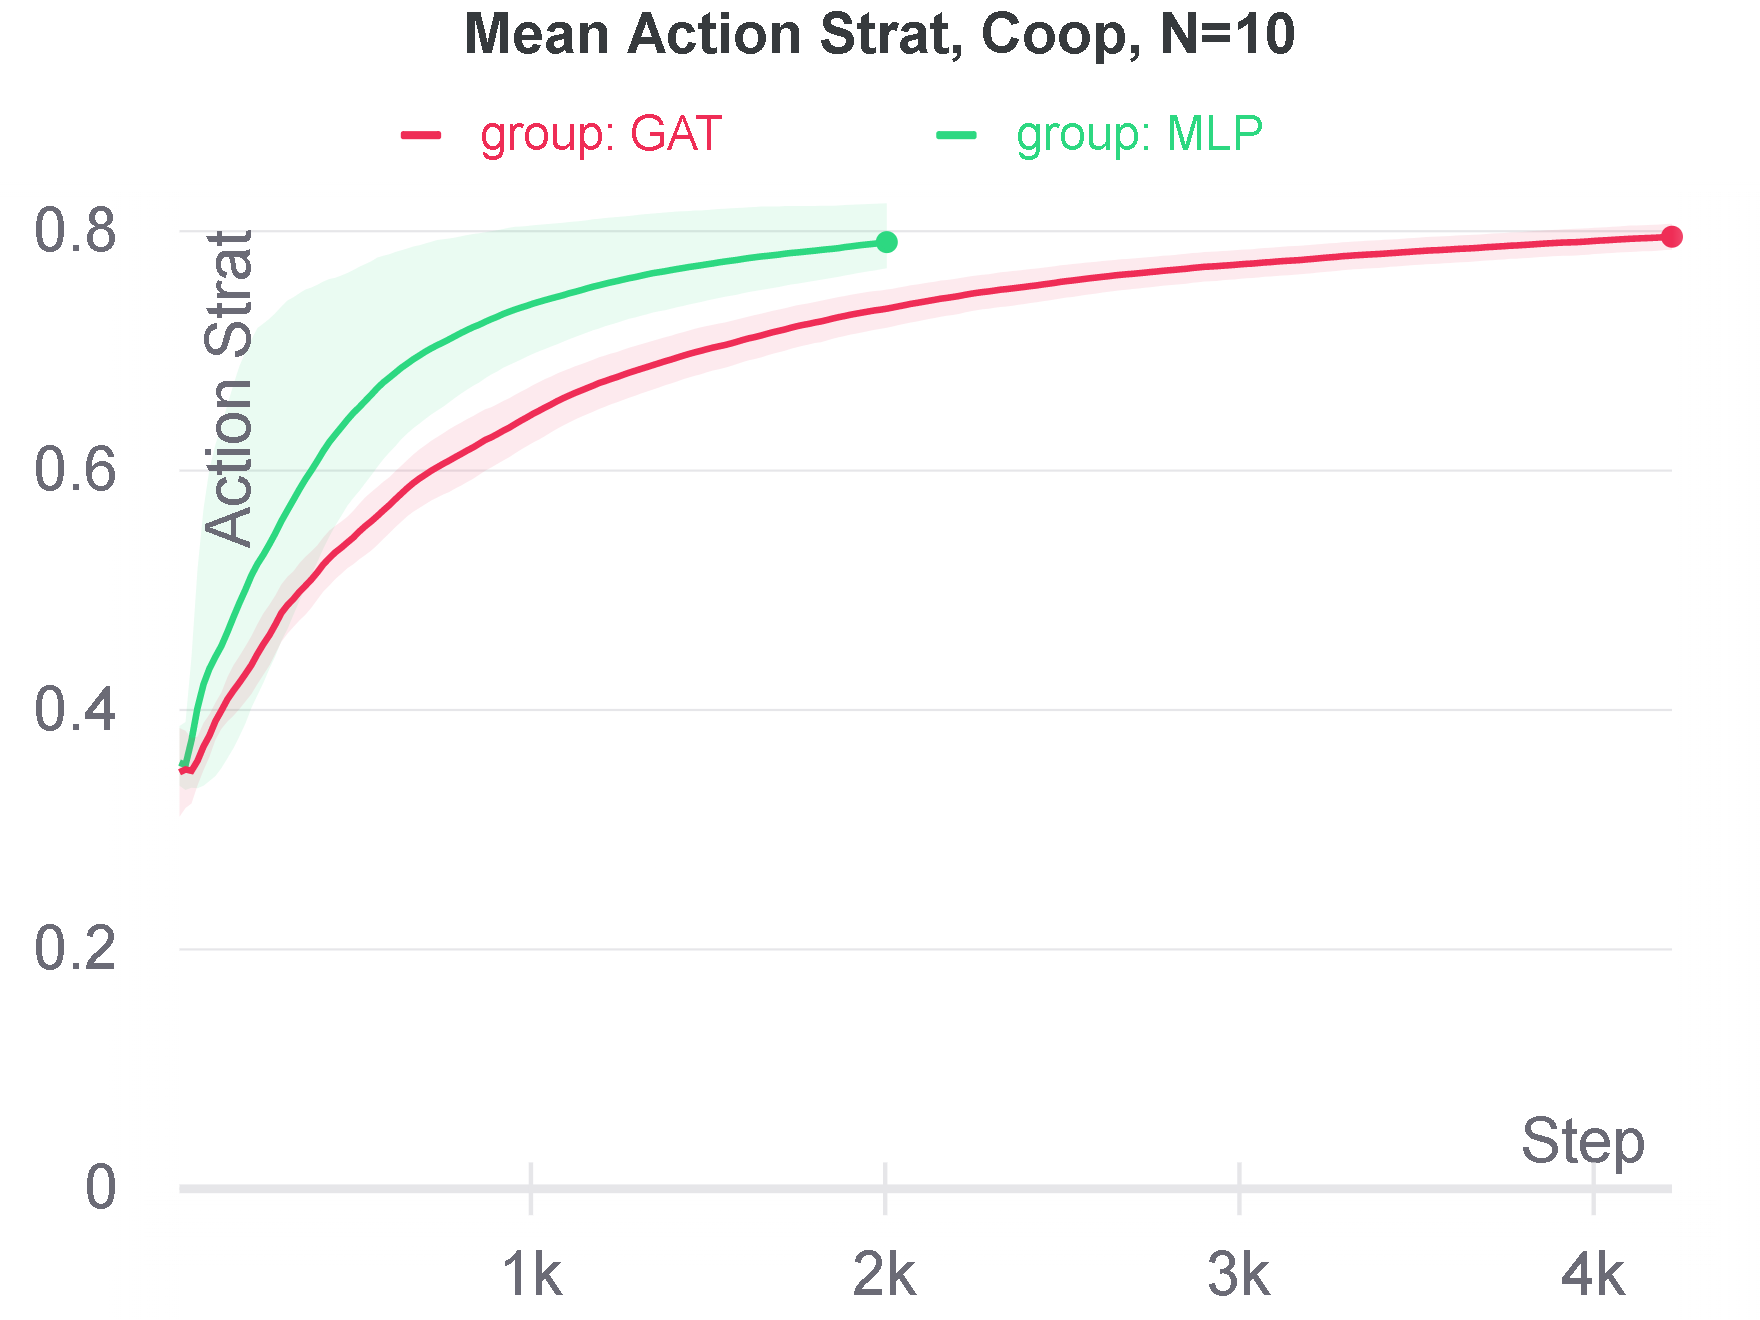
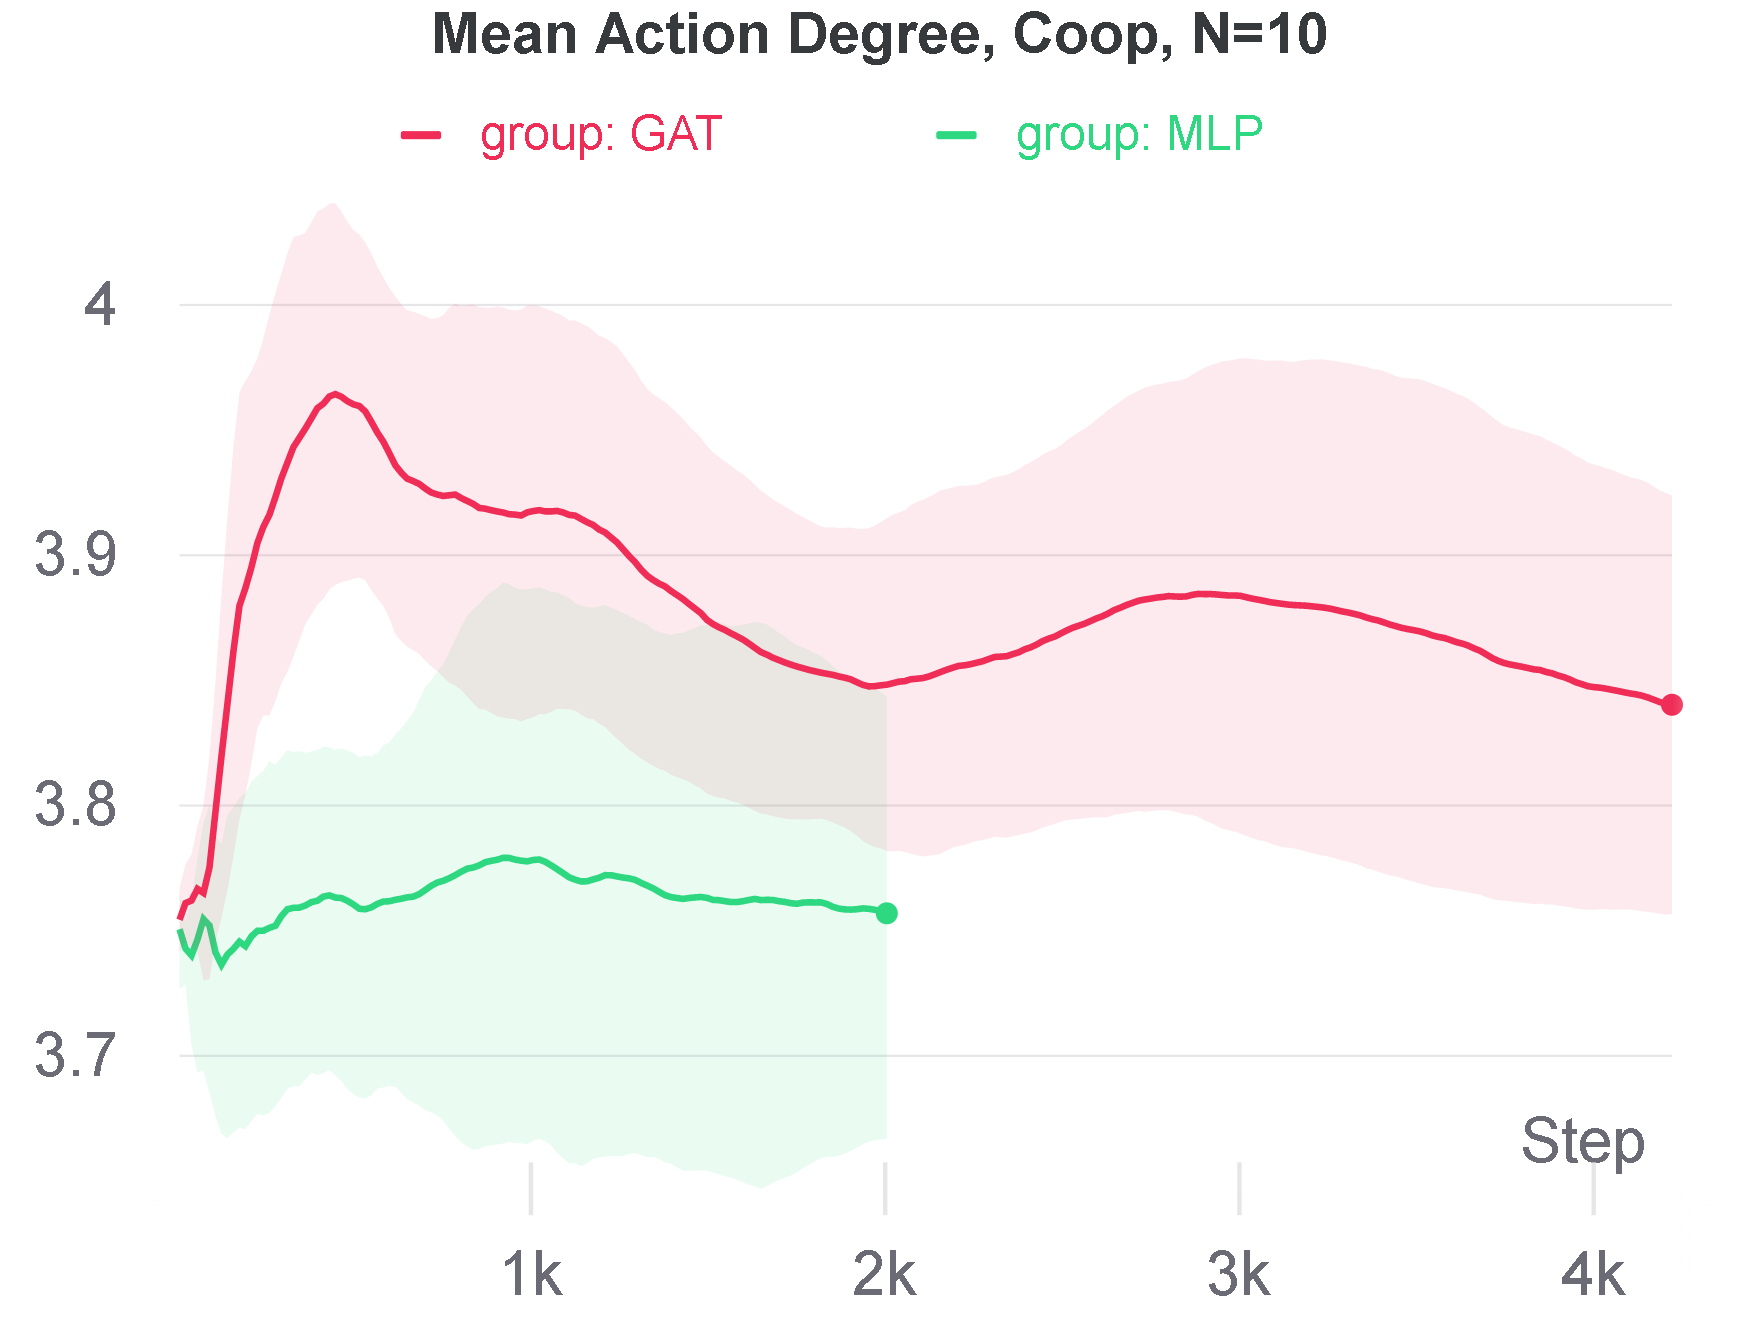
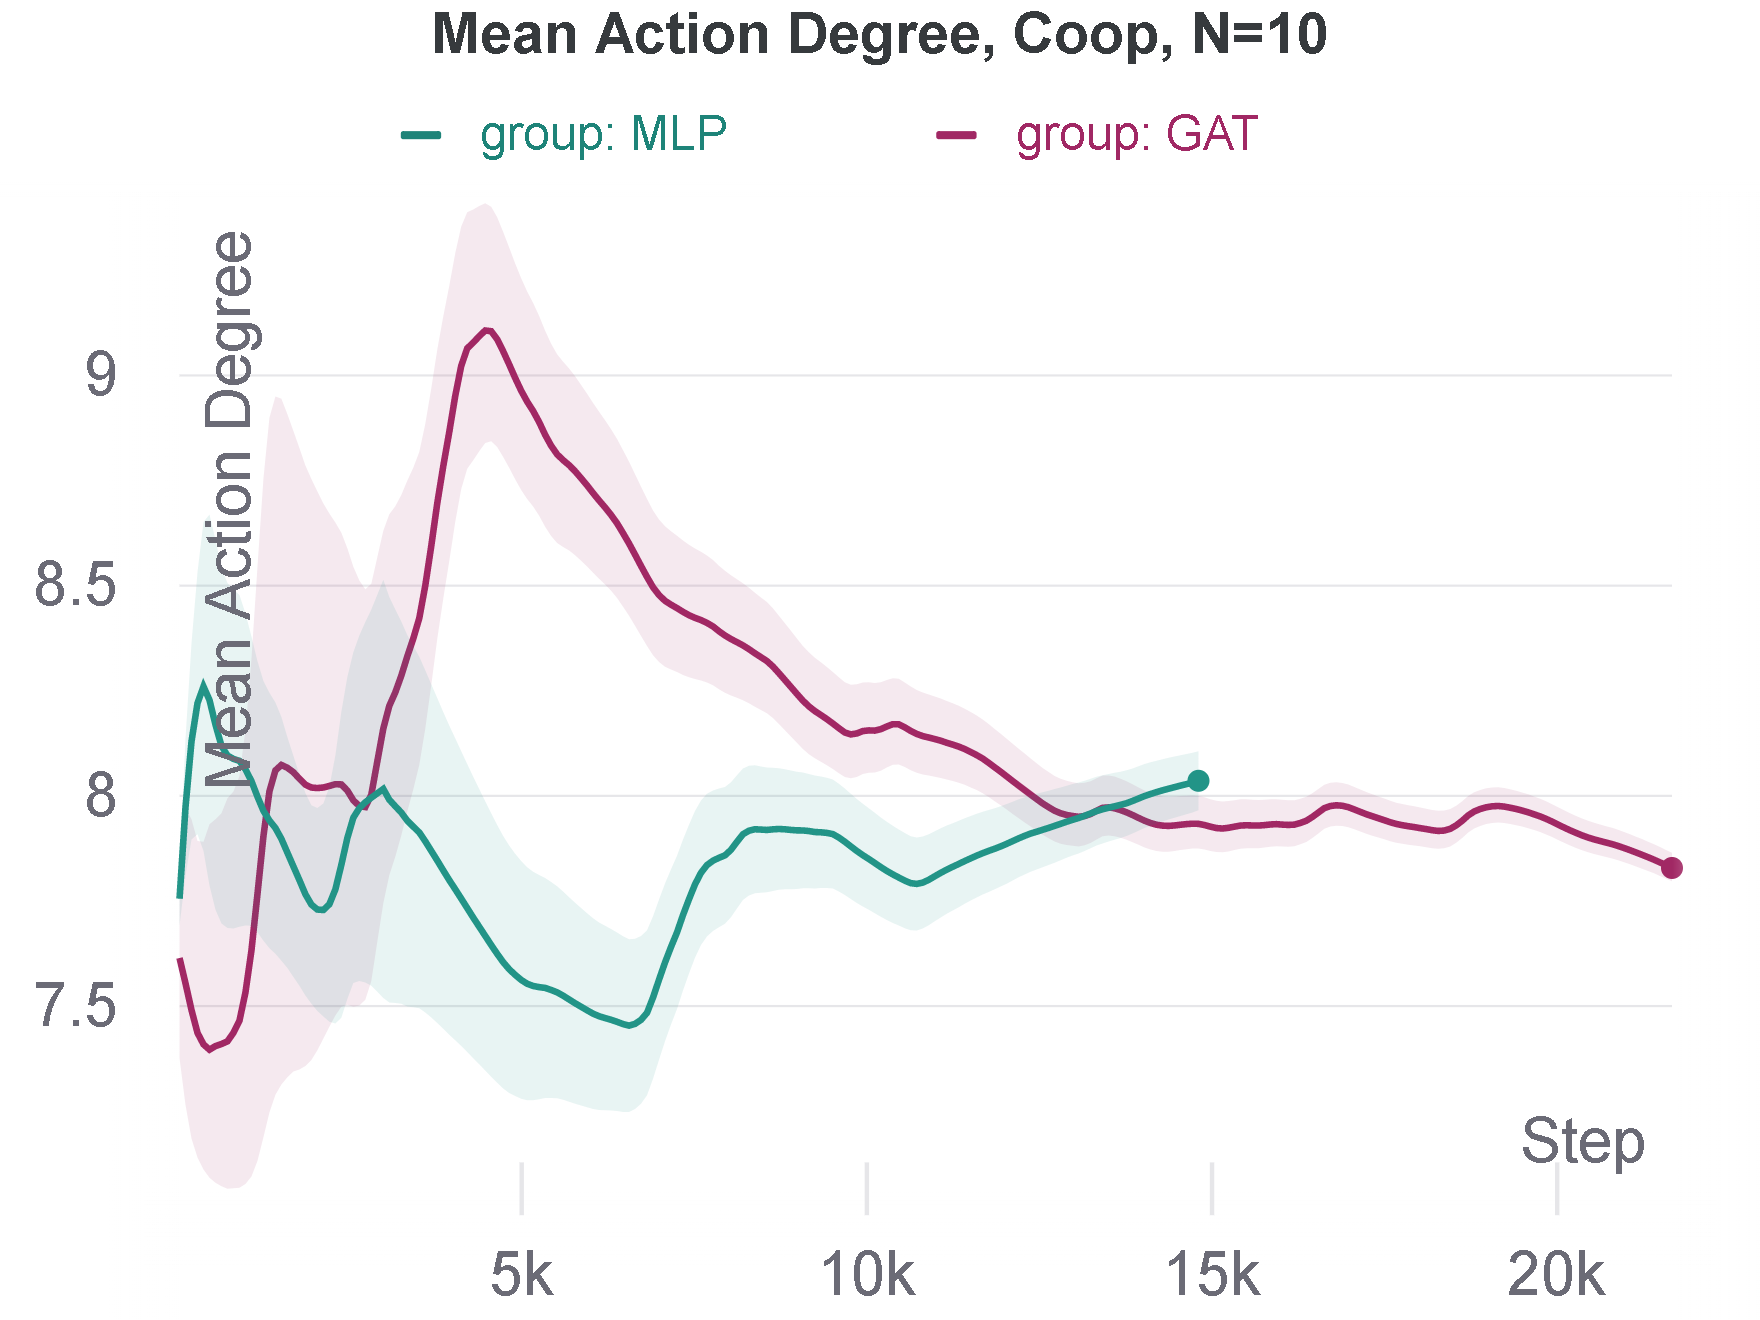
Mean Action Strat plots the mean strategy of recommended nodes over training (when and ), whereas Mean Action Degree tracks the mean degree of recommended nodes.
A difference in performance between training and evaluation may be observed and can be explained by the fact that in evaluation actions always results of picking the highest score, whereas during training, they’re sampled from a distribution to ensure exploration.
| Short | Recommender Name | Description |
|---|---|---|
| #rewires | Engagement maximizer | Total amount of rewire requests made to the recommender in each episode - as opposed to total number of time-steps (strategy updates + rewire updates). |
| #coops | Aligned recommender | Final number of cooperators. A natural metric for social good in our toy environment. |
4.2.1 N=10
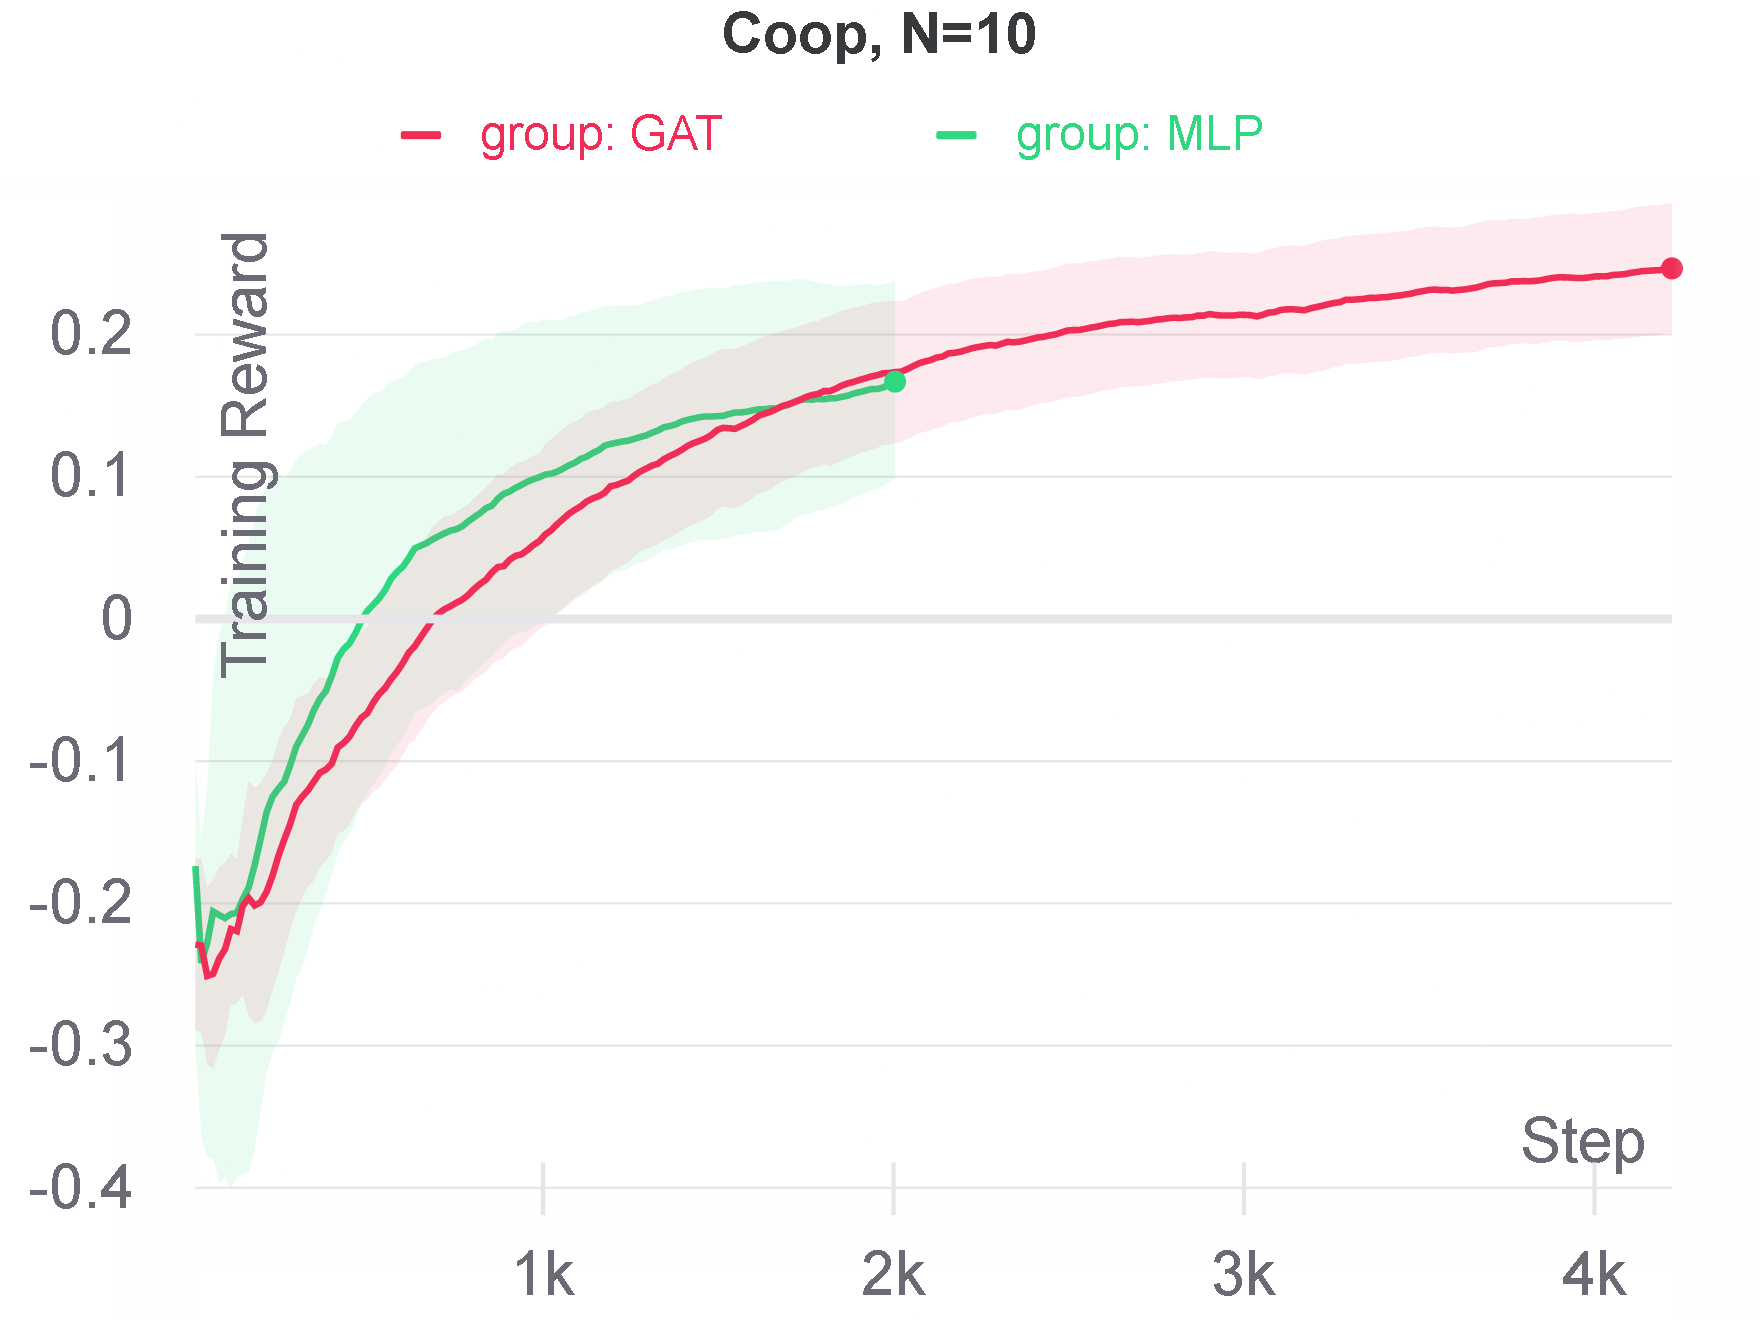
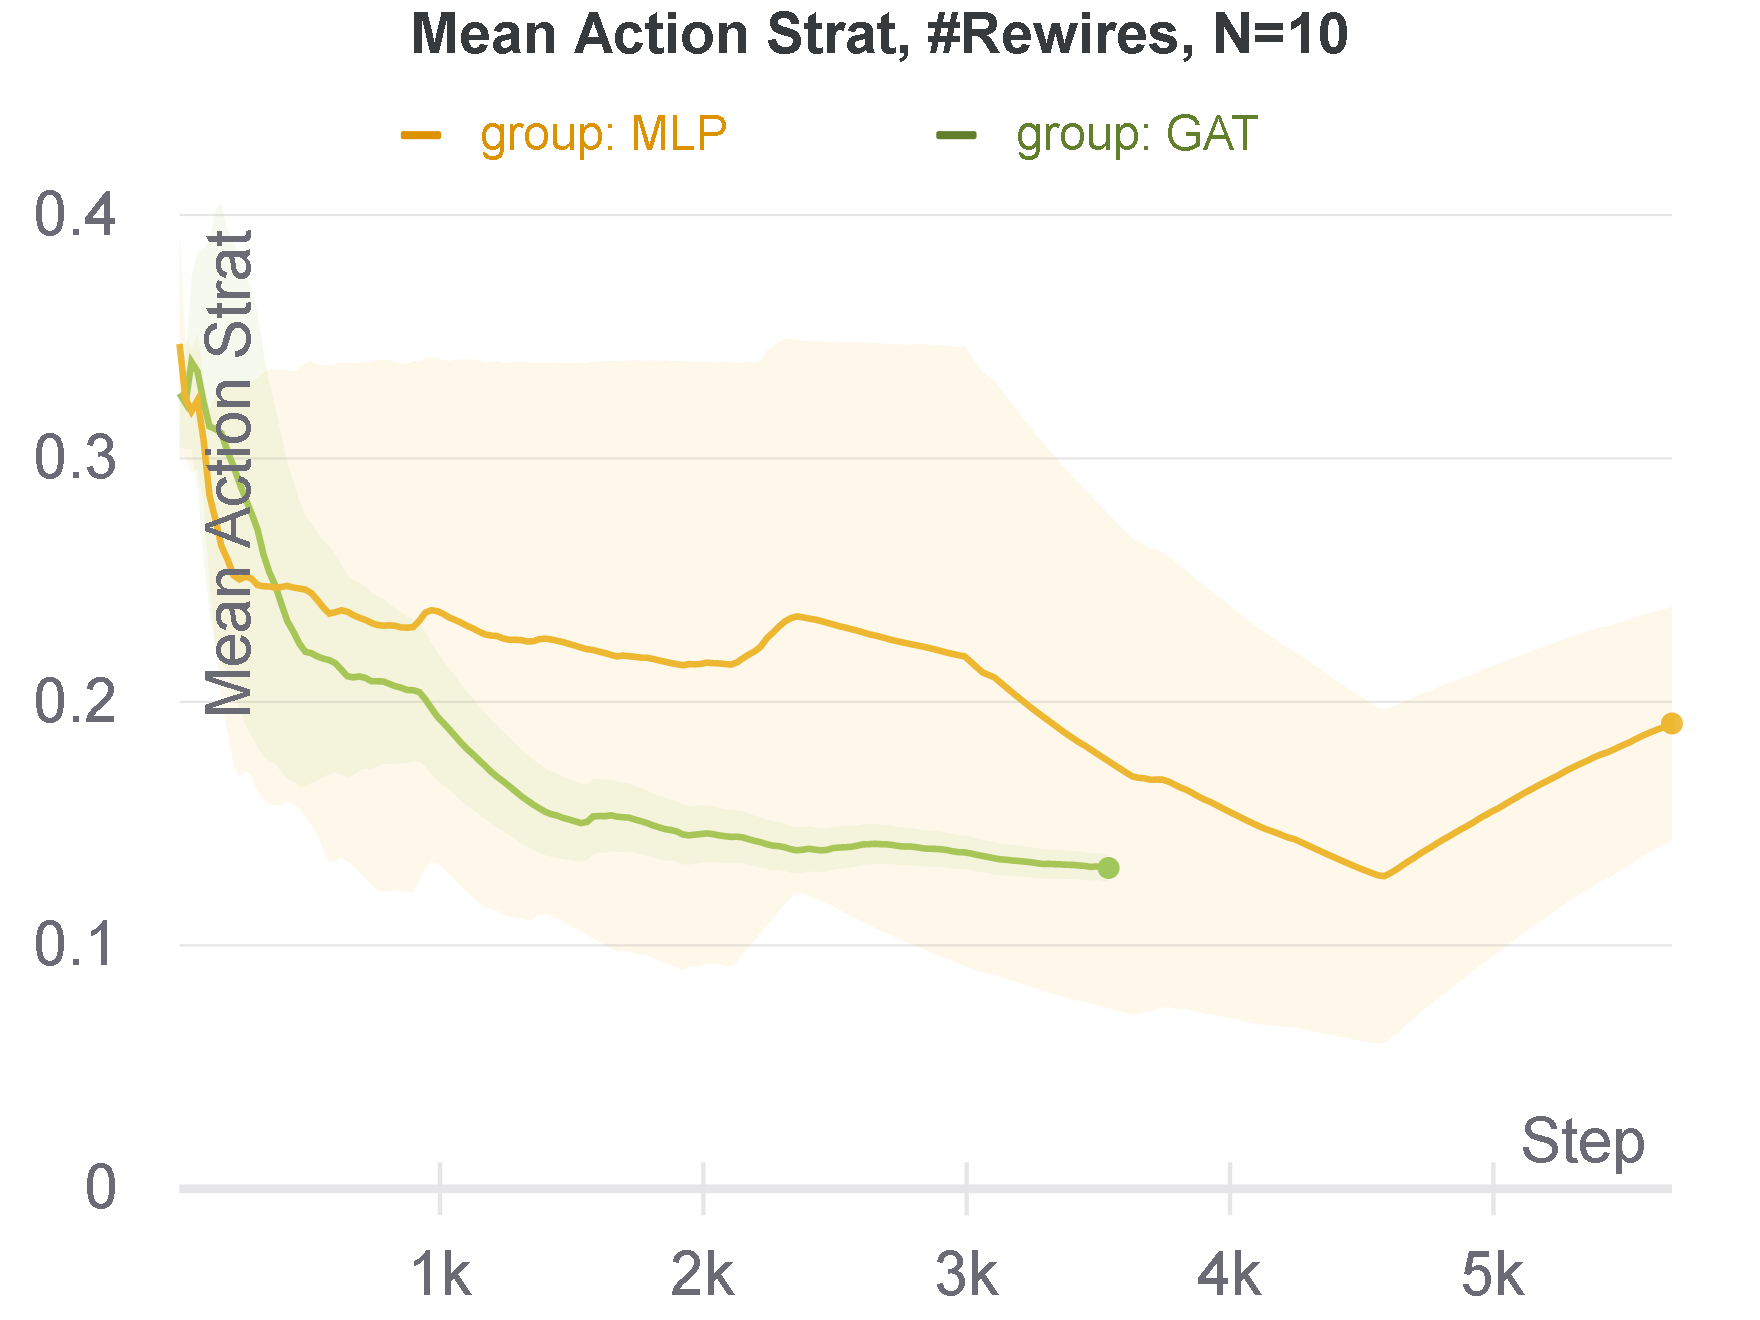
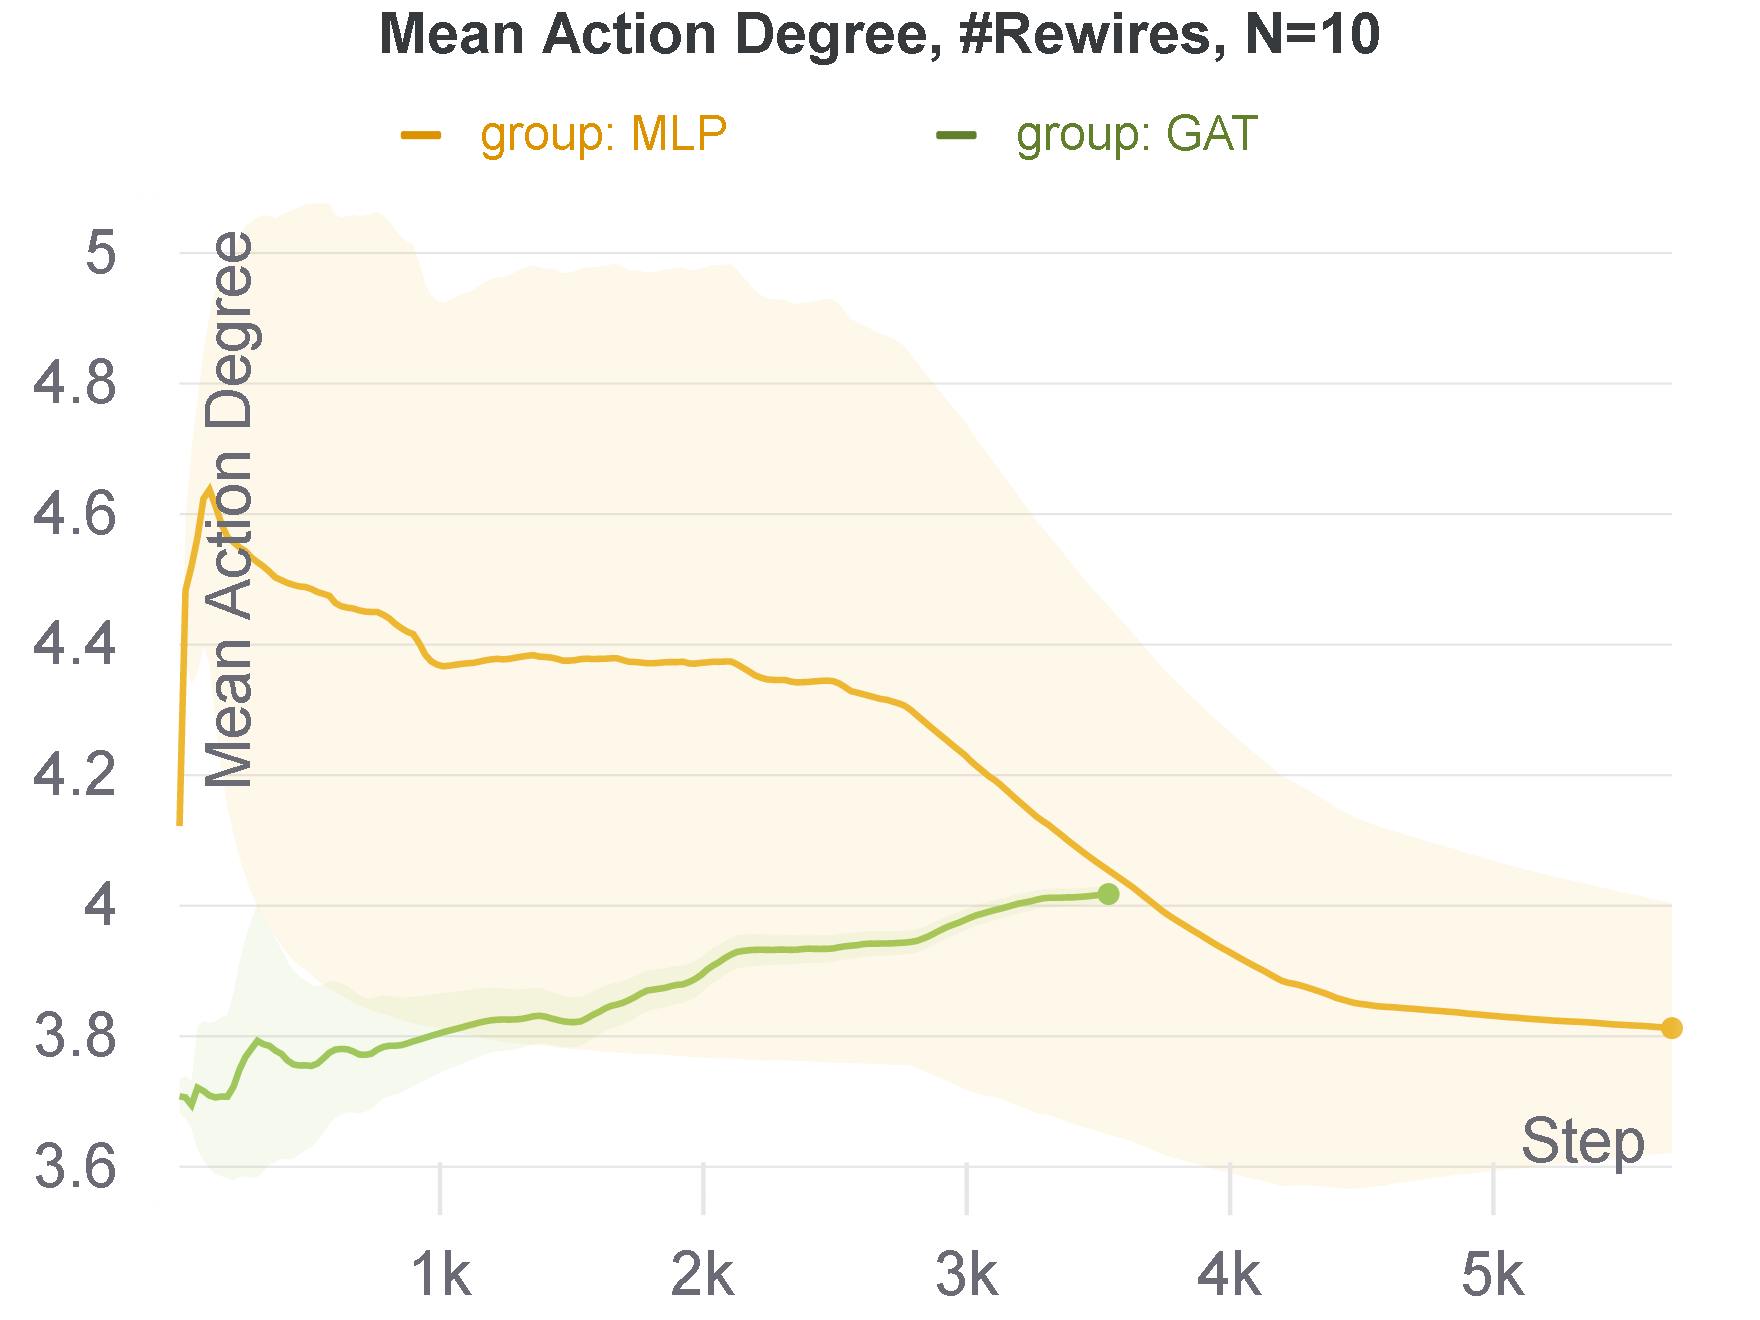
The environment converges quickly when . We are able to learn policies that do better than any heuristic for either reward function. The modest improvements in #coops may be due to the size and convergence speed of the environment leaving little room to act strategically.
GAT policy performs slightly better than MLP on #coop but considerably better on #rewires. The #coop policy trained for actually performed better on this environment than any of the policies we trained. We observe the behavior of learned policies usually resemble the best heuristics in most metrics. However, there are noticeable differences in action strategy and action degrees that might account for learned improved behavior.
4.2.2 N=30
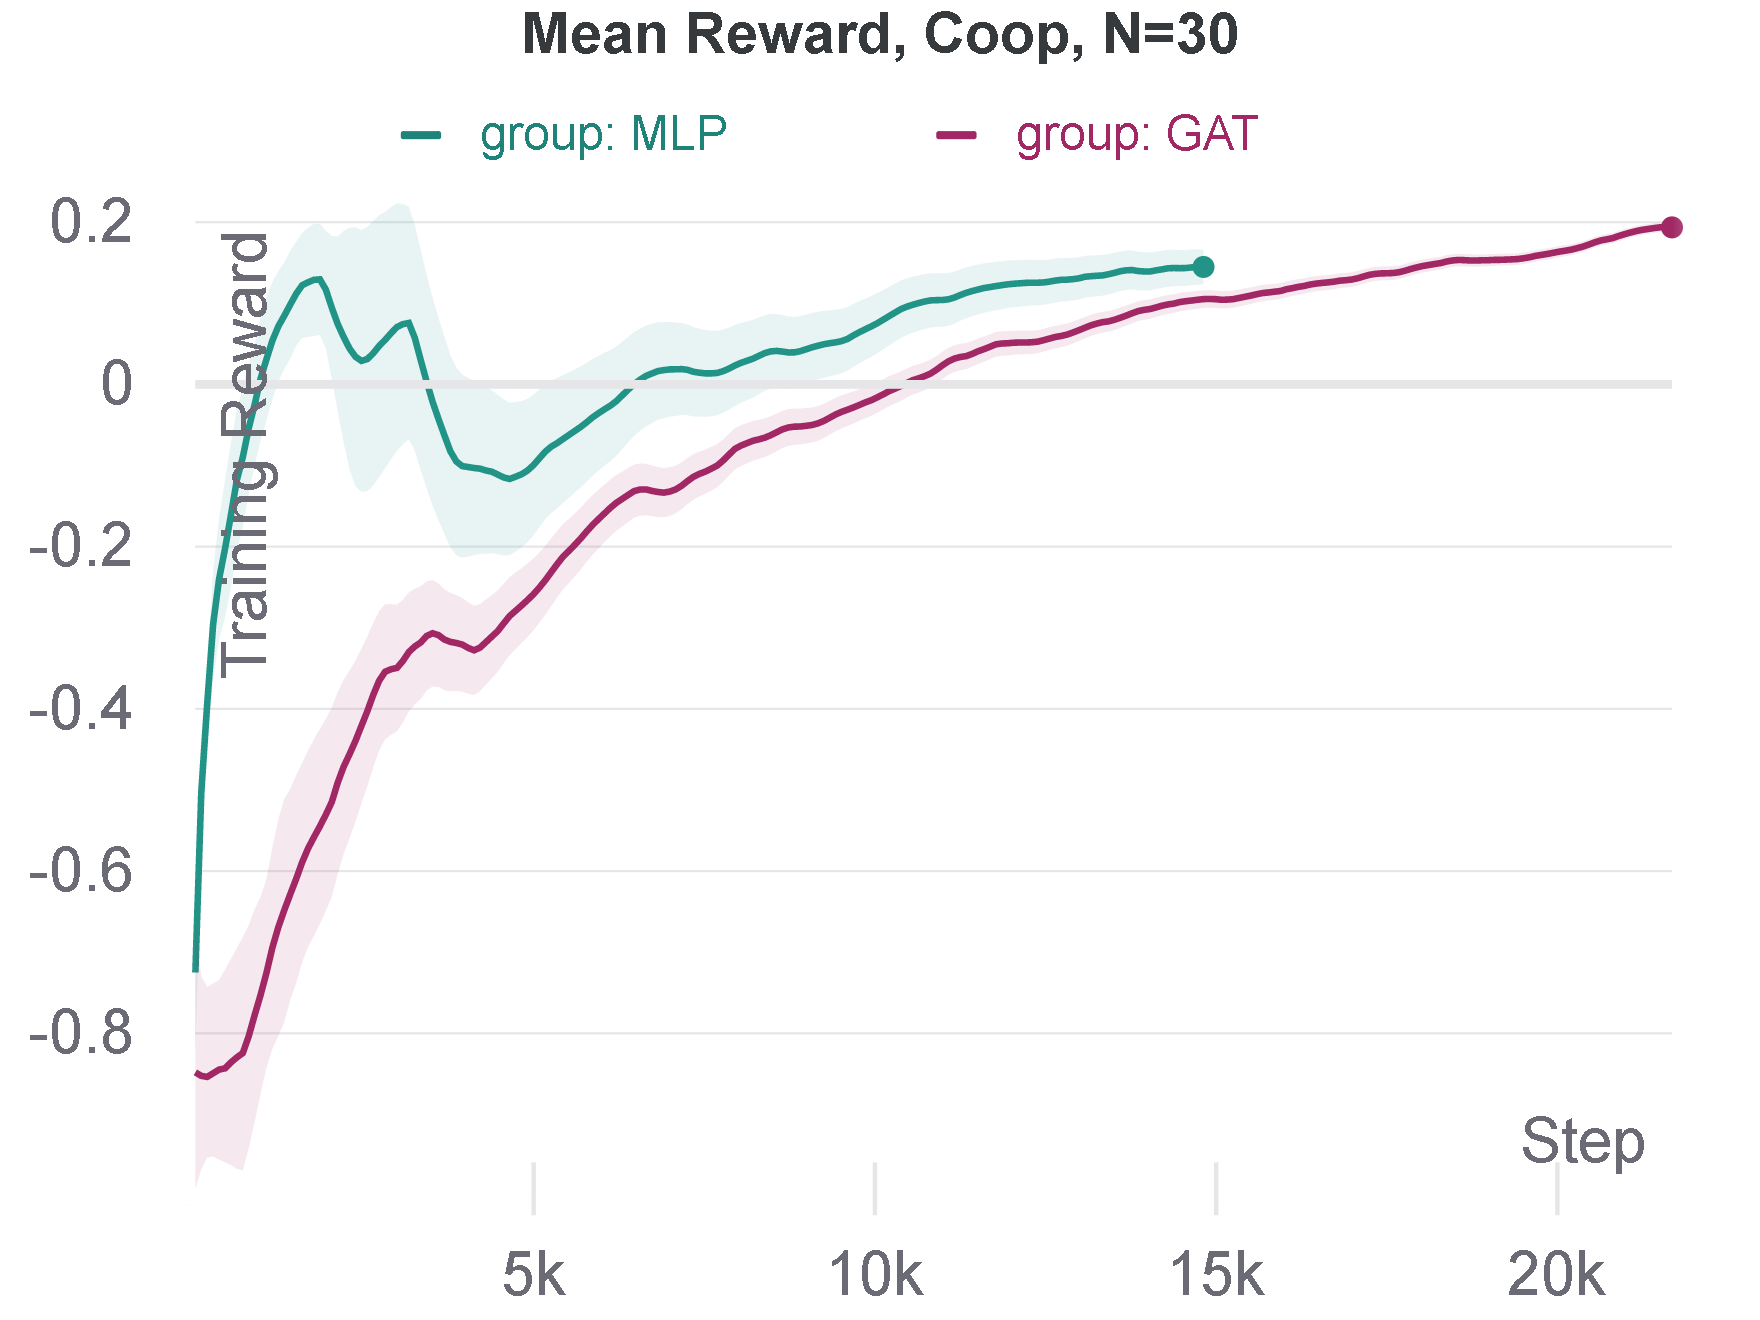
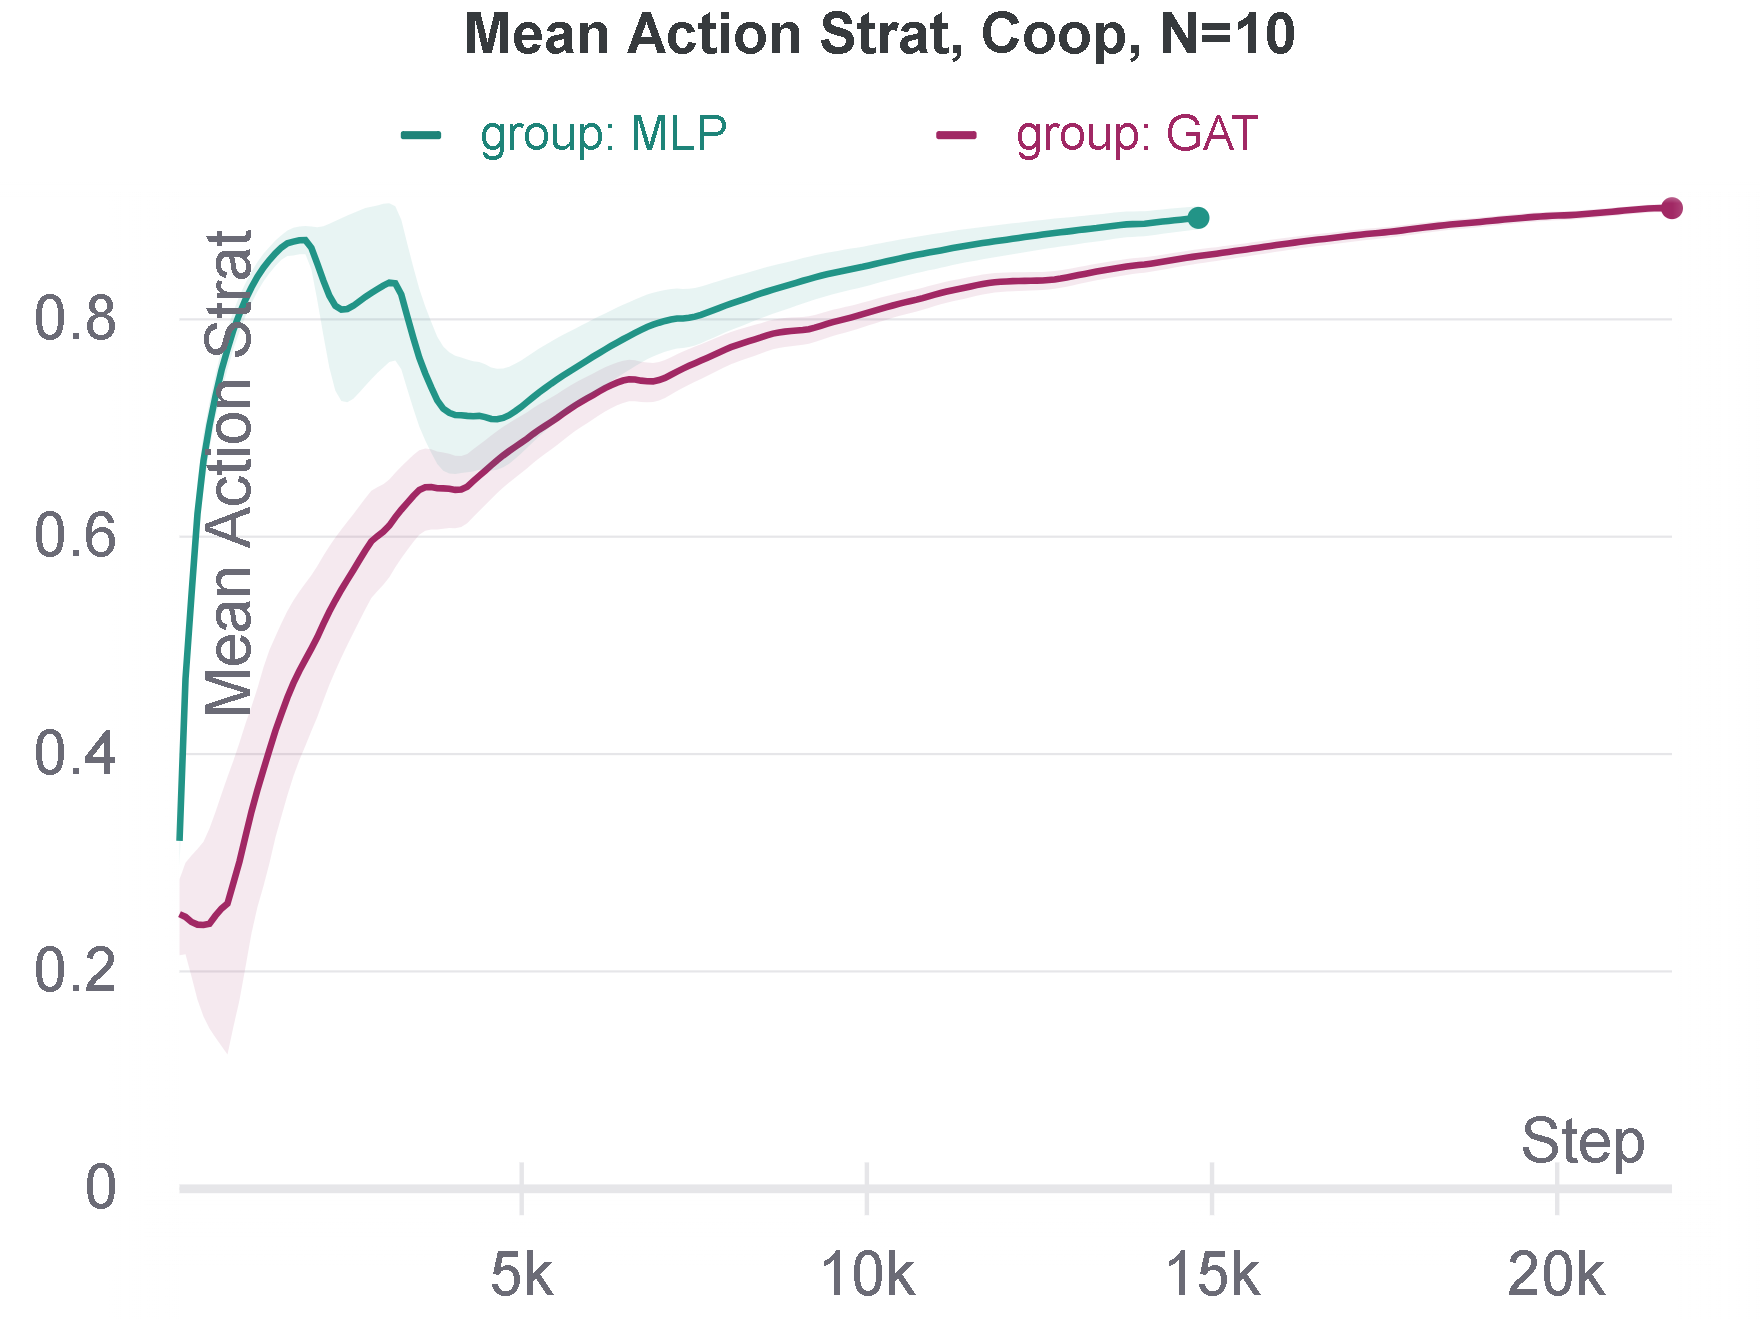
At , MLP policies significantly outperformed GAT ones both for #coop and #rewires. GAT’s higher complexity might require more training episodes than MLP, which could explain its lower performance, as both policies were trained using the same resources.
4.2.3 N=100

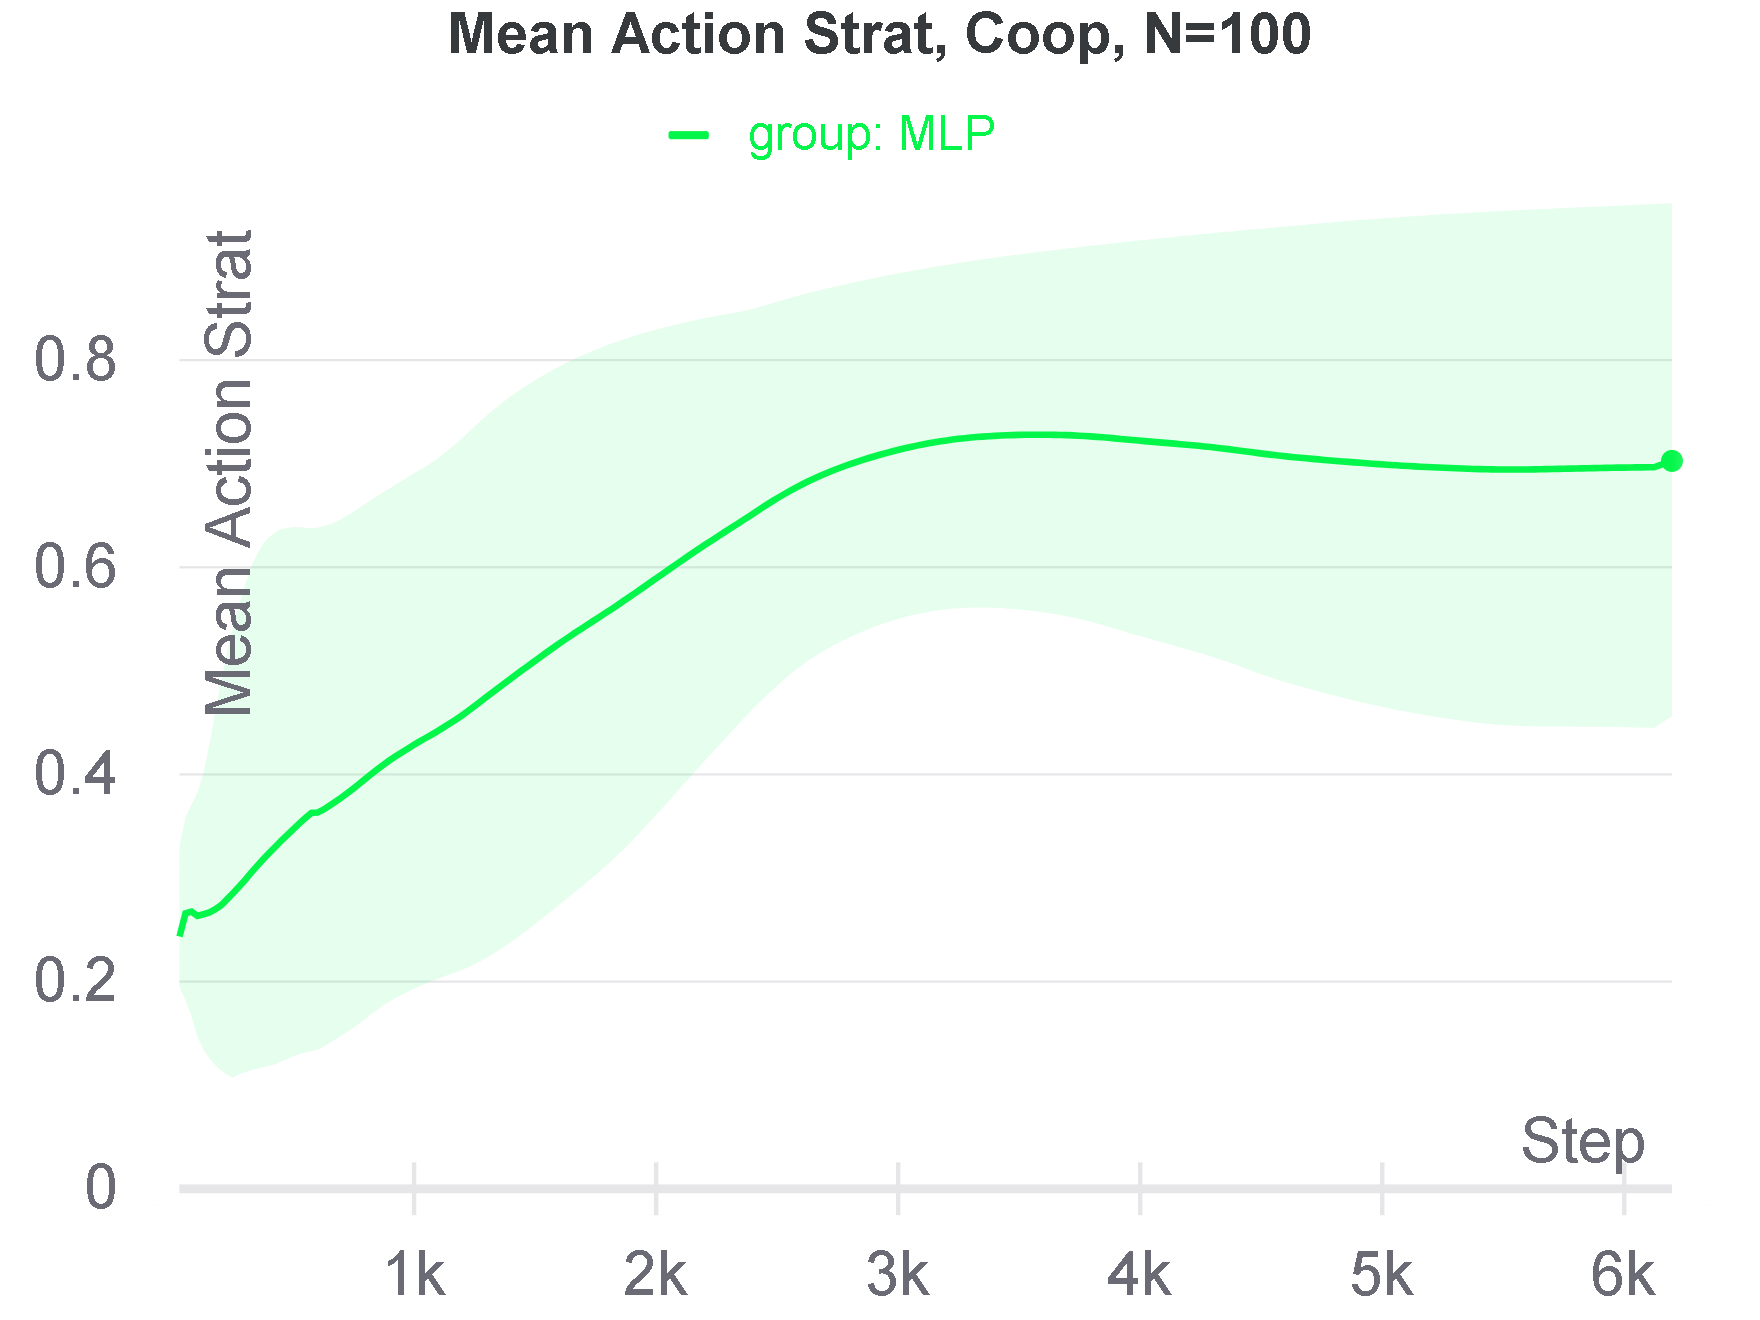
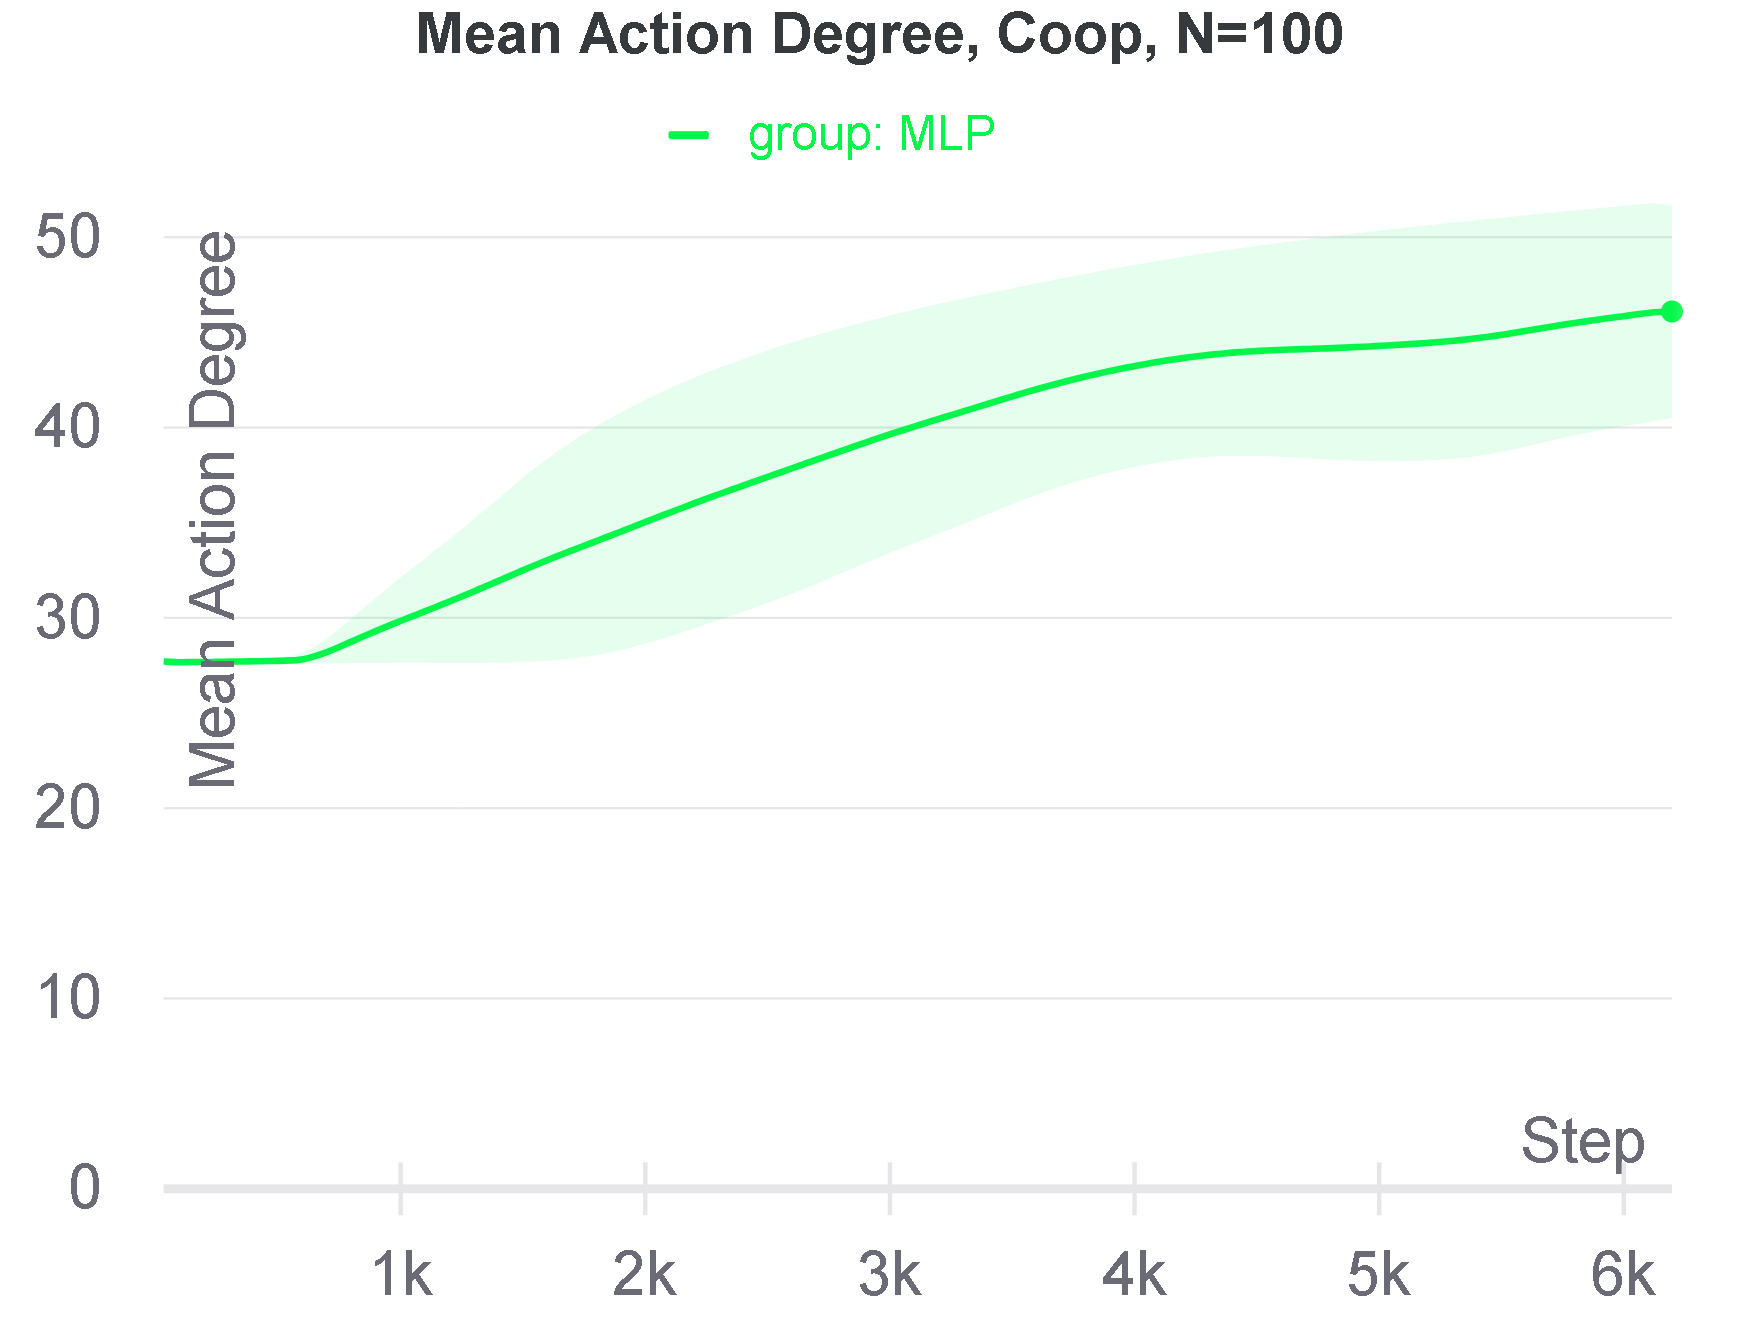
At , MLP #coop matches the top heuristic’s performance for #coops. Our MLP trained to maximize #rewires on N=100 does not beat to top baselines, but the GAT policy trained on is able to beat all heuristics by a large margin.
We have not been able to make GAT policies converge on environments where or . Additionally, #coop seems to converge much more smoothly than #rewires at every value of N. This may be explained by the fact that there is a mapping between observations and #coops (node strategy features), whereas #rewires is merely counted and given as reward at the end of an episode, without markers in the observable state. We haven’t tested this hypothesis.
4.2.4 N=500
At , despite having trained policies specifically on , the best performing policy is the one trained for MLP #Coop and it beats all heuristics. Again, we hypothesize that policies in smaller environments converge faster, and that difference makes up for differences of dynamics in networks of and .
To conclude this section, we show that it is possible to learn to control evolutionary network dynamics by means of recommendations. It is even possible to learn policies that outperform all heuristic combinations of strategy and node degree for some configurations of our environment. We expect that the configurations where we were unable to learn policies might be solvable with more fine-tuning, or simply applying more resources.
4.3 Analysis
We began this toy experiment by asking "How can we evaluate the consequences of using user retention as a reward function?". More generally, to explore how we could evaluate and compare reward functions with respect to the societal effects caused by recommenders trained to optimize them. So we defined a toy environment to represent society and used reinforcement learning to optimize these reward functions.
Having evaluated our learned policies as well as many heuristics, we can ask the question in the context of our toy model: Do engagement maximizers perform significantly worse than aligned recommenders? The answer is, perhaps unsurprisingly, yes. In all our settings, engagement optimizers will lead the environment to low final numbers of cooperators. The only exception was the environment where , where the best performing engagement policy produces a final fraction of cooperators around 0.5 which is high in comparison with other heuristics.
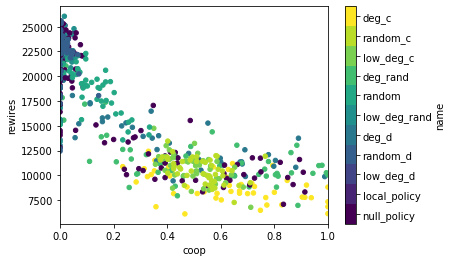
This suggests something we already expected. With respect to our toy environment, misaligned recommenders like the engagement maximizer may or may not lead to bad outcomes for society, but they are worse than aligned recommenders. In the case of Fig. 13, these two reward functions are at odds with one another, at least for our heuristics which trace a convex curve in the axes of #coop and #rewires.
Strategies that recommend cooperators generally lead to higher convergence to full cooperation than the others, we don’t observe such a pattern in policies that maximize #rewires.
With regards to topology, it is very clear that heterogeneity increases with mean action degree and that it is generally lower for heuristics that recommend cooperators than for the others.
Aligned policies also tend to lead to more heterogeneous networks than misaligned ones, again with the exception of .
One limitation in these experiments is that we are considering worlds where there is only one rewiring policy and simulating what happens if people keep using it. In the real world, if a recommender is bad enough, people will just not use it at all.
A more realistic setup would look like competition between the recommender and the null or local heuristics. In that case, there would be a bound on how bad the RS could be before users decide they might as well not rewire social ties at all, or only within their local environment, respectively.
If learning happens in these conditions, we might see a "bait-and switch" strategy emerge. The recommender might begin by being advantageous to users while trying to get adopted by as many users as possible, and switching to an "exploit" dynamic once dominant in the population, to further maximize its reward function.
5 Experiment: Competing RS to Address the Alignment Problem
5.1 Competition Dynamics
We extend our environment to allow competition between recommenders. This is achieved by attributing a recommender strategy to each node and allowing them to evolve in the same way that game strategies evolve. That is:
Recommender Update
At each time-step, there is a chance that the update performed is a recommender update. That is, the user may change which recommender she is using to rewire ties. In that case, an agent selects a random neighbor and imitates its rewiring strategy with probability p weighed on their fitness difference given by the Fermi update. (Eq. 1)
Recommenders are exclusive, meaning they will only recommend nodes from among their own users. Keep in mind users still interact with their neighbors, even if they are using other recommenders. This reflects what we see in the world, where recommender systems (mostly) only have information about their own users.
We introduce a second time-scale ratio to regulate the relative frequencies of mediator updates () and two other kinds of updates. (strategy or structural )
All competition runs are initialized with 1000 nodes and a time-limit of time-steps. The effects of competition were not as clear on populations of 500. Recommender updates use a different temperature parameter because we observed the impact of mediator updates was negligible using 0.005. Given the stochastic nature of our simulations, all presented results are averaged over 30 runs.
5.2 Competing Baselines
We begin by taking an environment dominated by the local heuristic and introducing recommenders into of the population. 90% of nodes use the local heuristic NO MED, while each node of the remaining 10% has one of the others. (GOOD, BAD, RANDOM, FAIR)
We began with measuring the effects of competition over various timescale combinations W and W2. ( and respectively)
We observed that for (no strategy updates, only rewires and mediator updates), the initial conditions remain practically the same, while for the initial conditions remain the same due to there being no mediator updates.
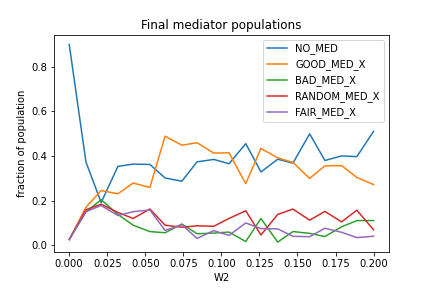
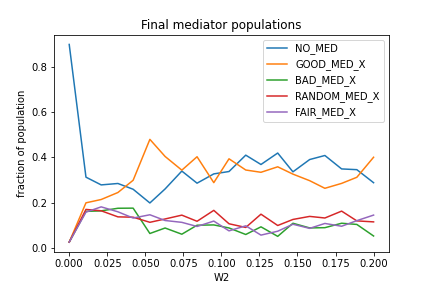
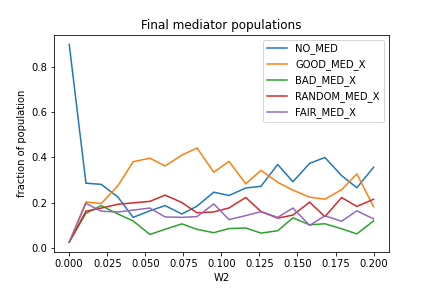
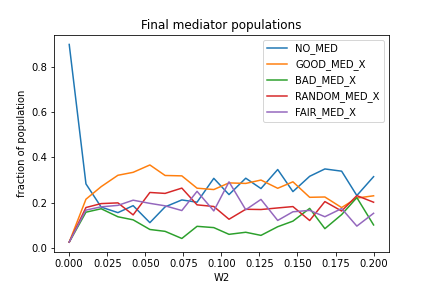
We find a critical region where NO MED does not have a majority around and . We investigate this range more closely in Fig. 15 and observe that GOOD and NO MED have a tendency to dominate over the others. That is most pronounced at . As W1 increases, the gap between strategy populations becomes less evident, although BAD takes the bottom place more convincingly.
5.3 Adoption Experiments
Questions for adoption experiments:
-
1.
Will engagement maximizers be adopted and thrive in a society of local heuristics? What about aligned recommenders?
-
2.
In a society dominated by engagement maximizers, will an aligned recommender be adopted and thrive?
-
3.
Do worlds were RS competition exists lead to better outcomes for society than worlds dominated by engagement maximizers?
From our experiments, competition results are clearest in environments where N=1000. Due to computational and time constraints, we were unable to learn policies directly on these large environments. Despite this, we pick the heuristics that score highest in our metrics of #coops and #rewires to use as proxies for policies trained explicitly to maximize them. We pick "Random cooperators" as our aligned recommender and "Random" as our engament maximizer.
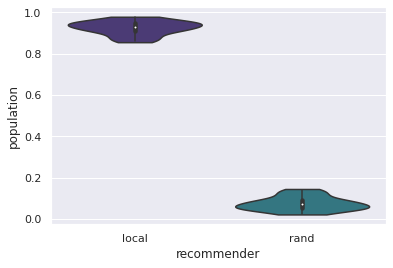
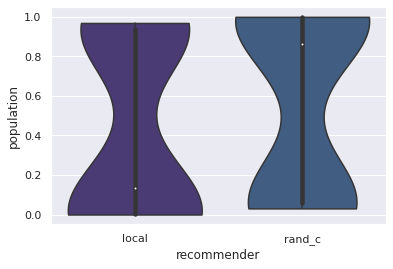
We run one trial for each recommender in environments with local-heuristic majorities (90% local). We want to know whether recommenders maximizing user-engagement would be able to take over a population starting from a small seed. We ask the same question for recommenders maximizing cooperation.
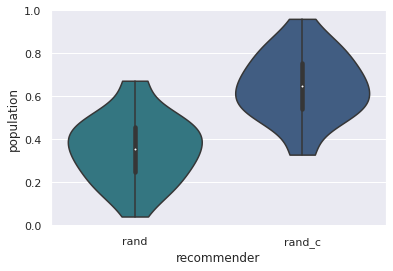
We can observe that a diverse competition scenario (Local vs Many) leads to high cooperation and wide adoption of recommenders in our toy environment. This is consistent with the suggestion that competition between RS is a desirable feature to implement in the world, protecting it from misaligned recommenders.
| Heuristic | Coops | Rewire | Final prop. of start maj. |
|---|---|---|---|
| Engagement | 0.06372 | 71487.22 | - |
| Engagement vs Local majority | 0.0 | 39301.033 | 0.925 |
| Local | 0.00000 | 33934.28 | - |
| Local vs Many | 0.432 | 277427.633 | 0.227 |
| Aligned vs Local majority | 0.362 | 225244.533 | 0.427 |
| Aligned vs Engagement majority | 0.469 | 417636.18 | 0.443 |
| Aligned | 0.52152 | 34542.48 | - |
6 Previous Work
6.1 Societal Impacts of RS
There have been qualitative inquiries into the societal impacts of recommender systems, on which we based our modeling interface: RS as multi-stakeholder environments [9]. A taxonomy of ethical issues associated with RS [9]. An overview of consequences of widespread RS [15]. A taxonomy of interactions between humans and intelligent software agents [16].
RS alignment has been connected to the AI alignment problem [17] along with illustration of common patterns in current RS design. The same work also offers an overview to "higher-level approaches" to RS alignment: 1) Better metrics; 2) Participatory recommenders; 3) Interactive value learning; 4) design around retrospective judgement. However, they do not mention the role of competition among RS.
6.2 Rewiring in Dilemmas of Cooperation
Work in evolutionary game theory has seen setups where networked agents play social dilemmas with rewiring of social ties [11]. Recommendation mechanisms in spatial public goods games have also been modeled before, although the recommendations were made by other agents instead of by a central mediator. [18]
6.3 Learning to Control Graph Dynamics
Graph neural networks have been used in conjunction with deep reinforcement learning to solve graph optimization problems. [19] We base our training architecture on recent work on the control of dynamical processes in graphs through node-level interventions, [20] and train it with Proximal Policy Optimization (PPO) [21] to obtain rewiring strategies that optimize different metrics in our model.
To the best of our ability, we couldn’t find previous work using RL to solve a task of mediation in evolutionary game theory. The closest application we’ve been able to find was RL being used to learn policies of partner selection for individual agents in the iterated prisoner’s dilemma. [22]
6.4 RS competition
Strategic dynamics in content production and consumption may lead to the failure of classical principles of RS in maximizing social welfare. The need to avoid such a failure by revisiting those principles with game theory and multiple stakeholders in mind has inspired a whole research agenda. [23]
In the same game theoretic paradigm, competing recommenders have been studied [24] - although not with respect to externalities. Previous work has approached the cost that competition between strategic mediators would impose on the population of agents they mediate [25], although not in the context of recommendation systems.
7 Conclusion
This work had a broad scope in order to shed light on how an end-to-end study of reward functions for recommender systems might be done. Recommender alignment is a pressing and important problem. Attempted solutions are sure to have far-reaching impacts. The least we could do is develop methods for evaluating and comparing tentative solutions with respect to those impacts. We synthesized a simple abstract modelling framework to guide future work.
Namely, a model must include an underlying environment, users with partial information, and RS with global information; notions of utility (derived from the environment) for individual users, society, and the RS; and a notion of recommendation.
A toy experiment was run to show our framework in action.
1. We wanted to know whether user retention is a good idea as a proxy for social good. We adapted an existing model to implement our modelling interface and ran several simulations to see how it behaves under different heuristic rewiring strategies.
An ordering of heuristics is found with respect to speed of convergence to full cooperation. Surprisingly, recommending cooperators to cooperators and defectors to defectors leads to worse outcomes than a random policy.
2. Then we used proximal policy optimization and graph neural networks to learn to control graph dynamics through recommendations. We did this just to obtain policies explicitly optimized for the reward functions we wanted to compare.
We verify it is possible to learn to control graph dynamics using recommendations. Analyzing environment metrics, we conclude that engagement maximizers generally lead to worse outcomes than aligned recommenders but not always.
3. After that we extended our toy environment to allow for recommender competition within the same population and compared simulations of it under competition with simulations under a single recommender.
We find that recommender competition generally makes our society better-off. Aligned recommenders are found to be able to replace both local heuristics and engagement maximizers. The engagement maximizers we tested are not found to be able to replace local heuristics, suggesting real world RS would’ve needed different strategies to be adopted.
Our main focus wasn’t the results of these experiments, which are simple and self-contained, but rather the fact that we were able to construct them thanks to our modelling interface, which allows for arbitrary complexity in the concrete model used. With the second interesting benefit of learning to control the evolutionary graph dynamics of our toy environment.
We hope this has laid some foundations for future work on proposals for RS alignment and their evaluation. The experience of billions of people is shaped daily by content recommendation. As society changes, so must our objective functions, therefore the need for a bottom-up adaptive system that answers to users. Aligning recommender systems is one of the critical tasks of our time.
8 Future Work
The direction we’re most excited about working on is in learning recommenders under competition. Especially the base case where recommenders merely need to compete with the null or the local strategies. In this case, recommenders don’t learn under the assumption that they have a monopoly on their populations. Therefore, even if misaligned, they must learn to not be actively detrimental, and a little better than the baseline in order to get adopted. We expect we’ll be able to find an emergent "bait-and-switch" dynamic here that is also present in the real world, where after widespread adoption, when it is more disadvantageous for users to leave because of network effects, recommenders turn to "exploit mode", caring less about user utility and more about their own.
If we were able to spend more time on learning graph dynamics, it would be edifying to apply methods of interpretability to understand what strategies the agents have learned to beat to baselines. Do they focus on converting hubs? Do they target high-betweenness nodes somehow? Are focused nodes served differently based on their strategy?
Another avenue of study would be games beyond the prisoner’s dilemma, like ultimatum, or public goods, extending user interaction from 1-to-1 to many-to-many. Completely different environments like Sugarscape or sequential social dilemmas [26] are also worth exploring.
Finally, midway through the work of this dissertation, temporal GNN libraries like Pytorch Geometric [27] became available, which would certainly make learning more efficient enabling training for longer periods and perhaps allow convergence in some of our larger environments.
References
- Benkler et al. [2018] Yochai Benkler, Robert Faris, and Hal Roberts. Network Propaganda: Manipulation, Disinformation, and Radicalization in American Politics. Oxford University Press, New York, 2018. ISBN 978-0-19-092362-4. doi: 10.1093/oso/9780190923624.001.0001. URL https://oxford.universitypressscholarship.com/10.1093/oso/9780190923624.001.0001/oso-9780190923624.
- Hasan et al. [2018] Rajibul Hasan, Ashish Jha, and Yi Liu. Excessive Use of Online Video Streaming Services: Impact of Recommender System Use, Psychological Factors, and Motives. Computers in Human Behavior, 80, March 2018. doi: 10.1016/j.chb.2017.11.020.
- Andreassen [2015] Cecilie Schou Andreassen. Online Social Network Site Addiction: A Comprehensive Review. Current Addiction Reports, 2(2):175–184, June 2015. ISSN 2196-2952. doi: 10.1007/s40429-015-0056-9. URL https://doi.org/10.1007/s40429-015-0056-9.
- Stöcker [2020] Christian Stöcker. How Facebook and Google Accidentally Created a Perfect Ecosystem for Targeted Disinformation. pages 129–149. January 2020. ISBN 978-3-030-39626-8. doi: 10.1007/978-3-030-39627-5_11.
- Goodhart [1981] Charles Goodhart. Problems of Monetary Management: The UK Experience. 1981. URL https://books.google.ch/books?id=OMe6UQxu1KcC&pg=PA111&redir_esc=y#v=onepage&q&f=false.
- Barocas et al. [2019] Solon Barocas, Moritz Hardt, and Arvind Narayanan. Fairness and Machine Learning. fairmlbook.org, 2019. http://www.fairmlbook.org.
- Castells et al. [2015] Pablo Castells, Neil J. Hurley, and Saul Vargas. Novelty and Diversity in Recommender Systems. In Francesco Ricci, Lior Rokach, and Bracha Shapira, editors, Recommender Systems Handbook, pages 881–918. Springer US, Boston, MA, 2015. ISBN 978-1-4899-7637-6. doi: 10.1007/978-1-4899-7637-6_26. URL https://doi.org/10.1007/978-1-4899-7637-6_26.
- Hadfield-Menell and Hadfield [2019] Dylan Hadfield-Menell and Gillian K. Hadfield. Incomplete Contracting and AI Alignment. In Proceedings of the 2019 AAAI/ACM Conference on AI, Ethics, and Society, AIES ’19, pages 417–422, New York, NY, USA, January 2019. Association for Computing Machinery. ISBN 978-1-4503-6324-2. doi: 10.1145/3306618.3314250. URL https://doi.org/10.1145/3306618.3314250.
- Milano et al. [2020] Silvia Milano, Mariarosaria Taddeo, and Luciano Floridi. Recommender systems and their ethical challenges. AI & SOCIETY, February 2020. ISSN 1435-5655. doi: 10.1007/s00146-020-00950-y. URL https://doi.org/10.1007/s00146-020-00950-y.
- Burr et al. [2018a] Christopher Burr, Nello Cristianini, and James Ladyman. An Analysis of the Interaction Between Intelligent Software Agents and Human Users. Minds and Machines, 28(4):735–774, December 2018a. ISSN 1572-8641. doi: 10.1007/s11023-018-9479-0. URL https://doi.org/10.1007/s11023-018-9479-0.
- Santos et al. [2006a] Francisco C Santos, Jorge M Pacheco, and Tom Lenaerts. Cooperation Prevails When Individuals Adjust Their Social Ties. PLoS Computational Biology, 2(10), October 2006a. ISSN 1553-734X. doi: 10.1371/journal.pcbi.0020140. URL https://www.ncbi.nlm.nih.gov/pmc/articles/PMC1617133/.
- Traulsen et al. [2006] Arne Traulsen, Martin A. Nowak, and Jorge M. Pacheco. Stochastic Dynamics of Invasion and Fixation. Physical Review E, 74(1):011909, July 2006. ISSN 1539-3755, 1550-2376. doi: 10.1103/PhysRevE.74.011909. URL http://arxiv.org/abs/q-bio/0609020.
- Santos et al. [2006b] Felipe Santos, J Pacheco, and Tom Lenaerts. Evolutionary Dynamics of Social Dilemmas in Structured Heterogeneous Populations. Proceedings of the National Academy of Sciences of the United States of America, 103:3490–4, March 2006b. doi: 10.1073/pnas.0508201103.
- Kossinets and Watts [2006] Gueorgi Kossinets and Duncan J. Watts. Empirical Analysis of an Evolving Social Network. Science, 311(5757):88–90, January 2006. ISSN 0036-8075, 1095-9203. doi: 10.1126/science.1116869. URL https://science.sciencemag.org/content/311/5757/88. Publisher: American Association for the Advancement of Science Section: Report.
- Zoetekouw [2019] K.F.A. Zoetekouw. A critical analysis of the negative consequences caused by recommender systems used on social media platforms. July 2019. URL http://essay.utwente.nl/78500.
- Burr et al. [2018b] Christopher Burr, Nello Cristianini, and James Ladyman. An Analysis of the Interaction Between Intelligent Software Agents and Human Users. Minds and Machines, 28(4):735–774, December 2018b. ISSN 1572-8641. doi: 10.1007/s11023-018-9479-0. URL https://doi.org/10.1007/s11023-018-9479-0.
- Stray et al. [2021] Jonathan Stray, Ivan Vendrov, Jeremy Nixon, Steven Adler, and Dylan Hadfield-Menell. What are you optimizing for? Aligning Recommender Systems with Human Values. arXiv:2107.10939 [cs], July 2021. URL http://arxiv.org/abs/2107.10939. arXiv: 2107.10939.
- Yang et al. [2013] Zhihu Yang, Zhi Li, Te Wu, and Long Wang. Role of recommendation in spatial public goods games. Physica A: Statistical Mechanics and its Applications, 392(9):2038–2045, May 2013. ISSN 03784371. doi: 10.1016/j.physa.2012.11.024. URL https://linkinghub.elsevier.com/retrieve/pii/S0378437112009892.
- Darvariu et al. [2021] Victor-Alexandru Darvariu, Stephen Hailes, and Mirco Musolesi. Goal-directed graph construction using reinforcement learning. Proceedings of the Royal Society A: Mathematical, Physical and Engineering Sciences, 477(2254):20210168, October 2021. ISSN 1364-5021, 1471-2946. doi: 10.1098/rspa.2021.0168. URL http://arxiv.org/abs/2001.11279. arXiv: 2001.11279.
- Meirom et al. [2021] Eli A. Meirom, Haggai Maron, Shie Mannor, and Gal Chechik. Controlling Graph Dynamics with Reinforcement Learning and Graph Neural Networks. arXiv:2010.05313 [cs], July 2021. URL http://arxiv.org/abs/2010.05313. arXiv: 2010.05313.
- Schulman et al. [2017] John Schulman, Filip Wolski, Prafulla Dhariwal, Alec Radford, and Oleg Klimov. Proximal Policy Optimization Algorithms. arXiv:1707.06347 [cs], August 2017. URL http://arxiv.org/abs/1707.06347. arXiv: 1707.06347.
- Anastassacos et al. [2020] Nicolas Anastassacos, Stephen Hailes, and Mirco Musolesi. Partner Selection for the Emergence of Cooperation in Multi-Agent Systems Using Reinforcement Learning. Proceedings of the AAAI Conference on Artificial Intelligence, 34:7047–7054, April 2020. doi: 10.1609/aaai.v34i05.6190.
- Kurland [2019] Moshe Tennenholtz Kurland, Oren. Rethinking Search Engines and Recommendation Systems: A Game Theoretic Perspective, December 2019. URL https://cacm.acm.org/magazines/2019/12/241056-rethinking-search-engines-and-recommendation-systems/fulltext.
- Izsak et al. [2014] Peter Izsak, Fiana Raiber, Oren Kurland, and Moshe Tennenholtz. The search duel: a response to a strong ranker. In Proceedings of the 37th international ACM SIGIR conference on Research & development in information retrieval, SIGIR ’14, pages 919–922, Gold Coast, Queensland, Australia, July 2014. Association for Computing Machinery. ISBN 978-1-4503-2257-7. doi: 10.1145/2600428.2609474. URL https://doi.org/10.1145/2600428.2609474.
- Babaioff et al. [2015] Moshe Babaioff, Moran Feldman, and Moshe Tennenholtz. Mechanism Design with Strategic Mediators. ACM Transactions on Economics and Computation, 4, January 2015. doi: 10.1145/2841227.
- Leibo et al. [2017] Joel Z. Leibo, Vinicius Zambaldi, Marc Lanctot, Janusz Marecki, and Thore Graepel. Multi-agent Reinforcement Learning in Sequential Social Dilemmas. In Proceedings of the 16th Conference on Autonomous Agents and MultiAgent Systems, AAMAS ’17, pages 464–473, Richland, SC, May 2017. International Foundation for Autonomous Agents and Multiagent Systems.
- Rozemberczki et al. [2021] Benedek Rozemberczki, Paul Scherer, Yixuan He, George Panagopoulos, Alexander Riedel, Maria Astefanoaei, Oliver Kiss, Ferenc Beres, Guzmán López, Nicolas Collignon, and Rik Sarkar. PyTorch Geometric Temporal: Spatiotemporal Signal Processing with Neural Machine Learning Models. arXiv:2104.07788 [cs], June 2021. URL http://arxiv.org/abs/2104.07788. arXiv: 2104.07788.