Constraining Sterile Neutrino Dark Matter in the Milky Way Halo with Swift-XRT
Abstract
We present a search for sterile neutrino dark matter decay signals in the Milky Way’s dark matter halo by considering the entirety of the Swift-XRT data archive. After filtering the raw archive, we analyze a 77 Ms data set containing the full field of view, as well as a 41 Ms data set with point-sources excised using the Swift-XRT Point Source catalog. We report non-detections of emission lines across the 3–6 keV continuum in both data sets, including at and around 3.5 keV. The point-sources excised data set is found to have higher sensitivity to faint dark matter decay signals due to its freedom from point-source contamination and is thus used to set constraints. Non-detections across the total data set’s continuum are used to constrain the sterile neutrino dark matter parameter space, marginally strengthening existing X-ray constraints. Non-detections at 3.5 keV in data subsets grouped by angular distance from the galactic center are used to constrain the 3.5 keV line’s galactic intensity profile, providing the strongest constraints to date across 1/4 of the galaxy.
1 Introduction
The sterile neutrino is a popular dark matter (DM) candidate, as it is a natural extension to the Standard Model and can be tested using current X-ray observatories (see, e.g., Dodelson & Widrow 1994; Abazajian et al. 2001a; Abazajian et al. 2001b; Laine & Shaposhnikov 2008; Boyarsky et al. 2019). This testability is due to the particle’s decay mechanism, dictated by the mixing angle sin, which releases a photon with (where is the sterile neutrino mass; Pal & Wolfenstein 1982) and is therefore within X-ray bands for keV.
Sterile neutrino DM garnered heavy attention when Bulbul et al. [2014] observed an unidentified emission line at 3.5 keV in various galaxy clusters, found to be consistent with 7 keV sterile neutrino decay. Afterwards, the 3.5 keV line was repeatedly detected in several DM-dominated objects such as clusters, M31, and the galactic center (GC) using multiple X-ray telescopes (Boyarsky et al. 2014; Wik et al. 2014; Boyarsky et al. 2015; Urban et al. 2015; Neronov et al. 2016a; Franse et al. 2016; Cappelluti et al. 2018; Hofmann & Wegg 2019). Other X-ray works did not detect unidentified emission at 3.5 keV or any other energy, setting constraints on the sin vs. parameter space (Tamura et al. 2015; Ng et al. 2015; Bulbul et al. 2016; Ruchayskiy et al. 2016; Hitomi Collaboration et al. 2017; Perez et al. 2017; Dessert et al. 2020; Bhargava et al. 2020; Sicilian et al. 2020; Silich et al. 2021; Foster et al. 2021; Roach et al. 2022). In particular, the keV-mass parameter space has been most strongly constrained by works that used large-scale blank-sky data sets from major X-ray observatories including Chandra [Sicilian et al., 2020], [Dessert et al., 2020, Foster et al., 2021], and NuSTAR (Neronov et al. 2016a; Roach et al. 2020; Roach et al. 2022), which make use of the ubiquitous, DM-dominated Milky Way Halo (MWH).
Here, we perform a similar MWH analysis using Swift-XRT, an instrument chosen for . First, its archive is vast and yet-untapped for MWH sterile neutrino constraints, and thus we sought to continue to push current technology to its limits by mining the archive of another major telescope. Secondly, despite its relatively low grasp, Swift’s low-Earth orbit affords it a substantially lower and more stable non-X-ray particle background (NXB) than Chandra or , potentially giving it improved sensitivity to a sterile neutrino DM signal in the 5–10 keV range, where X-ray constraints have typically been dominated by Chandra and .
In this work, we consider the entirety of the Swift-XRT data archive up to 2021. This unfiltered data set contains 188 Ms of exposure time and, due to the short average exposure of Swift observations, consists of 2 orders of magnitude more observations than Sicilian et al. [2020]’s 51 Ms Chandra data set, thus giving nearly all-sky coverage. We hence aim to use Swift’s low NXB, the large data set, and its wide spatial distribution to constrain both the sterile neutrino DM parameter space and the galactic intensity profile of the 3.5 keV line. Our methodology closely follows that of Sicilian et al. [2020], which is thoroughly described in that work and summarized here.
2 Data Selection and Reduction
To minimize contamination from extended sources, we excluded observations pointed through the galactic plane () or within of major known extended sources, including the Crab Nebula and any object in either the ROSAT galaxy cluster catalog (ROSGALCLUS; Vikhlinin et al. 1998) or Chandra supernova remnant catalog111https://hea-www.harvard.edu/ChandraSNR/. After applying these filters, the data set contained 77 Ms of exposure time.
Upon applying standard Swift-XRT data reduction procedures222https://swift.gsfc.nasa.gov/analysis/xrt_swguide_v1_2.pdf, we replicated Moretti et al. [2009]’s methodology to extract both field of view (FOV) and NXB spectra from individual observations. In particular, the NXB was extracted from regions of the CCD not exposed during observations, while the FOV spectrum was taken from Moretti et al. [2009]’s conservatively-defined central 0.054 deg2 region to avoid contamination from out-of-time-event calibration.
To produce a data set with minimal point-source contamination, for any observation considered by the Swift-XRT Point Source catalog (2SXPS; Evans et al. 2020), we excised all documented sources in that observation . These point-sources excised (PSE) observations form a 41 Ms data subset. Excising point-sources inadvertently removes DM along the line-of-sight (LOS), and the lack of coverage offered by 2SXPS reduced our total exposure time by nearly 50%, so therefore, like Sicilian et al. [2020], we analyzed both the 41 Ms PSE and the full 77 Ms FOV data sets.
We then binned the total PSE and FOV data sets by angular distance from the galactic center () to study the 3.5 keV line’s intensity profile as it compares to Navarro-Frenk-White (NFW; Navarro et al. 1997) predictions and prior measurements. Bins were determined by emulating Sicilian et al. [2020]’s estimation of the minimum Chandra exposure time needed to detect the 3.5 keV line as a function of , which we modified to accommodate Swift. Sicilian et al. [2020]’s line profile constraints, while strong, were difficult to interpret near the GC, where NFW slope is steep, as that work was grouped into only 4 bins, with the innermost bin spanning 10–74o. Therefore, although Swift’s lower NXB relative to Chandra’s already relaxes bin exposure thresholds, we further amplified this by binning the data sets based on their exposure time after removing the galactic plane but before removing any other observations with extended sources, rather than their fully-filtered exposures. As a result, we may have sacrificed some strength in our profile constraints, but we were nonetheless able to greatly improve resolution, with the PSE and FOV data sets yielding 9 and 13 bins, respectively.
Spectra were stacked using mathpha (from FTOOLS) to produce master FOV, PSE, and NXB spectra, as well as to produce the corresponding sets of -binned spectra. Exposure-weighted response files were combined using FTOOLS addrmf and addarf. NXB spectra were renormalized to match each respective data set’s total counts in channels 725, based on NXB-to-total spectral counts ratios computed in Moretti et al. [2009].
3 Spectral Analysis
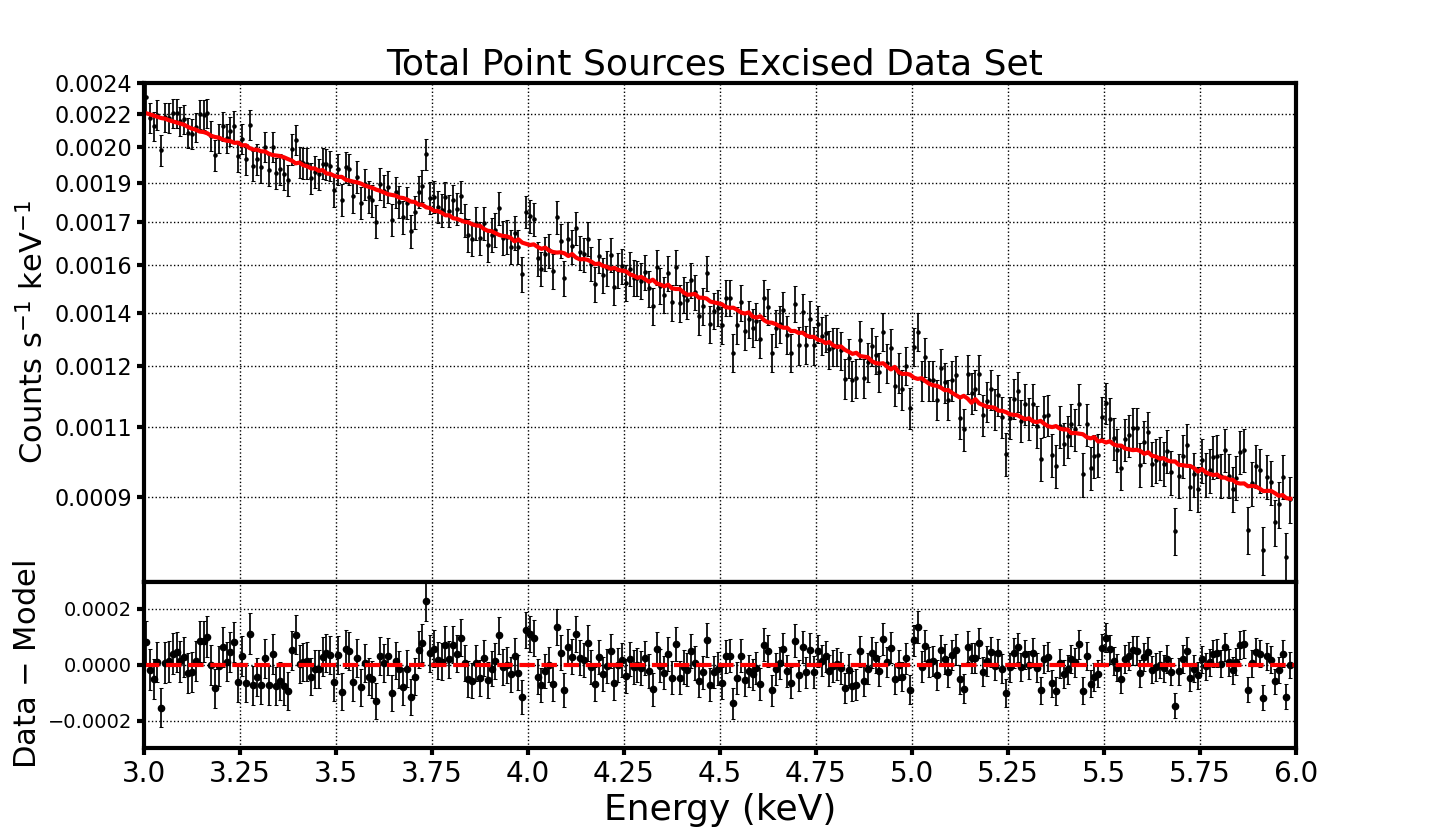
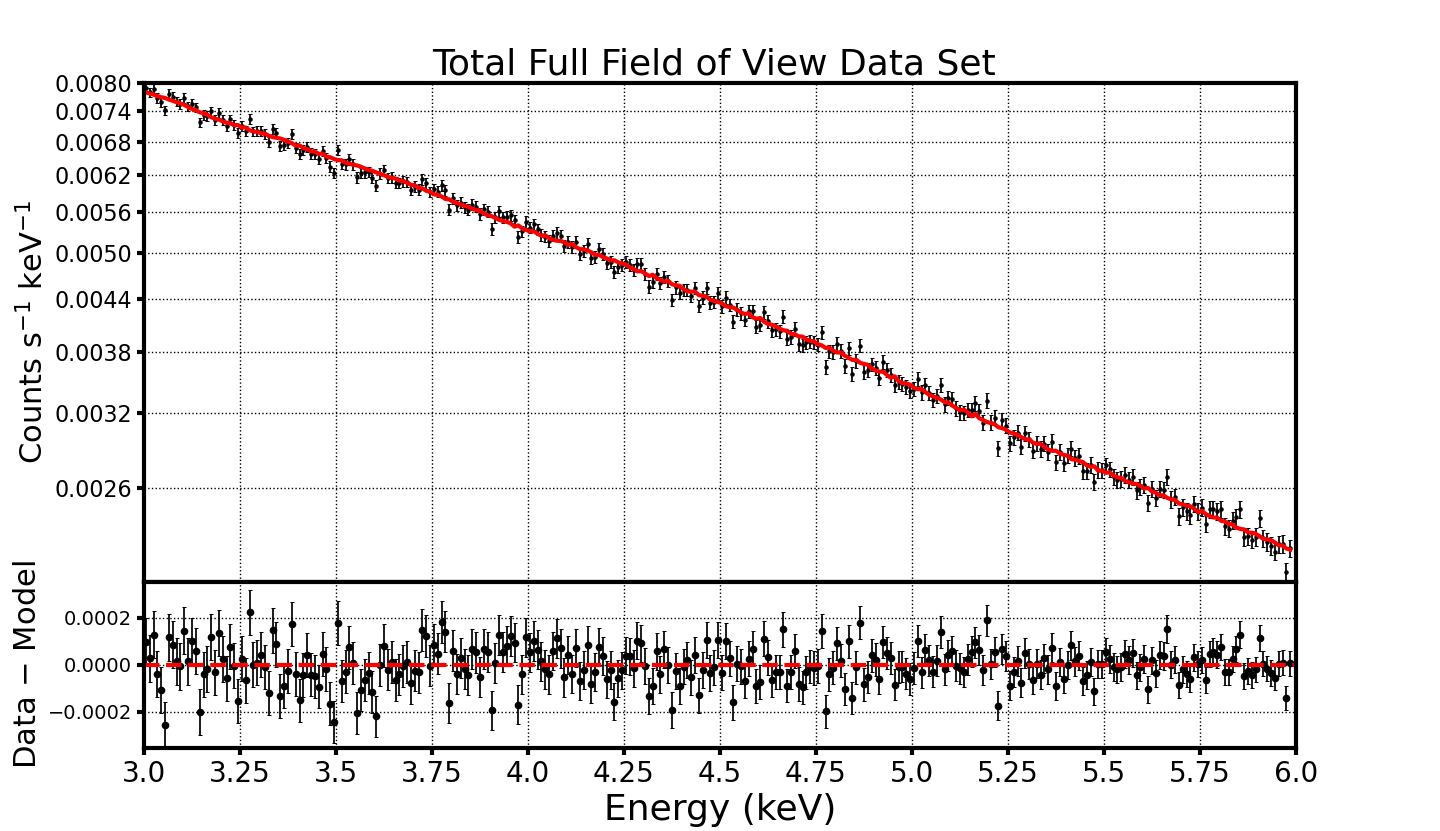
Spectra were modeled using PyXspec (XSPEC 12.12.0) on the interval 3.0–6.0 keV, chosen to include 3.5 keV while avoiding known emission features [Moretti et al., 2009] and soft galactic diffuse emission, as well as giving more coverage than Sicilian et al. [2020]. As shown in Moretti et al. [2009], the total blank-sky continuum in this band consists of 34% cosmic X-ray background (CXB), 16% off-axis stray-light (SL) due to Swift’s lack of Chandra/XMM-like baffles, and 51% NXB. Spectra for the total PSE and FOV data sets are plotted in Figure 1 along with best-fit models produced through the procedure described below.
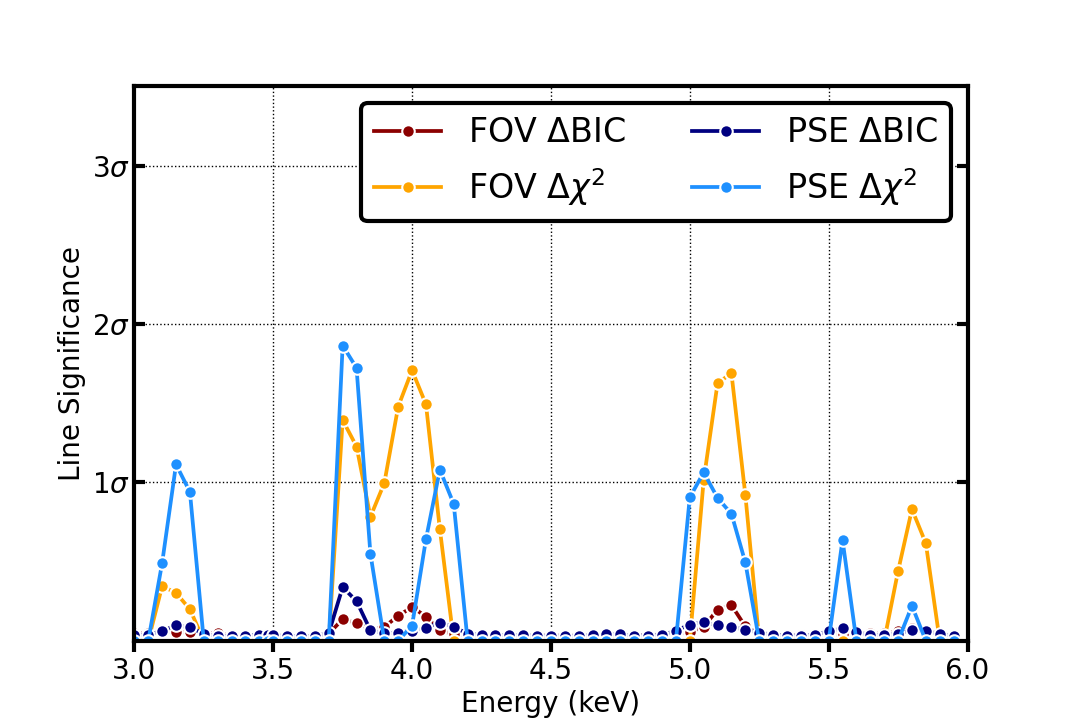
The astrophysical continuum was modeled using a broken power law folded through both the ARF and RMF which, like Moretti et al. [2009]’s CXB power law, is unabsorbed due to the low across fields considered [Dickey & Lockman, 1990] and its resulting lack of absorption in our model’s energy band. The NXB model was a broken power law folded only through the RMF, as the NXB arises strictly from particles that do not pass through Swift-XRT’s mirrors (Pagani et al. 2007; ). Visual inspection of the spectra revealed possible emission features at 3.75 and 5.88 keV, and our band also includes energies of known features at 3.3 and 3.68 keV modeled in Sicilian et al. [2020] whose origins–whether astrophysical or instrumental–are unclear. However, we can conclude from preliminary CSTAT [Cash, 1979] optimization fits that, for both the FOV and PSE data sets, there are no significant features at these energies in either the astrophysical or NXB spectra, as we found BIC-obtained significances approaching zero for those features, while no -computed significance exceeded 2. These results were consistent regardless of whether line width was fixed or left free. Therefore, we do not include any such features in our final models.
Best-fit values for the reported models (Table 1) were obtained using Goodman-Weare MCMC fitting (with CSTAT as the fit statistic) to generate posterior parameter distributions. The resulting best-fit models for the total FOV and PSE spectra have reduced () of 1.1, and all -binned models have 1.1–1.2, indicating the models are good fits.
| FOV | PSE | |
|---|---|---|
| 1.84 | 2.70 | |
| (keV) | 3.98 | 3.96 |
| 1.21 | -0.10 | |
| -3.30 | -3.85 | |
| 0.66 | 0.64 | |
| (keV) | 5.31 | 5.23 |
| -0.62 | -0.38 | |
| -2.36 | -2.45 | |
| 1.148 | 1.055 |
3.1 The 3.5 keV Line
For sterile neutrino constraints, we first focused on the known 3.5 keV feature following Sicilian et al. [2020]’s procedure. We added an emission line with free to vary from 3.4–3.6 keV, by the instrument response, then performed another MCMC fit, the posteriors of which revealed that is generally poorly-constrained, with no convergence in the FOV line posterior and mild convergence in PSE line . Both had the same best-fit keV and similar best-fit line fluxes log -8. We isolated a feature with frozen keV and performed an MCMC fit (with walkers initialized for log between -8 and -7 to match the -free best-fit ’s order of magnitude, then left free to vary across all values). Using the resulting best-fit , we assessed the significance of the feature using both and BIC, finding it to approach zero for the total FOV and PSE models. The same results were found when repeating the procedure with Sicilian et al. [2020]’s frozen keV. We therefore conclude that this is a non-detection of the 3.5 keV line.
We applied this method to all bins in both the FOV and PSE data sets, adopting keV for our frozen line as in Sicilian et al. [2020], due to its use in that work, consistency with past detection energies, and proximity to the center of the allowed interval when we left line free to vary due to the sporadic, inconsistent shapes and nature of convergences of the resulting posterior distributions. The 3.51 keV feature yielded near-zero BIC-computed significances for all bins in both the PSE and FOV data sets and near-zero significances in all PSE bins, as well as in nearly all FOV bins, with no FOV bin exceeding 1. These results thus further confirm our conclusion that we did not detect a 3.5 keV line.
3.2 The Continuum
To search for faint emission lines at other model energies, we performed the same process above across the remainder of the continuum. From 3–6 keV, we increased the frozen line in steps of 50 eV (chosen to be smaller than Swift’s energy resolution and hence protect against skipping over a genuine feature) and used the MCMC-computed best-fit to evaluate significance. In Figure 2, we have plotted line significance computed using BIC and at all energies in both the FOV and PSE data sets. As shown, all BIC-obtained significances were 1. For nearly all energies in both models, significance was also 1, and in all remaining cases was 2. Therefore, we conclude that we did not detect any emission features consistent with sterile neutrino DM.
The 3 upper-limit on the line flux at each energy is computed as the 0.997 quantile from that energy’s MCMC posterior distribution, representing the 99.7% confidence interval above . We computed these limits for both the total FOV and PSE data sets, providing two sets of flux upper-limits at all energies considered across the continuum, including 3.48 and 3.51 keV. This method was also used to set upper-limits on the 3.5 keV line flux for the 9 PSE bins and 13 FOV bins.
We compared our continuum constraints to a series of simulations to ensure the robustness of our upper-limit calculations, particularly to verify that the limits are not misleadingly low, which could conceivably occur if the MCMC walkers reach low values early in the fit and remain localized throughout. The simulation procedure follows that of Sicilian et al. [2020], which repeatedly simulated an emission feature at each energy to compute the maximum value that would have yielded a significance 3 and hence managed to avoid detection. We computed these constraints for both the FOV and PSE spectra, then compared them to those obtained using MCMC. In both cases, the upper-limits generated by the simulations were more aggressive than the MCMC constraints by 24%, decisively confirming the validity of our results. Thus, we can now use our line flux upper-limits to constrain the 3.5 keV line’s profile and compute sterile neutrino parameter space constraints.
4 Results and Discussion
Despite the FOV’s exposure time advantage and PSE’s loss of DM along the LOS due to point-source removal, the PSE’s line flux upper-limits for energies across the continuum are 17% lower on average than the FOV’s flux limits, and its bins yield 29% more stringent profile constraints than those of the FOV. This is due to the higher sensitivity afforded to the PSE data by eliminating baryonic contamination from point sources and therefore minimizing continuum flux. For a faint DM signal, even when accounting for PSE’s LOS losses, we estimate the PSE’s signal-to-noise ratio (S/N) to be 22% greater than that of the FOV data. It follows that the PSE data set should yield similarly more stringent constraints, which is highly consistent with our results. Therefore, like Sicilian et al. [2020], we have chosen to employ the PSE data set to determine DM constraints.
4.1 3.5 keV Line Intensity Profile Constraints
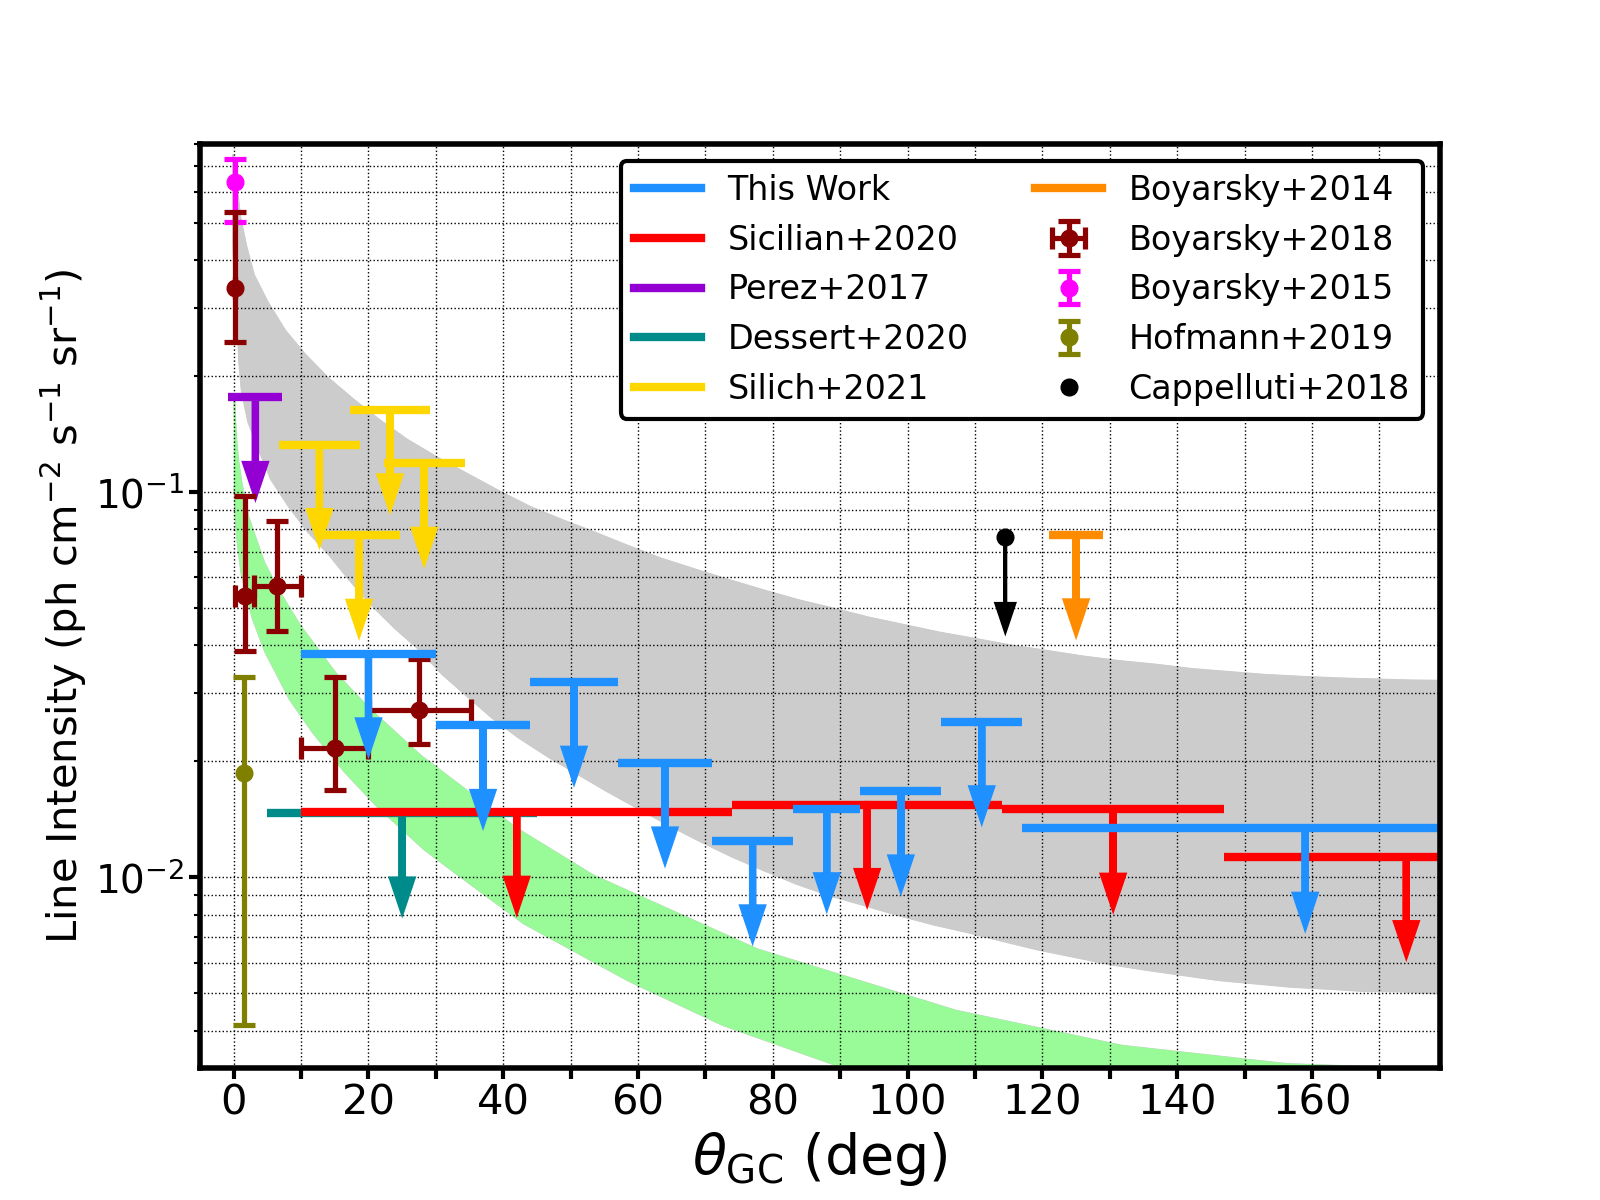
Using our 3.5 keV line flux upper-limits in the bins, we have computed and plotted the intensity upper-limit profile. Existing constraints and prior detections are shown in Figure 3, with the exception of Neronov et al. [2016a]’s NuSTAR detections, as their decaying DM origins were ruled out by Sicilian et al. [2020]’s profile constraints. Two example NFW-predicted profiles are shown for reference, computed by Cappelluti et al. [2018] and Boyarsky et al. [2018] based on different sets of NFW parameters and normalized by Boyarsky et al. [2015]’s GC detection. As shown in Figure 3, our constraints on the intensity profile are the strongest to date across 1/4 of the galaxy, producing the most stringent limits in the regions 71–93o and 117–147o, with Sicilian et al. [2020]’s generally remaining the lowest everywhere else 10o.
As also illustrated by Figure 3, the higher resolution relative to Sicilian et al. [2020] allows a more useful interpretation near the GC than the stronger Sicilian et al. [2020] upper-limit. Similarly, the Dessert et al. [2020] XMM MWH constraint (shown here with Sicilian et al. 2020’s adjustment based on Abazajian 2020, Boyarsky et al. 2020, and Dessert et al. 2020a) is nearly identical to Sicilian et al. [2020]’s in that region, but has 1/2 the Swift constraints’ resolution. The Swift constraints improve upon Silich et al. [2021]’s HaloSat limits with our 10–30o bin’s combination of strength and resolution relative to those of Silich et al. [2021]’s results.
However, by the same token, the Dessert et al. [2020] constraint .
4.2 Parameter Space Constraints
Due to the direct proportionality between sin and the sterile neutrino decay rate for a given , namely
| (1) |
where is the decay rate [Pal & Wolfenstein, 1982], and the predicted flux of decaying DM emission () from a given mass of DM in the FOV () a distance from the detector, given by
| (2) |
[Neronov & Malyshev, 2016b], determining sin constraints from line flux upper-limits is dependent on the distribution of DM observed within the data set. The constraints, then, must be obtained by integrating the DM density profile over the LOS and FOV and are therefore model-dependent on the profile function and its parameter values. As in Sicilian et al. [2020], when computing the continuum constraints, we performed the calculation twice–first using fairly aggressive NFW parameters based on the empirical Nesti & Salucci [2013] values (scale radius kpc; local DM density GeV cm-3) and again using conservative parameters detailed in Abazajian [2020] ( kpc; GeV cm-3).
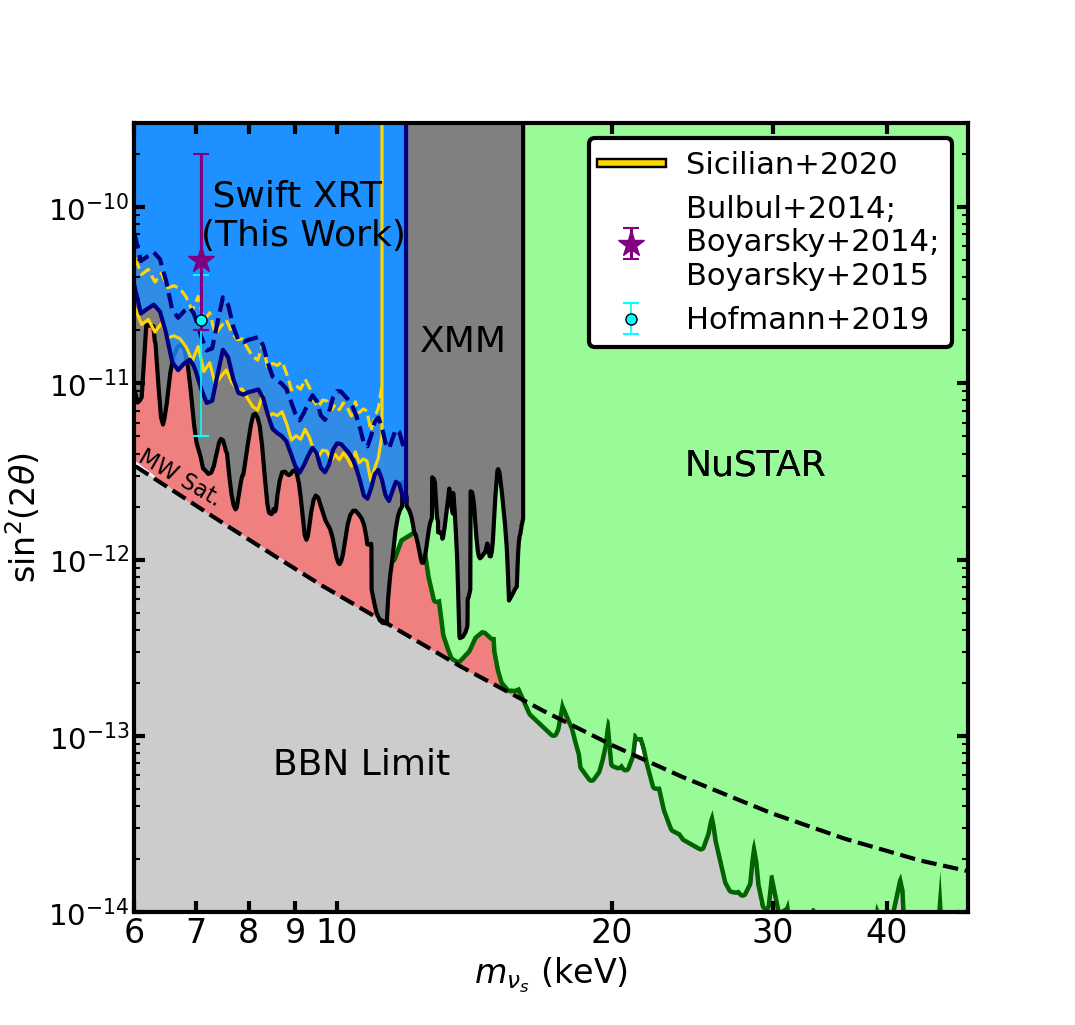
The resulting Swift constraints on sin are plotted in Figure 4 along with other existing limits on the parameter space. Like Sicilian et al. [2020], we expect the true constraint to lie somewhere between the bounds generated by the different NFW parameter choices, so we have plotted the conservative curve as a dashed line, separated from the more aggressive curve by a translucent uncertainty region. As mentioned when computing continuum line flux upper-limits, unlike in Sicilian et al. [2020] these constraints were designed to include coverage for the 3.5 keV line, eliminating the need for a separate point on the plot.
As Figure 4 shows, despite the Swift exposure being 20% less than Sicilian et al. [2020]’s 51 Ms of Chandra exposure, the constraints are highly consistent and in fact our Swift constraints are slightly stronger overall, with the conservative limits 4% more stringent than the conservative Chandra constraints and the aggressive limits 1% more stringent than the aggressive Chandra constraints. Notably, at keV, our conservative constraints are just outside the collective 1 error range of the Bulbul et al. [2014], Boyarsky et al. [2014], and Boyarsky et al. [2015] detections, providing evidence against the 3.5 keV line’s DM interpretation. However, even our aggressive constraints remain consistent with Hofmann & Wegg [2019]’s detection, which means our results do not entirely eliminate the 3.5 keV line’s DM interpretation, though Foster et al. [2021]’s results (which are stronger than ours at keV) are outside even the Hofmann & Wegg [2019] 1 error range. While the Foster et al. [2021]’s XMM MWH constraints are also more stringent overall than ours, towards the aggressive end of our limits we were able to match the constraints at several values and improve upon ’s around 6.7 and 12 keV.
Therefore, the edge of the overall X-ray limits is now formed by constraints from Swift in this work, XMM in Foster et al. [2021], and NuSTAR in a combination of Neronov et al. [2016a], Perez et al. [2017], Ng et al. [2019], Roach et al. [2020], and Roach et al. [2022]. Together, these X-ray constraints have eliminated most of the parameter space that remains above the big bang nucleosynthesis (BBN) lower limits, which are theoretical limits based on lepton asymmetry in the early Universe (see Dolgov et al. 2002; Serpico & Raffelt 2005; Laine & Shaposhnikov 2008; Boyarsky et al. 2009; Venumadhav et al. 2016; Roach et al. 2020). According to Dekker et al. [2021b], this small remainder of the parameter has been ruled out nearly entirely up to keV based on that work’s study of small-scale structure formation around the MWH, though those results are dependent on systematics such as MWH mass, NFW parameters, and the extended Press-Schechter formalism (EPS; Schneider 2015; Cherry & Horiuchi 2017).
4.3 Closing Thoughts
We have found no evidence of sterile neutrino DM in the Swift-XRT MWH observations, and have used our non-detections to constrain the 3.5 keV line’s galactic intensity profile, as well as the sterile neutrino DM sin vs. parameter space. Our 3.5 keV line profile upper-limits are the strongest to date across 1/4 of the galaxy and our parameter space limits marginally improve upon existing X-ray constraints. Swift has now joined Chandra, , and NuSTAR on the list of major X-ray observatories whose vast archives have been harnessed in the search for decaying DM emission lines in the MWH. Since the constraints obtained from these observatories are fairly consistent, it appears we have collectively pushed existing technology and data to their limits, suggesting recent or future X-ray missions such as XRISM will be necessary to resolve lingering uncertainty on this topic. This sentiment is evidenced by Dekker et al. [2021a]’s simulations indicating eROSITA will achieve the required sensitivity to do so. Until then, the door will remain nearly closed, yet undeniably ajar, on sterile neutrino dark matter.
References
- Abazajian et al. [2001a] Abazajian, K., Fuller, G. M., & Patel, M. 2001, Phys. Rev. D, 64, 023501. doi:10.1103/PhysRevD.64.023501
- Abazajian et al. [2001b] Abazajian, K., Fuller, G. M., & Tucker, W. H. 2001, ApJ, 562, 593. doi:10.1086/323867
- Abazajian [2020] Abazajian, K. N. 2020, arXiv:2004.06170
- Arnaud [1996] Arnaud, K. A. 1996, Astronomical Data Analysis Software and Systems V, 101, 17
- Arnaud [2016] Arnaud, K. A. 2016, AAS/High Energy Astrophysics Division #15
- Astropy Collaboration et al. [2013] Astropy Collaboration, Robitaille, T. P., Tollerud, E. J., et al. 2013, A&A, 558, A33. doi:10.1051/0004-6361/201322068
- Astropy Collaboration et al. [2018] Astropy Collaboration, Price-Whelan, A. M., Sipőcz, B. M., et al. 2018, AJ, 156, 123. doi:10.3847/1538-3881/aabc4f
- Bhargava et al. [2020] Bhargava, S., Giles, P. A., Romer, A. K., et al. 2020, MNRAS, 497, 656. doi:10.1093/mnras/staa1829
- Boyarsky et al. [2009] Boyarsky, A., Ruchayskiy, O., & Shaposhnikov, M. 2009, Annual Review of Nuclear and Particle Science, 59, 191. doi:10.1146/annurev.nucl.010909.083654
- Boyarsky et al. [2014] Boyarsky, A., Ruchayskiy, O., Iakubovskyi, D., et al. 2014, Phys. Rev. Lett., 113, 251301. doi:10.1103/PhysRevLett.113.251301
- Boyarsky et al. [2015] Boyarsky, A., Franse, J., Iakubovskyi, D., et al. 2015, Phys. Rev. Lett., 115, 161301. doi:10.1103/PhysRevLett.115.161301
- Boyarsky et al. [2018] Boyarsky, A., Iakubovskyi, D., Ruchayskiy, O., et al. 2018, arXiv:1812.10488
- Boyarsky et al. [2019] Boyarsky, A., Drewes, M., Lasserre, T., et al. 2019, Progress in Particle and Nuclear Physics, 104, 1. doi:10.1016/j.ppnp.2018.07.004
- Boyarsky et al. [2020] Boyarsky, A., Malyshev, D., Ruchayskiy, O., et al. 2020, arXiv:2004.06601
- Bulbul et al. [2014] Bulbul, E., Markevitch, M., Foster, A., et al. 2014, ApJ, 789, 13. doi:10.1088/0004-637X/789/1/13
- Bulbul et al. [2016] Bulbul, E., Markevitch, M., Foster, A., et al. 2016, ApJ, 831, 55. doi:10.3847/0004-637X/831/1/55
- Bulbul et al. [2020] Bulbul, E., Kraft, R., Nulsen, P., et al. 2020, ApJ, 891, 13. doi:10.3847/1538-4357/ab698a
- Cappelluti et al. [2018] Cappelluti, N., Bulbul, E., Foster, A., et al. 2018, ApJ, 854, 179. doi:10.3847/1538-4357/aaaa68
- Cash [1979] Cash, W. 1979, ApJ, 228, 939. doi:10.1086/156922
- Cherry & Horiuchi [2017] Cherry, J. F. & Horiuchi, S. 2017, Phys. Rev. D, 95, 083015. doi:10.1103/PhysRevD.95.083015
- Cline et al. [2014] Cline, J. M., Liu, Z., Moore, G. D., et al. 2014, Phys. Rev. D, 89, 121302. doi:10.1103/PhysRevD.89.121302
- Cline & Frey [2014a] Cline, J. M. & Frey, A. R. 2014, J. Cosmology Astropart. Phys, 2014, 013. doi:10.1088/1475-7516/2014/10/013
- Cline & Frey [2014b] Cline, J. M. & Frey, A. R. 2014, Phys. Rev. D, 90, 123537. doi:10.1103/PhysRevD.90.123537
- Dekker et al. [2021a] Dekker, A., Peerbooms, E., Zimmer, F., et al. 2021, Phys. Rev. D, 104, 023021. doi:10.1103/PhysRevD.104.023021
- Dekker et al. [2021b] Dekker, A., Ando, S., Correa, C. A., et al. 2021, arXiv:2111.13137
- Dessert et al. [2020] Dessert, C., Rodd, N. L., & Safdi, B. R. 2020, Science, 367, 1465. doi:10.1126/science.aaw3772
- Dessert et al. [2020a] Dessert, C., Rodd, N. L., & Safdi, B. R. 2020, Physics of the Dark Universe, 30, 100656. doi:10.1016/j.dark.2020.100656
- Dickey & Lockman [1990] Dickey, J. M. & Lockman, F. J. 1990, ARA&A, 28, 215. doi:10.1146/annurev.aa.28.090190.001243
- Dolgov et al. [2002] Dolgov, A. D., Hansen, S. H., Pastor, S., et al. 2002, Nuclear Physics B, 632, 363. doi:10.1016/S0550-3213(02)00274-2
- Dodelson & Widrow [1994] Dodelson, S. & Widrow, L. M. 1994, Phys. Rev. Lett., 72, 17. doi:10.1103/PhysRevLett.72.17
- Evans et al. [2020] Evans, P. A., Page, K. L., Osborne, J. P., et al. 2020, ApJS, 247, 54. doi:10.3847/1538-4365/ab7db9
- Finkbeiner & Weiner [2016] Finkbeiner, D. P. & Weiner, N. 2016, Phys. Rev. D, 94, 083002. doi:10.1103/PhysRevD.94.083002
- Franse et al. [2016] Franse, J., Bulbul, E., Foster, A., et al. 2016, ApJ, 829, 124. doi:10.3847/0004-637X/829/2/124
- Foreman-Mackey [2016] Foreman-Mackey, D. 2016, The Journal of Open Source Software, 1, 24. doi:10.21105/joss.00024
- Foster et al. [2021] Foster, J. W., Kongsore, M., Dessert, C., et al. 2021, Phys. Rev. Lett., 127, 051101. doi:10.1103/PhysRevLett.127.051101
- Hitomi Collaboration et al. [2017] Hitomi Collaboration, Aharonian, F., Akamatsu, H., et al. 2017, Nature, 551, 478. doi:10.1038/nature24301
- Hofmann & Wegg [2019] Hofmann, F. & Wegg, C. 2019, A&A, 625, L7. doi:10.1051/0004-6361/201935561
- Hunter [2007] Hunter, J. D. 2007, Computing in Science and Engineering, 9, 90. doi:10.1109/MCSE.2007.55
- Laine & Shaposhnikov [2008] Laine, M. & Shaposhnikov, M. 2008, J. Cosmology Astropart. Phys, 2008, 031. doi:10.1088/1475-7516/2008/06/031
- McKinney [2010] McKinney, W. 2010, Proceedings of the 9th Python in Science Conference, 56. doi:10.25080/Majora-92bf1922-00a
- McMillan [2017] McMillan, P. J. 2017, MNRAS, 465, 76. doi:10.1093/mnras/stw2759
- Moretti et al. [2009] Moretti, A., Pagani, C., Cusumano, G., et al. 2009, A&A, 493, 501. doi:10.1051/0004-6361:200811197
- NASA High Energy Astrophysics Science Archive Research Center [HEASARC] Nasa High Energy Astrophysics Science Archive Research Center (Heasarc) 2014, Astrophysics Source Code Library. ascl:1408.004
- Navarro et al. [1997] Navarro, J. F., Frenk, C. S., & White, S. D. M. 1997, ApJ, 490, 493. doi:10.1086/304888
- Neronov et al. [2016a] Neronov, A., Malyshev, D., & Eckert, D. 2016, Phys. Rev. D, 94, 123504. doi:10.1103/PhysRevD.94.123504
- Neronov & Malyshev [2016b] Neronov, A. & Malyshev, D. 2016, Phys. Rev. D, 93, 063518. doi:10.1103/PhysRevD.93.063518
- Nesti & Salucci [2013] Nesti, F. & Salucci, P. 2013, J. Cosmology Astropart. Phys, 2013, 016. doi:10.1088/1475-7516/2013/07/016
- Ng et al. [2015] Ng, K. C. Y., Horiuchi, S., Gaskins, J. M., et al. 2015, Phys. Rev. D, 92, 043503. doi:10.1103/PhysRevD.92.043503
- Ng et al. [2019] Ng, K. C. Y., Roach, B. M., Perez, K., et al. 2019, Phys. Rev. D, 99, 083005. doi:10.1103/PhysRevD.99.083005
- Pagani et al. [2007] Pagani, C., Morris, D. C., Racusin, J., et al. 2007, Proc. SPIE, 6686, 668609. doi:10.1117/12.734398
- Pal & Wolfenstein [1982] Pal, P. B. & Wolfenstein, L. 1982, Phys. Rev. D, 25, 766. doi:10.1103/PhysRevD.25.766
- Pedregosa et al. [2012] Pedregosa, F., Varoquaux, G., Gramfort, A., et al. 2012, arXiv:1201.0490
- Perez et al. [2017] Perez, K., Ng, K. C. Y., Beacom, J. F., et al. 2017, Phys. Rev. D, 95, 123002. doi:10.1103/PhysRevD.95.123002
- Roach et al. [2020] Roach, B. M., Ng, K. C. Y., Perez, K., et al. 2020, Phys. Rev. D, 101, 103011. doi:10.1103/PhysRevD.101.103011
- Roach et al. [2022] Roach, B. M., Rossland, S., Ng, K. C. Y., et al. 2022, arXiv:2207.04572
- Ruchayskiy et al. [2016] Ruchayskiy, O., Boyarsky, A., Iakubovskyi, D., et al. 2016, MNRAS, 460, 1390. doi:10.1093/mnras/stw1026
- Schneider [2015] Schneider, A. 2015, MNRAS, 451, 3117. doi:10.1093/mnras/stv1169
- Serpico & Raffelt [2005] Serpico, P. D. & Raffelt, G. G. 2005, Phys. Rev. D, 71, 127301. doi:10.1103/PhysRevD.71.127301
- Sicilian et al. [2020] Sicilian, D., Cappelluti, N., Bulbul, E., et al. 2020, ApJ, 905, 146. doi:10.3847/1538-4357/abbee9
- Silich et al. [2021] Silich, E. M., Jahoda, K., Angelini, L., et al. 2021, ApJ, 916, 2. doi:10.3847/1538-4357/ac043b
- Tamura et al. [2015] Tamura, T., Iizuka, R., Maeda, Y., et al. 2015, PASJ, 67, 23. doi:10.1093/pasj/psu156
- The pandas development team [2020] The pandas development team 2020, Zenodo. doi:10.5281/zenodo.3509134
- Urban et al. [2015] Urban, O., Werner, N., Allen, S. W., et al. 2015, MNRAS, 451, 2447. doi:10.1093/mnras/stv1142
- van der Walt et al. [2011] van der Walt, S., Colbert, S. C., & Varoquaux, G. 2011, Computing in Science and Engineering, 13, 22. doi:10.1109/MCSE.2011.37
- Venumadhav et al. [2016] Venumadhav, T., Cyr-Racine, F.-Y., Abazajian, K. N., et al. 2016, Phys. Rev. D, 94, 043515. doi:10.1103/PhysRevD.94.043515
- Vikhlinin et al. [1998] Vikhlinin, A., McNamara, B. R., Forman, W., et al. 1998, ApJ, 502, 558. doi:10.1086/305951
- Wik et al. [2014] Wik, D. R., Hornstrup, A., Molendi, S., et al. 2014, ApJ, 792, 48. doi:10.1088/0004-637X/792/1/48