2022 April 20 \Accepted2022 August 22 \Publishedpublication date
galaxies: active — infrared: galaxies —methods: observational
Optical IFU Observations of GOALS Sample with KOOLS-IFU on Seimei Telescope: Initial results of 9 U/LIRGs at 0.04
Abstract
We present ionized gas properties of 9 local ultra/luminous infrared galaxies (U/LIRGs) at 0.04 through IFU observations with KOOLS-IFU on Seimei Telescope. The observed targets are drawn from the Great Observatories All-sky LIRG Survey (GOALS), covering a wide range of merger stages. We successfully detect emission lines such as H, [O iii]5007, H, [N ii]6549,6583, and [S ii]6717,6731 with a spectral resolution of = 1500–2000, which provides (i) spatially-resolved (200–700 pc) moment map of ionized gas and (ii) diagnostics for active galactic nucleus (AGN) within the central 3–11 kpc in diameter for our sample. We find that [O iii] outflow that is expected to be driven by AGN tends to be stronger (i) towards the galactic center and (ii) as a sequence of merger stage. In particular, the outflow strength in the late-stage (stage D) mergers is about 1.5 times stronger than that in the early-state (stage B) mergers, which indicates that galaxy mergers could induce AGN-driven outflow and play an important role in the co-evolution of galaxies and supermassive black holes.
1 Introduction
In the last two decades, galaxy mergers have been recognized as a key phenomenon for understanding galaxy evolution (e.g., [Conselice (2014)] and reference therein). Star formation (SF) and/or active galactic nucleus (AGN) activity in galaxies are often triggered by galaxy mergers111We note that major mergers are not the only triggering mechanism of SF/AGN activity. Non-merger processes such as secular mechanisms may also trigger SF/AGN activity (see e.g., [Schawinski et al. (2011), Draper & Ballantyne (2012), Sharma et al. (2021)], and references therein) (see also Section 3.4)., which enhances the inflow of material from galactic scales into the close environments of the nuclear region. The galaxy merger also enhances infrared (IR) luminosity (222 is empirically defined as the luminosity integrated over a wavelength range of 8–1000 m (e.g., [Sanders & Mirabel (1996), Chary & Elbaz (2001)]).) (e.g., [Sanders et al. (1988), Veilleux et al. (2002), Imanishi et al. (2007), Imanishi (2009), Toba et al. (2015), Toba & Nagao (2016), Toba et al. (2017a)]). These are observed as luminous IR galaxies (LIRGs) and ultraluminous IR galaxies (ULIRGs) with greater than 1011 and 1012 , respectively (Sanders & Mirabel, 1996). Recent works also suggested that the relative strength of SF and AGN activity in U/LIRGs may be varied in the course of galaxy mergers (e.g., Narayanan et al. (2010); Ricci et al. (2017); Blecha et al. (2018); Yamada et al. (2019, 2021)). In particular, radiation from an AGN is expected to interact with the interstellar medium (ISM) and lead to the ejection or heating of the gas, which could be tightly associated with the growth of the galaxy and its supermassive black hole (SMBH) (e.g., Cazzoli et al. (2016); Toba et al. (2017b); Harrison et al. (2018); Chen et al. (2019); Finnerty et al. (2020); Jun et al. (2020); Fluetsch et al. (2021)). That AGN-driven outflow is often observed in U/LIRGs: recent observations reported that dusty IR luminous AGN often shows a strong ionized gas outflow, and its strength seems to be correlated with (Bischetti et al., 2017; Toba et al., 2017c; Chen et al., 2019; Jun et al., 2020). Therefore, U/LIRGs are a good laboratory to examine how AGN-driven outflow could influence the host galaxy and its SMBH. However, those works are often limited to handling a whole galaxy as a system. To address, from a spatially-resolved point of view, how the SF and AGN activity could be enhanced/quenched as a function of merger sequence, Integral Field Unit (IFU) observation is a quite powerful tool that may trace the gas kinematics and energetics (e.g., Bae et al. (2017); Shin et al. (2019); Pan et al. (2019)).
In this work, we focus on the Great Observatories All-sky LIRG Survey (GOALS; Armus et al. (2009)) that provides a complete, flux-limited (i.e., flux density at 60 m 5.24 Jy) U/LIRG sample in the local universe. In addition to their multi-wavelength follow-up observations, Stierwalt et al. (2013) divided the GOALS U/LIRGs into sub-samples regarding the merger stage, based on a visual inspection of the IRAC/Spitzer 3.6 images and/or higher resolution images taken by e.g., Hubble Space Telescope (see also Haan et al. (2011)). Therefore, the GOALS sample is an ideal laboratory to investigate the role of galaxy mergers in the co-evolution of galaxies and SMBHs.
In this paper, we present the initial results of our follow-up campaign of GOALS sample with an optical IFU, the Kyoto Okayama Optical Low-dispersion Spectrograph with optical-fiber IFU (KOOLS-IFU; Yoshida (2005); Matsubayashi et al. (2019)) on the Okayama 3.8 m, Seimei Telescope (Kurita et al., 2020). The structure of this paper is as follows. Section 2 describes the sample selection, observations, and data reduction of observed targets. In Section 3, we present the results of our optical IFU observations and discuss the dependence of ionized gas outflow on distance from the galaxy center and merger stage. We summarize the results of this work in Section 4. Throughout this paper, the adopted cosmology is a flat universe with = 70 km s-1 Mpc-1, = 0.28, and = 0.72, which are the same as those adopted in a series of GOALS papers that are relevant to this work (e.g., Armus et al. (2009); Rich et al. (2015)).
2 Data and analysis
2.1 Target selection
The observed targets were drawn from the GOALS sample, which is itself a subset of the IRAS Revised Bright Galaxy Sample (Sanders et al., 2003), providing a 60 flux-limited sample of U/LIRGs at . The GOALS sample has been extensively examined by multi-wavelength observations from X-ray (e.g., Iwasawa et al. (2011); Ricci et al. (2017); Torres-Albà et al. (2018); Yamada et al. (2020); Ricci et al. (2021); Yamada et al. (2021)), ultraviolet (UV) (e.g., Howell et al. (2010); Petty et al. (2014)), optical-NIR (e.g., Haan et al. (2011); Kim et al. (2013); Linden et al. (2017); Jin et al. (2019); Larson et al. (2020)), mid-IR (MIR)–far-IR (FIR) (e.g., Inami et al. (2013); Stierwalt et al. (2013, 2014); Chu et al. (2017); Díaz-Santos et al. (2017); Inami et al. (2018); Yamada et al. (2019); Armus et al. (2020)) to radio (e.g., Privon et al. (2015); Barcos-Muñoz et al. (2017); Yamashita et al. (2017); Herrero-Illana et al. (2019); Linden et al. (2019); Condon et al. (2021)) (see also Casey (2012); U et al. (2012) for SED analysis). We employed the merger classifications provided by Stierwalt et al. (2013), which have five categories from N (no signs of merger activity or massive neighbors), to stage A (galaxy pairs prior to a first encounter), B (post-first encounter with galaxy disks that are still symmetric and intact but with signs of tidal tails), C (showing amorphous disks, tidal tails, and other signs of merger activity), and D (two nuclei in a common envelope), as a sequence of merger stage (see Section 2.5 in Stierwalt et al. (2013) for more detail) (see also e.g., Figure 1 in Ricci et al. (2017) for an example image of each merger stage).
Basic properties of observed targets in GOALS sample. Object Name IRAS Name R.A. Decl. redshift physical scale -mag Merger Stage (J2000.0) (J2000.0) (Mpc) (kpc/arcsec) (1) (2) (3) (4) (5) (6) (7) (8) (9) (10) NGC 1614 F043150840 04:34:00.03 08:34:44.57 0.01594 69.12 0.32 14.7 11.65 D CGCG 468002W F05054+1718_W 05:08:19.71 +17:21:48.09 0.01748 75.89 0.36 15.4 (11.22) B NGC 3690 West F11257+5850_W 11:28:30.78 +58:33:42.90 0.01017 43.90 0.21 11.8 (11.93) C NGC 3690 East F11257+5850_E 11:28:33.39 +58:33:46.40 0.01036 44.74 0.21 11.8 (11.93) C Mrk 273 F13428+5608 13:44:42.07 +55:53:13.17 0.03734 164.61 0.74 15.7 12.21 D NGC 6786 F19120+7320_W 19:10:53.75 +73:24:36.60 0.02524 110.27 0.51 13.7 (11.49) C NGC 6921 20264+2533_W 20:28:28.84 +25:43:24.19 0.01447 62.67 0.30 14.4 (11.11) A NGC 7674 F23254+0830 23:27:56.70 +08:46:44.24 0.02903 127.17 0.58 13.9 11.56 A NGC 7679 23262+0314_W 23:28:46.67 +03:30:40.99 0.01715 74.45 0.35 13.2 11.11 A {tabnote} Columns: (1) object name from SIMBAD Astronomical Database or NASA/IPAC Extragalactic Database (NED). (2) IRAS name. (3–4) right ascension (R.A.) and declination (Decl.) (J2000.0). (5) spectroscopic redshift in NED. (6–7) luminosity distance and physical size in 1 arcsec in the assumed cosmology. (8) -band magnitude from SIMBAD or NED. (9) IR luminosity from Armus et al. (2009), where values in brackets denote the total IR luminosity for a system. (10) merger stage from Stierwalt et al. (2013).

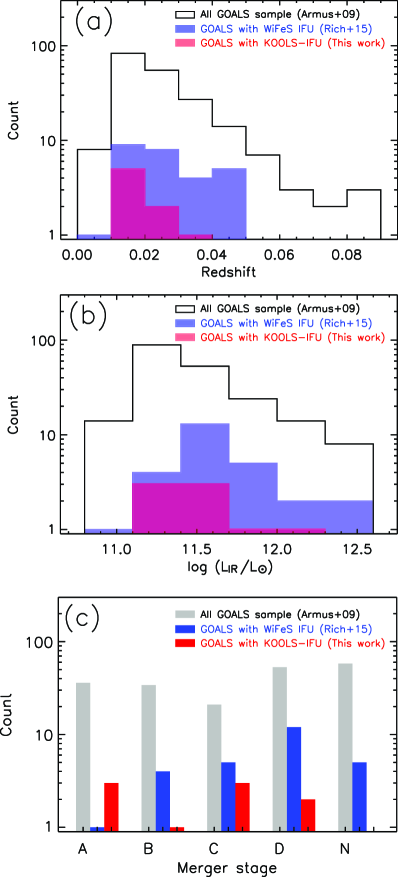
We selected 9 objects as the target by taking into account the magnitude in optical bands (-mag 16.0), merger stage, previous IFU observations, and visibility from the Seimei telescope. The basic information of observed targets is summarized in Table 2.1. Figure 1 shows distributions of redshift, IR luminosity, and merger stage of our sample. We also present those distributions for all the GOALS sample (Armus et al., 2009) and sub-sample reported in Rich et al. (2015), who performed the IFU observations of 27 southern U/LIRGs from the GOALS sample with the Wide Field Spectrograph (WiFeS) installed on a 2.3 m telescope that capability is similar to KOOLS-IFU. We confirm from Figure 1 that our sample is widely distributed in terms of IR luminosity and merger stage while that is biased toward low- (). Figure 2 shows -band images of our sample taken by Pan-STARRS333https://ps1images.stsci.edu/cgi-bin/ps1cutouts (Chambers et al., 2016).
We note that the WiFeS-GOALS IFU survey (Rich et al., 2011, 2012, 2015), the VLT-VIMOS IFU survey (Arribas et al., 2008), the PMAS IFU survey (Alonso-Herrero et al., 2009), the INTEGRAL IFU survey (García-Marín et al., 2009), VLT-SINFONI IFU survey (Piqueras López, et al., 2012), Physics of ULIRGs with MUSE and ALMA (PUMA; Perna et al. (2021)), and the Keck OSIRIS AO LIRG Analysis (KOALA; U et al. (2019)) observed (a part of) GOALS sample (see also García-Marín et al. (2006); Rodríguez-Zaurín et al. (2011); Bellocchi et al. (2013); Arribas et al. (2014); Kakkad et al. (2022); Perna et al. (2022)). In particular, the WiFeS-GOALS IFU survey provides specially-resolved maps for emission-line ratios based on various emission lines, such as H, [O iii]5007, H, [N ii]6549,6583, and [S ii]6716,6731 that are also targeted lines in this work (see Section 3.2). The sample in this survey is observable from the southern hemisphere, and thus our sample (that is observable from the northern hemisphere) is complementary to those reported in Rich et al. (2015). For the remaining projects, those basically focused on one emission line (e.g., H) and spatially-resolved emission-line ratios were not well investigated444We also confirmed that our targets have not yet been cataloged in the Calar Alto Legacy Integral Field Area Survey (CALIFA; Sánchez et al. (2012)) Data Release (DR) 3 (Sánchez et al., 2016), the Sydney-AAO Multi-object Integral-field spectrograph (SAMI) galaxy survey (Bryant et al., 2015) DR3 (Croom et al., 2021), and the Sloan Digital Sky Survey (SDSS: York et al. (2000)) Mapping Nearby Galaxies at Apache Point Observatory survey (MaNGA; Bundy et al. (2015)) DR17 (Abdurro’uf et al., 2022)..
Observation log in 2019B, 2020A, and 2020B semester. Name IRAS Name Observing date Exposure time (minutes) Standard star VPH 495 VPH 683 CGCG 468-002W F05054+1718_W Oct. 8, 2019 40 40 EGGR247 (=G191–B2B) NGC 1614 F04315-0840 Oct. 9, 27, 2019 50 50 HR9087, HD74280 (=HR3454) NGC 7679 23262+0314_W Oct. 25, 2019 30 30 HR7596 NGC 3690 West F11257+5850_W Apr. 20,21, 2020 40 40 HR5501, EGGR98 (=HZ43) NGC 3690 East F11257+5850_E Apr. 22,23, 2020 36 38 EGGR98 (=HZ43) Mrk 273 F13428+5608 Apr. 23, 2020 36 36 HR5501 NGC 6786 F19120+7320_W Aug. 16, 2020 40 40 HR7596 NGC 7674 F23254+0830 Aug 16-18, 2020 40 40 HR7596 NGC 6921 20264+2533_W Aug. 17, 18, 2020 80 80 HD15318 (=HR718)
2.2 Observations and data reduction
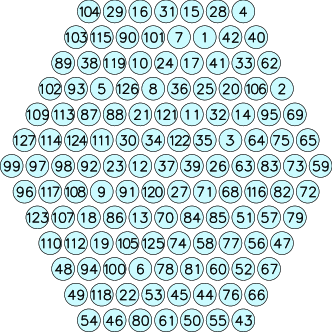
The targets were observed with the KOOLS-IFU on the Seimei Telescope in the 2019B, 2020A, and 2020B semesters (PI: Y.Toba with proposal IDs = 19B-N-CN01, 19B-K-0001, 20A-N-CN01, and 20B-K-0004). The Seimei is a new 3.8-meter diameter optical-IR alt-azimuth mount telescope located at Okayama Observatory, Kyoto University, Okayama prefecture in Japan, where the typical seeing on this site is 1.2\arcsec–1.4\arcsec. The science operation was started in 2019. The KOOLS-IFU consists of 127 fibers with a total field of view (FoV) of in diameter555This configuration is valid until September 2020.. Each fiber is assigned a unique fiber ID as shown in Figure 3. The spatial sampling is per fiber, and the 10 limiting magnitude is 17–18 AB mag given 10 minutes of exposure. We used the VPH 495 and VPH 683666We did not use an order-sorting filter O56 that is adopted for blocking the light with Å. grisms among four grisms equipped with the KOOLS-IFU. The wavelength coverage and the spectral resolution () of VPH 495 and VPH 683 are 4300–5900 Å and 1500 and 5800–8000 Å and 2000, respectively777http://www.o.kwasan.kyoto-u.ac.jp/inst/p-kools/performance/. The observational log is summarized in Table 2.1.
The data reduction was executed with a dedicated software888http://www.o.kwasan.kyoto-u.ac.jp/inst/p-kools/ in which the Image Reduction and Analysis Facility (IRAF: Tody (1986, 1993)) tasks are utilized through the Python package (PyRAF: Science Software Branch at STScI (2012)). In particular, the IRAF imred.hydra package (Barden et al., 1994; Barden & Armandroff, 1995) was mainly used for spectrum extraction, flat fielding, and wavelength calibration in a standard manner. Following Matsubayashi et al. (2019), spectrum extraction was done by measuring the center position of a spectrum at each pixel based on dome flat frames in which we summed the counts within 2.5 pixels of the center position. The wavelength was calibrated with arc (Hg and Ne) lamp frames. The flux calibration was carried out by using an observed spectrum of a standard star (see Table 2.1). Since we utilized all fibers of KOOLS-IFU for targets, we took sky frames separately for sky subtractions.
2.3 Spectral fitting
In order to measure the properties of emission lines such as line flux and line width for our GOALS sample, we conducted a spectral fitting to the reduced spectra by using the Quasar Spectral Fitting package (QSFit v1.3.0999https://qsfit.inaf.it; Calderone et al. (2017)). Following Toba et al. (2021a), we fit KOOLS-IFU spectra with the following five components; (i) AGN continuum with a single power law, (ii) Balmer continuum modeled by Grandi (1982) and Dietrich et al. (2002), (iii) host galaxy component taken from an empirical SED template in which a Spiral galaxy template101010We note that choice of the galaxy templates does not significantly affect the result of the fitting and our conclusion. (Polletta et al., 2007) is employed, (iv) iron blended emission lines with UV-optical templates (Vestergaard & Wilkes, 2001; Véron-Cetty et al., 2004), and (v) emission lines with Gaussian components. QSFit allows us to fit all the components simultaneously based on a Levenberg-Marquardt least-squares minimization algorithm with MPFIT (Markwardt, 2009) procedure.
Since QSFit is optimized to optical spectra taken by the SDSS (e.g., Calderone et al. (2017); Toba et al. (2021a, b)), we modified the code for general-purpose, which allows us to do the spectral fitting to KOOLS-IFU data. We fit the Balmer lines with narrow and broad components in which the FWHM of narrow and broad components is constrained in the range of 100–1000 km s-1 and 900–15,000 km s-1, respectively, to allow a good decomposition of the line profile, in the same manner as Toba et al. (2021a). Galactic extinction is corrected according to Schlafly & Finkbeiner (2011). Since one of the purposes of this work is to measure the kinematics of an ionized gas outflow, we also account for a blue-wing component of [O iii]4959,5007 lines. Following Calderone et al. (2017), the FWHM of the broad blue-wing component is constrained to be larger than the narrow component in the range of 100–1000 km s-1 while the broad component is allowed to be blue-shifted up to 2000 km s-1. The velocity offsets of [O iii]4959 and [O iii]5007 are tied111111This tying could fail when the SN of the emission line is low (see e.g., the middle panels of Figure 4). In this work, we employed the velocity offset of [O iii]5007 as long as it was reasonably measured without any warning, even if the velocity offset of [O iii]4959 might not be securely estimated.. The measurement errors are estimated from the Monte Carlo resampling method in which we adopted the 1 dispersion of each value by measuring them 100 times for spectra while randomly adding the noise in the same manner as in Toba et al. (2017b) (see Appendix B in Calderone et al. (2017) for a full explanation of this procedure).
3 Results and discussion
3.1 Result of the spectral fitting
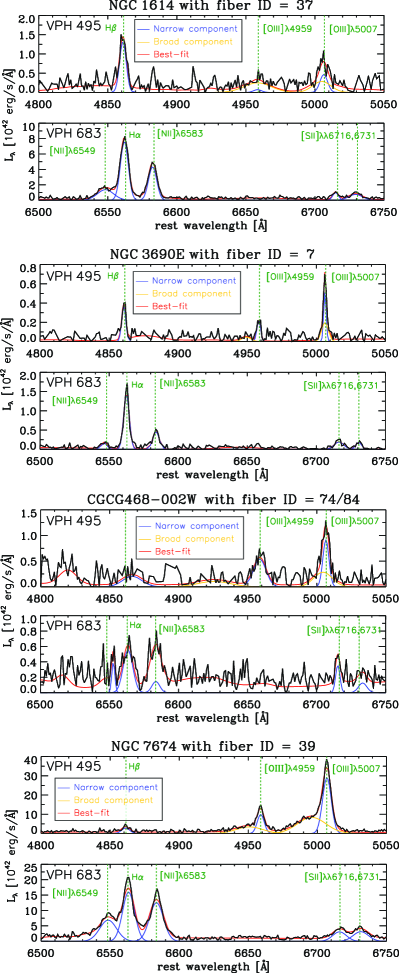
Figure 4 shows examples of the optical spectral fitting with QSFit. We confirm that about 72% of the fibers are successfully fitted, of which % have reduced . This indicates that the spectra of our sample taken by KOOLS-IFU are well fitted by QSFit. The failure of the fitting is mainly due to the low SN of spectra.
3.2 Line luminosity maps and line ratio diagnostics
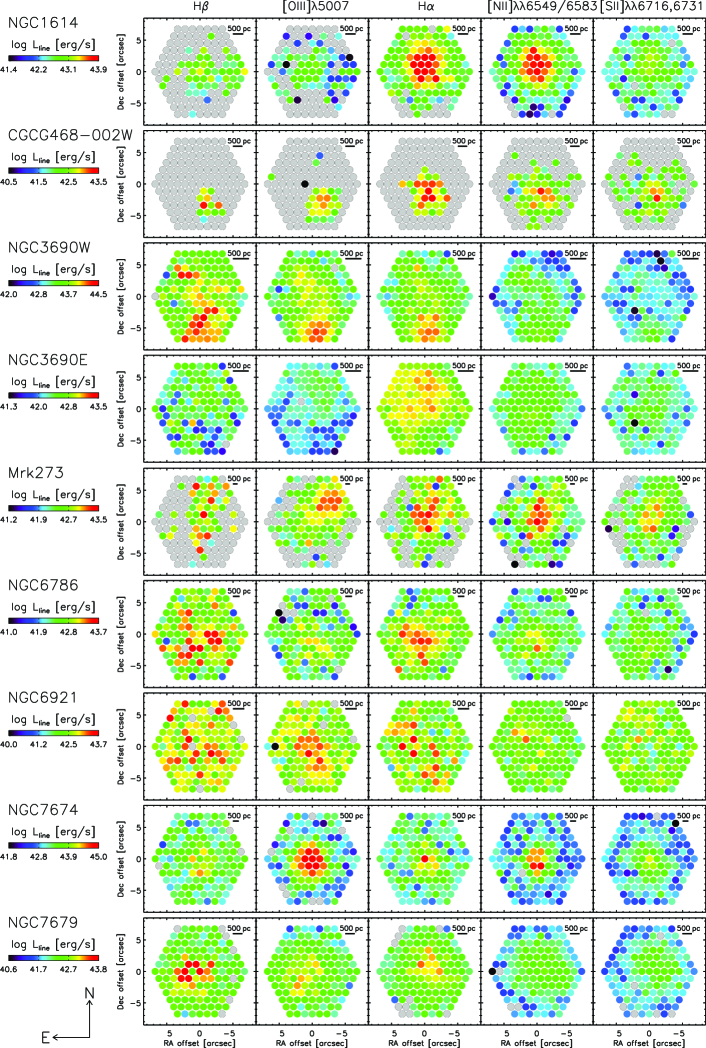
Figure 5 shows maps for line luminosity in units of erg s-1. Luminosity is the sum of the broad and narrow emission line components as long as a broad component is detected. Otherwise, a narrow component of the emission line is used for estimating the line luminosity. Since each spectrum in fiber is fitted 100 times via the Monte Carlo realization (see Section 2.3), their weighted mean is used. Line luminosity is successfully estimated for over 95% of fibers for most objects. We note that we did not correct for internal dust extinction because it is quite hard to estimate the amount of attenuation through the Balmer decrement in all fibers due to poor SN of H and/or H line in some fibers (see Figure 5). But this does not affect estimating the outflow properties that are relevant to the conclusion of this work (see Section 3.3).
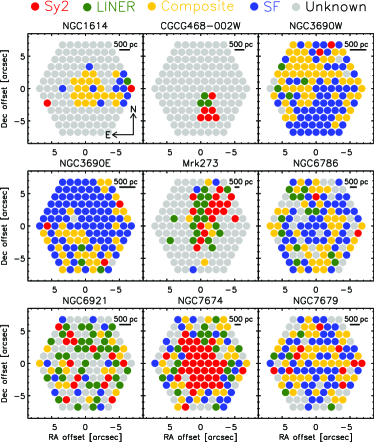
Figure 6 shows a spatially resolved BPT diagram (Baldwin et al., 1981) in which each fiber position is classified as Seyfert 2 (Sy2), low-ionization nuclear emission-line region (LINER), composite, star-forming region (SF), and Unknown. We employed diagnostics with line ratios of [N ii]6583/H and [O iii]5007/H provided by Kauffmann et al. (2003) and Kewley et al. (2006) (see also Toba et al. (2013, 2014)), in which narrow component of each emission line is used. If we define a fiber with Sy2 or composite classification as AGN-dominant, NGC 1614, CGCG 468-002W, Mrk 273, and NGC 7674 are AGN-dominated with 50-70% of fibers being classified as Sy2/Composite. For NGC 3690 West and East (that is classified as merger stage C), about 50% and 30% of fibers are classified as AGN, respectively, which suggests that NGC 3690 is basically SF-dominated, but the AGN contribution to the West part is larger than that of the East part for NGC 3690. Indeed, Alonso-Herrero et al. (2000) reported an interaction-induced star formation for this system. Hard X-ray observations also supported the presence of AGN in NGC 3690 West and the absence of AGN (or very faint AGN) in NGC 3690 East (Yamada et al., 2021). A caution here is that obscured AGN often lacks the signature of AGN emission from narrow-line regions (NLRs) in optical spectra because NLR is not well developed, and hence those are even outside of the AGN region in the BPT diagram (Hickox & Alexander (2018), and references therein), which makes the diagnostics with line ratios difficult.
3.3 Outflow properties as a function of distance from the galaxy center
We examine the spatial correlation of outflow properties in a galaxy and how the outflow strength could be associated with the merger stage. The velocity offset and/or velocity dispersion of [O iii]5007 have been preferentially used for evaluating the strength of ionized gas outflow from the rest-frame optical spectra (e.g., Zakamska et al. (2016); Rakshit & Woo (2018); Chen et al. (2019); Jun et al. (2020)). But it is known that the velocity offset or velocity dispersion alone is not always a good tracer of the strength of AGN outflows because they are often affected by dust extinction (Bae & Woo, 2014; Woo et al., 2016). To make a fair comparison of outflow power for objects in any merger stage that may have different amounts of dust (e.g., Ricci et al. (2017); Blecha et al. (2018); Ricci et al. (2021); Yamada et al. (2021)), we employ the following quantity;
| (1) |
where and are velocity shifts of the broad blue-wing component and its velocity dispersion, respectively. This quantity minimizes the influence of dust extinction; Bae & Woo (2016) demonstrated that does not change significantly regardless of the amount of dust extinction given a bicone inclination by assuming a biconical outflow model (see Bae & Woo (2016) for details). This methodology is applicable even to heavily dust-obscured galaxies (Toba et al., 2017b).
We then investigate how could depend on the distance from the galaxy center (i.e., fiber center). In order to obtain reliable with a relatively small uncertainty, we estimate in the following three annular areas with an inner-outer radius of (i) 0–1 kpc, (ii) 1–2 kpc, and (iii) 2–5 kpc. Figure 7 shows resultant as a function of galaxy center for various merger stages. The only object classified as merger stage “B”, CGCG 468002W, is shown only in the innermost area because could not be measured in the outer regions due to poor SN121212Even in the innermost area, the uncertainty of is about 0.3 dex (see Figure 7).. We find a negative correlation between distance from the center and regardless of the merger stage, with a coefficient of in which uncertainties of are taken into account (see e.g., Kelly (2007); Toba et al. (2019)). This result supports an AGN-driven outflow; an ionized gas outflow is launched from the galactic nucleus. Focusing on the galactic center, in merger stage D is the strongest that is comparable to dust-obscured AGN (Toba et al., 2017b) (see also Section 3.4).
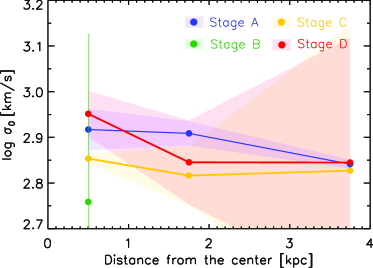
It should be noted that a starburst-driven outflow is also reported in some galaxies and is reproduced by numerical simulations (e.g., Jogee al. (1998); Leon et al. (2007); Schneider et al. (2020)). Hence may not be tracing purely AGN-driven outflow. To test this possibility, we utilize SDSS spectra of nearby starburst galaxies and execute the spectral analysis. We first select 430 objects from the SDSS DR17 with satisfying the following criteria; (i) , (ii) -mag , and (iii) SUBCLASS = “STARBURST”131313It labels a galaxy with being classified star-forming galaxies (SFGs) in the BPT diagram but has an equivalent width of H greater than 50 Å.. The redshift and magnitude ranges are similar to those in our GOALS sample. The fiber diameter of the SDSS/BOSS Spectrograph is 2\arcsec–3\arcsec, which corresponds to central 2–3 fibers in KOOLS-IFU. We then perform the spectral fitting with QSFit in the same manner as what is described in Section 2.3 and estimate . As a result, a weighted mean of for the starburst galaxy sample is . This value is smaller than those in the inner part of our GOALS sample, which means that it could be difficult for starburst galaxies to produce such a strong outflow with as we observed for our sample (Figure 7). This suggests that high basically originates from an AGN-driven outflow.
In order to see how the galaxy merger could affect the gas density from the spatially-resolved view, we also estimate electron density () of ionized gas from the line flux ratio of [S ii]6716,6731 that is known as a good tracer of and widely used for AGN141414Recently, some caveats of using [S ii] doublet for have been reported (Davies et al. (2020), and references therein). (e.g., Osterbrock & Ferland (2006); Kawasaki et al. (2017); Kawaguchi et al. (2018); Joh et al. (2021)), which tells us how could be different among the inner and outer regions of our GOALS sample. Here, a conversion formula is employed to estimate from the [S ii] ratio (see e.g., Kakkad et al. (2022), and reference therein). Albeit with a large uncertainty (30 %), we find a spatial gradient of , i.e., high-density gas with cm-3 is located in the central 0.5 kpc while low-density gas with cm-3 is distributed in the outer region.
3.4 Outflow properties as a function of merger stage
Finally, we investigate how could be associated with the merger stages as shown in Figure 8. We find that ionized gas outflow is more powerful as a sequence of merger stages; the outflow strength in the late-stage (stage D) mergers is about 1.5 times stronger than that in the early-state (stage B) mergers. We also check the correlation between and in which is the separation between the two nuclei in units of kpc (see Yamada et al. (2021)). We confirm a negative correlation between two quantities for samples with merger stages from B to D. We further find that estimated from the [S ii] doublet (see Section 3.3) seems larger in the late-stage merger. Recently, Yamada et al. (2021) reported that the outflow velocity of molecular gas of X-ray AGN in merger stage D correlates with Eddington ratio151515Yamada et al. (2021) also reported a positive correlation between outflow velocity of molecular gas and X-ray bolometric correction that may be correlated with Eddington ratio (see e.g., Toba et al. (2019)).. Molecular outflows are also correlated with ionized gas outflow regarding the mass outflow rate (Fiore et al., 2017). These results suggest that the galaxy merger could induce a dense ionized gas outflow driven by AGN, particularly in the late-stage merger. At the same time, an important caveat to be kept in mind is that those results are based only on nine objects. We cannot rule out the possibility that the observed trends are affected by a selection effect (see below). Further observations for the GOALS sample with a wider range of redshift, brightness, and dynamical state are needed to corroborate our conclusion.
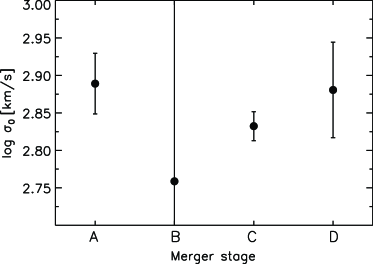
We also note that for merger stage A is comparably large to stage D. One possible reason for this is that merger stage A is a too early phase (i.e., two galaxies are too far from each other) to affect the strength of the ionized gas outflow, and thus could depend on the nature of the individual object rather than the contribution of the merger process. Indeed, NGC 6921, NGC 7674, and NGC 7679 (that are classified as merger stage A) are all reported as strong AGNs with X-ray detections161616NGC 7674 and MGC 7679 are also reported [Ne v]14.32 m detections (Inami et al., 2013). (see Yamada et al. (2021), for details). In particular, NGC 7674 is expected to harbor dual SMBHs (Kharb et al. (2017), but see also Breiding et al. (2022) for counterargument), which could have a quite strong AGN outflow171717The Eddington ratio of NGC 7674 is also larger than other AGN in our sample (Yamada et al., 2021).. A full investigation of this object will be reported (S.Yamada et al. in preparation). Another possibility is that those objects are indeed at the very last stage of former merging events so that no tidal features are visible (which means they are stage D). On the other hand, if the trend in Figure 8 is robust without being affected by the selection effect, this result could suggest that galaxy merger is not the only path to ignite AGN as introduced in Section 1.
Arribas et al. (2014) reported that SF-driven outflow strength traced by H line in SFGs is correlated with dynamical phases (that corresponds to the merger stage, see Rodríguez-Zaurín et al. (2011), for more detail) along the merging process. Rich et al. (2015) also reported from an IFU observation that the low-velocity shocks become increasingly prominent as a merger progresses (see also Rich et al. (2011)). In addition, the outflow strength () seems to be correlated with the Eddington ratio (e.g., Bae & Woo (2014); Toba et al. (2017b)). Taking account of those findings into account, our observations support that galaxy mergers enhance both SF and AGN activity and play an important role in the co-evolution of galaxies and SMBHs.
4 Summary
In order to reveal how the galaxy merger could affect the strength of the ionized gas outflow from a spatially-resolved point of view, we analyze 9 local U/LIRGs at through the IFU observations with KOOLS-IFU on Seimei Telescope. The observed targets are selected from a 60 m flux-limited sample in the GOALS project, covering a wide range of merger states from an early-stage (A) to late-stage (D). We successfully detect various emission lines of H, [O iii]4959,5007, H, [N ii]6549,6583, and [S ii]6716,6731 over 70% of fibers. This work mainly focuses on the strength of the ionized gas outflow () by using a combination of velocity shift and dispersion of [O iii]5007 line. With all the caveats discussed in Sections 3.3 and 3.4 in mind, we find shows a negative correlation with the distance from the galaxy center and a positive correlation with a sequence of merger stages. This indicates that galaxy mergers may induce AGN-driven outflow and maximize the late-stage merger, which is in good agreement with previous works reporting that the Eddington ratio of AGN increases along with the merger stage.
Since our follow-up observation campaign with KOOLS-IFU is ongoing, and about 130 GOALS samples are observable from the Seimei telescope, this work provides a benchmark for revealing the spatially-resolved outflow properties from a statical point of view in the future.
We gratefully thank the anonymous referee for a careful reading of the manuscript and very helpful comments. We acknowledge Dr. Kyuseok Oh for providing a finding chart for our observations in 2019. This work is supported by JSPS KAKENHI Grant numbers 18J01050, 19K14759, and 22H01266 (YT), 19J22216 (SY), 20H01946 (YU), and 20K04027 (NO). SY is grateful for support from RIKEN Special Postdoctoral Researcher Program.
References
- Abdurro’uf et al. (2022) Abdurro’uf, et al., 2022, ApJS, 259, 35
- Alonso-Herrero et al. (2000) Alonso-Herrero, A., Rieke, G. H., Rieke, M. J., & Scoville, N. Z. 2000, ApJ, 532, 845
- Alonso-Herrero et al. (2009) Alonso-Herrero, A., García-Marín, M., Monreal-Ibero, A., Colina, L., Arribas, S., Alfonso-Garzón, J., & Labiano, A. 2009, A&A, 506, 1541
- Armus et al. (2009) Armus, L., et al. 2009, PASP, 121, 559
- Armus et al. (2020) Armus L., Charmandaris V.,& Soifer B. T., 2020, Nat. Astron., 4, 467
- Arribas et al. (2008) Arribas, S., Colina, L., Monreal-Ibero, A., Alfonso, J., García-Marín, M., & Alonso-Herrero, A. 2008, A&A, 479, 687
- Arribas et al. (2014) Arribas, S., Colina, L., Bellocchi, E., Maiolino, R., & Villar-Martín, M. 2014, A&A, 568, A14,
- Bae & Woo (2014) Bae, H.-J., & Woo, J.-H. 2014, ApJ, 795, 30
- Bae & Woo (2016) Bae, H.-J., & Woo, J.-H. 2016, ApJ, 828, 97
- Bae et al. (2017) Bae, H.-J., Woo, J.-H., Karouzos, M., Gallo, E., Flohic, H., Shen, Y., & Yoon, S.-J. 2017, ApJ, 837, 91
- Baldwin et al. (1981) Baldwin J. A., Phillips M. M., Terlevich R., 1981, PASP, 93, 5
- Barcos-Muñoz et al. (2017) Barcos-Muñoz, L., et al. 2017, ApJ, 843, 117
- Barden et al. (1994) Barden, S. C., Armandroff, T., Muller, G., Rudeen, A. C., Lewis, J., & Groves, L. 1994, Proc. SPIE, 2198, 87
- Barden & Armandroff (1995) Barden, S. C., & Armandroff, T. 1995, Proc. SPIE, 2476, 56
- Bellocchi et al. (2013) Bellocchi, E., Arribas, S., Colina, L., & Miralles-Caballero, D. 2013, A&A, 557, A59
- Bischetti et al. (2017) Bischetti, M., et al. 2017, A&A, 598, A122
- Blecha et al. (2018) Blecha, L., Snyder, G. F., Satyapal, S., & Ellison, S. L. 2018, MNRAS, 478, 3056
- Breiding et al. (2022) Breiding, P., Burke-Spolaor, S., An, T., Bansal, K., Mohan, P., Taylor, B. G., & Zhang, Y. 2022, ApJ, 933, 143
- Bryant et al. (2015) Bryant, J. J., et al. 2015, MNRAS, 447, 2857
- Bundy et al. (2015) Bundy, K., et al. 2015, ApJ, 798, 7
- Calderone et al. (2017) Calderone, G., Nicastro, L., Ghisellini, G., Dotti, M., Sbarrato, T., Shankar, F., & Colpi, M., 2017, MNRAS, 472, 4051
- Casey (2012) Casey, C. M. 2012, MNRAS, 425, 3094
- Cazzoli et al. (2016) Cazzoli, S., Arribas, S., Maiolino, R., & Colina, L., 2016, A&A, 590, A125
- Chambers et al. (2016) Chambers, K. C., et al. 2016, arXiv:1612.05560
- Chary & Elbaz (2001) Chary, R., & Elbaz, D. 2001, ApJ, 556, 562
- Chen et al. (2019) Chen, X., et al. 2019, PASJ, 71, 29
- Chu et al. (2017) Chu, Jason K., et al. 2017, ApJS, 229, 25,
- Condon et al. (2021) Condon, J. J., Cotton, W. D., Jarrett, T., Marchetti, L., Matthews, A. M., Mauch, T., & Moloko, M. E. 2021, ApJS, 257, 35
- Conselice (2014) Conselice, C. J. 2014, ARA&A, 52, 291
- Croom et al. (2021) Croom, S. M., et al. 2021, MNRAS, 505, 991
- Davies et al. (2020) Davies R. et al., 2020, MNRAS, 498, 4150
- de Zeeuw et al. (2002) de Zeeuw, P. T., et al. 2002, MNRAS, 329, 513
- Díaz-Santos et al. (2017) Díaz-Santos, T., et al. 2017, ApJ, 846, 32
- Dietrich et al. (2002) Dietrich M., Appenzeller I., Vestergaard M., & Wagner S. J., 2002, ApJ, 564, 581
- Draper & Ballantyne (2012) Draper, A. R., & Ballantyne, D. R. 2012, ApJ, 751, 72
- Finnerty et al. (2020) Finnerty, L., et al. 2020, ApJ, 905, 16
- Fiore et al. (2017) Fiore, F., et al. 2017, A&A, 601, A143
- Fluetsch et al. (2021) Fluetsch, A., et al. 2021, MNRAS, 505, 5753
- García-Marín et al. (2006) García-Marín, M., Colina, L., Arribas, S., Alonso-Herrero, A., & Mediavilla, E. 2006, ApJ, 650, 850
- García-Marín et al. (2009) García-Marín, M., Colina, L., Arribas, S., & Monreal-Ibero, A. 2009, A&A, 505, 1319
- Grandi (1982) Grandi S. A., 1982, ApJ, 255, 25
- Haan et al. (2011) Haan, S., et al. 2011, ApJS, 197, 27
- Harrison et al. (2018) Harrison, C. M., Costa, T., Tadhunter, C. N., Flütsch, A., Kakkad, D., Perna, M. & Vietri, G. 2018, Nature Astron., 2, 198
- Herrero-Illana et al. (2019) Herrero-Illana, R., et al. 2019, A&A, 628, A71
- Hickox & Alexander (2018) Hickox, R. C., & Alexander, D. M. 2018, ARA&A, 56, 625
- Howell et al. (2010) Howell, J. H., et al. 2010, ApJ, 715, 572
- Imanishi et al. (2007) Imanishi, M., Dudley, C. C., Maiolino, R., Maloney, P. R., Nakagawa, T., & Risaliti, G. 2007, ApJS, 171, 72
- Imanishi (2009) Imanishi, M. 2009, ApJ, 694, 751
- Inami et al. (2013) Inami, H., et al. 2013, ApJ, 777, 156
- Inami et al. (2018) Inami, H., et al. 2018, A&A, 617, A130
- Iwasawa et al. (2011) Iwasawa, K., et al. 2011, A&A, 529, A106
- Jin et al. (2019) Jin, J-J., Zhu, Y.-N., Wu, H., Lei, F.-J., Cao, C., Meng, X.-M., Zhou, Z.-M., & Lam, M. I. 2019, ApJS, 244, 33
- Jogee al. (1998) Jogee, S., Kenney, J. D. P., & Smith, B. J. 1998, ApJ, 494, 185
- Joh et al. (2021) Joh, K,, Nagao, T., Wada, K., Terao, K., & Yamashita, T. 2021, PASJ, 73, 1152
- Jun et al. (2020) Jun, H. D., et al. 2020, ApJ, 888, 110
- Kakkad et al. (2022) Kakkad, D., et al. 2022, MNRAS, 511, 2105
- Kauffmann et al. (2003) Kauffmann, G., et al. 2003, MNRAS, 346, 1055
- Kawaguchi et al. (2018) Kawaguchi, T., et al. 2018, PASJ, 70, 93
- Kawasaki et al. (2017) Kawasaki, K., Nagao, T., Toba, Y., Terao, K., & Matsuoka, K. 2017, ApJ, 842, 44
- Kelly (2007) Kelly B. C., 2007, ApJ, 665, 1489
- Kewley et al. (2006) Kewley, L. J., Groves, B., Kauffmann, G., & Heckman, T. 2006, MNRAS, 372, 961
- Kharb et al. (2017) Kharb, P., Lal, D. V., & Merritt, D. 2017, Nat. Astron., 1, 727
- Kim et al. (2013) Kim, D.-C., et al. 2013, ApJ, 768, 102
- Kurita et al. (2020) Kurita, M., et al. 2020, PASJ, 72, 48
- Larson et al. (2020) Larson, K. L., et al. 2020, ApJ, 888, 92
- Leon et al. (2007) Leon, S., et al. 2007, A&A, 473, 747
- Linden et al. (2017) Linden, S. T., et al. 2017, ApJ, 843, 91
- Linden et al. (2019) Linden, S. T., et al. 2019, ApJ, 881, 70
- Markwardt (2009) Markwardt, C. B. 2009, ASP Conf. Ser., 411, 251
- Matsubayashi et al. (2019) Matsubayashi, K., et al. 2019, PASJ, 71, 102
- Narayanan et al. (2010) Narayanan, D., et al. 2010, MNRAS, 407, 1701
- Osterbrock & Ferland (2006) Osterbrock, D. E., & Ferland, G. J. 2006, Astrophysics of Gaseous Nebulae and Active Galactic Nuclei, 2nd ed. (Sausalito, CA: University Science Books)
- Pan et al. (2019) Pan, H.-A., et al. 2019, ApJ, 881, 119
- Perna et al. (2021) Perna, M., et al. 2021, A&A, 646, A101
- Perna et al. (2022) Perna, M., et al. 2022, A&A, 662, A94
- Petty et al. (2014) Petty, S. M., et al. 2014, AJ, 148, 111
- Piqueras López, et al. (2012) Piqueras López, J., Colina, L., Arribas, S., Alonso-Herrero, A., & Bedregal, A. G. 2012, A&A, 546, A64
- Polletta et al. (2007) Polletta, M., et al. 2007, ApJ, 663, 81
- Privon et al. (2015) Privon, G. C., et al. 2015, ApJ, 814, 39
- Rakshit & Woo (2018) Rakshit, S., & Woo, J.-H. 2018, ApJ, 865, 5
- Ricci et al. (2017) Ricci, C., et al. 2017, MNRAS, 468, 1273
- Ricci et al. (2021) Ricci, C., et al. 2021, MNRAS, 506, 5935
- Rich et al. (2011) Rich, J. A., Kewley, L. J., & Dopita, M. A. 2011, ApJ, 734, 87
- Rich et al. (2012) Rich, J. A., Torrey, P., Kewley, L. J., Dopita, M. A., & Rupke, D. S. N. 2012, ApJ, 753, 5
- Rich et al. (2015) Rich, J. A., Kewley, L. J., & Dopita, M. A. 2015, ApJS, 221, 28
- Rodríguez-Zaurín et al. (2011) Rodríguez-Zaurín, J., Arribas, S., Monreal-Ibero, A., Colina, L., Alonso-Herrero, A., & Alfonso-Garzón, J. 2011, A&A, 527, A60
- Sánchez et al. (2012) Sánchez, S. F., et al. 2012, A&A, 538, A8
- Sánchez et al. (2016) Sánchez, S. F., et al. 2016, A&A, 594, A36
- Sanders & Mirabel (1996) Sanders, D. B., & Mirabel, I. F. 1996, ARA&A, 34, 749
- Sanders et al. (1988) Sanders D. B., Soifer B. T., Elias J. H., Madore B. F., Matthews K., Neugebauer G., & Scoville N. Z., 1988, ApJ, 325, 74
- Sanders et al. (2003) Sanders, D. B., Mazzarella, J. M., Kim, D., Surace, J. A., & Soifer, B. T. 2003, AJ, 126, 1607
- Schawinski et al. (2011) Schawinski, K., Treister, E., Urry, C. M., Cardamone, C. N., Simmons, B., & Yi, S. K. 2011, ApJ, 727, L31
- Schlafly & Finkbeiner (2011) Schlafly, E. F., & Finkbeiner, D. P. 2011, ApJ, 737, 103
- Schneider et al. (2020) Schneider, E. E., Ostriker, E. C., Robertson, B. E., & Thompson, T. A. 2020, ApJ, 895, 43
- Science Software Branch at STScI (2012) Science Software Branch at STScI 2012, Astrophysics Source Code Library, ascl:1207.011
- Sharma et al. (2021) Sharma, R. S., et al. 2021, (arXiv:2101.01729)
- Shin et al. (2019) Shin J., Woo J.-H., Chung A., Baek J., Cho K., Kang D., & Bae H.-J., 2019, ApJ, 881, 147
- Stierwalt et al. (2013) Stierwalt, S., et al. 2013, ApJS, 206, 1
- Stierwalt et al. (2014) Stierwalt, S., et al. 2014, ApJ, 790, 124
- Toba et al. (2013) Toba, Y., et al. 2013, PASJ, 65, 113
- Toba et al. (2014) Toba, Y., et al. 2014, ApJ, 788, 45
- Toba et al. (2015) Toba, Y., et al. 2015, PASJ, 67, 86
- Toba & Nagao (2016) Toba, Y., & Nagao, T. 2016, ApJ, 820, 46
- Toba et al. (2017a) Toba, Y., et al. 2017a, ApJ, 840, 21
- Toba et al. (2017b) Toba, Y., Bae, H.-J., Nagao, T., Woo, J.-H., Wang, W.-H., Wagner, A. Y., Sun, A.-L., & Chang, Y.-Y. 2017b, ApJ, 850, 140
- Toba et al. (2017c) Toba, Y., Komugi, S., Nagao, T., Yamashita, T., Wang, W.-H., Imanishi, M., & Sun, A.-L. 2017c, ApJ, 851, 98
- Toba et al. (2019) Toba, Y, Ueda, Y., Matsuoka, K., Shidatsu, M., Nagao, T., Terashima, Y., Wang, W.-H., & Chang, Y.-Y. 2019, MNRAS, 484, 196
- Toba et al. (2021a) Toba, Y., et al. 2021a, ApJ, 912, 91
- Toba et al. (2021b) Toba, Y., et al. 2021b, A&A, 649, L11
- Tody (1986) Tody, D. 1986, Proc. SPIE, 627, 733
- Tody (1993) Tody, D. 1993, in ASP Conf. Ser. 52, Astronomical Data Analysis Software and Systems II, ed. R. J. Hanisch, R. J. V. Brissenden, & J. Barnes (San Francisco, CA: ASP), 173
- Torres-Albà et al. (2018) Torres-Albà, N., et al. 2018, A&A, 620, A140
- U et al. (2012) U, V., et al. 2012, ApJS, 203, 9
- U et al. (2019) U, V., et al. 2019, ApJ, 871, 166
- Veilleux et al. (2002) Veilleux, S., Kim, D.-C., & Sanders, D. B. 2002, ApJS, 143, 315
- Véron-Cetty et al. (2004) Véron-Cetty, M.-P., Joly M., & Véron P., 2004, A&A, 417, 515
- Vestergaard & Wilkes (2001) Vestergaard, M., & Wilkes B. J., 2001, ApJS, 134, 1
- Woo et al. (2016) Woo, J.-H., Bae, H.-J., Son, D., & Karouzos, M. 2016, ApJ, 817, 108
- Yamada et al. (2019) Yamada S., Ueda Y., Tanimoto A., Kawamuro T., Imanishi M., & Toba Y., 2019, ApJ, 876, 96
- Yamada et al. (2020) Yamada S., Ueda Y., Tanimoto A., Oda S., Imanishi M., Toba Y., & Ricci C., 2020, ApJ, 897, 107
- Yamada et al. (2021) Yamada S., Ueda Y., Tanimoto A., Imanishi M., Toba Y., Ricci C., & Privon G. C., 2021, ApJS, 257, 61
- Yamashita et al. (2017) Yamashita, T., et al. 2017, ApJ, 844, 96
- York et al. (2000) York, D. G., et al. 2000, AJ, 120, 1579
- Yoshida (2005) Yoshida, M. 2005, J. Korean Astron. Soc., 38, 117
- Zakamska et al. (2016) Zakamska, N. L., et al. 2016, MNRAS, 459, 3144