The Virial Balance of Molecular Clumps and Cores in Colliding Magnetized Flows
Abstract
We simulate the formation of molecular clouds in colliding flows of warm neutral medium with the adaptive mesh refinement code Flash. We include a chemical network to treat heating and cooling and to follow the formation of molecular gas. For the forming molecular clumps and cores in four different simulations with varying initial magnetic field strength between 0.01 – 5 G, we carry out a full virial analysis including all time-independent surface and volume terms as well as the time-dependent term. The initial magnetic field strength influences the fragmentation properties of the forming cloud because it prohibits motions perpendicular to the field direction and hence alters, or even suppresses, the formation of filamentary substructures. Molecular clump and core formation occurs anyhow. As a result, with increasing field strength, we find more fragments with a smaller average mass; yet the initial field strength is dynamically not relevant for the fragments which constitute our molecular clumps and cores. The molecular clumps are mostly unbound, probably transient objects, which seem to be weakly confined by ram pressure or thermal pressure, indicating that they are swept up by the turbulent flow. They experience significant fluctuations in the mass flux through their surface, indicating that the Eulerian reference frame gives rise to a dominant time-dependent term due to their ill-defined nature. We define the cores to encompass molecular gas, which is additionally highly shielded. Most cores are in gravitational-kinetic equipartition and are already well described by the common virial parameter (as can be seen from the Heyer relation), while some undergo minor dispersion by kinetic surface effects.
keywords:
methods: numerical – ISM: evolution – ISM: clouds – astrochemistry1 Introduction
Star formation takes place in dense and cool molecular clouds (MCs; e.g. McKee & Ostriker, 2007). Generally, MCs consist of a complex network of filaments (Schneider & Elmegreen, 1979; Hacar et al., 2022), which harbour clumps and cores (André et al., 2014). Understanding the structural and chemical evolution of these clumps and cores is essential for understanding the conditions of star formation.
The empirical description of the cloud substructure using clumps and cores goes back to Williams et al. (2000). Clumps are defined based on their velocity coherence in molecular line observations (for instance by using the bright carbon-monoxide molecule, CO, see e.g. Loren, 1989; Williams et al., 1994), while cores are gravitationally bound objects with a single maximum in column density (Bergin & Tafalla, 2007). Cores are hence proposed to gravitationally collapse into individual stars or small-N multiples (McKee & Ostriker, 2007; Walch et al., 2010; Holman et al., 2013). An overview of typical properties for clumps and cores can be found in Bergin & Tafalla (2007).
MCs are also observed to be very turbulent (Zuckerman & Evans, 1974; Larson, 1981; Ballesteros-Paredes et al., 2007) as well as threaded by magnetic fields. Most MCs have a comparable turbulent kinetic energy and magnetic energy (Crutcher, 2012). Hence, the impact of both, turbulence and magnetic fields, on the evolution of MCs ought to be considered.
Traditionally, key parameters to characterise the energetic state of MC’s are their size, velocity dispersion, and surface density. Although these parameters do not represent impeccable information on a MC’s configuration, they are to some degree observationally accessible. Larson (1981) describes relations regarding those parameters, with Larson’s linewidth-size relation () offering a criterion for kinetic-gravitational equipartition. Larson’s relations were later refined by Heyer & Brunt (2004), who, supported by data on gravitationally bound clouds, show that there is a systematic variation of the scaling coefficient with the surface density (see also Heyer et al., 2009).
On the other hand, simulated MCs provide complete knowledge on their configuration, including the PPP-space mass distribution as well as velocity, magnetic, and gravitational fields. This allows for making exhaustive use of the virial theorem, which is a tool to quantify their energetic state (Chandrasekhar & Fermi, 1953). It can be written in Lagrangian as well as Eulerian form. In this paper we will follow the general Eulerian formulation of McKee & Zweibel (1992) (see Sec. 2), which suits our numerical simulations.
By comparing hierachical structures identified from PPP- and PPV-space dendrograms, Beaumont et al. (2013) show that observational projection effects can lead to a misinterpretation of the virial parameter. Further, Mao et al. (2020) investigate the significance of including thermal and magnetic energy when calculating virial parameters of objects defined by density thresholds. They find that the virial parameter can be unreliable in assessing the boundedness of a structure, as it neglects non-spherical geometry, internal stratification, and tidal forces.
Lifetimes of MCs are limited to a few megayears (Elmegreen, 2000; Chevance et al., 2020). Numerical simulations show that the molecular hydrogen () content of MCs can rapidly form from the interstellar medium (ISM) under supersonically turbulent conditions (Glover & Mac Low, 2007). The so-called colliding-flow scenario (e.g. Walder & Folini, 1998; Heitsch et al., 2005; Audit & Hennebelle, 2005; Inoue & Inutsuka, 2008; Heitsch et al., 2011; Körtgen & Banerjee, 2015; Valdivia et al., 2016; Joshi et al., 2019), where two supersonic gas flows collide and form a shocked central layer, offers a simple model for the rapid creation of thermal and dynamical instabilities driving turbulence (Heitsch et al., 2008). It thereby provides a mechanism that generates structures resembling MCs in the collision zone. In this process, pockets containing very high fractions are formed, followed by the formation of dense cores which contain CO molecules (Clark et al., 2012b).
Here, we study the formation of MC clumps and cores in colliding flows of warm, atomic gas with different magnetization by means of three-dimensional MHD simulations with the adaptive mesh refinement (AMR) code Flash. We include self-gravity, an external interstellar radiation field (ISRF), which is attenuated using a tree-based radiative transfer method (Wünsch et al., 2018), a uniform Cosmic Ray (CR) ionization rate, and a simple chemical network to follow the formation of H2 and CO. The energy balance of the forming clumps and cores is analysed in detail in order to determine the relative importance of the different physical processes.
Dib et al. (2007) have carried out a similar study. However, their work differs in scope by a more thorough focus on magnetic fragmentation, while their underlying simulations (Vázquez-Semadeni et al., 2005) are based on isothermal, supersonically driven turbulent boxes with a resolution of , and without any gas chemistry. They observe clumps and cores to be transient, out-of-equilibrium structures, which are dynamically created from their turbulent environment.
Some observations investigate the role of external pressure in confining the cores. Kerr et al. (2019) perform a virial analysis on starless cores observed in three nearby star-forming regions, suggesting that many of those cores require confinement by external pressure to remain bound. Shimoikura et al. (2019) observe molecular cores in M17 SWex. They find that many massive cores are dynamically stable without external pressure, while some cores are confined and highly influenced by external pressure. Chen et al. (2020) study dense cores in MHD simulations using machine learning techniques, identifying an successive evolutionary sequence of first forming turbulent density structures, followed by the dissipation of turbulence and the formation of coherent cores and finally the transition to protostellar cores through gravitational collapse.
Modelling non-equilibrium chemistry enables us to define MC substructures based on the CO content in our simulations. As CO is also a widely used observational tracer for such structures, this allows us to define clumps and cores which are likely to resemble their observed counterparts, while we also retain the information needed to apply the full virial theorem as recapitulated in Section 2. The paper is structured as follows: In Section 3 we summarise the simulation setup and initial conditions and describe our methods to find the forming clumps and cores. In Section 4 we present the results of analysing those substructures. We investigate the Larson relations and the Virial Theorem. In Section 5, we discuss the implications of the time-dependent component of the Eulerian Virial Theorem for our results and investigate the state of the identified cores. We conclude in Section 6.
2 Recapitulation of the Virial Theorem
We use the full virial theorem to assess the virial state of MC substructures. For this, we use the Eulerian formulation of the virial theorem given by McKee & Zweibel (1992), as this formulation is applicable for the AMR data of our simulations. This formulation has previously been used by Dib et al. (2007) to study the energetics of MC cores formed in driven turbulent periodic boxes.
The Eulerian Virial Theorem (EVT) can be written as
| (1) | |||
| (2) |
where corresponds to the trace of the moment of inertia tensor :
| (3) |
with components
| (4) |
where is the mass density and is the -th component of the distance vector relative to the object’s centre of mass. Hence, denotes the second time-derivative of . Furthermore, is the time derivative of , which denotes the flux of through the surface of a given structure with a fixed volume ,
| (5) |
We emphasise that only occurs in Eq. 1 due to assuming the Eulerian reference frame. On the right hand side, is the gravitational binding energy,
| (6) |
which is calculated using the global gravitational potential . Therefore, in addition to the self-gravity of an object, also accounts for the tidal forces introduced by its surrounding mass distribution. Volume energy terms in Eq. 1 are identified by , where , , and are the thermal, kinetic, and magnetic volume energies, respectively, given as
| (7) | |||
| (8) | |||
| (9) |
Here, is the thermal pressure, is the velocity vector, and is the magnetic field vector of each cell inside . Surface terms in Eq. 1 are denoted as , where , , and are the thermal, kinetic, and magnetic surface terms, respectively. They are defined as
| (10) | |||
| (11) | |||
| (12) |
Here, is the outward pointing normal vector to the surface of . The kinetic tensor, , in Eq. 11 is given by
| (13) |
where denotes the outer product. The Maxwell stress tensor in Eq. 12, , is given by:
| (14) |
with the 3D identity matrix . Since it is easier to compute volume terms on the 3D grid, we convert the surface terms (Eqs. 5, 10, 11, and 12) to a volume integral formulation by applying Gauss’s law to the corresponding surface integrals. This is done to avoid the potentially intricate evaluation of surface quantities of the cells selected from the adaptive mesh. This conversion yields the following volume integrals:
| (15) | |||
| (16) | |||
| (17) | |||
| (18) |
where the addenda , , and cancel out the respective volume terms in (1). Note that in the course of the paper we use the surface term with their respective sign, as given in Eq. 2. For example, implies ram pressure confinement, while implies stabilisation by the magnetic surface term.
3 Numerical methods
3.1 Simulations
Our numerical setup is derived from the colliding flows setup described by Joshi et al. (2019). As base architecture, we use the AMR code Flash (Fryxell et al., 2010; Dubey et al., 2008) version 4.3. We solve the ideal MHD equations using the Bouchut 5-wave MHD solver (Bouchut et al., 2010; Waagan et al., 2011), and divergence cleaning to enforce . The gravitational potential is calculated by solving the Poisson equation by means of an octal-spatial tree method (Wünsch et al., 2018) with an opening angle .
We use a simple chemical network (Nelson & Langer, 1997) to track the formation of H2 (Glover & Jappsen, 2007) and CO (Glover et al., 2010) from the warm ISM. In particular, we follow atomic (H), molecular (H2), and ionized (H+) hydrogen, ionized carbon (C+), carbon-monoxide (CO), oxygen, and free electrons. We assume solar fractional abundances for C and O of and , respectively (Sembach et al., 2000). Molecular hydrogen is forming on the surface of dust grains (Hollenbach & McKee, 1989). We use a simple dust model based on a constant dust-to-gas mass ratio of 1:100.
For the photodissociation of , we use the model described in Walch et al. (2015) based on Glover et al. (2010). The strength of the uniform ISRF is times the Habing flux. The dust and gas temperatures are calculated when evaluating the chemical network. Typically, the dust is much colder than the gas (see below). The utilized cooling model was introduced by Glover et al. (2010) and refined by Glover & Clark (2012). It comprises the fine structure lines of , the rotational and vibrational lines of and OH, the Lyman- line of atomic H, and the energy transfer from gas to dust. In addition to the dissipation of kinetic energy into heat, the radiative heating model comprises CRs, soft X-rays, H2 formation heating, and photoelectric emission from small grains and polycyclic aromatic hydrocarbons. The CR ionization rate per hydrogen atom is assumed to be , with the resulting heating rate .
The dust is assumed to be in thermal equilibrium. The attenuation of the ISRF by dust is accounted for by applying an attenuation factor as given by Glover & Clark (2012). For this, the column density, , is estimated by means of the TreeRay/OpticalDepth module (Wünsch et al., 2018), a modification of the algorithm proposed by (Clark et al., 2012a).
3.2 Initial conditions
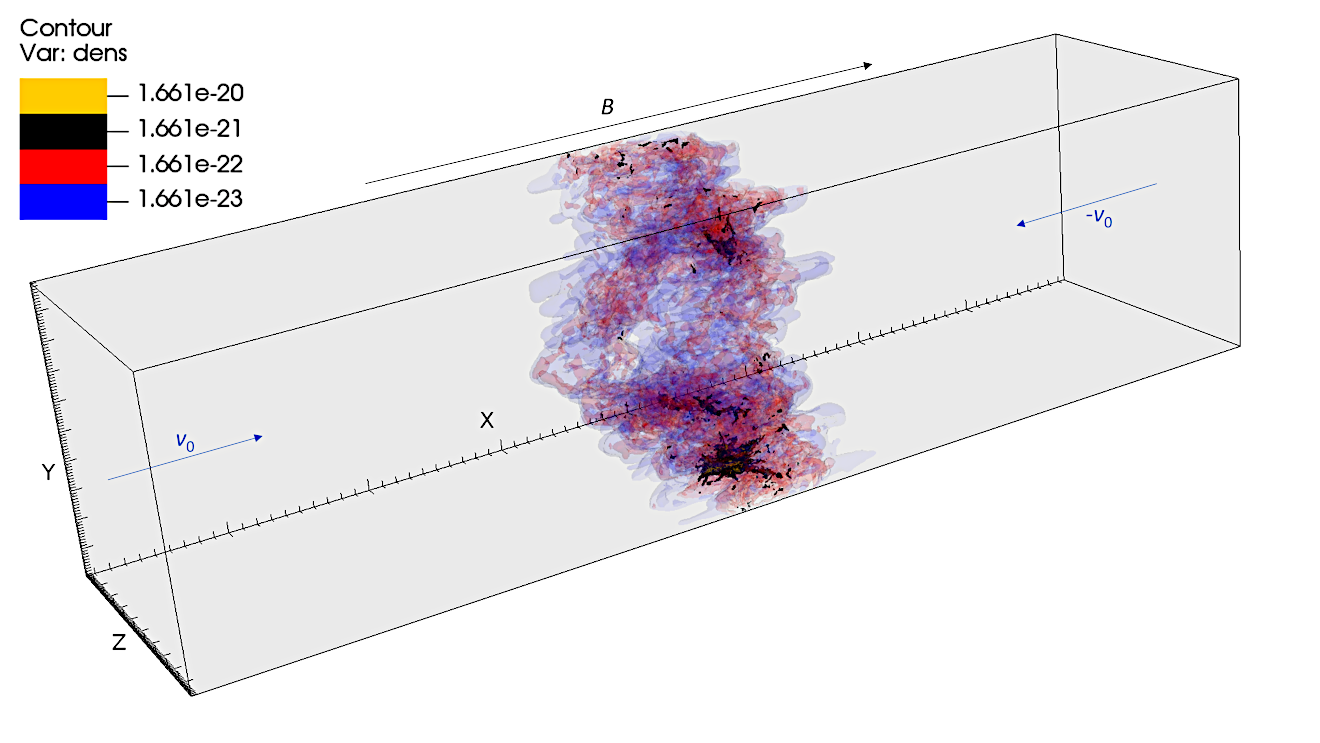
We use the colliding flow setup employed by Joshi et al. (2019), sketched in Fig. 1. The simulations use a rectangular domain measuring . The simulation domain is resolved by an adaptive mesh with a maximum spatial resolution of (i.e. 1615 AU), which, as we have shown in Joshi et al. (2019), enables a sufficiently converged model of CO formation. The refinement/derefinement process is controlled by resolving each cells’ local Jeans length by at least 8 times the cell size.
The gas filling the simulation domain has a uniform initial density of , a temperature of , and a chemical composition being in equilibrium at these conditions. The initial conditions are designed to approximate the warm neutral ISM.
We apply periodic boundary conditions along the - and -directions for MHD as well as gravity. Along the -direction, we apply isolated boundary conditions for gravity and an inflow MHD condition. Hereby, a steady inflow of mass is supplied through the respective boundary surfaces. The inflow and the corresponding initial -velocity inside the simulation domain are oriented towards a collision interface, separating the flow directions. We set the initial velocity as well as the constant inflow velocity at the -boundaries to . The initial collision interface is constructed from a plane at , that is then warped by the following -displacement to facilitate flow instabilities in its vicinity:
| (19) |
with , , , , and amplitude , corresponding to interface I5 in Joshi et al. (2019).
| Run | ||
|---|---|---|
| 0.04 | ||
| 5.37 | ||
| 10.74 | ||
| 21.49 |
We use a uniform initial magnetic field that is aligned with the -direction. Multiple simulations covering a range of initial magnetic field strengths from to are executed (see Table 1). The magnetic flux in our simulated volume remains constant, while the mass is increasing due to the inflow boundary conditions. The mass inflow per unit time is . The mass contained by the central dense sheet around the collisional interface grows approximately with the rate of inflow, as the sheet’s mass is supplied from the inflow. The critical mass-to-flux ratio of a flattened structure is (Nakano & Nakamura, 1978), where is the magnetic flux in our simulations. Hence, the time scale on which a magnetically critical amount of mass is acquired by the sheet via the mass inflow is
| (20) |
3.3 Clump and core detection
We consider two different types of molecular cloud substructures, which we term clumps and cores, the latter being a substructure of the first.
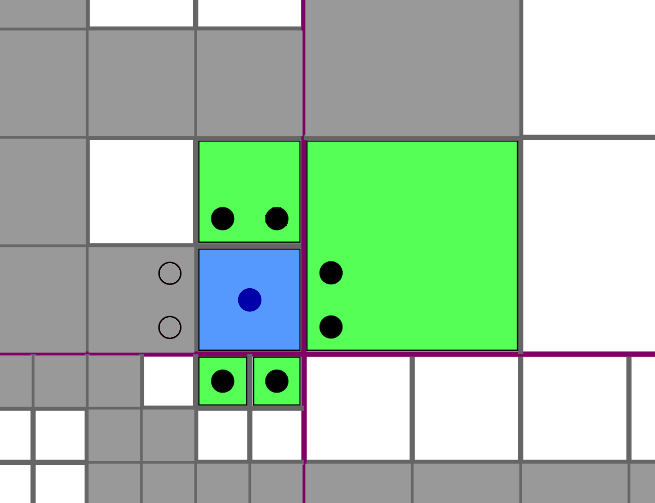
To identify clumps, we first select a set of suitable candidate cells from the AMR data. All clump candidate cells must have a local fractional abundance of CO of , which corresponds to approximately 70% of the carbon atoms being incorporated in CO molecules. We then apply a neighbour-based algorithm to identify connected subsets amongst all clump candidate cells. To extract connected structures, any two candidate cells are linked into the same group if they are direct neighbours of each other, that is they share at least a part of a cell face (on the 3D adaptive mesh neighbouring cells may have surface areas which differ by a factor 4). We note that for the used AMR implementation in the Flash code, neighbouring cells can never differ by more than one level of refinement, i.e. a factor of 2 in resolution.
An illustration of the corresponding search pattern for finding all neighbouring cells of a selected cell on the adaptive mesh is shown in Fig. 2. An iterative application of this simple algorithm then groups the connected cells into separate groups. A group is a set of cells, which are indirectly linked to each other by any number of neighbour-of-neighbour hops. If a group contains at least 100 cells it is saved as a clump. Otherwise it is discarded, as we consider structures smaller than 100 cells to be insufficiently resolved for further analysis.
To identify cores, we use a modified version of the clump detection algorithm. We consider all cells with , as for the clumps. We then further narrow the selection to the subset of cells with a 3D visual extinction of , above which the dense gas fraction has been found to scale linearly with the star formation rate (Lada et al., 2010; Heiderman et al., 2010). The same neighbour-based algorithm as for the clumps is then used to identify cores from that narrowed selection. Again, we discard structures smaller than 100 cells. The method that we use to calculate is discussed in Section A.
We also tested different methods to identify our cores. One approach is to replace the threshold by an gravitational acceleration threshold of . It is motivated by observing the threshold above which the gravitational acceleration is well correlated to the gas velocity, as could be expected for gravitationally dominated substructures with little turbulence. Obviously, this does not capture the inner part of some cores, as their gravitational field is not sufficiently sloped in vicinity of gravitational field minima. We remedy this by subsequently removing cavities inside the identified cores. This method, while vastly more complicated, performs similar to the adopted method described above. We also tried to detect cores by different density-thresholds, which interestingly failed to identify gravitationally bound structures.
4 Results
4.1 Evolution of the sheet morphology & molecular gas fraction
As a function of time, a dense sheet builds up near the collision interface, where the gas is pushed together by the opposing flows of warm neutral medium. The increased density leads to a thermal instability and the gas starts to cool down and become molecular. Further instabilities arise due to the irregular collision interface and turbulence develops (see Heitsch et al., 2009, for a discussion of the different instabilities arising in perturbed colliding flows).
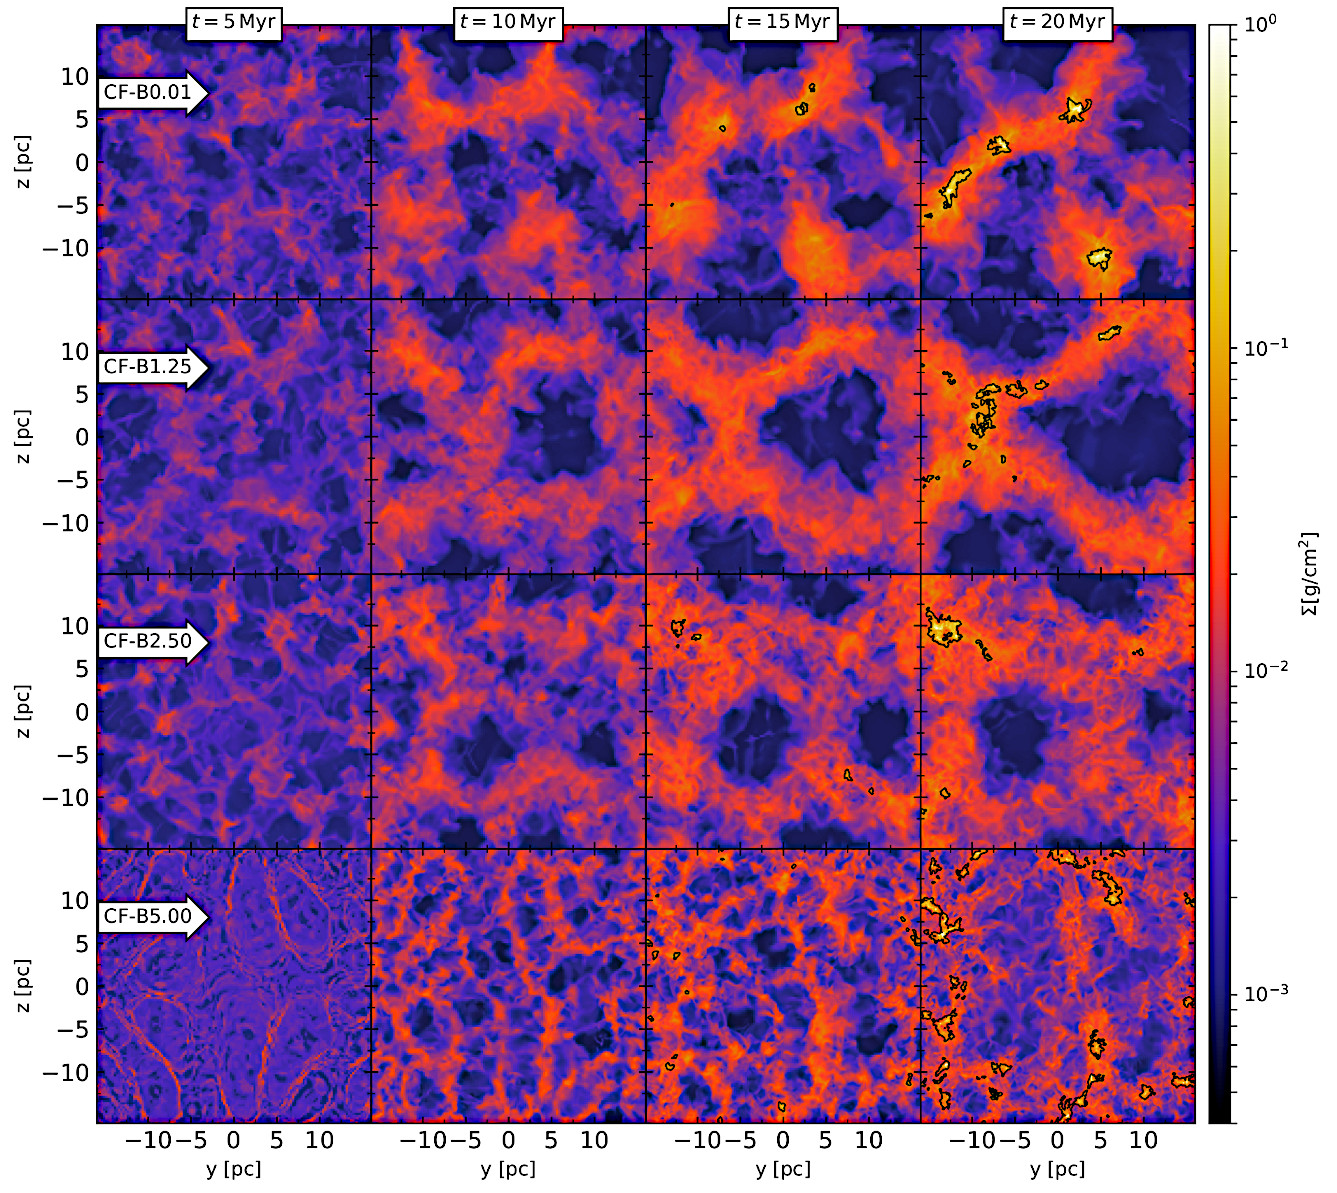
The sheet’s thickness and its density contrast, as well as the time of the MC buildup, depend on the initial magnetic field strength. In Fig. 3 we show the column density distribution of all simulations, as integrated along the inflow direction for four different times between 5 Myr and 20 Myr (left to right panels). In the runs with a weak magnetic field (top), a network of dense filamentary structures is forming. Within the filaments, molecular clumps are slowly accumulated (as indicated by the black contours; the first clumps appear after Myr). With increasing magnetic field strength, the formed filaments are less pronounced. In particular for simulation (bottom row) the colliding flow approaches a thick, relatively uniform sheet modulo smaller-scale density fluctuations (see also Fig. 22). The resulting clumps are distributed more evenly within the -plane than in the other runs. The compact column density features are at least three orders of magnitude denser than the initial flow column density of . At later times, there is a significant fraction of gas above the suggested star formation threshold column density of (corresponding to a visual extinction of mag, above which the dense gas fraction has been found to scale linearly with the star formation rate (Lada et al., 2010; Heiderman et al., 2010) ; orange colour in Fig. 3) above which the dense gas fraction has been found to scale linearly with the star formation rate (Lada et al., 2010; Heiderman et al., 2010). Some structures even reach , which is the suggested column density threshold for massive star formation (Krumholz & McKee, 2008) and which corresponds to the column density where the gas approximately becomes optically thick to its cooling radiation (if the geometry allows for it).

In Fig. 4 (top) we show the mass-weighted temperature probability distribution function (PDF) of all gas for the runs with different magnetic field strength at four different times (5–20 Myr). The prominent peak at K shows the inflowing gas, and a second peak of cold gas develops at K. For increasing magnetic field strength, gas motions perpendicular to the magnetic field direction are increasingly suppressed. Thus, gas mixing is less efficient for the high magnetization simulations. This leads to less gas in the thermally unstable regime (between 300–4000 K) (Seifried et al., 2011). In this regime there is not clear trend with magnetic field strength.

The top panel of Fig. 5 shows the evolution of the total amount of molecular mass in the simulation domain over time. The formation of H2 (dash-dotted) begins at around in all simulations. The amount of molecular gas differs because the sheets substructures are different, leading to different shielding properties (see Fig. 19, which shows the three-dimensional visual extinction -PDF for the computational domain; the algorithm that is used to calculate for every grid cell is detailed in the Appendix A). Particularly, run has the highest molecular gas fraction as the almost uniform sheet protects the molecules inside from the dissociating radiation coming from all directions. The formation of CO (top panel, solid lines) begins later at around . The bottom panel shows the total amount of gas at number densities of (dash-dotted lines) and (solid lines). While there is no simple correlation between the CO formation and the ambient magnetic field strength, the mass of the formed CO follows the amount of dense gas above , like already observed by Seifried et al. (2017). CO formation is slowest for simulation .
Overall, the formation of CO sets in later than expected from the column density maps, which already show structures with at . The reason is that the projected column density always overestimates the local column density experienced by any given cell in the complex, fractal 3D structure (see also Haid et al., 2019). However, it is the latter one, , which is relevant for the shielding and hence protection of the molecules from the dissociating interstellar radiation field.
4.2 Formation of clumps and cores
We apply the clump and core detection algorithms described in Section 3.3 on all simulation data snapshots, which have been recorded in steps of .

The time evolution of the resulting sets of detected objects is shown in Fig. 6. The first clumps are detected around . The total mass in clumps (top panel) increases over time, in agreement with the growing amount of CO. For the lower magnetization simulations up to , the number of clumps (second panel from the top) fluctuates between 10 and 30 clumps, as clumps frequently form and disperse. This is in agreement with the findings of Dib et al. (2007) who discuss the clumps as transient features in the turbulent flow. The highest magnetization simulation , forms considerably more clumps than the other simulations. However, the average mass of those clumps (third panel from the top) is similar to that of simulation , while there is a steep growth of the average clump mass in the low magnetization simulation , which exceeds after .
The first cores are detected around . Generally, the evolution of the core mass is similar to that of the clump mass, delayed by a few Myr. By definition of the detection parameters, the cores represent sub-domains of the identified clumps. Hence, their overall mass is always smaller than that of the containing clumps. The average core mass is often higher than the average clump mass because the lighter clumps do not contain any cores while many of the heavier clumps contain one core that incorporates a large fraction of the parental clump mass. The number of cores fluctuates due to the merging of cores rather than their dissipation. Hence, in our simulations cores are generally not transient features (contrary to Dib et al., 2007) as we will discuss in more detail later on. At , close to the end of the simulations, the majority of the mass in clumps is concentrated in the cores (see bottom panel), the only exception being run .
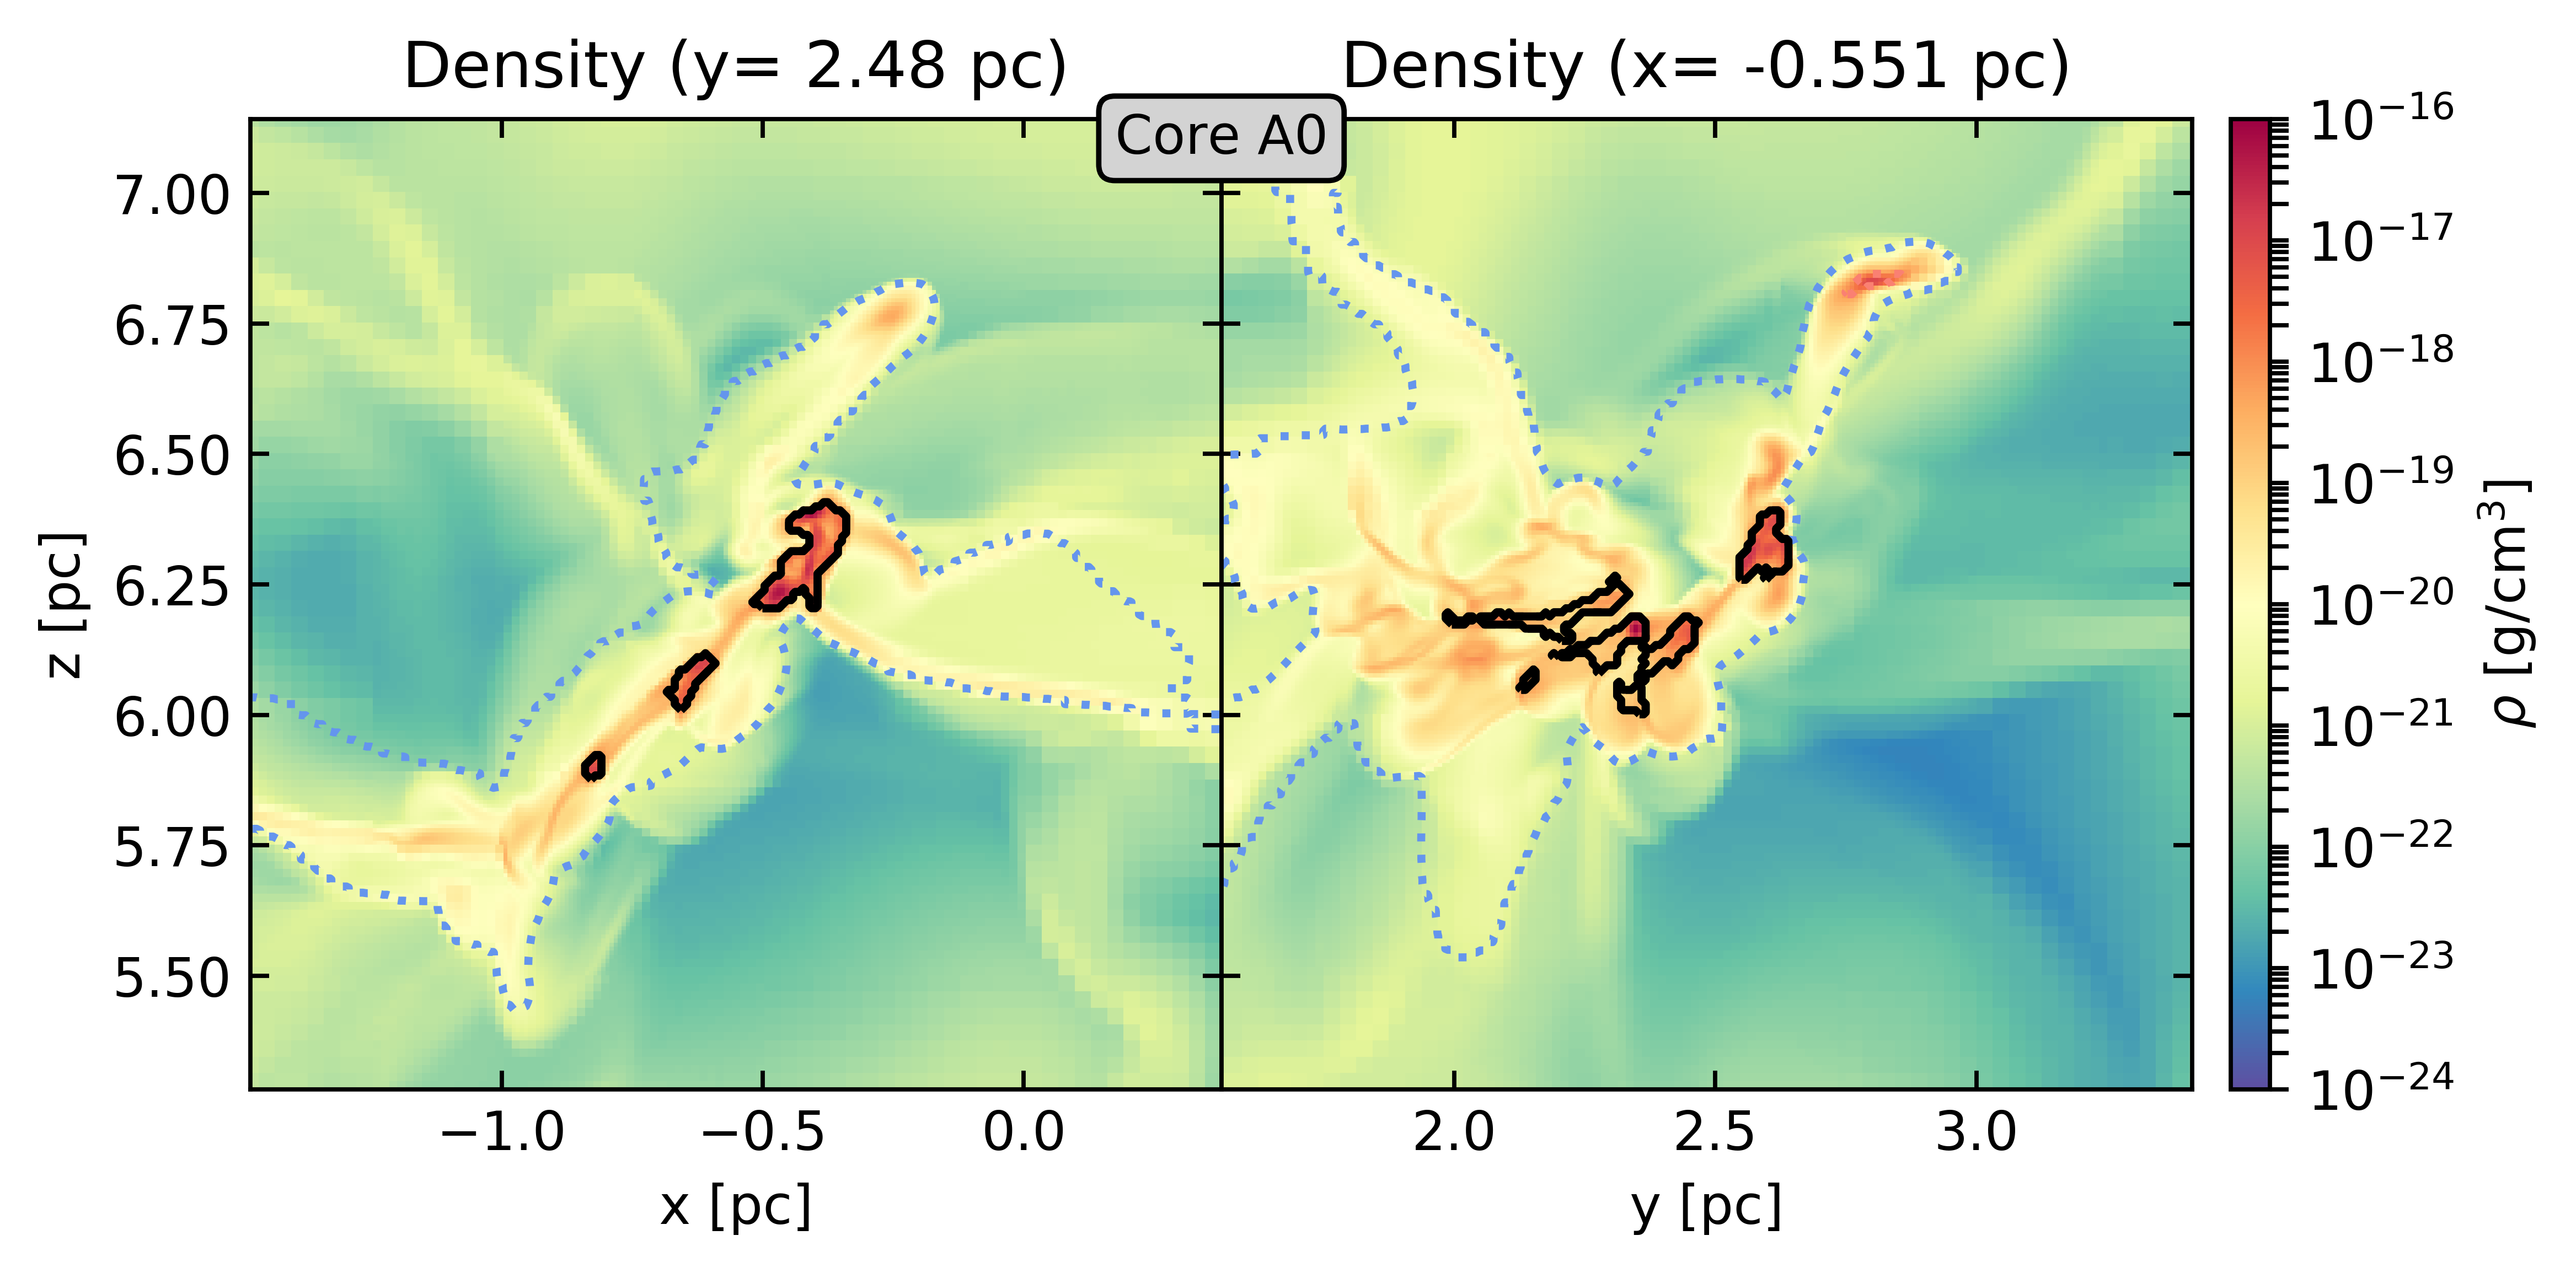
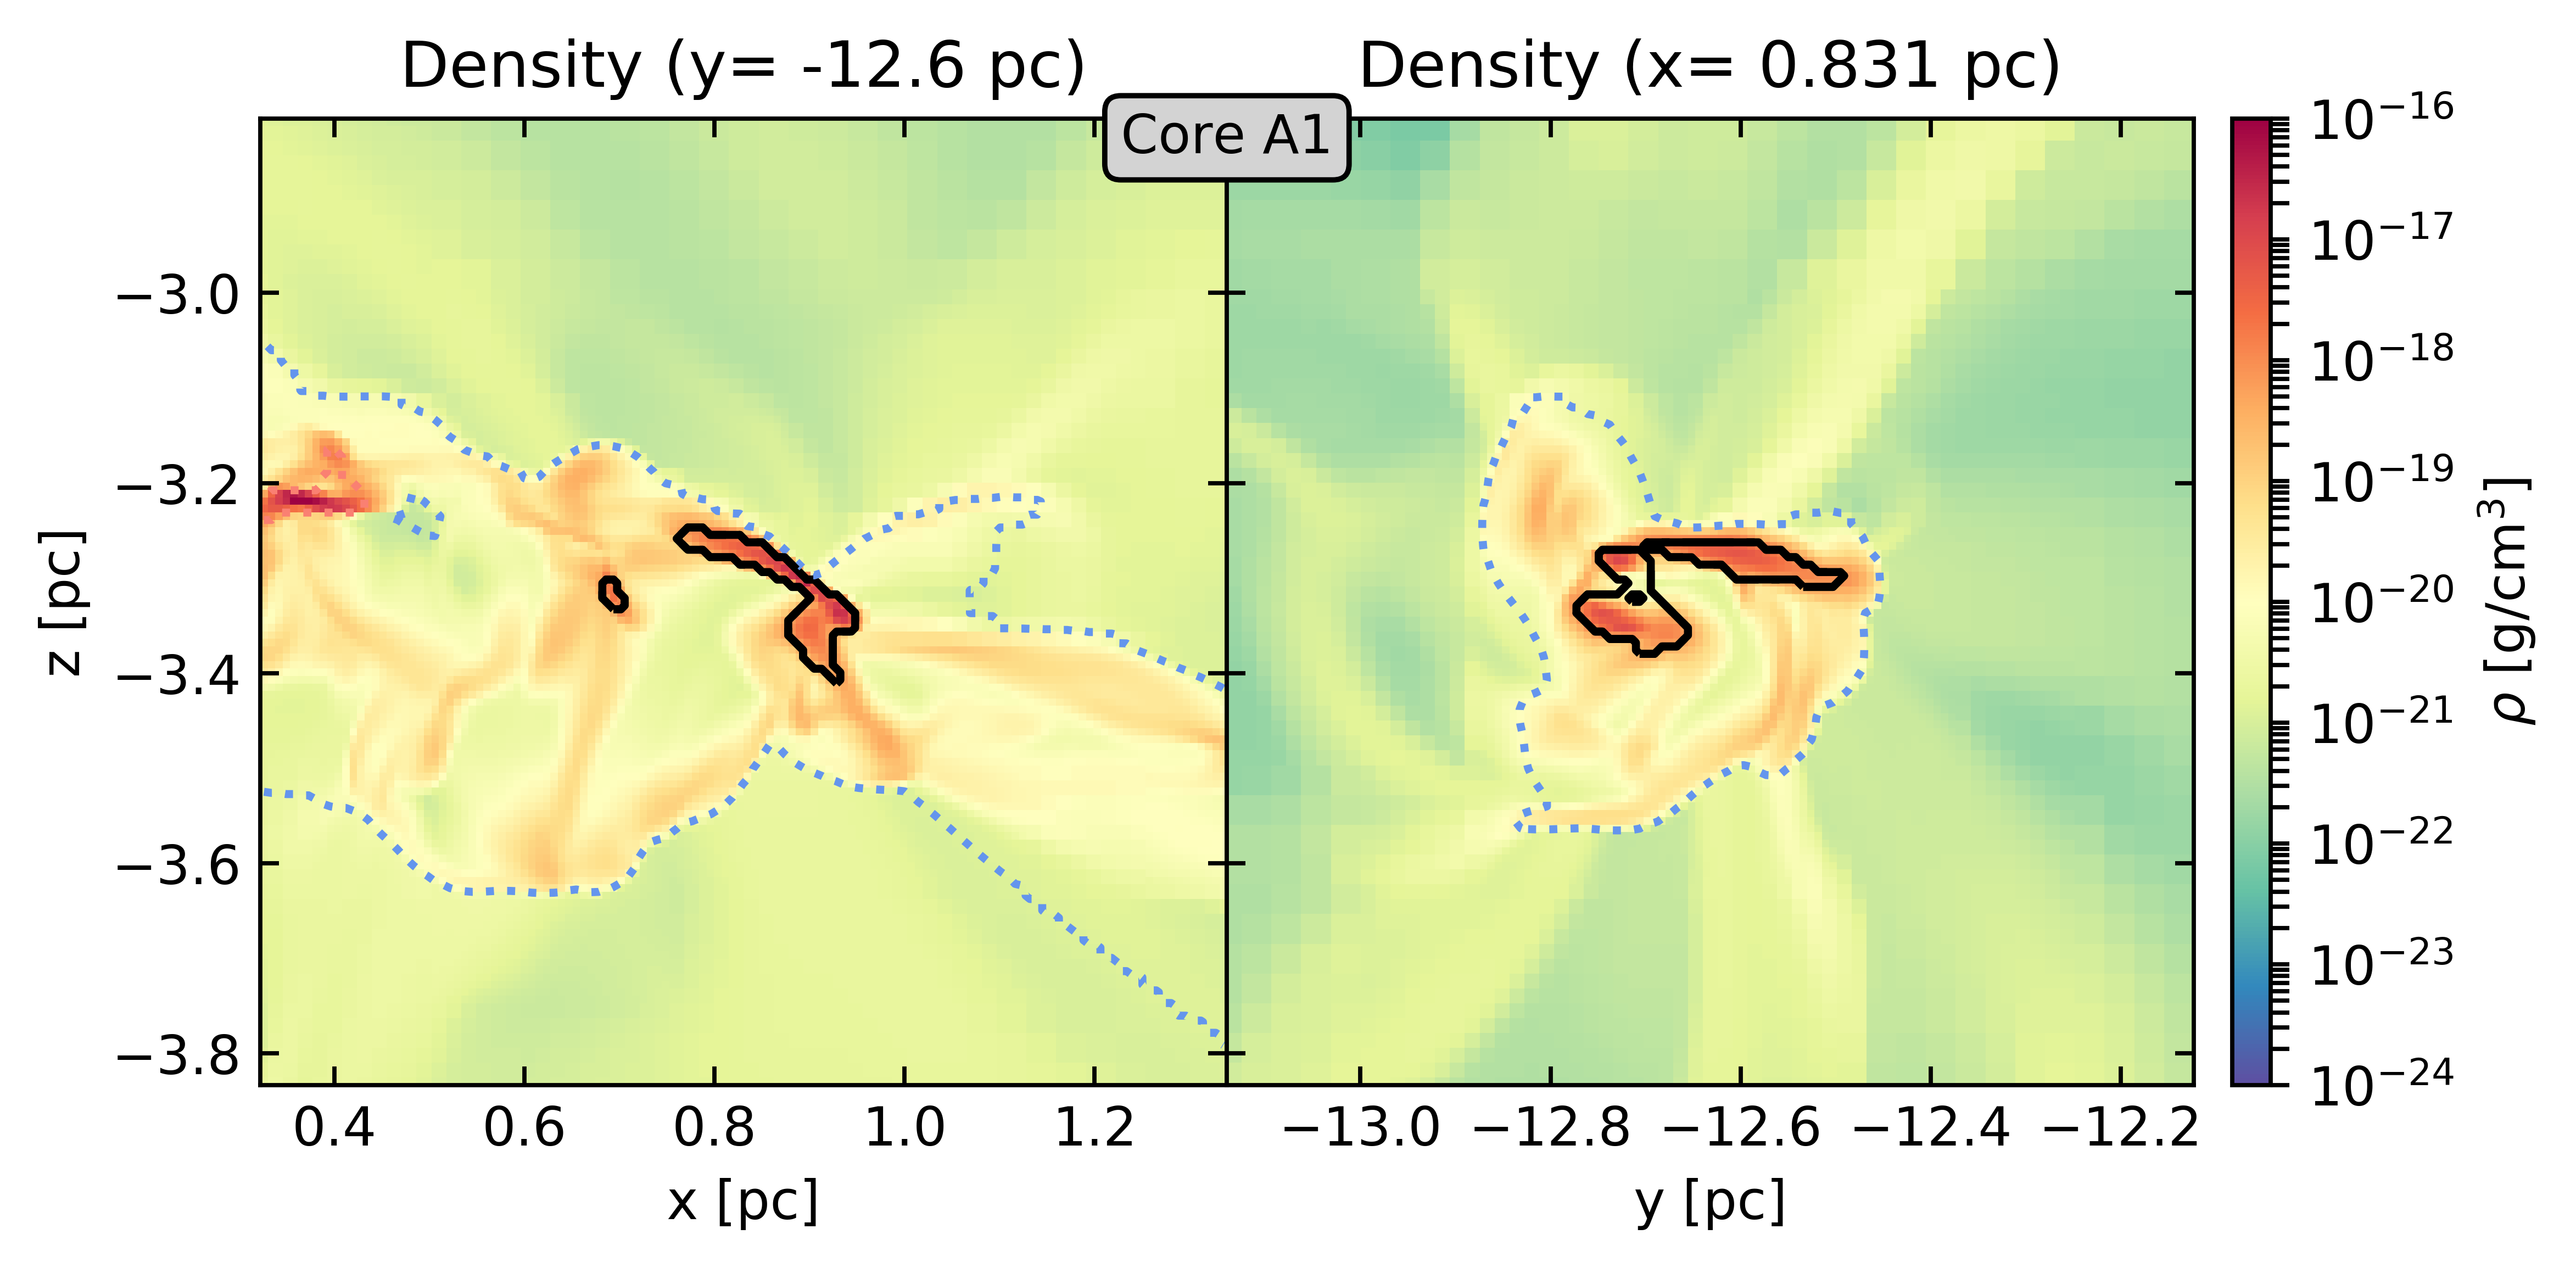
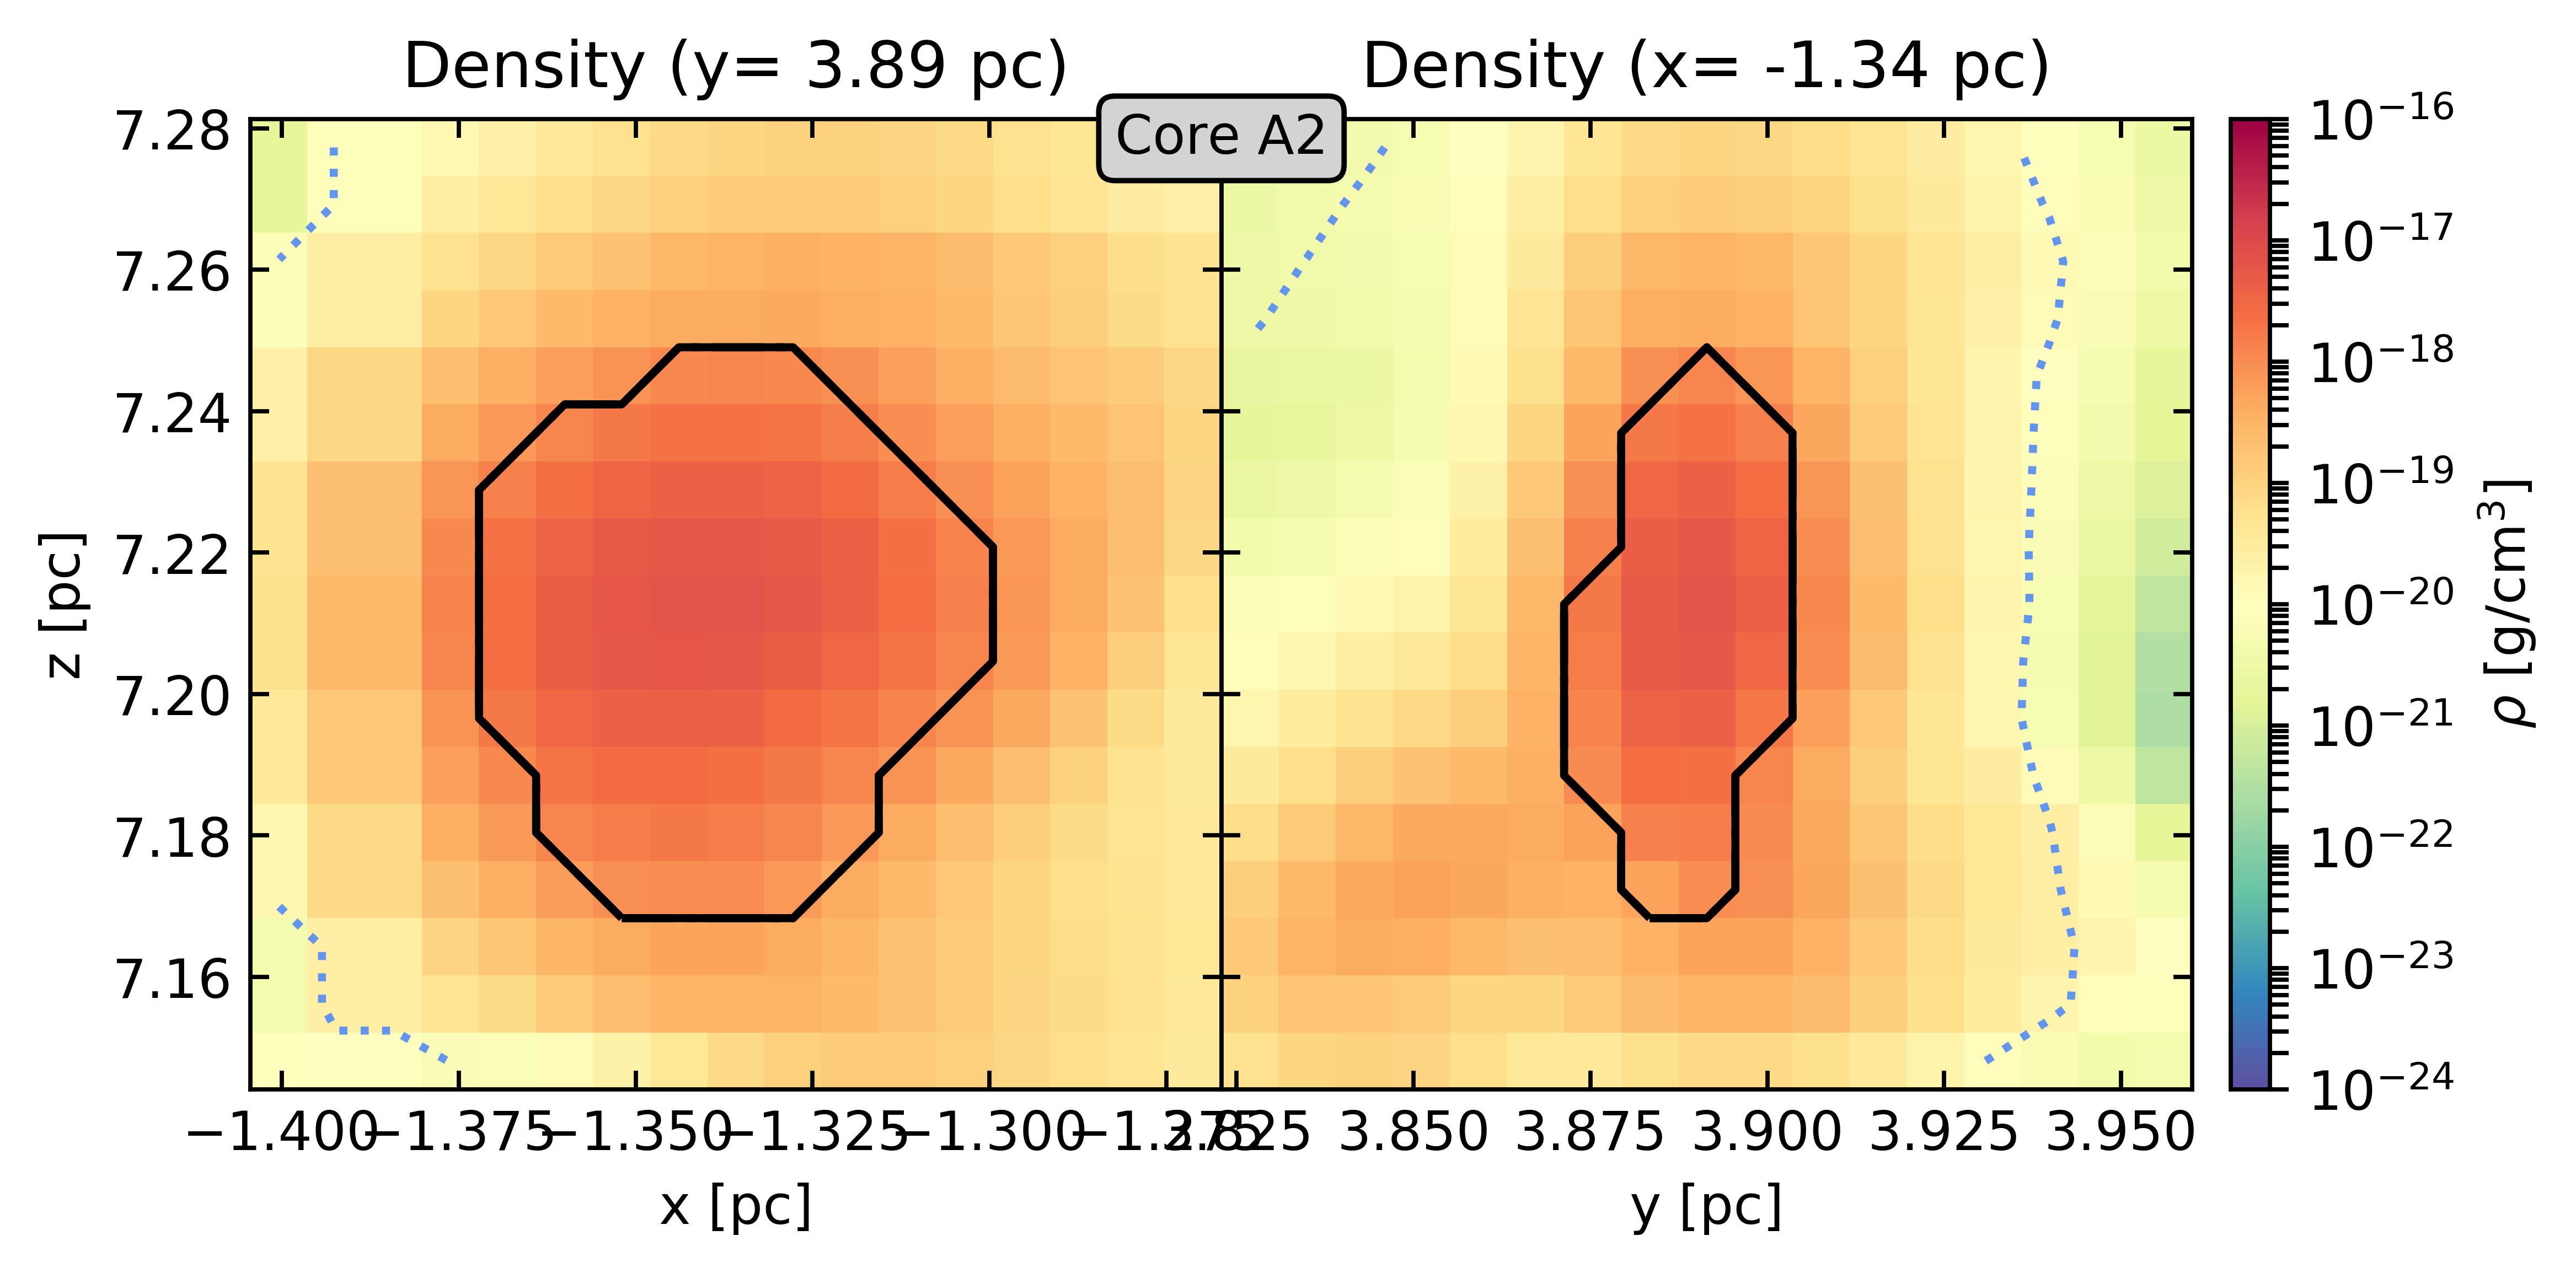
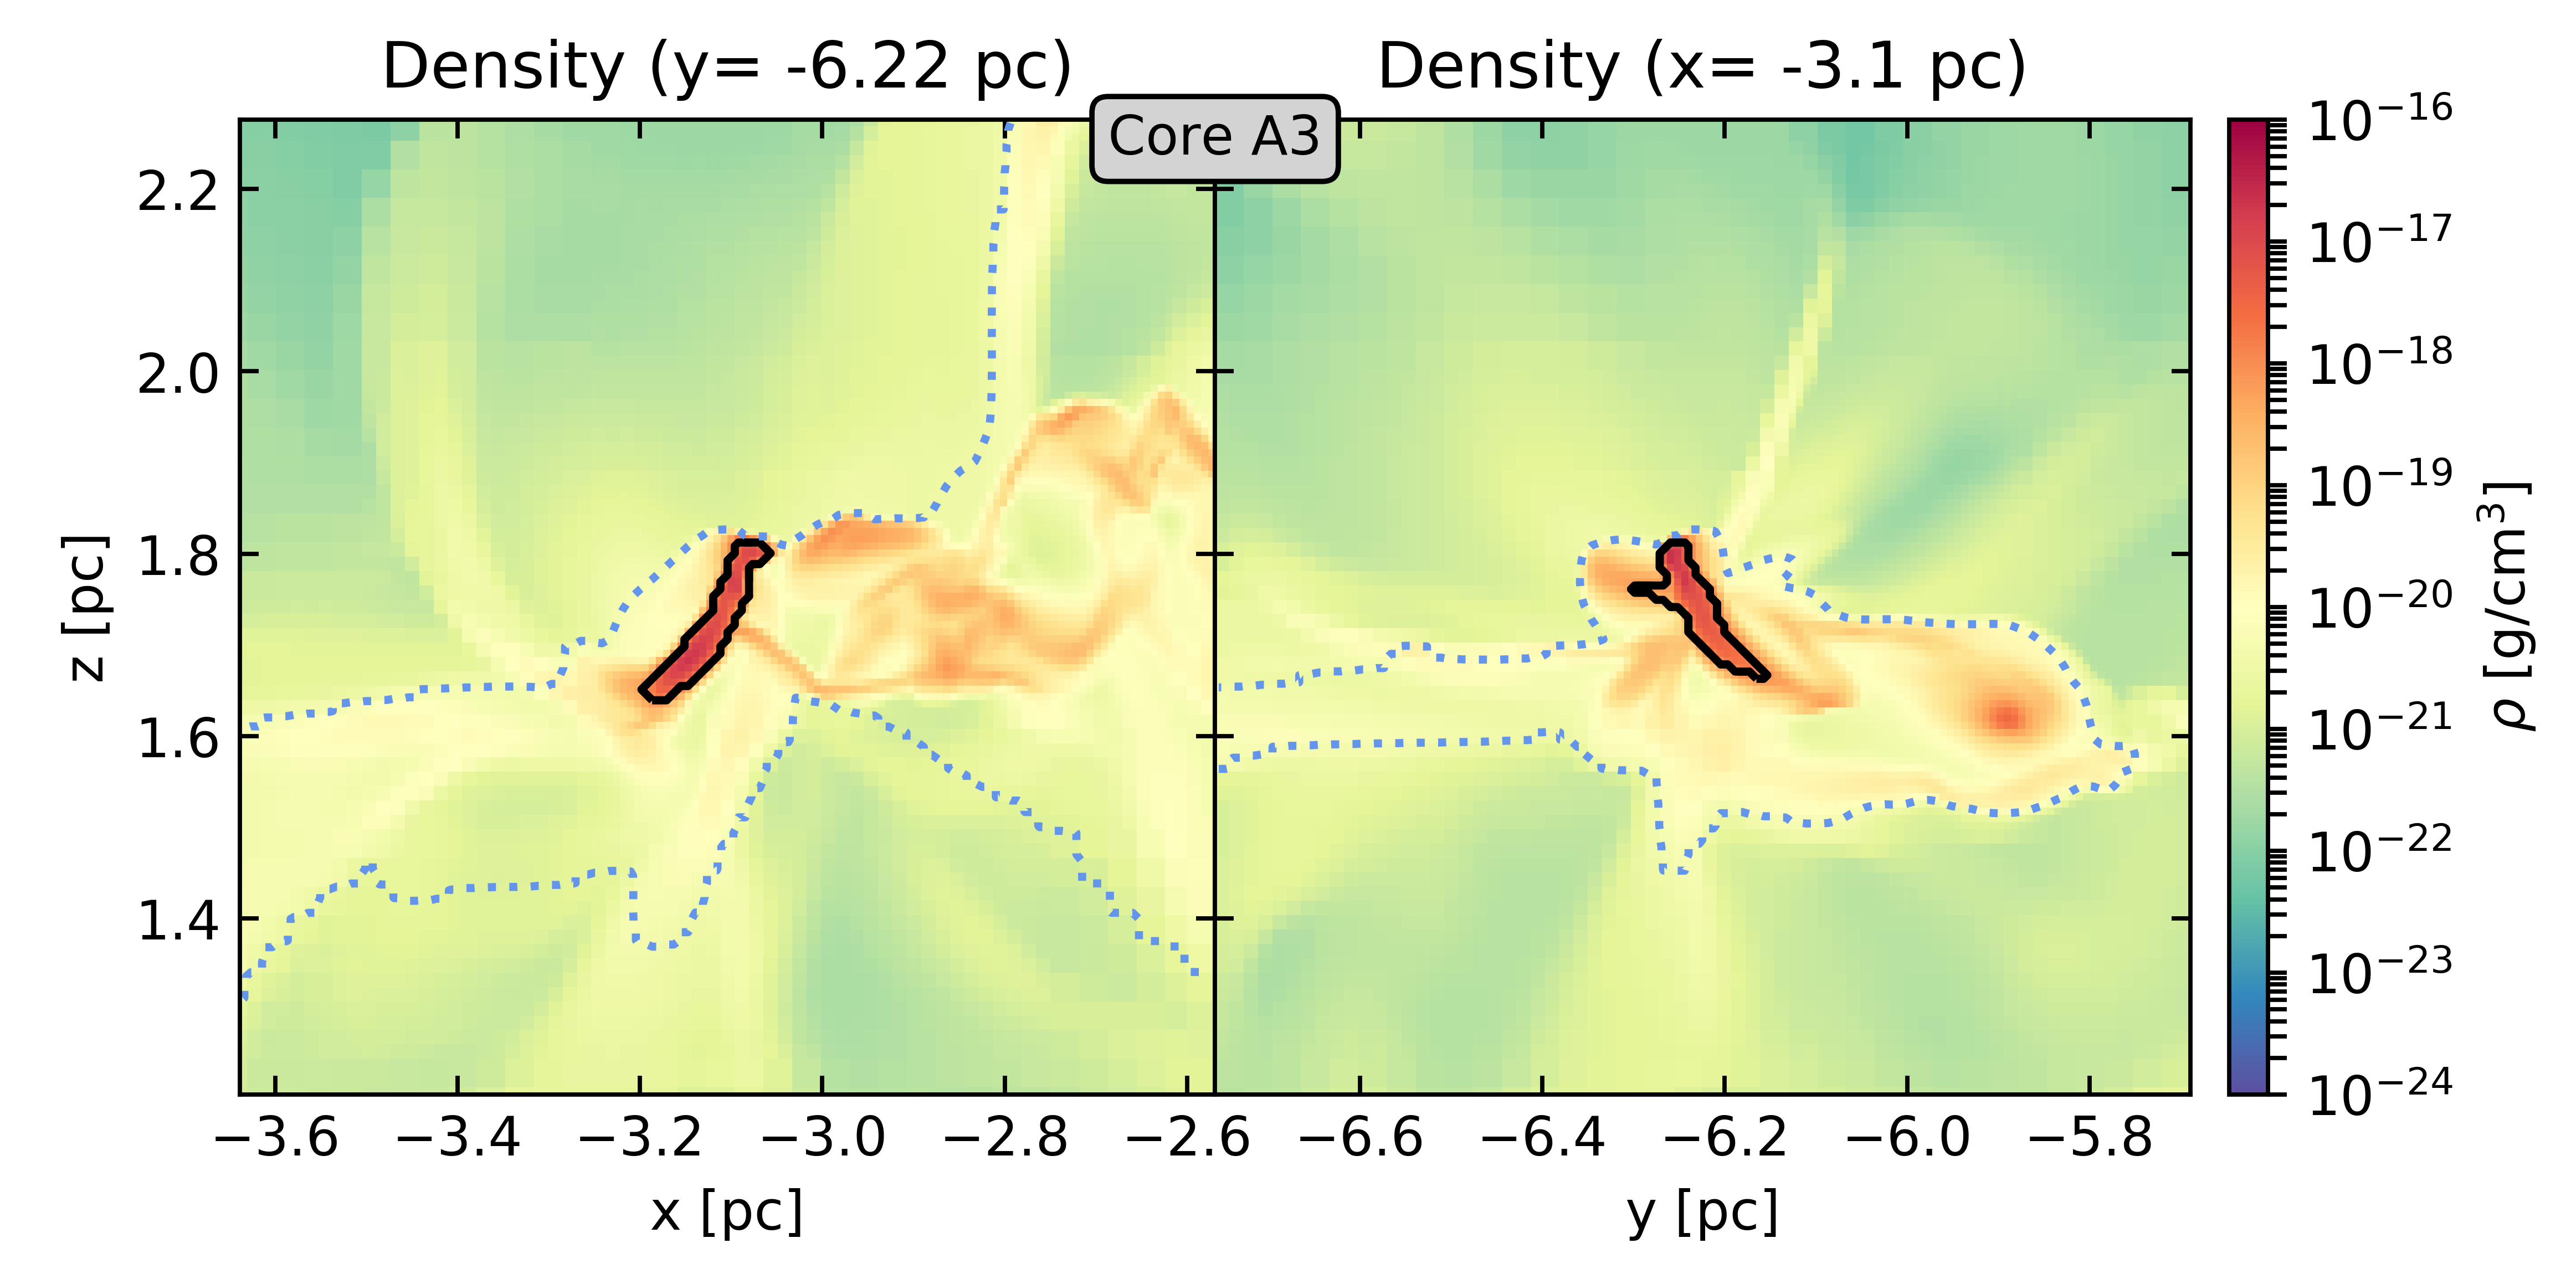
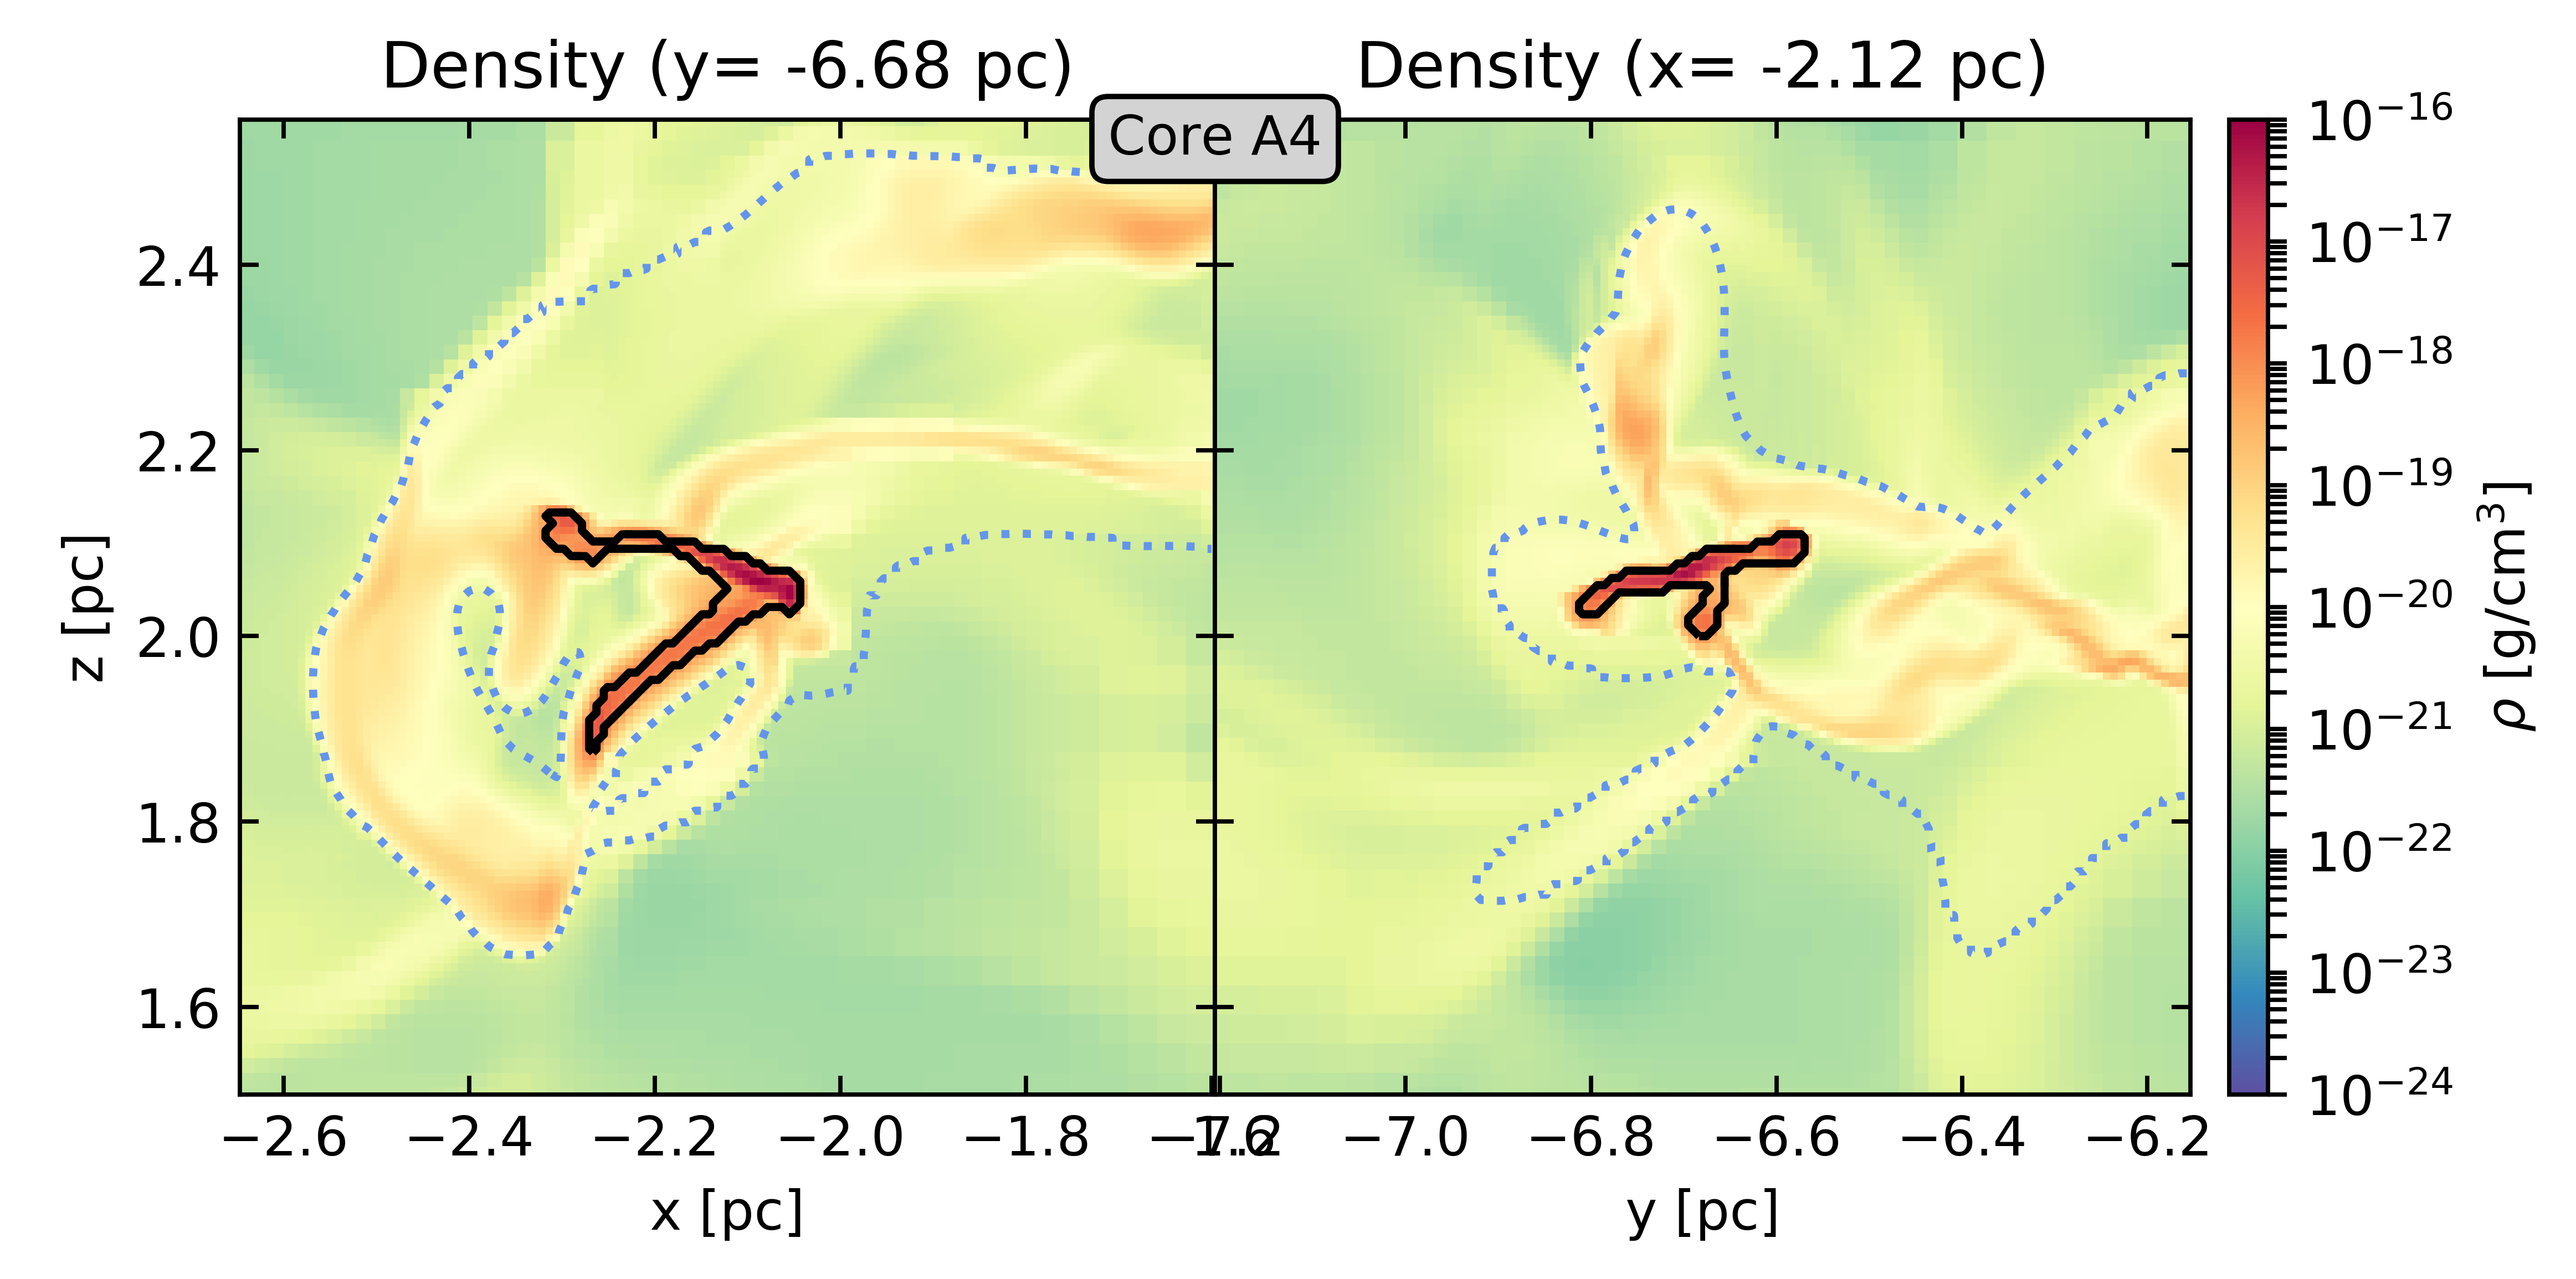
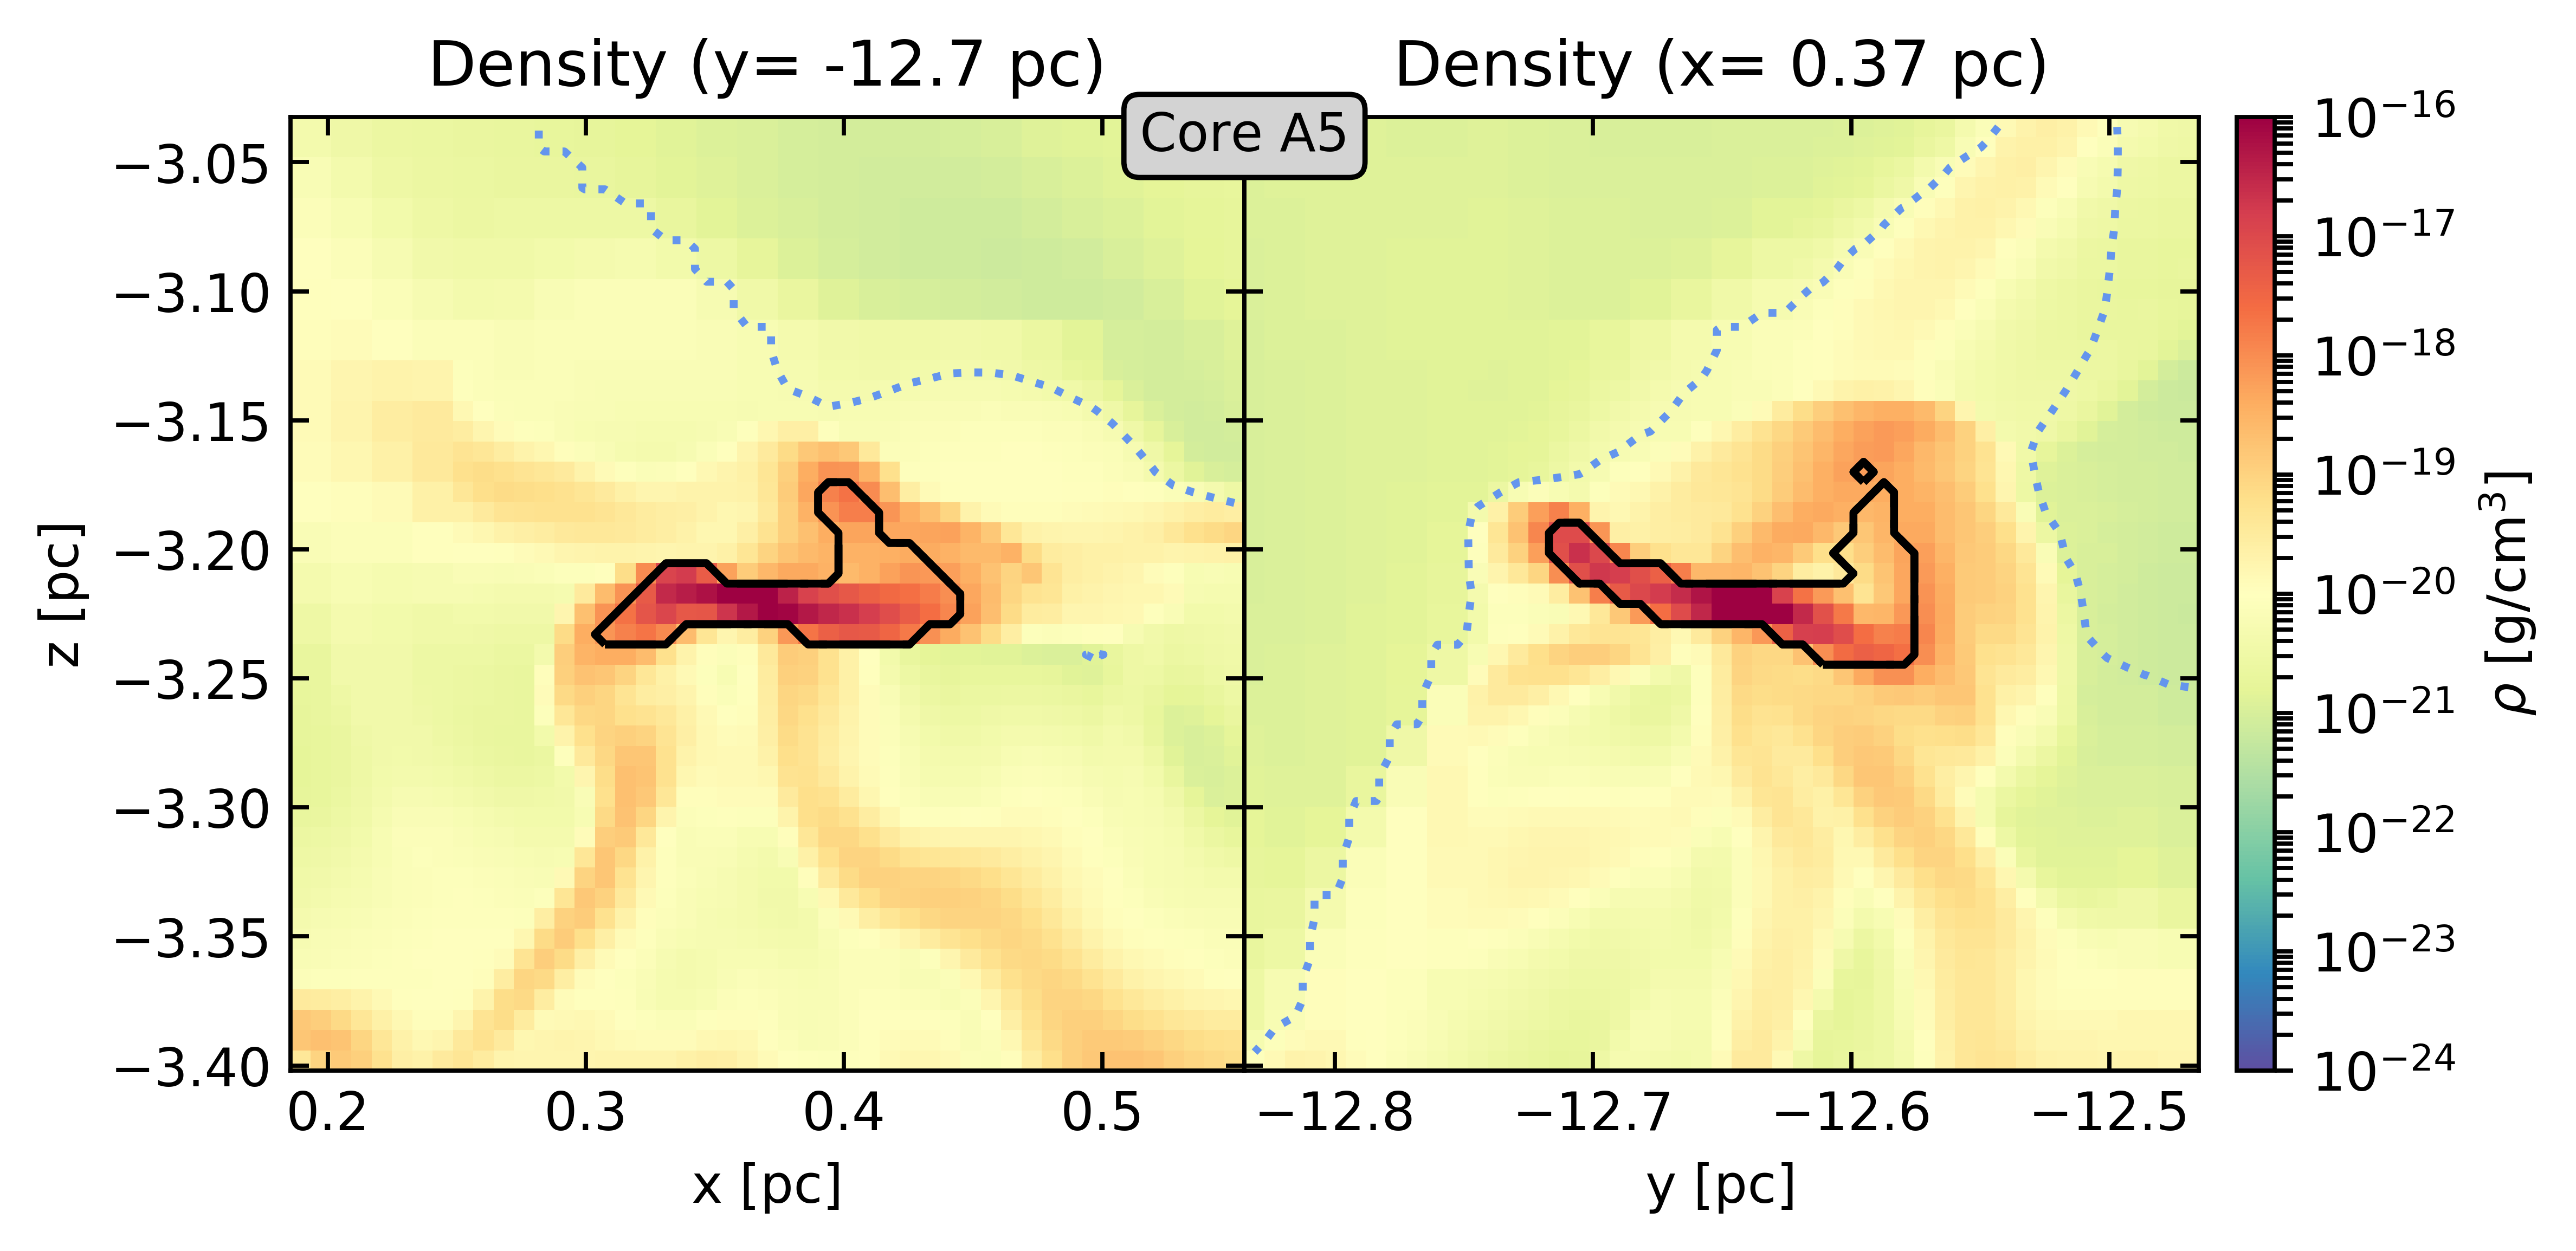
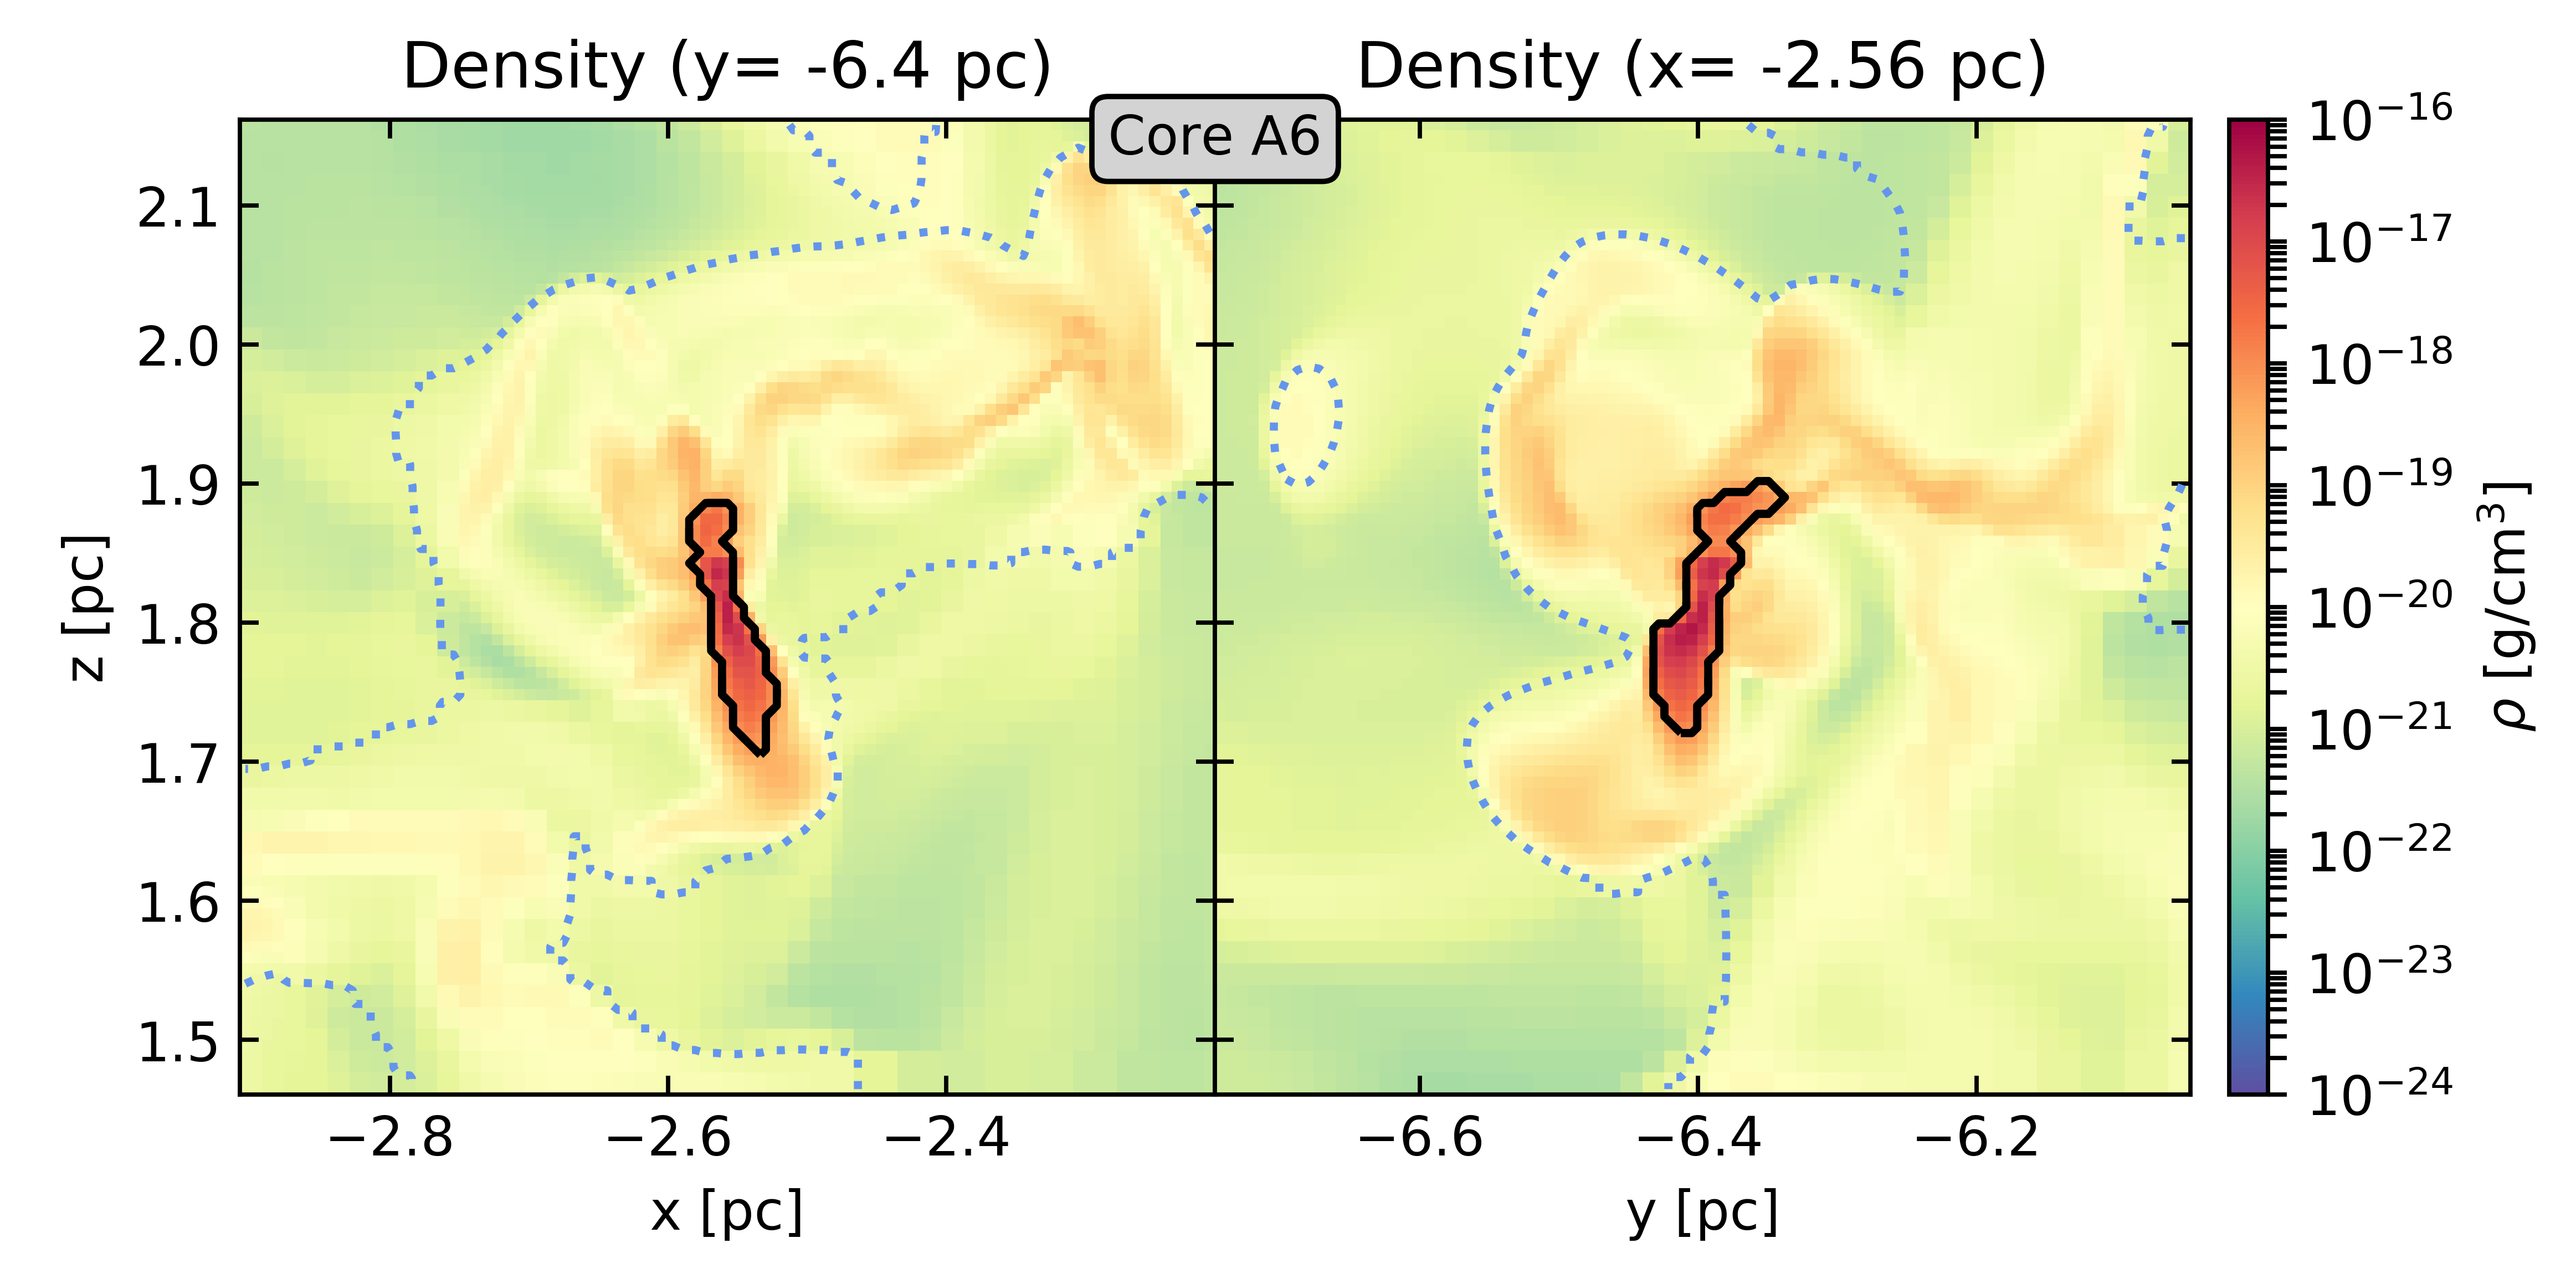
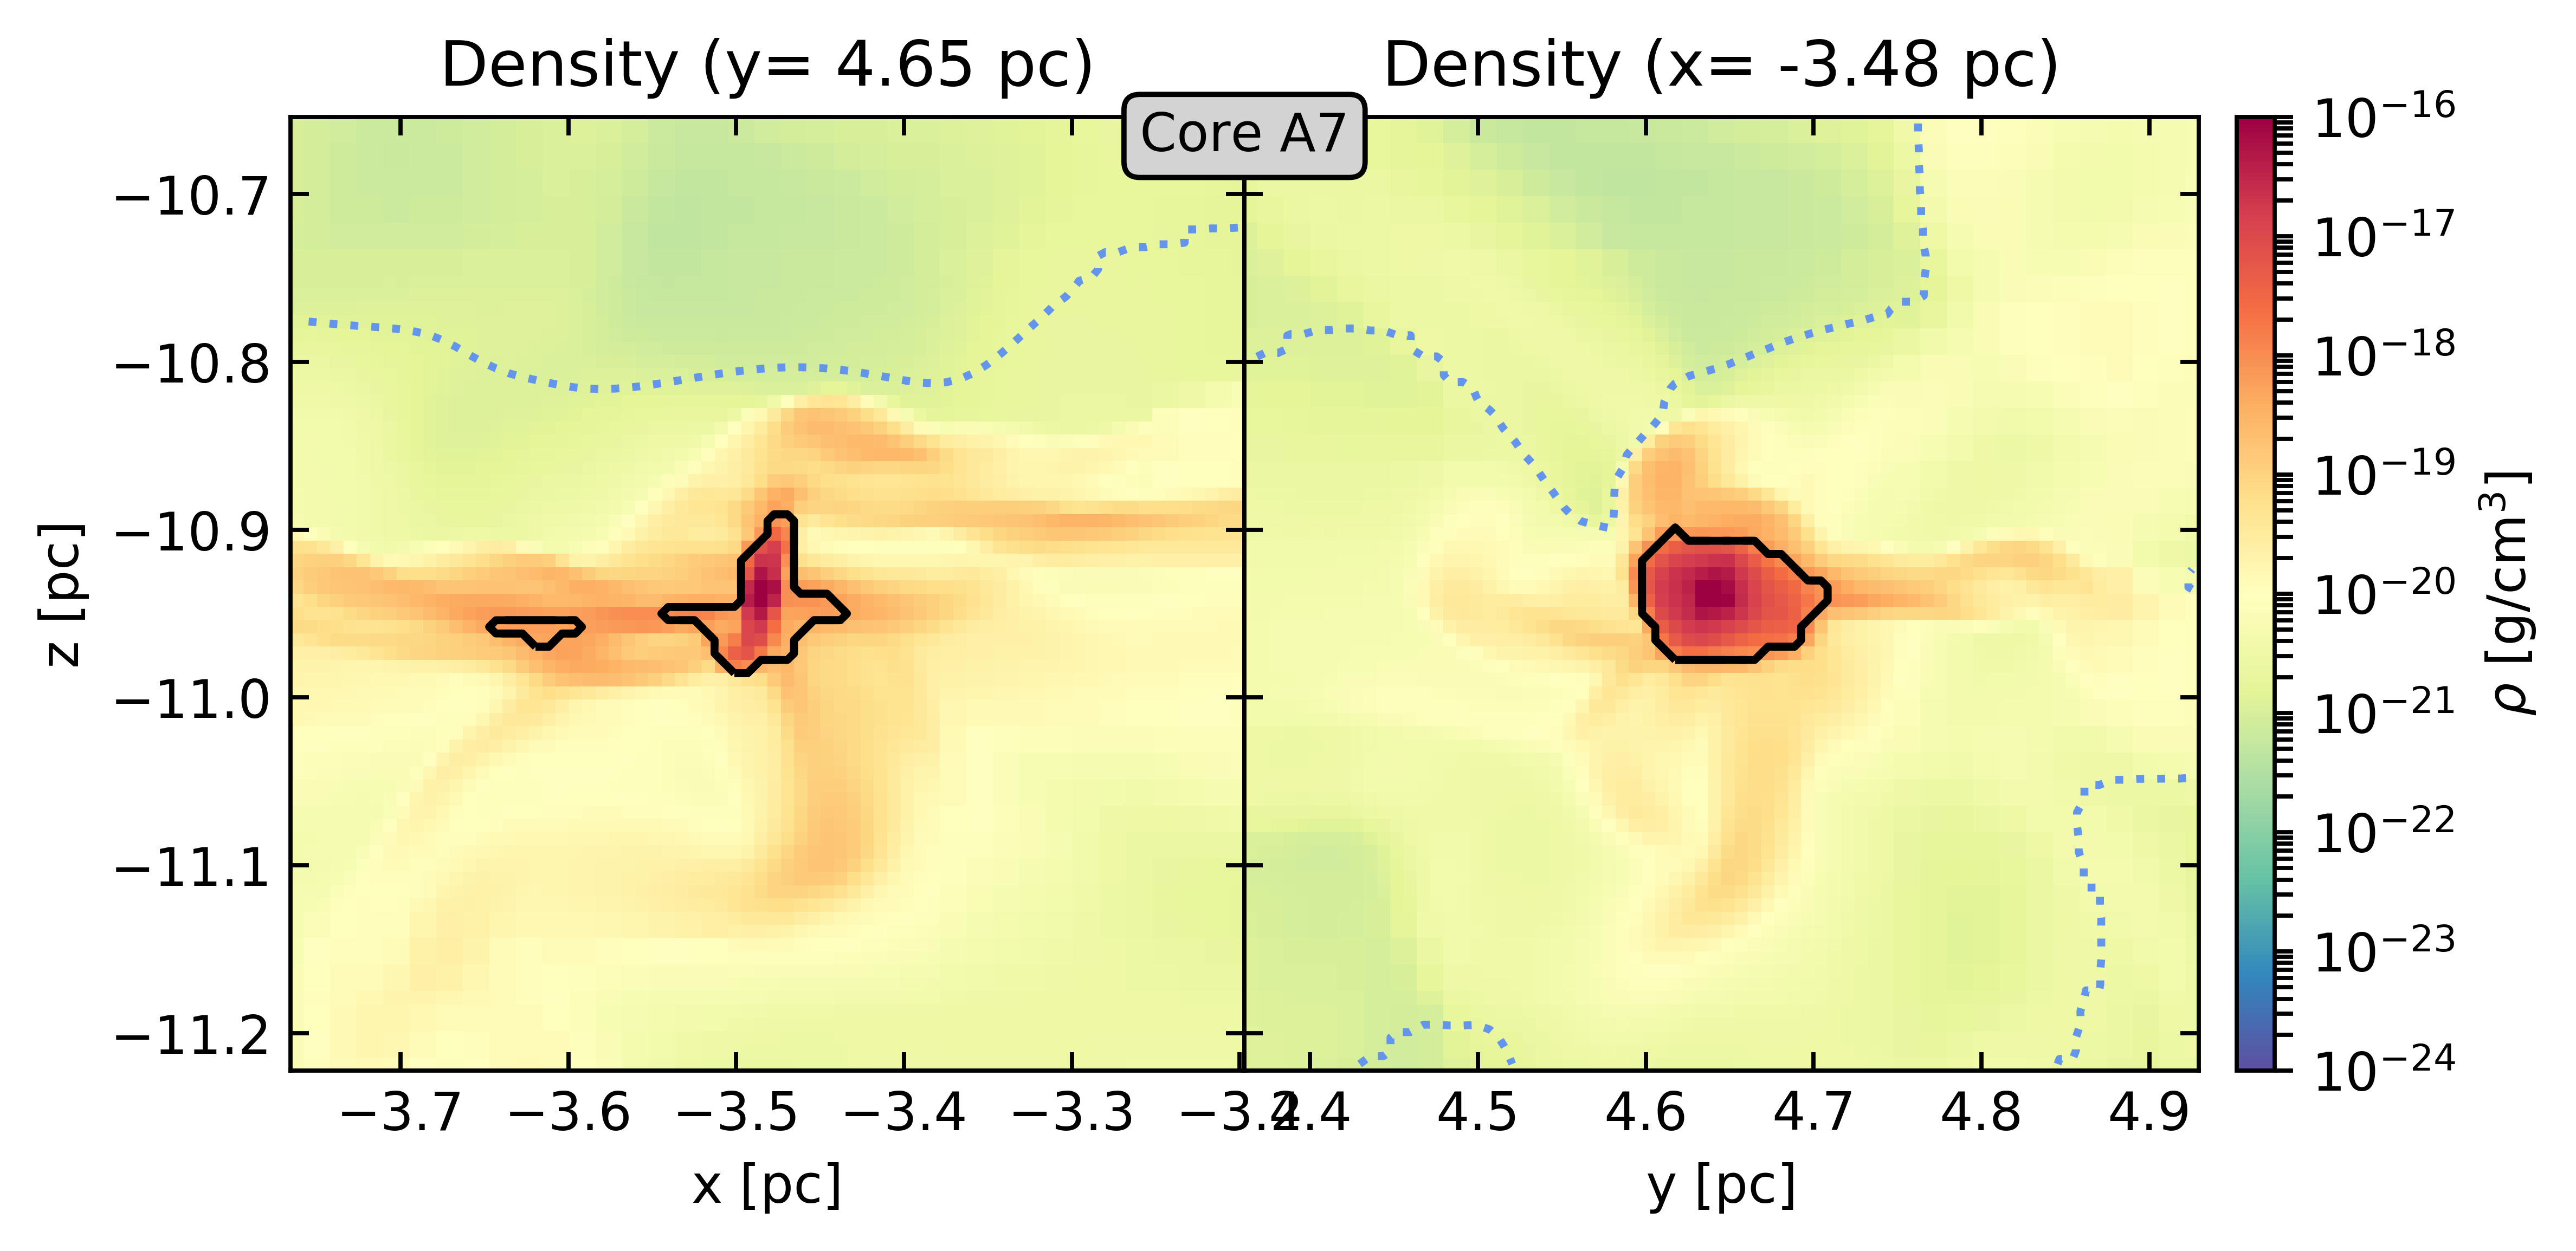
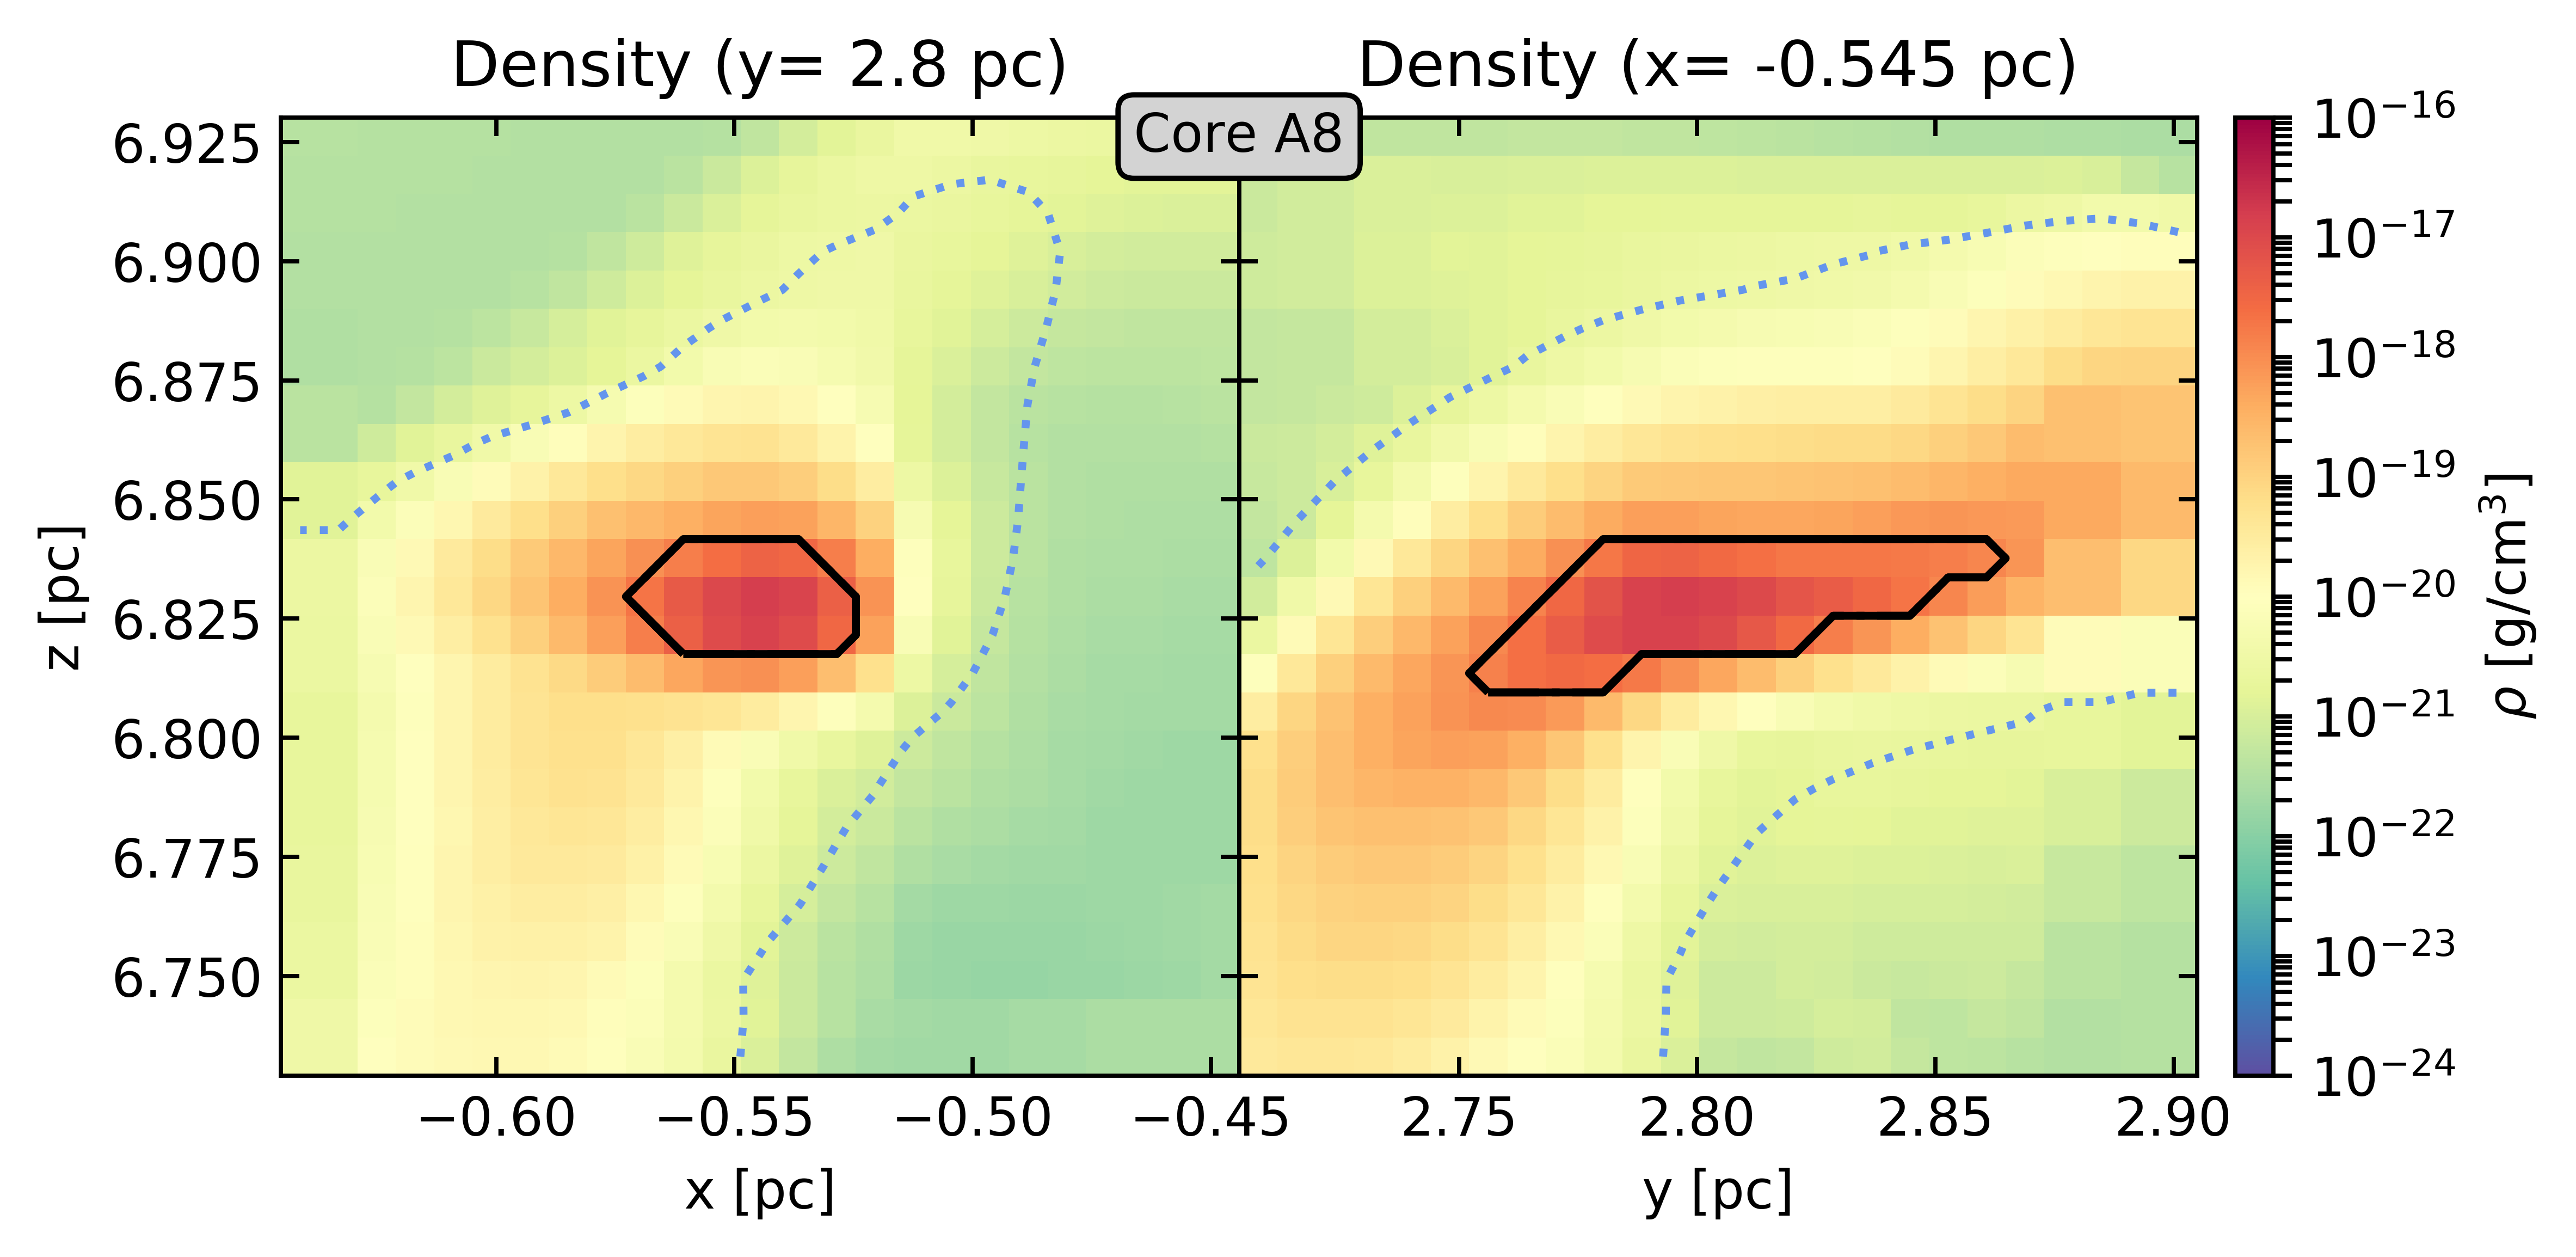
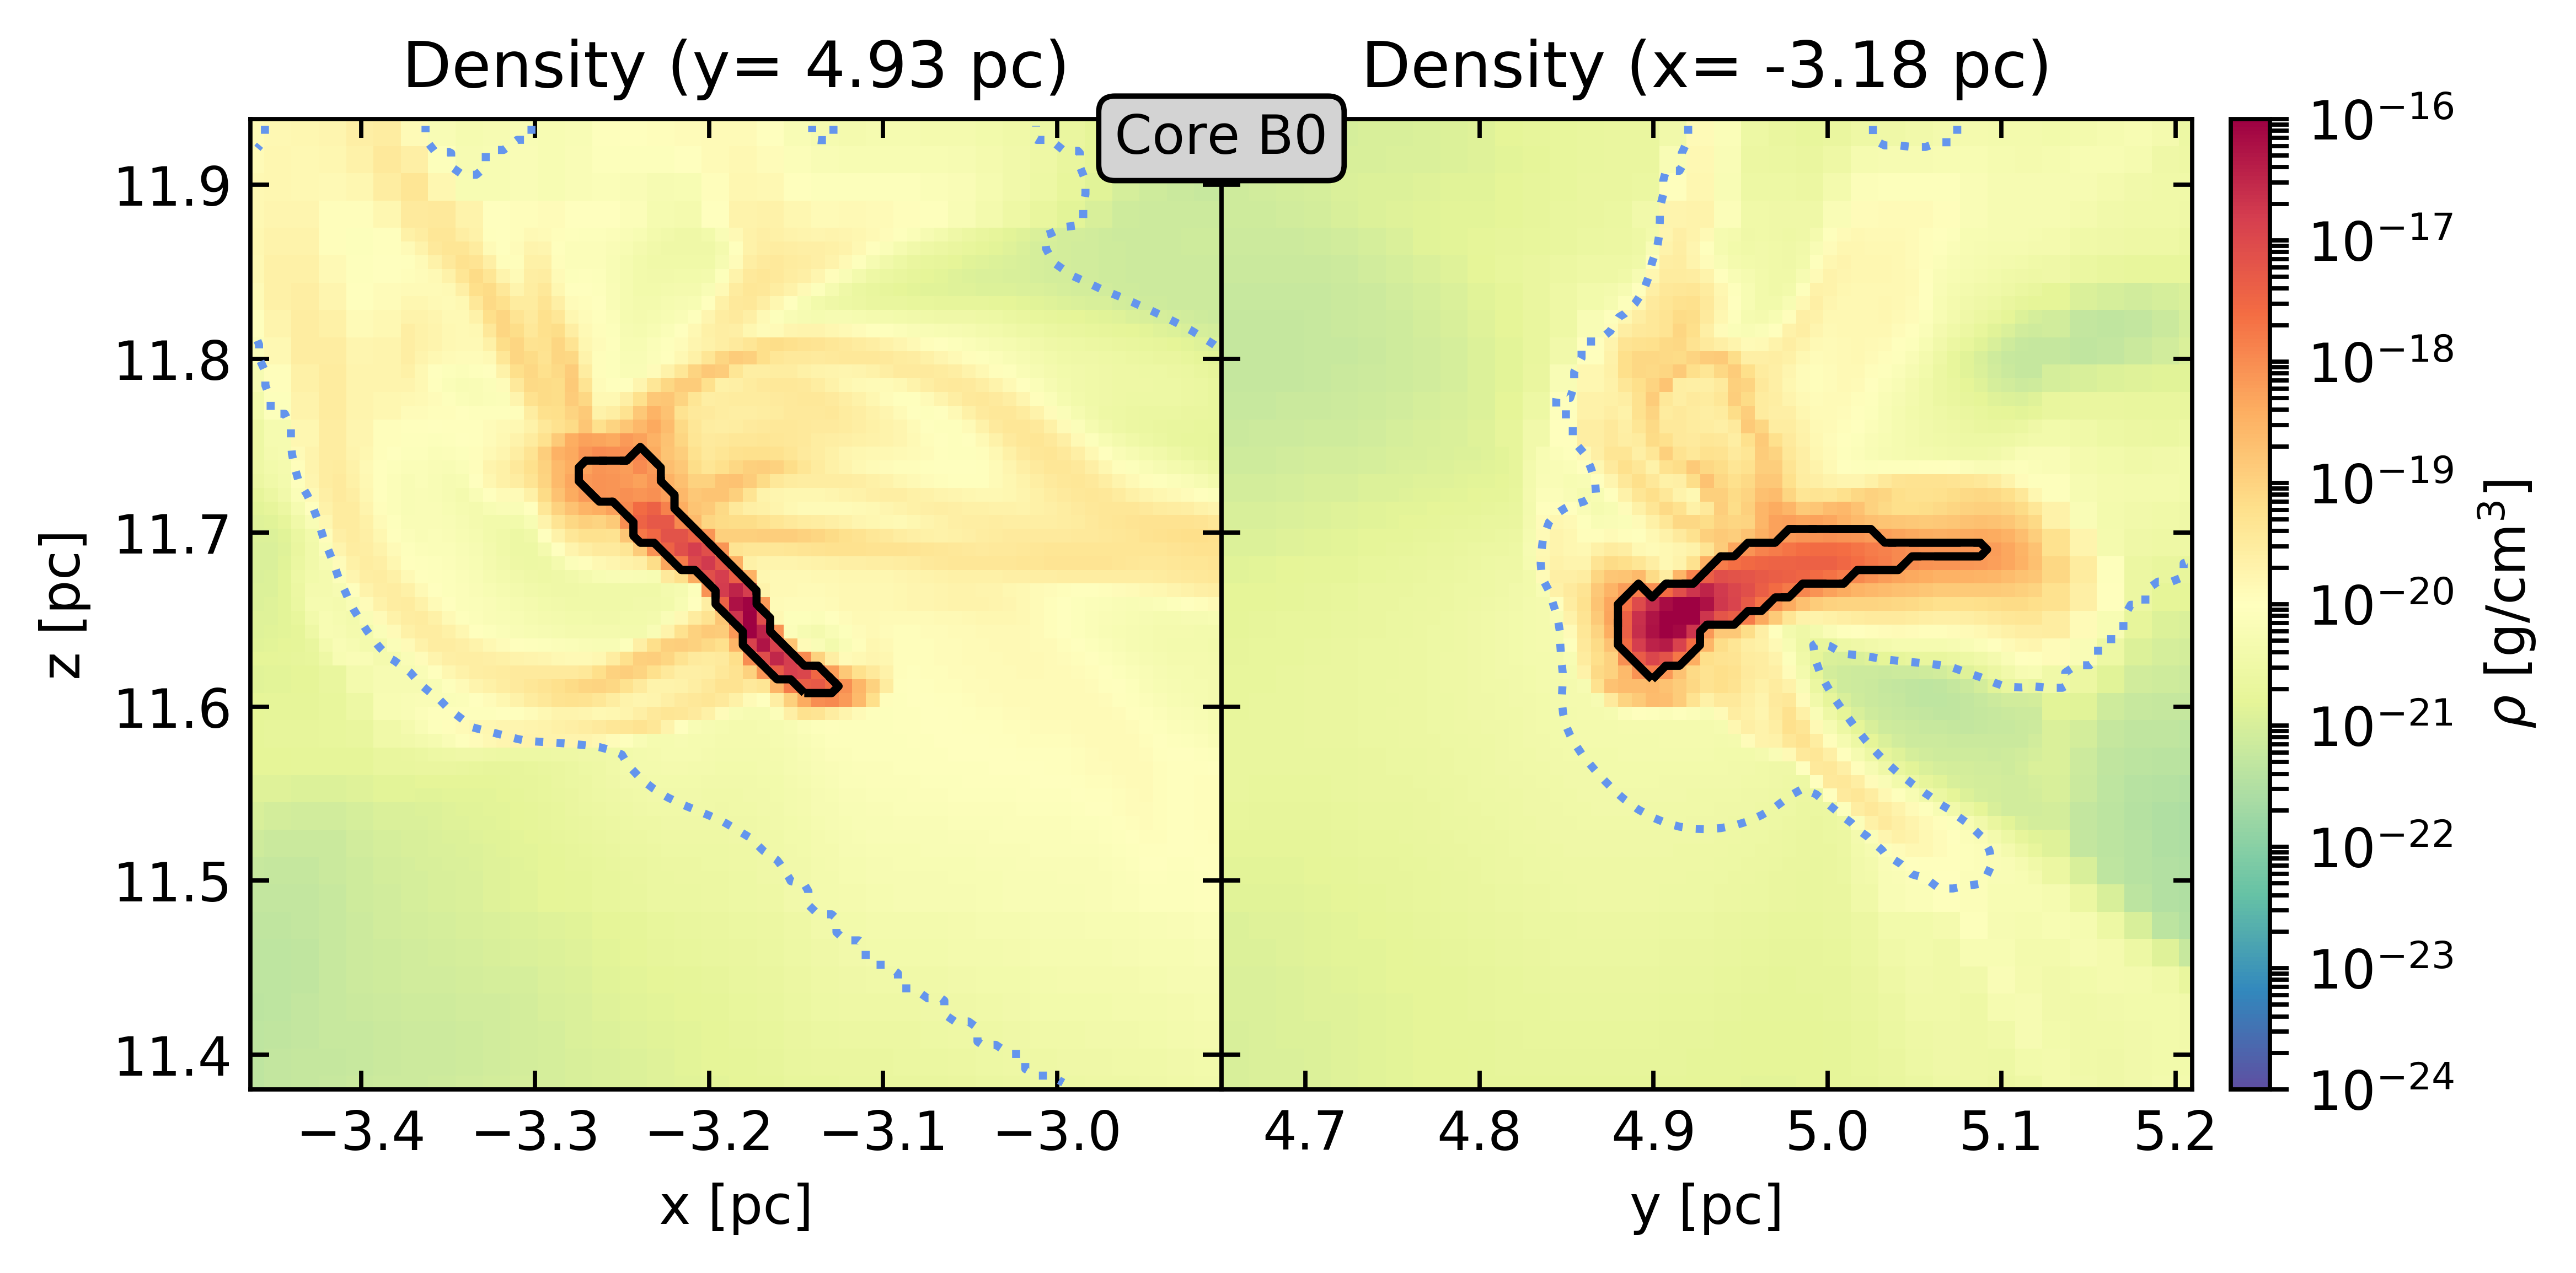
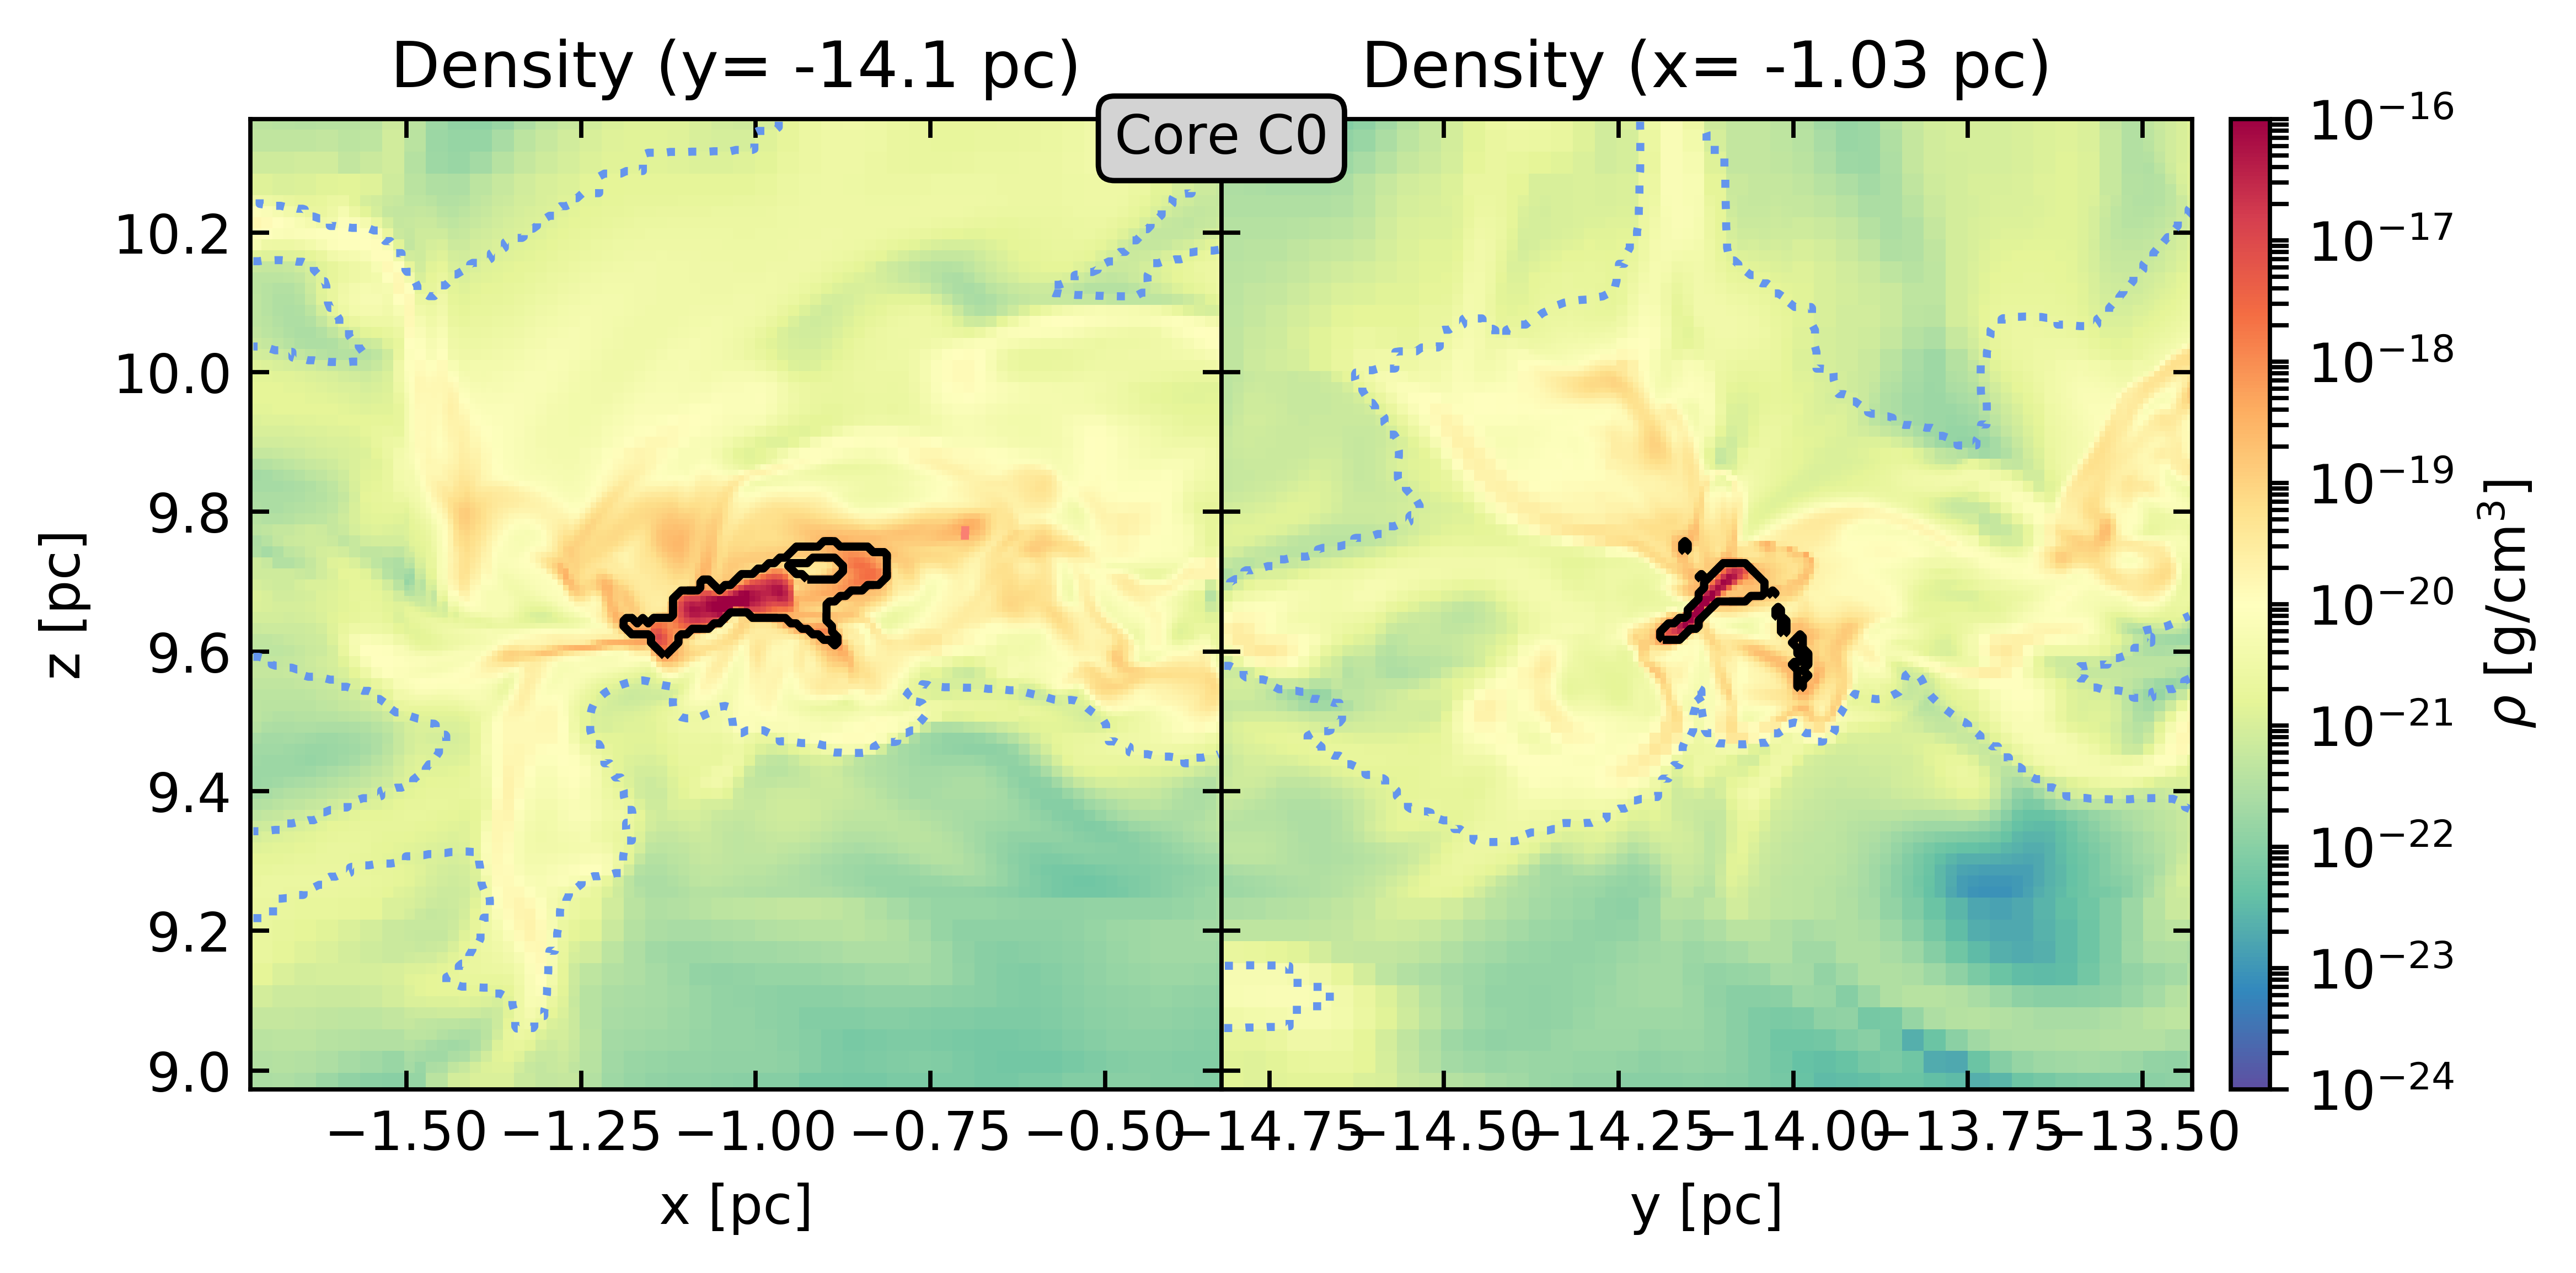
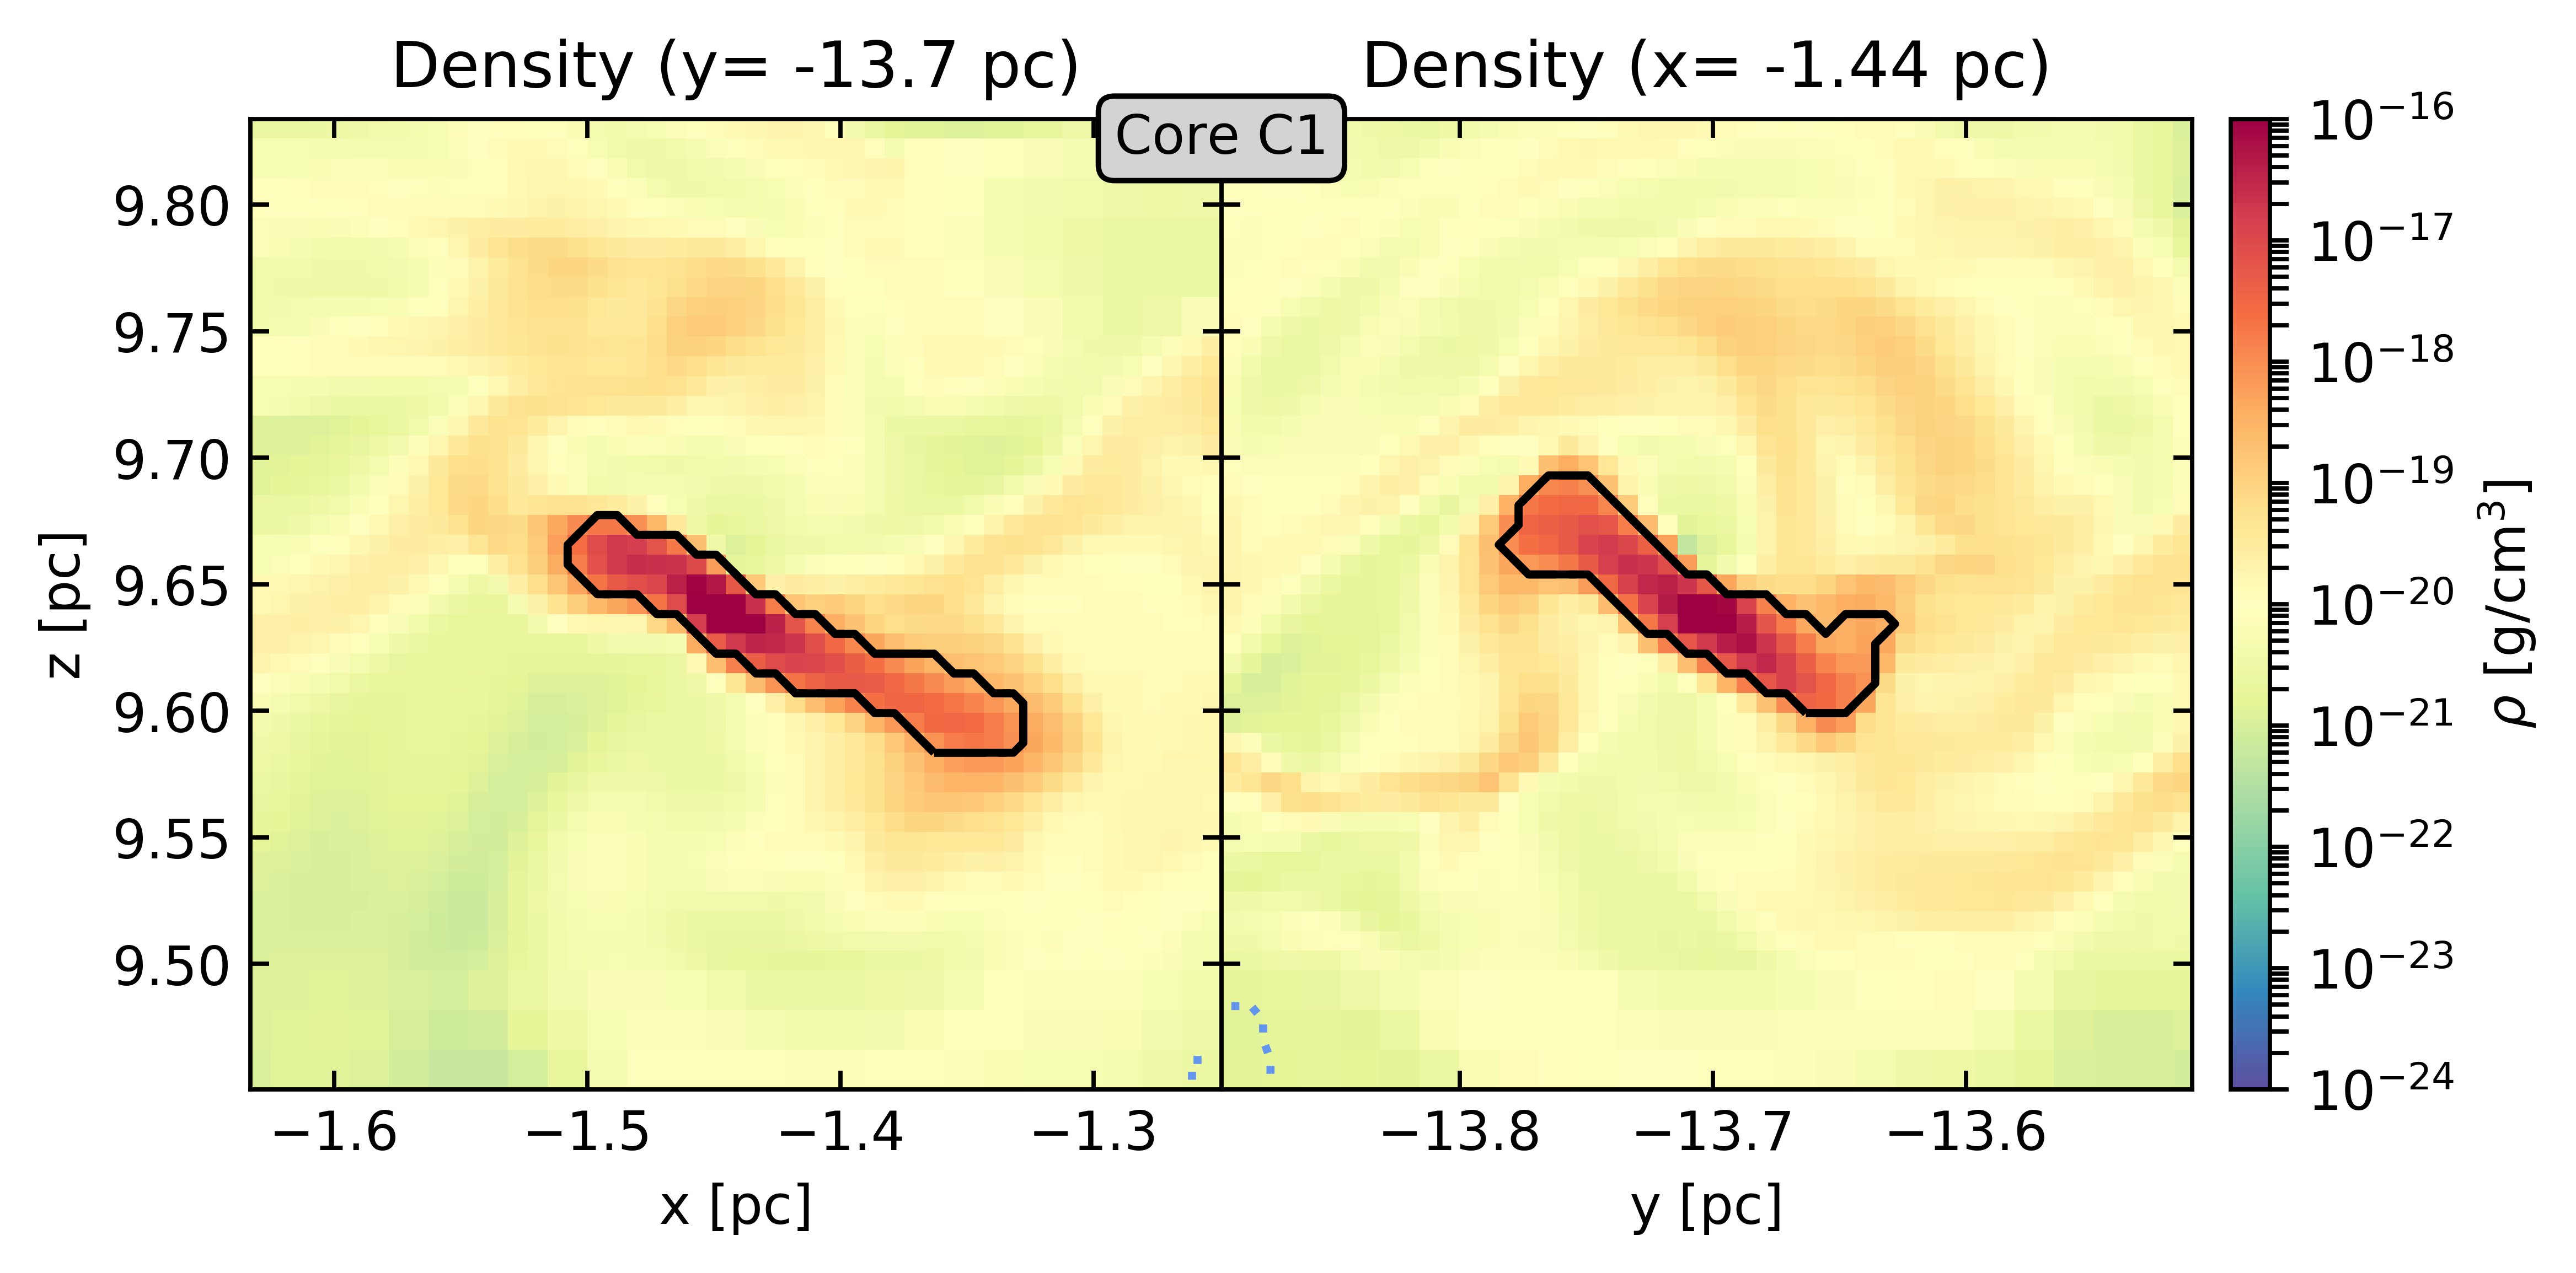
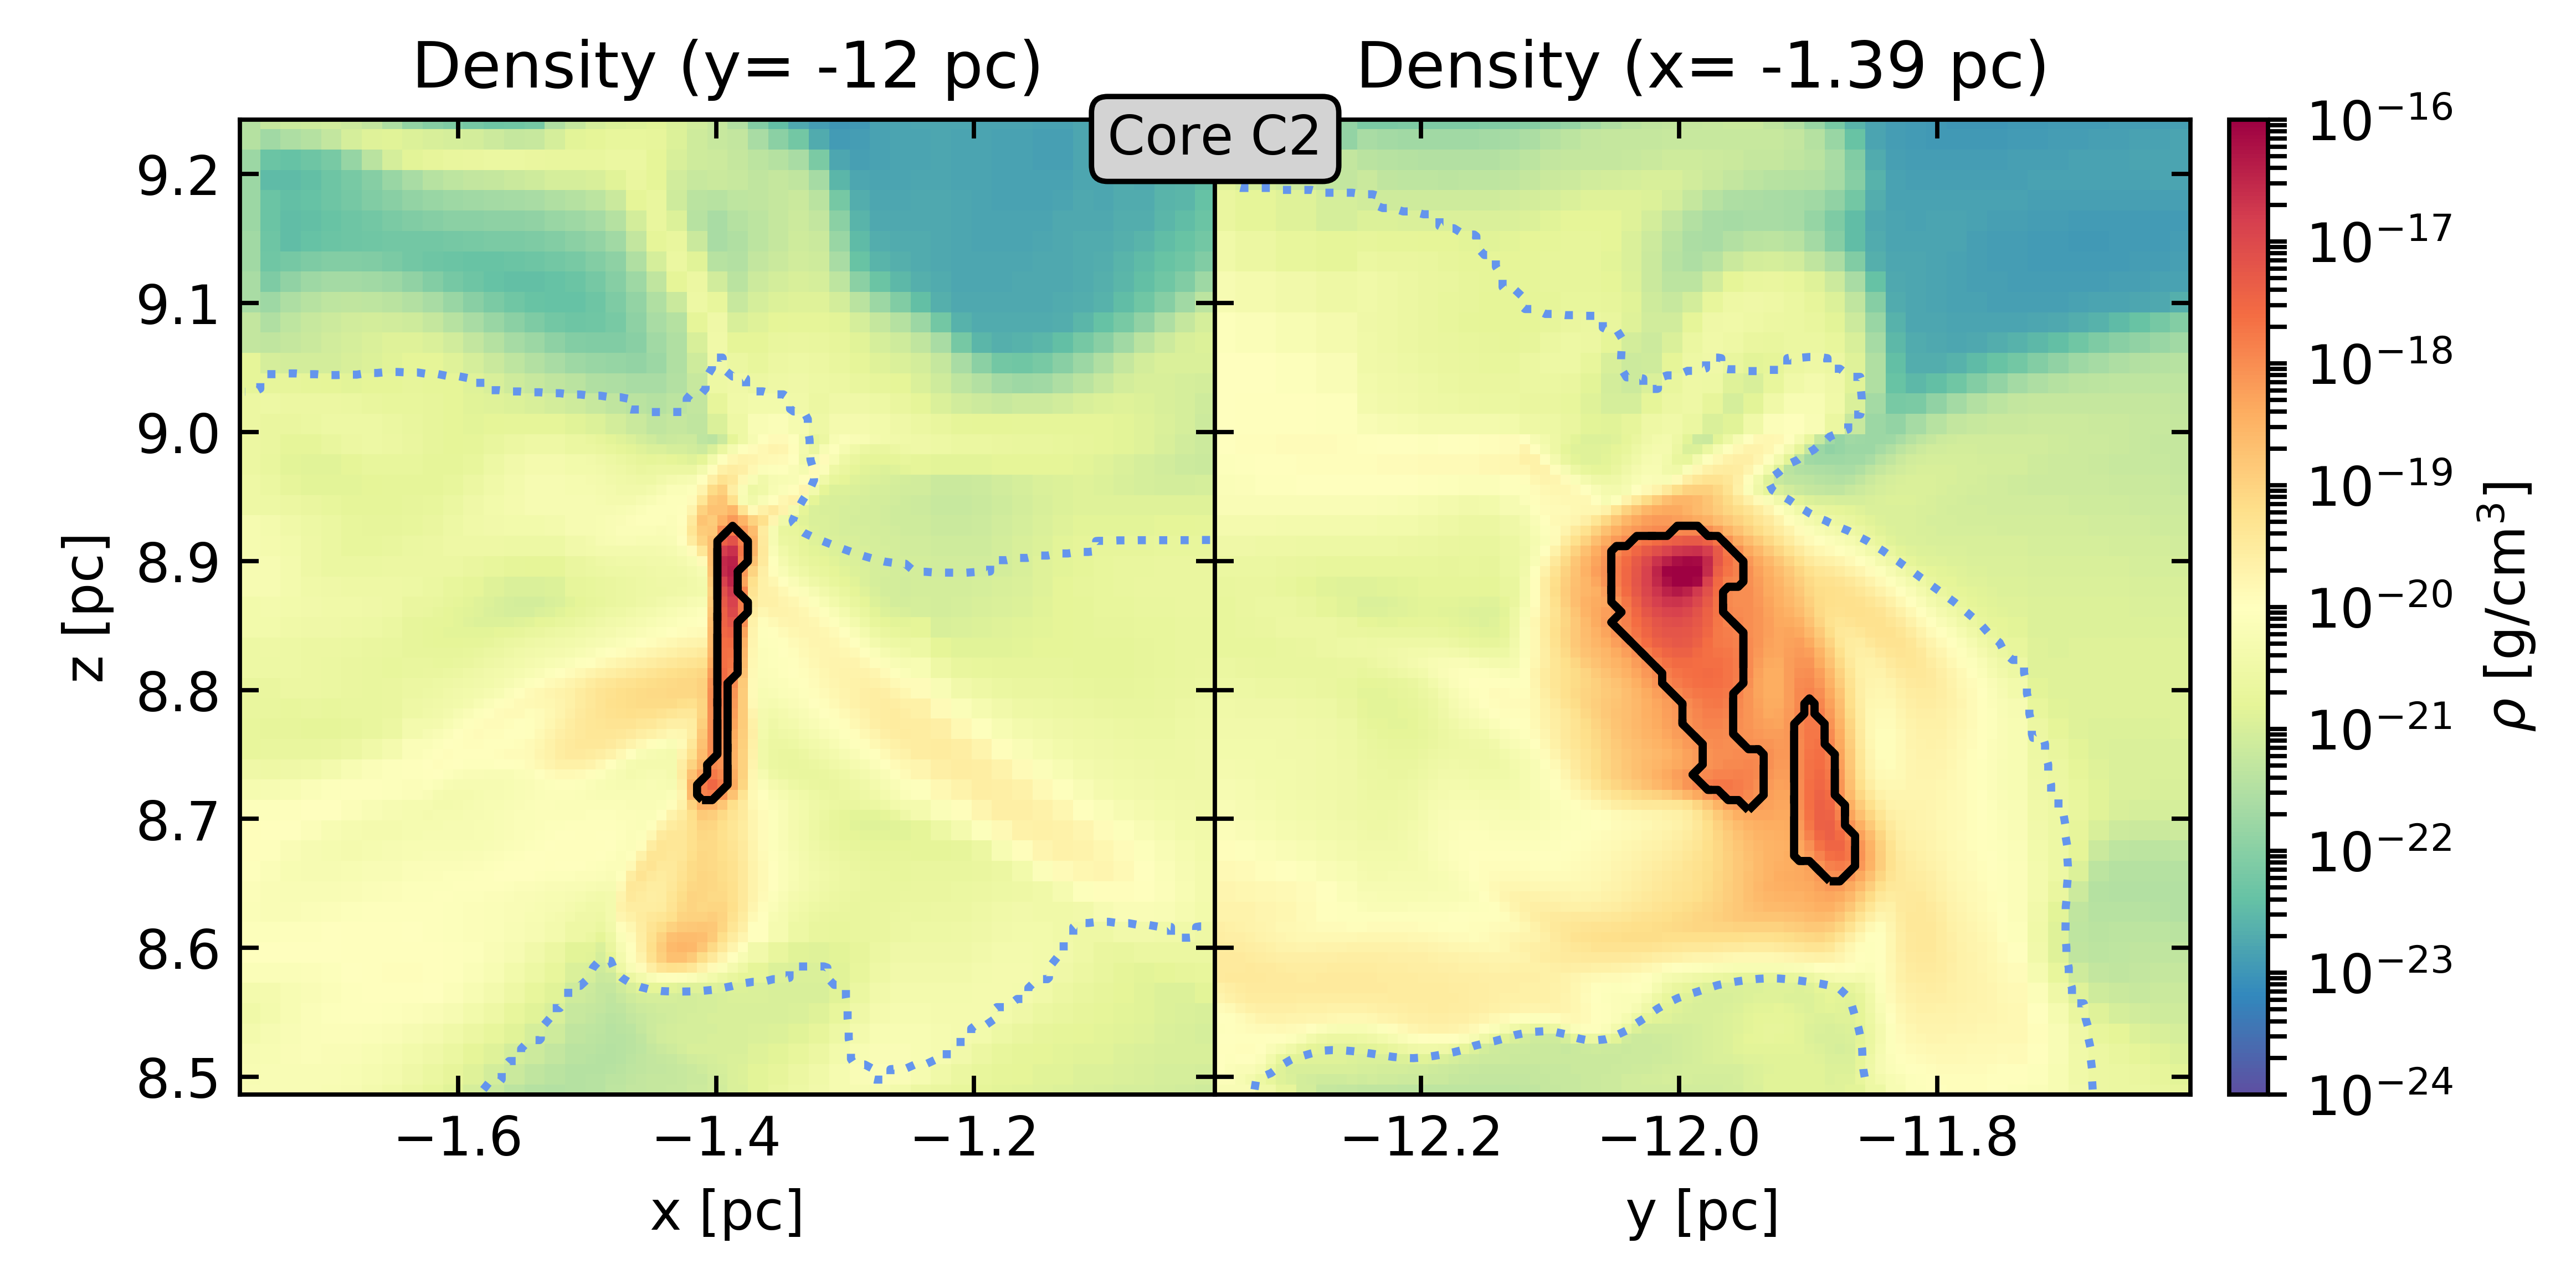
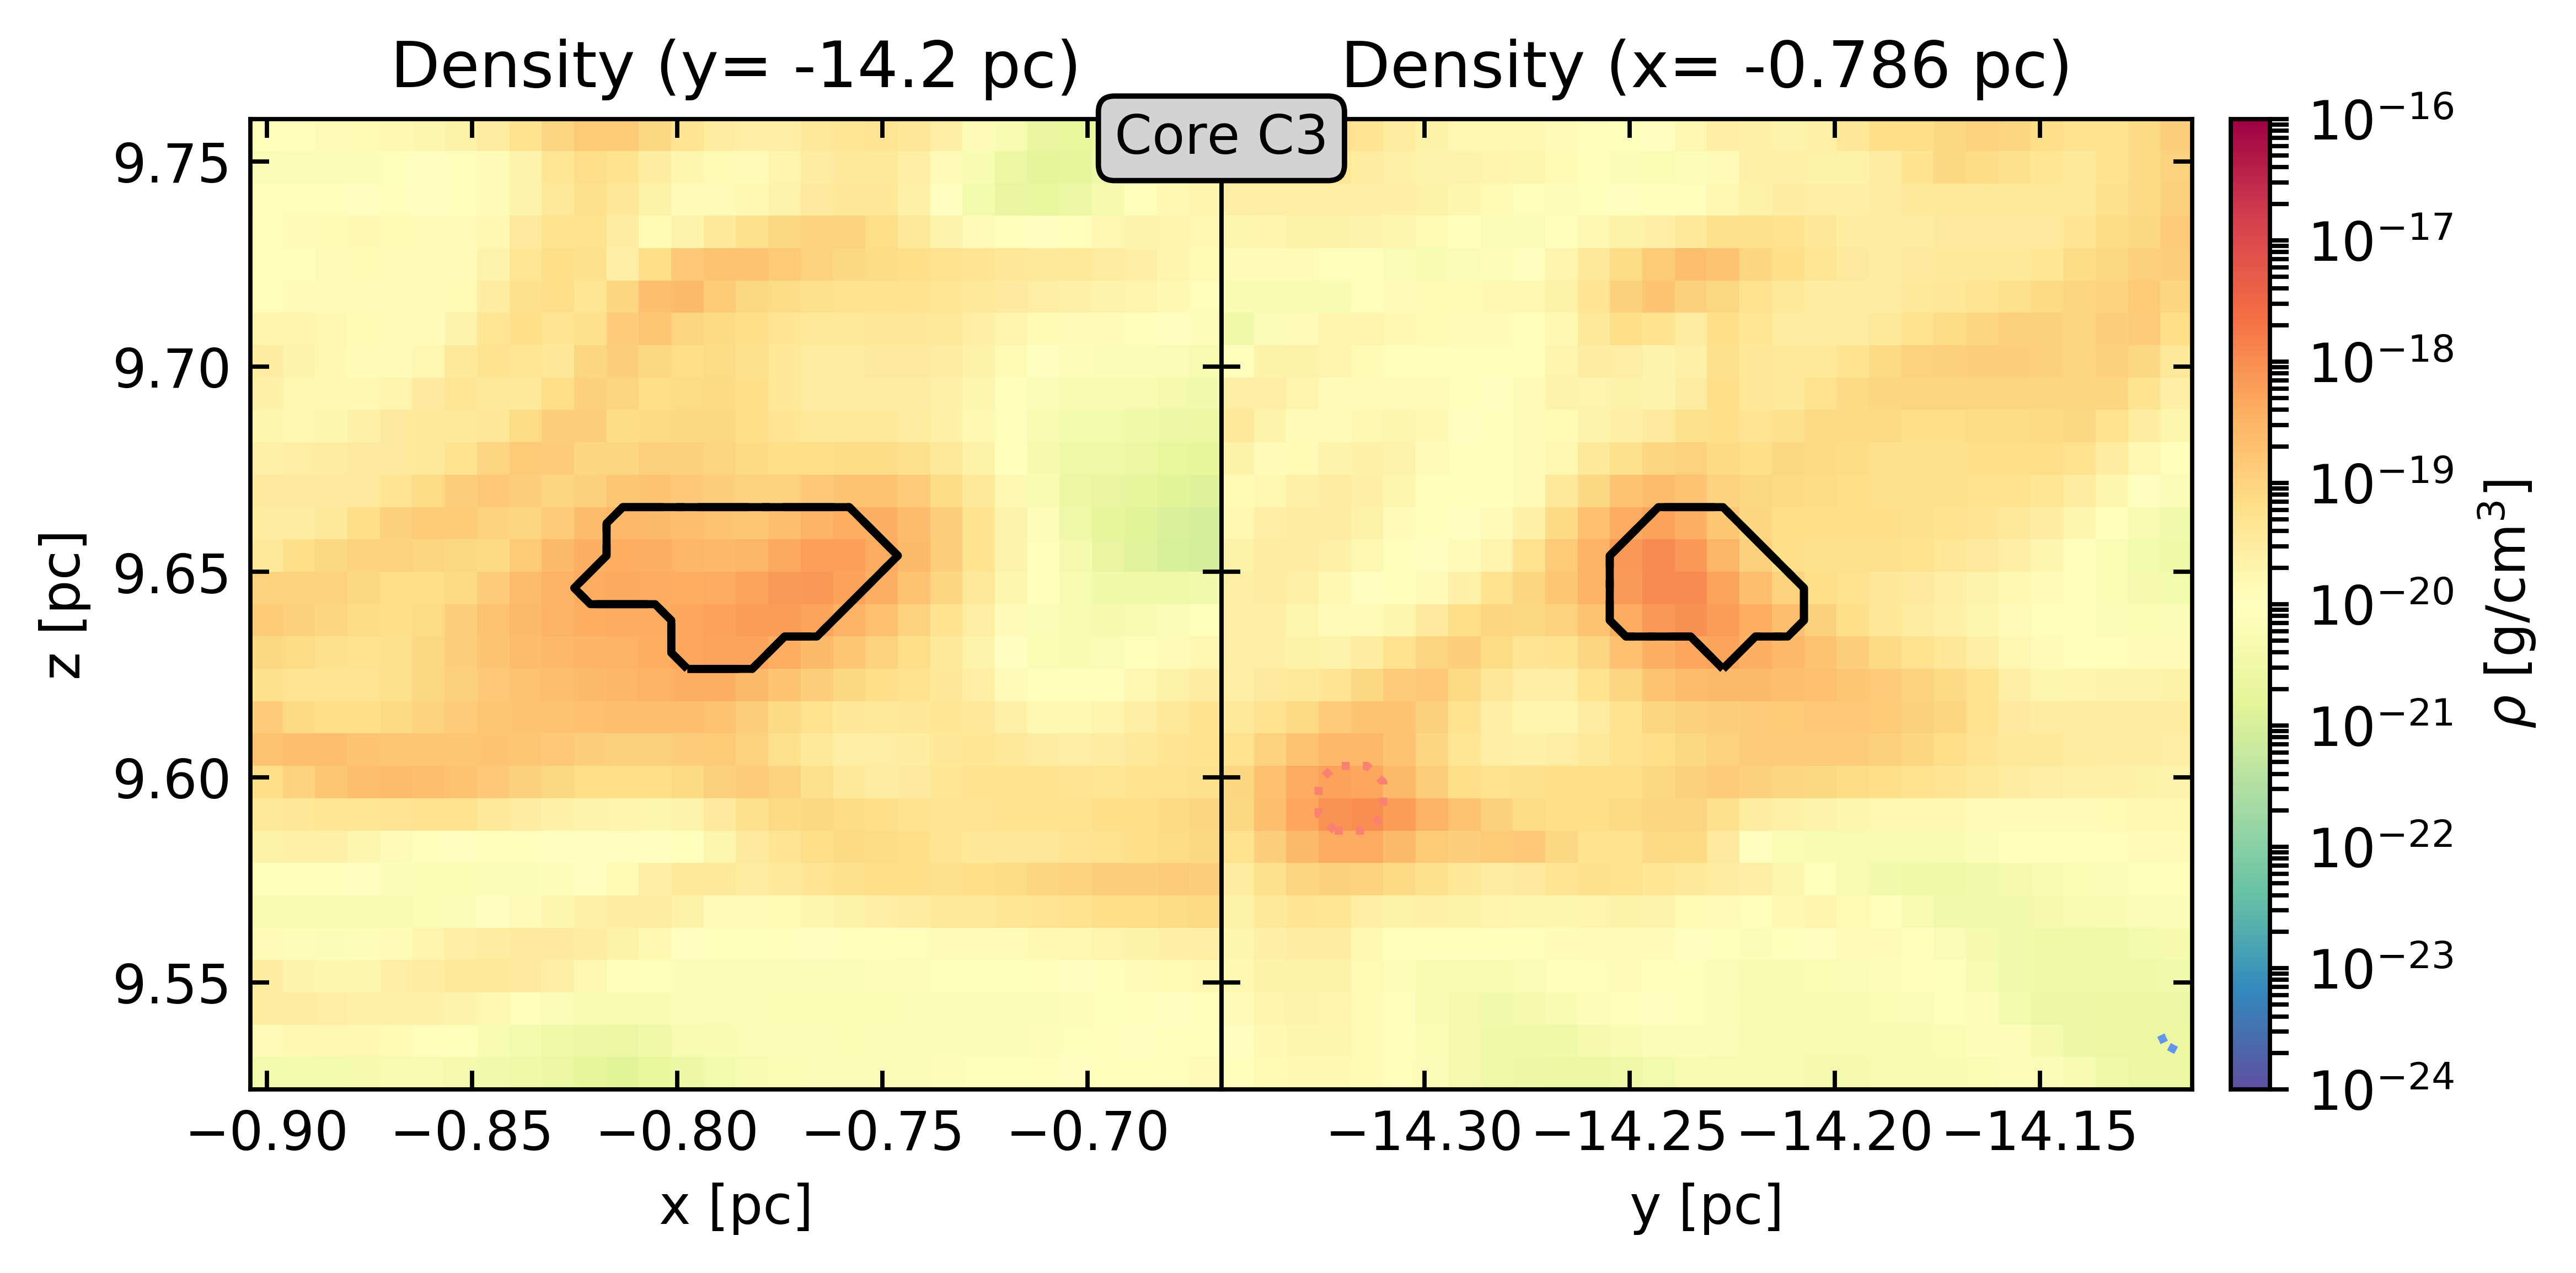
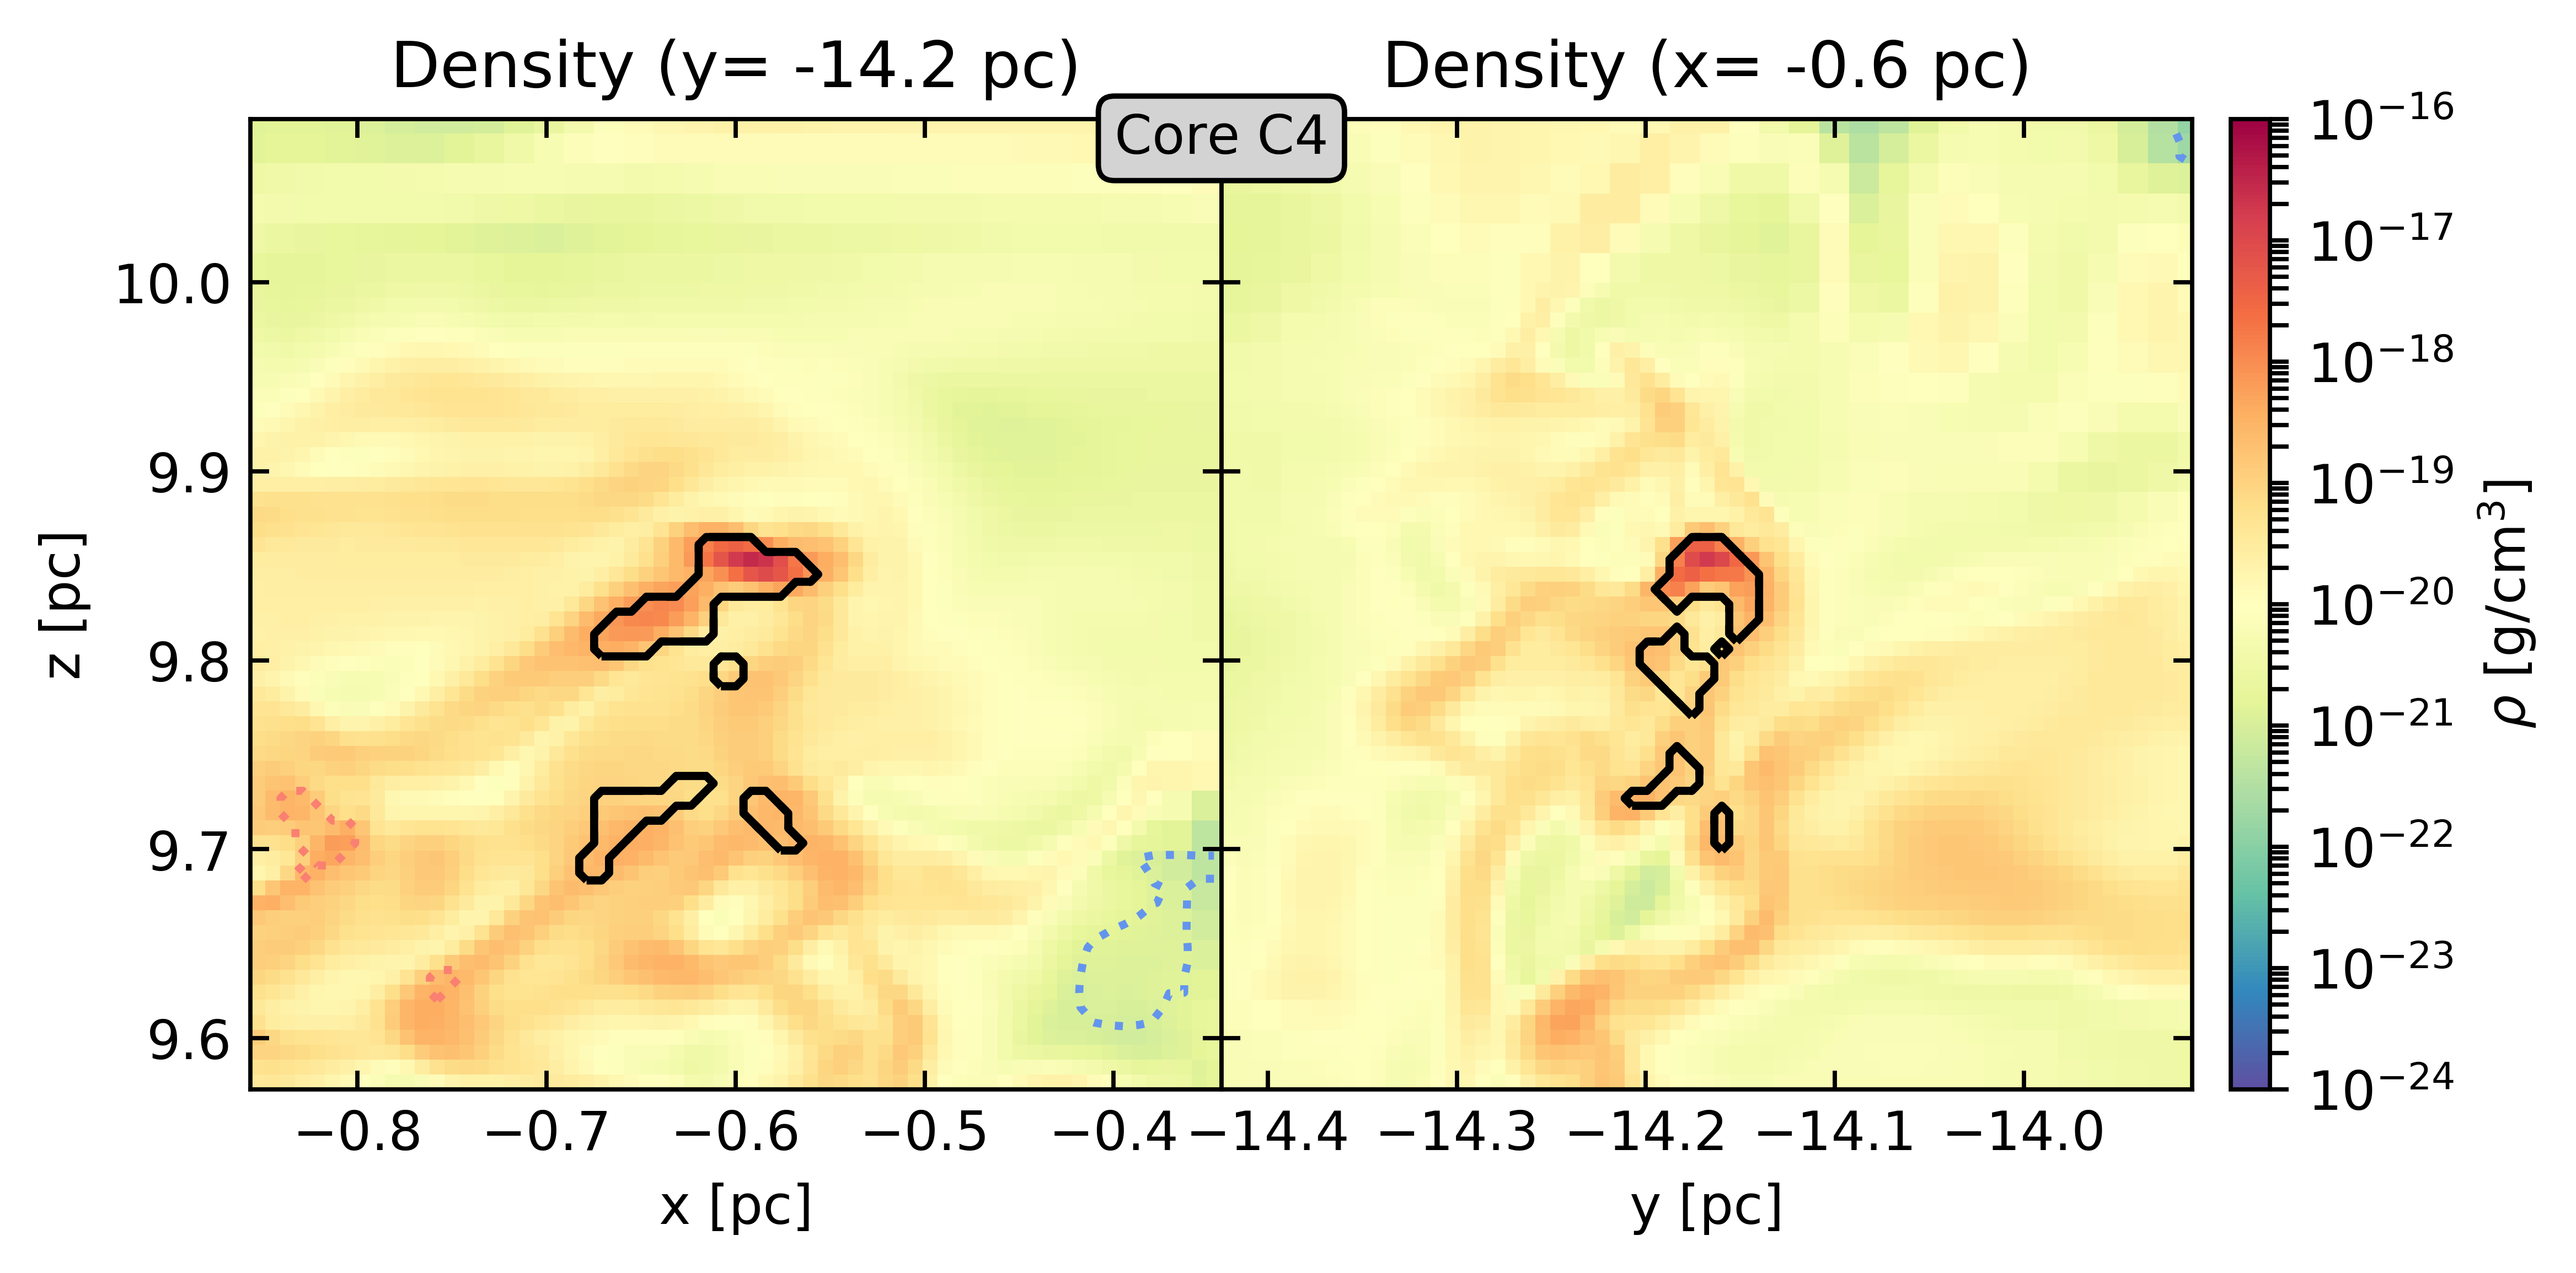
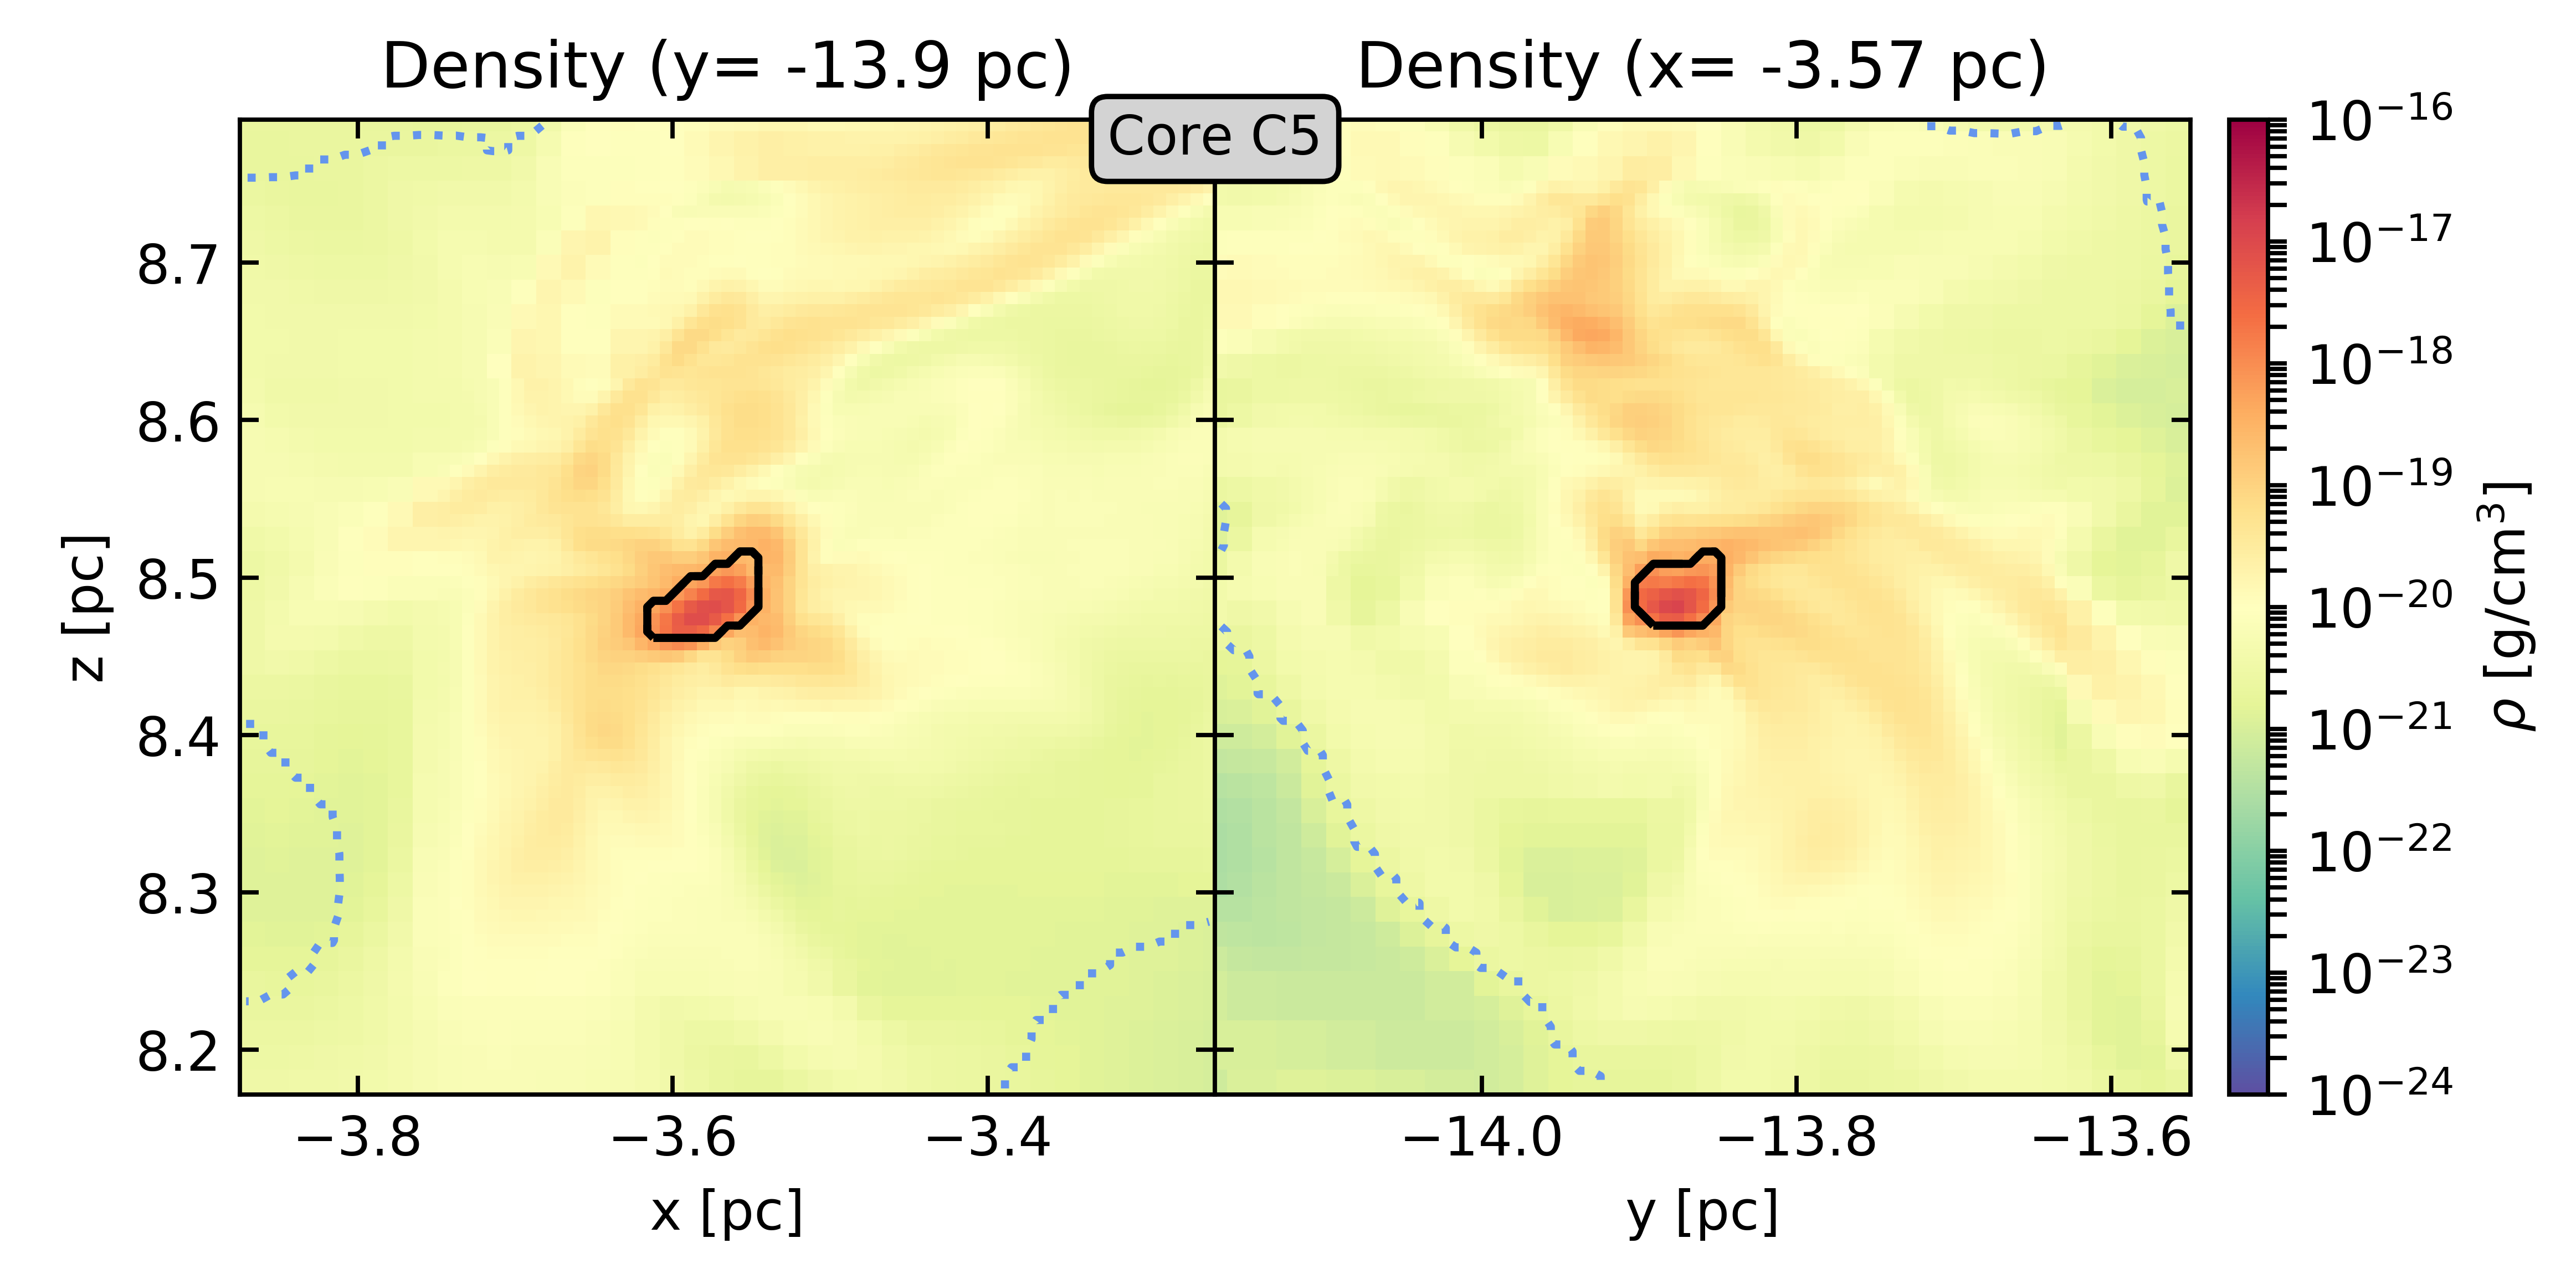
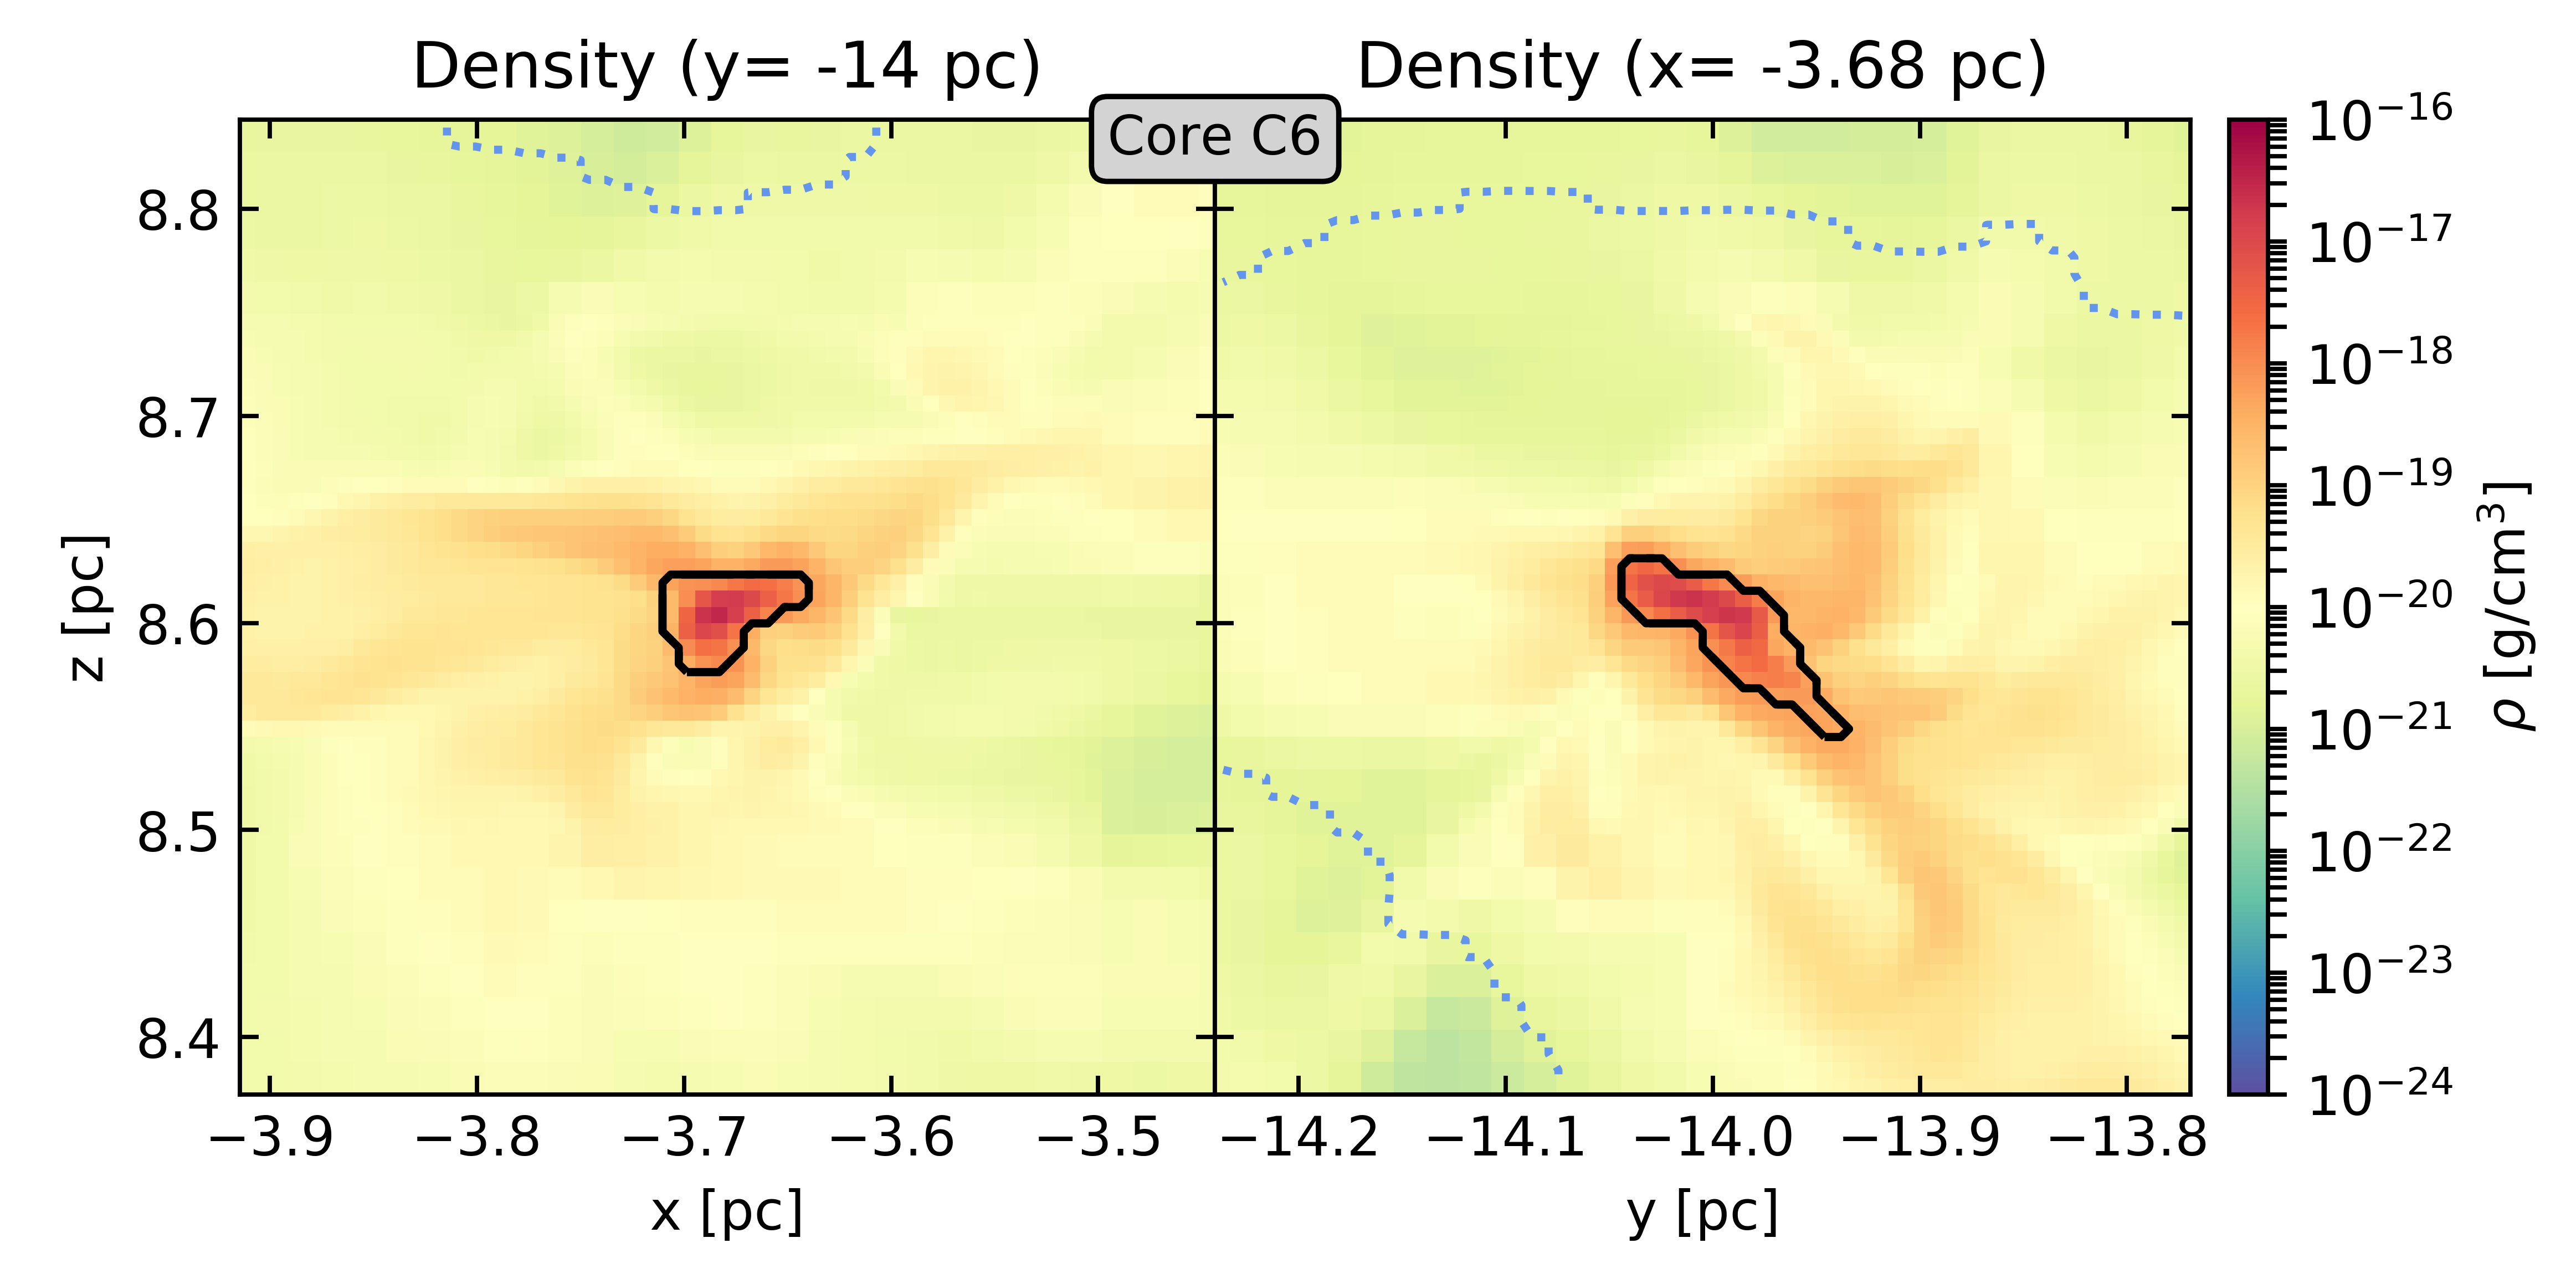
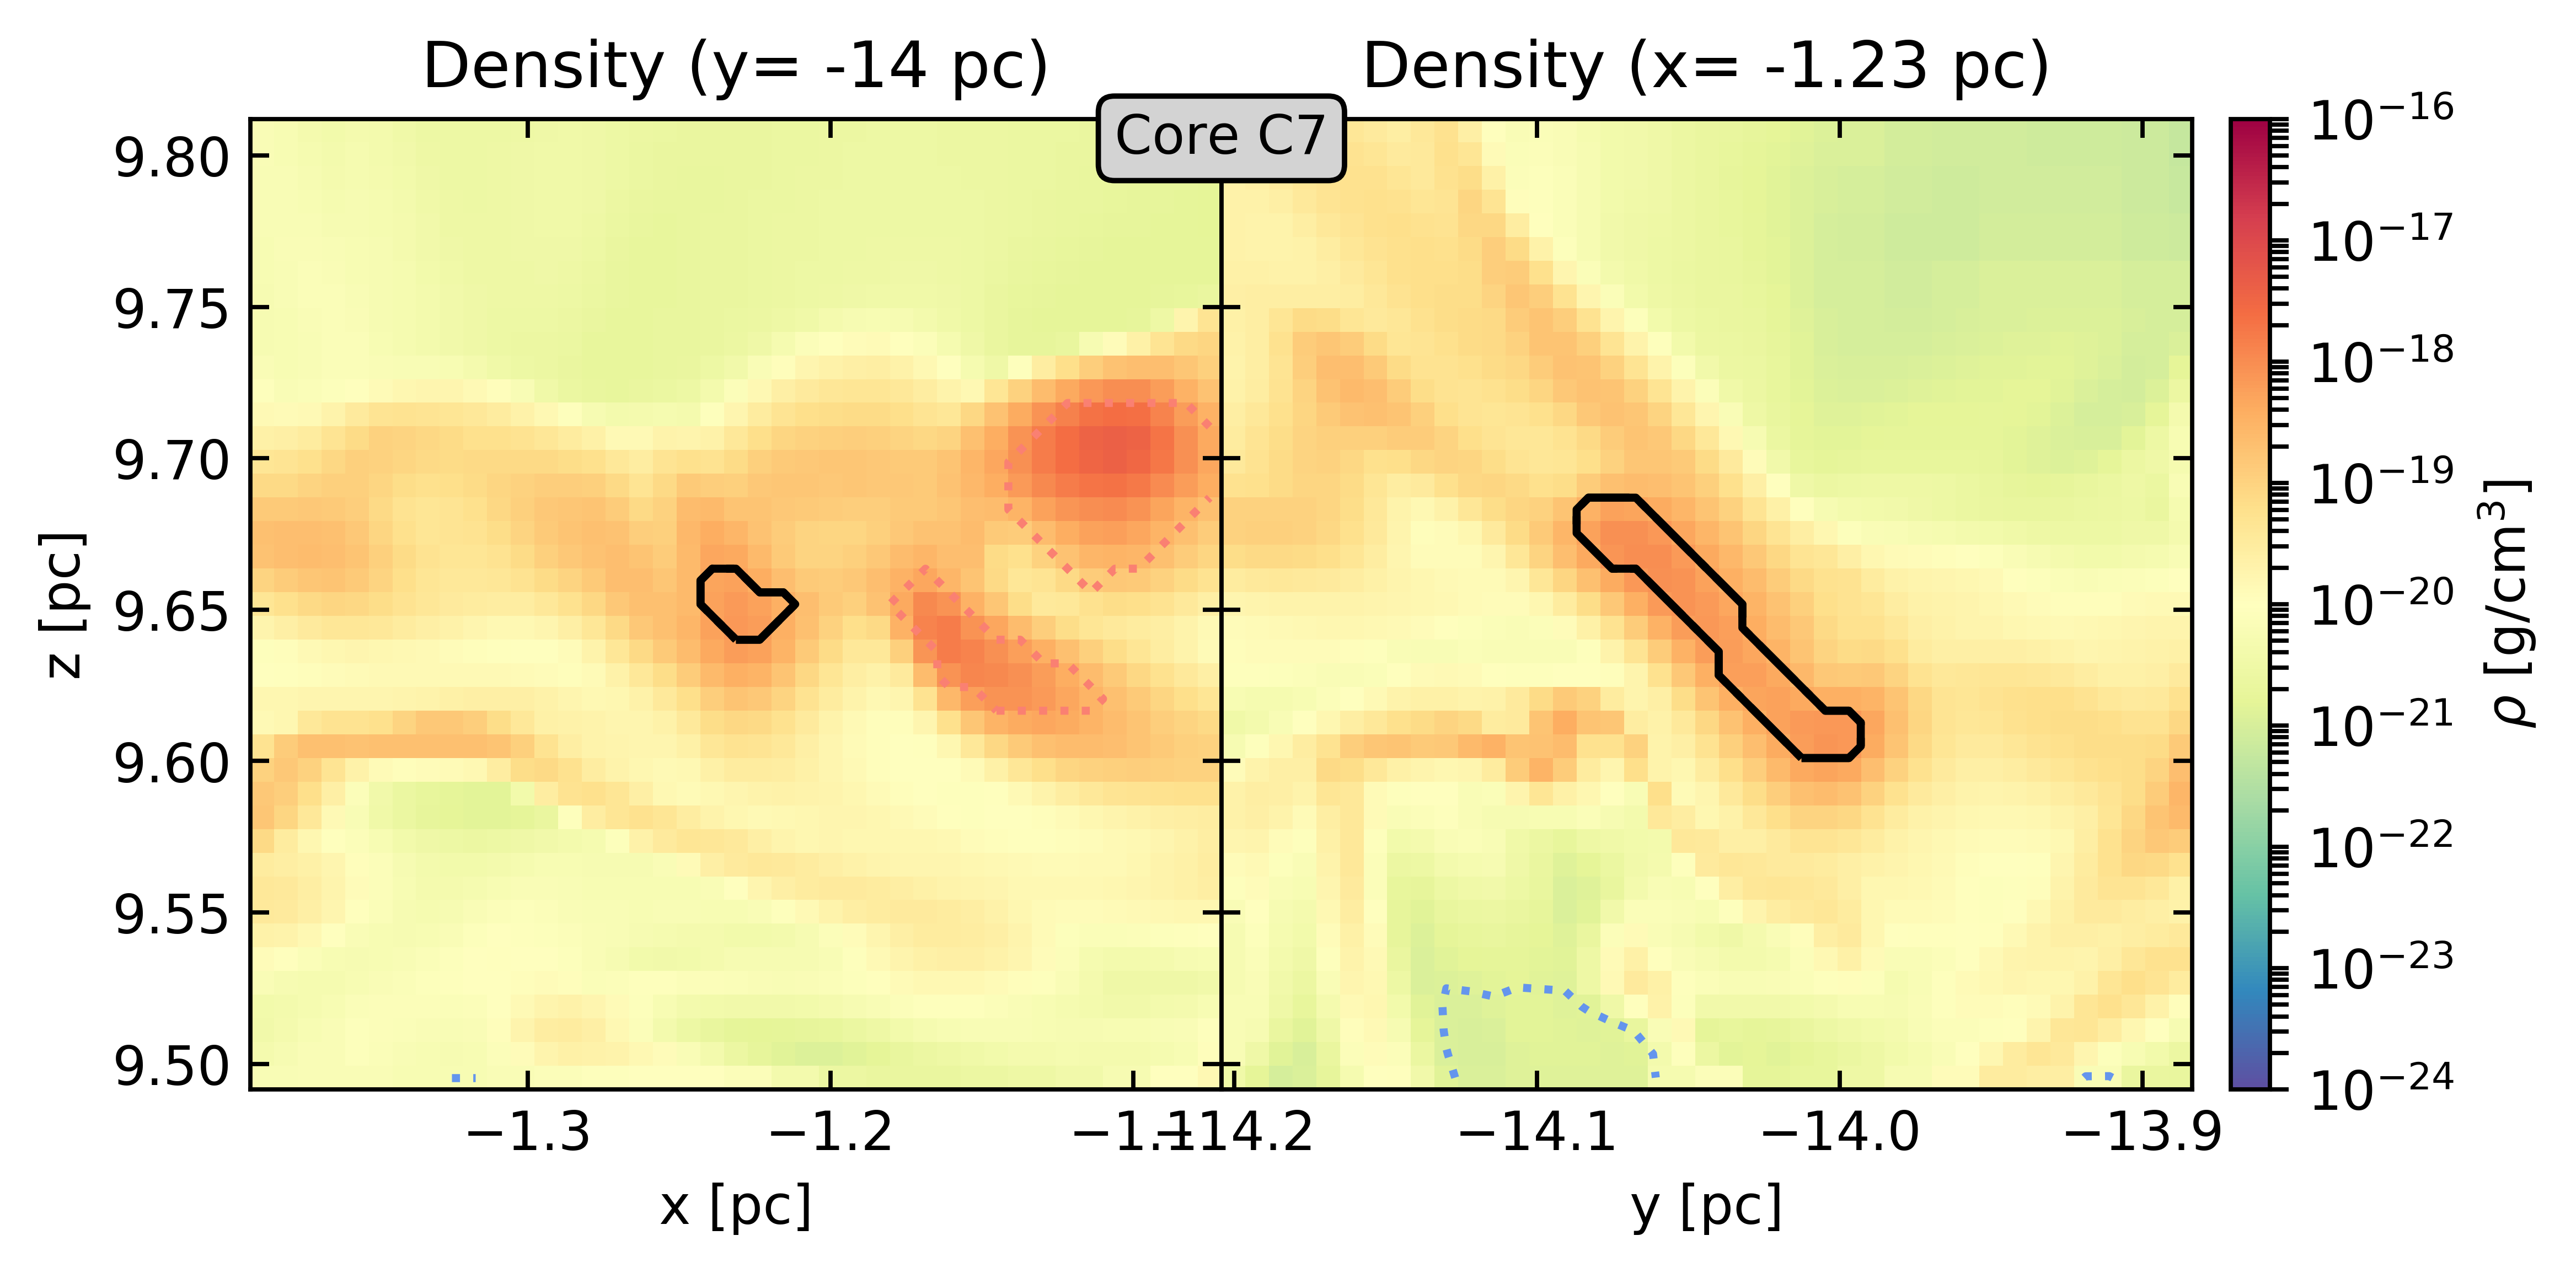
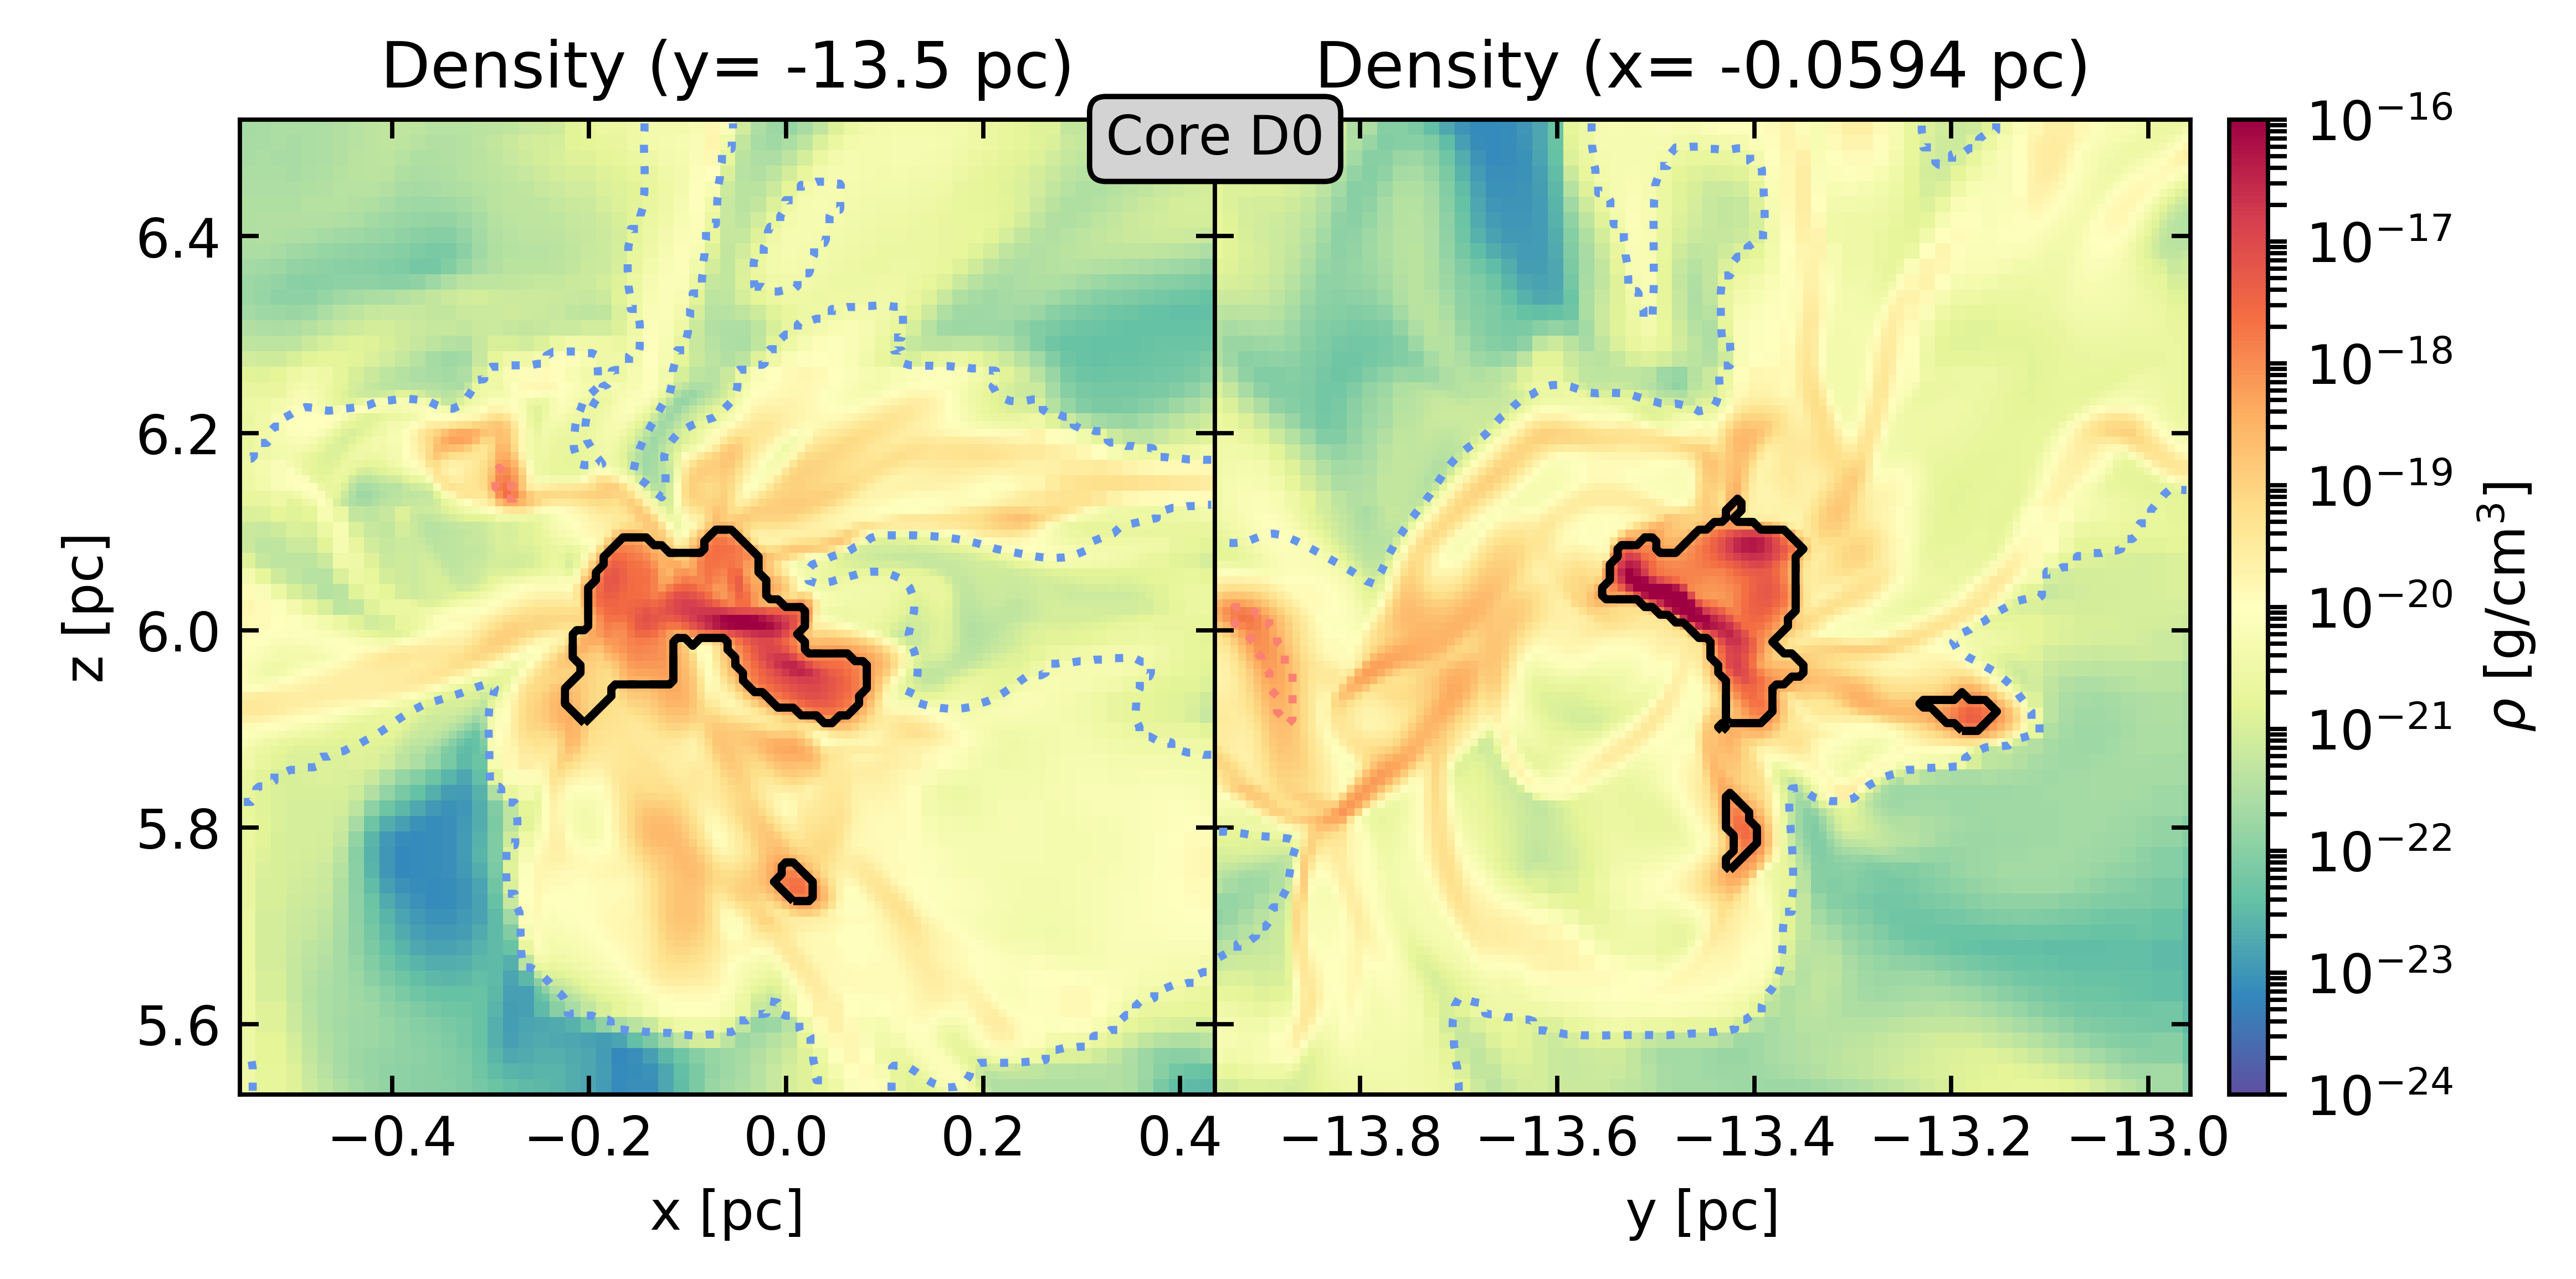
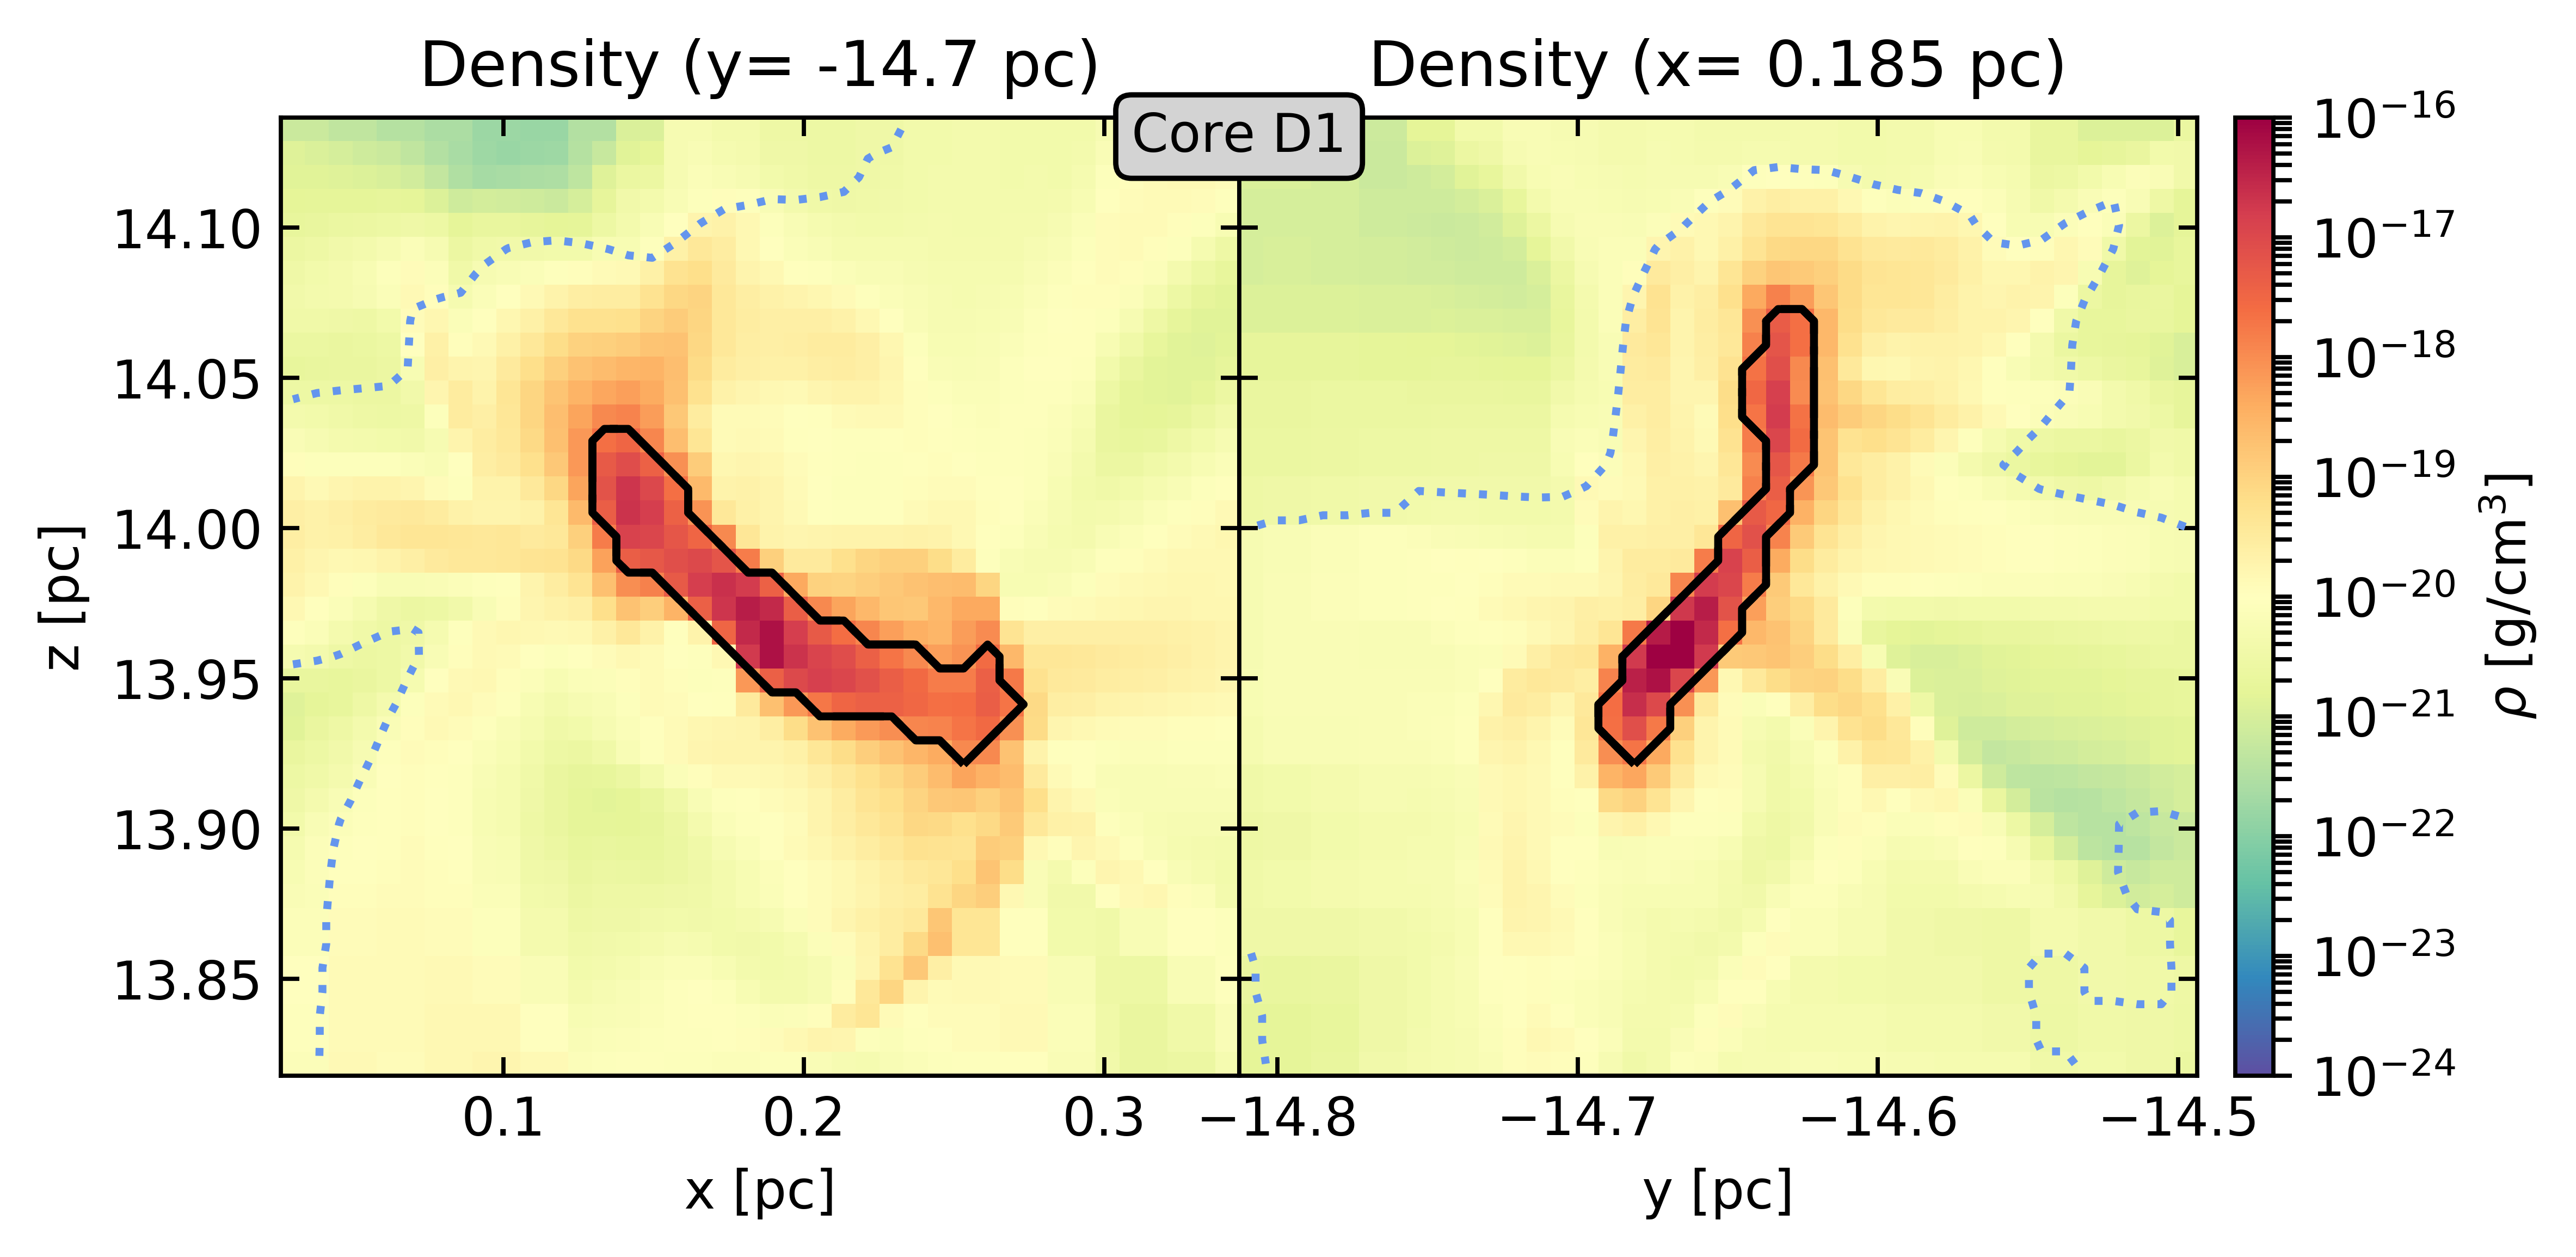
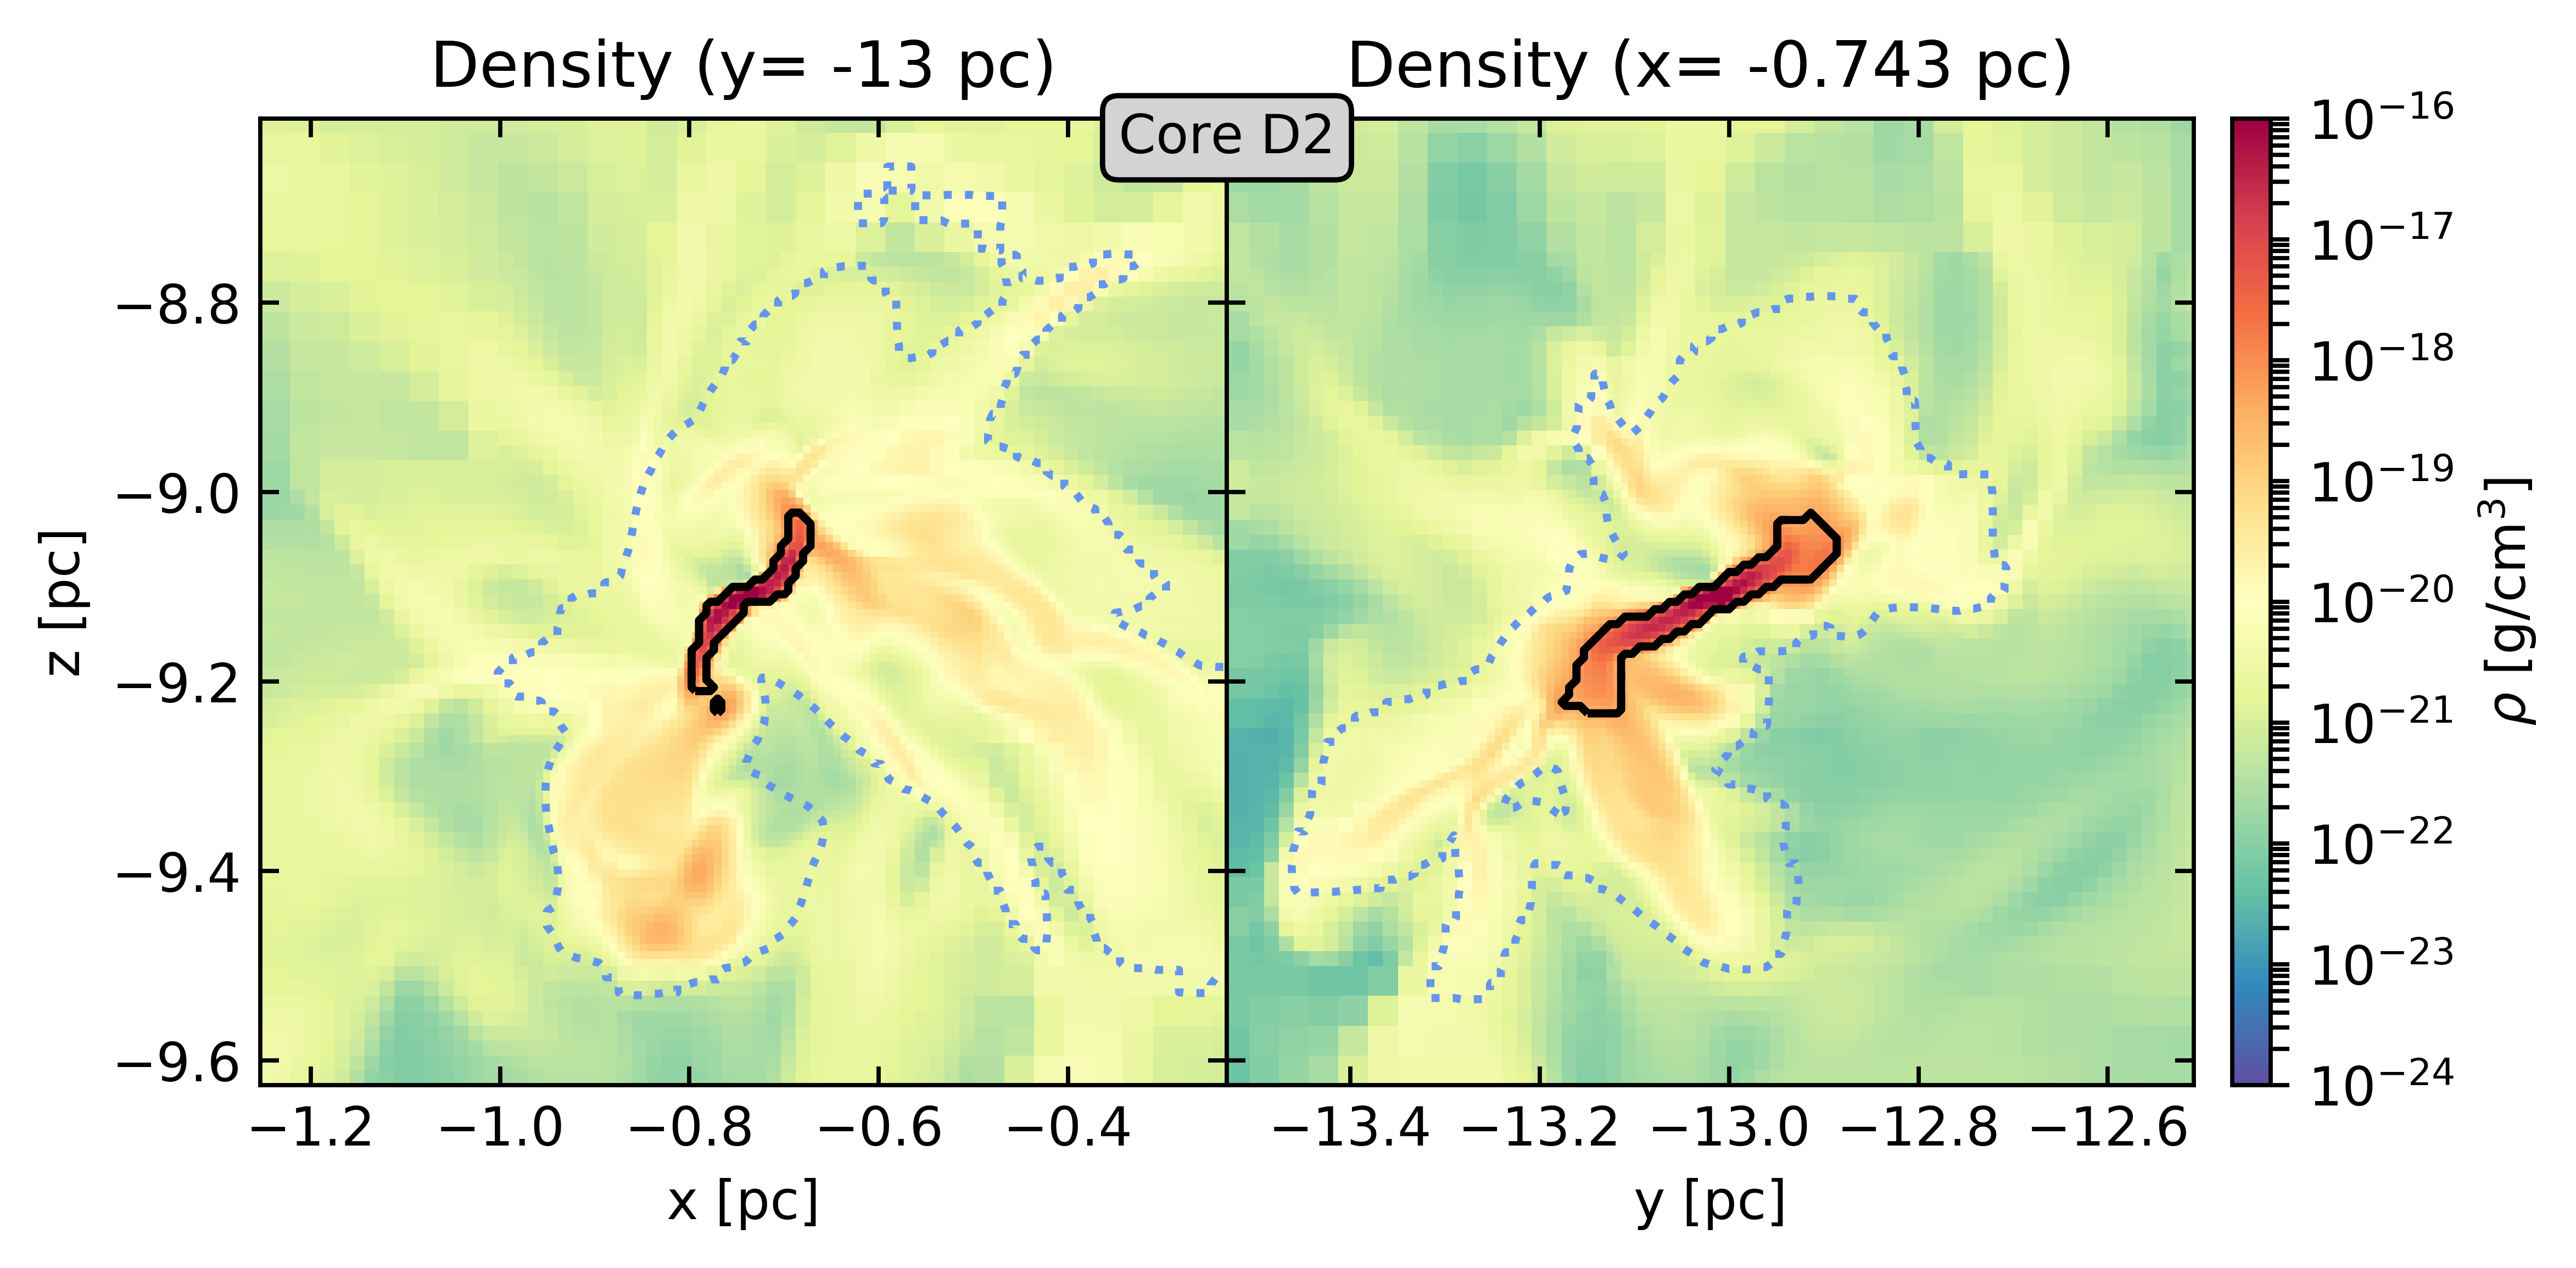
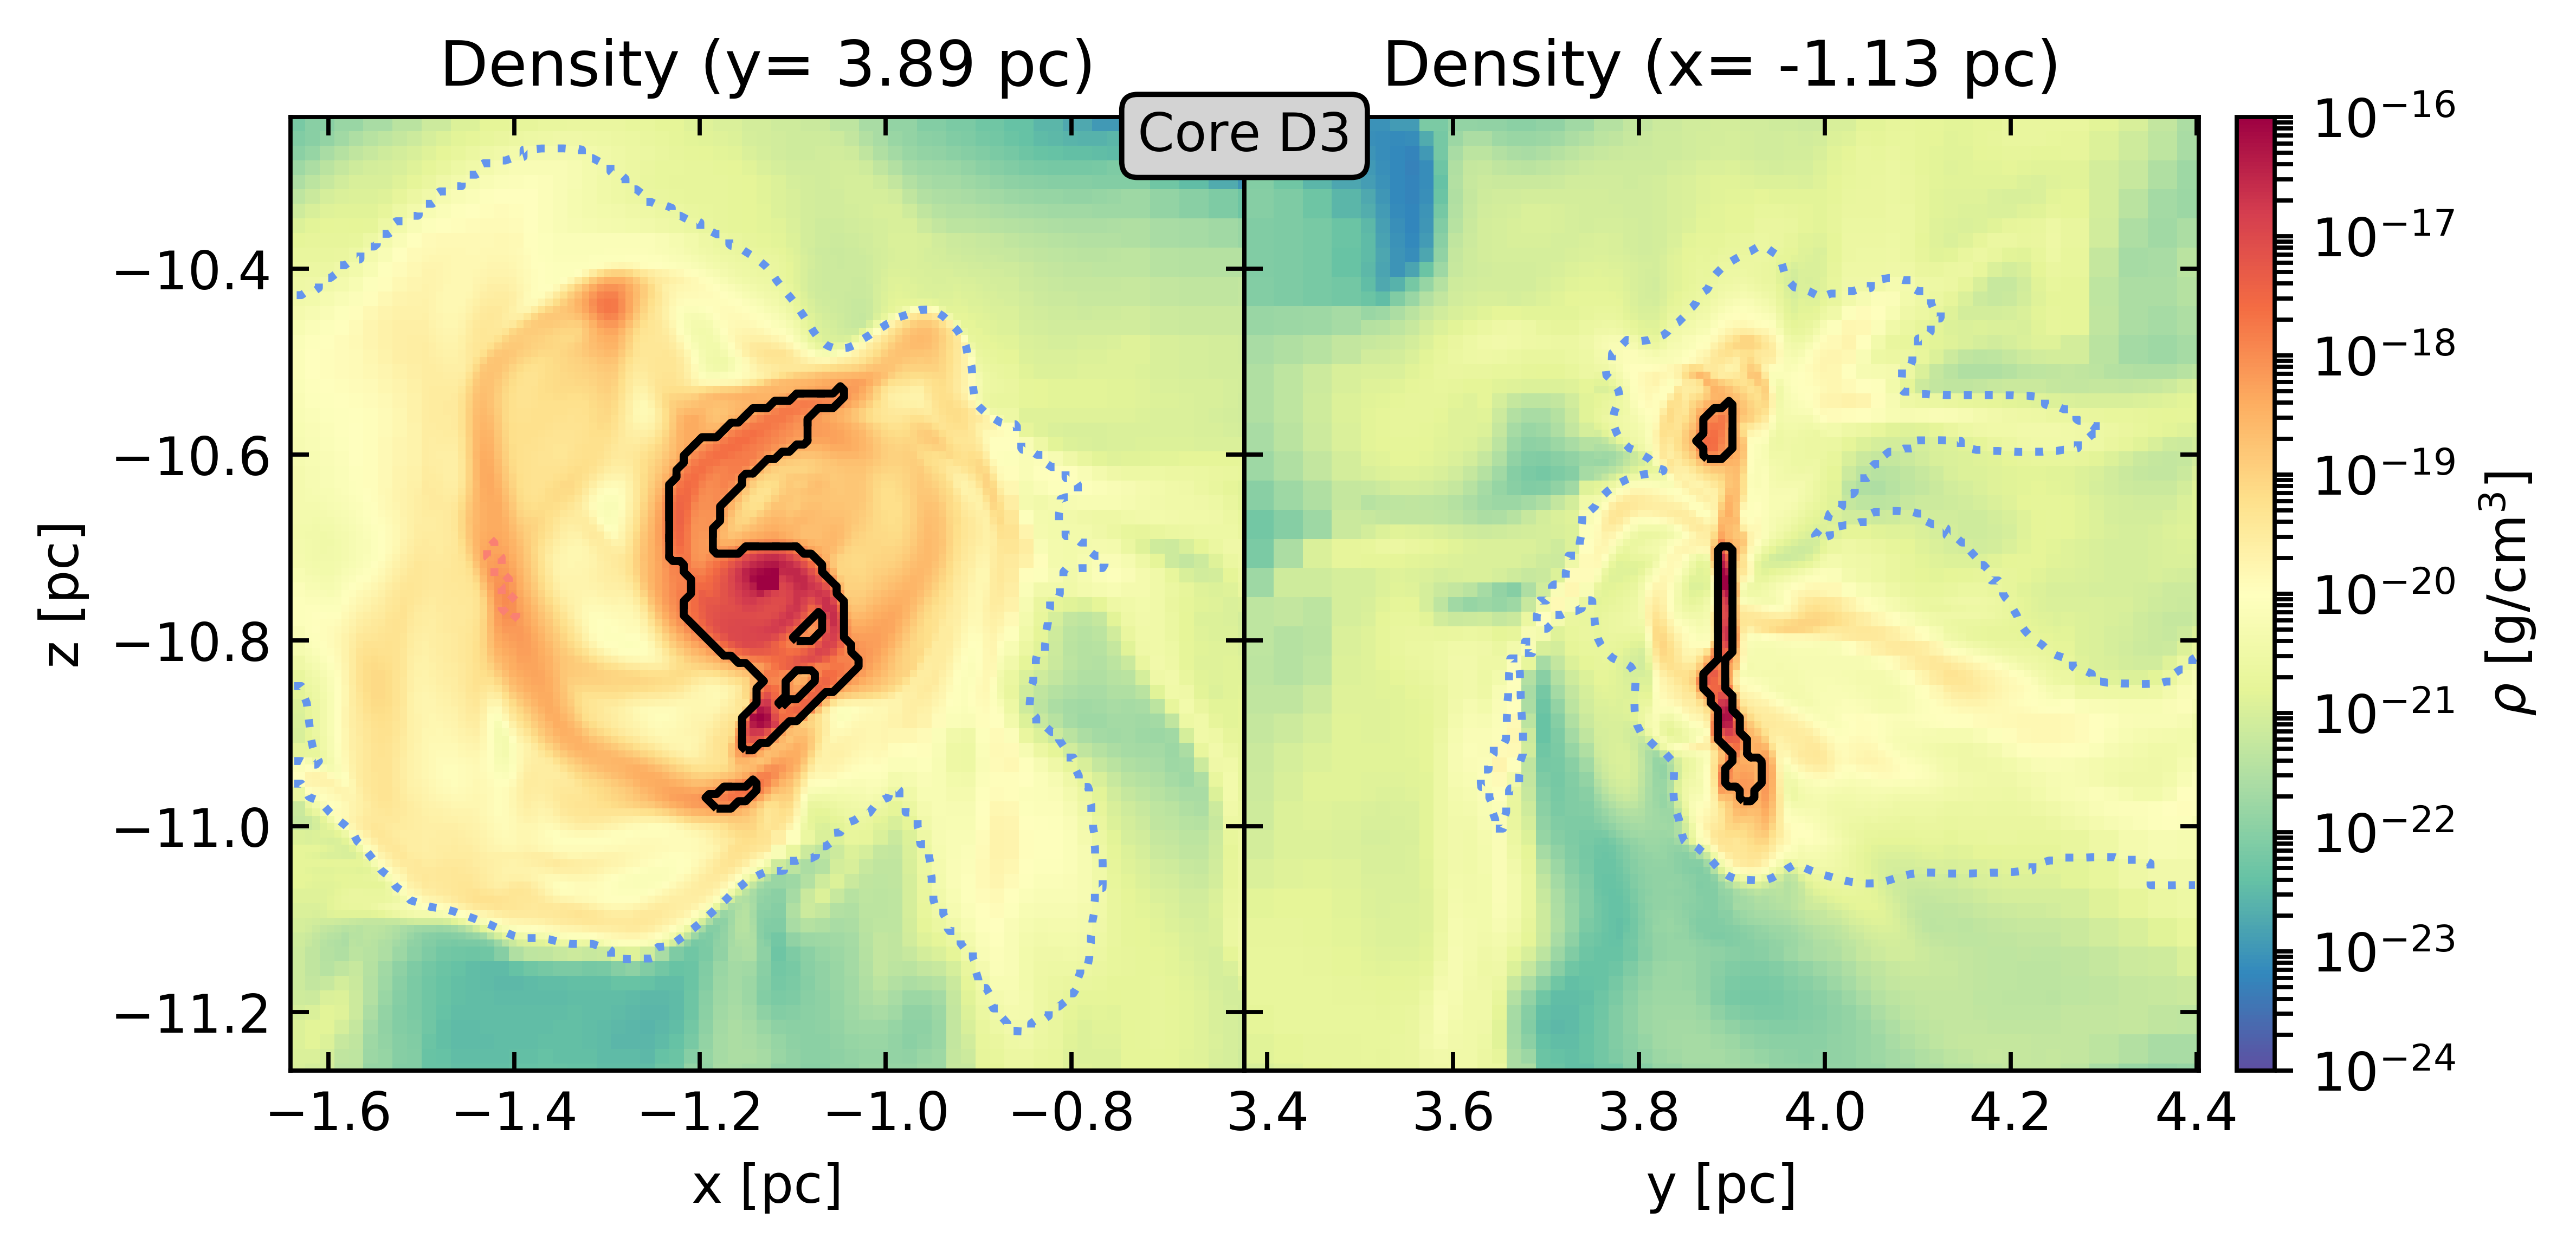
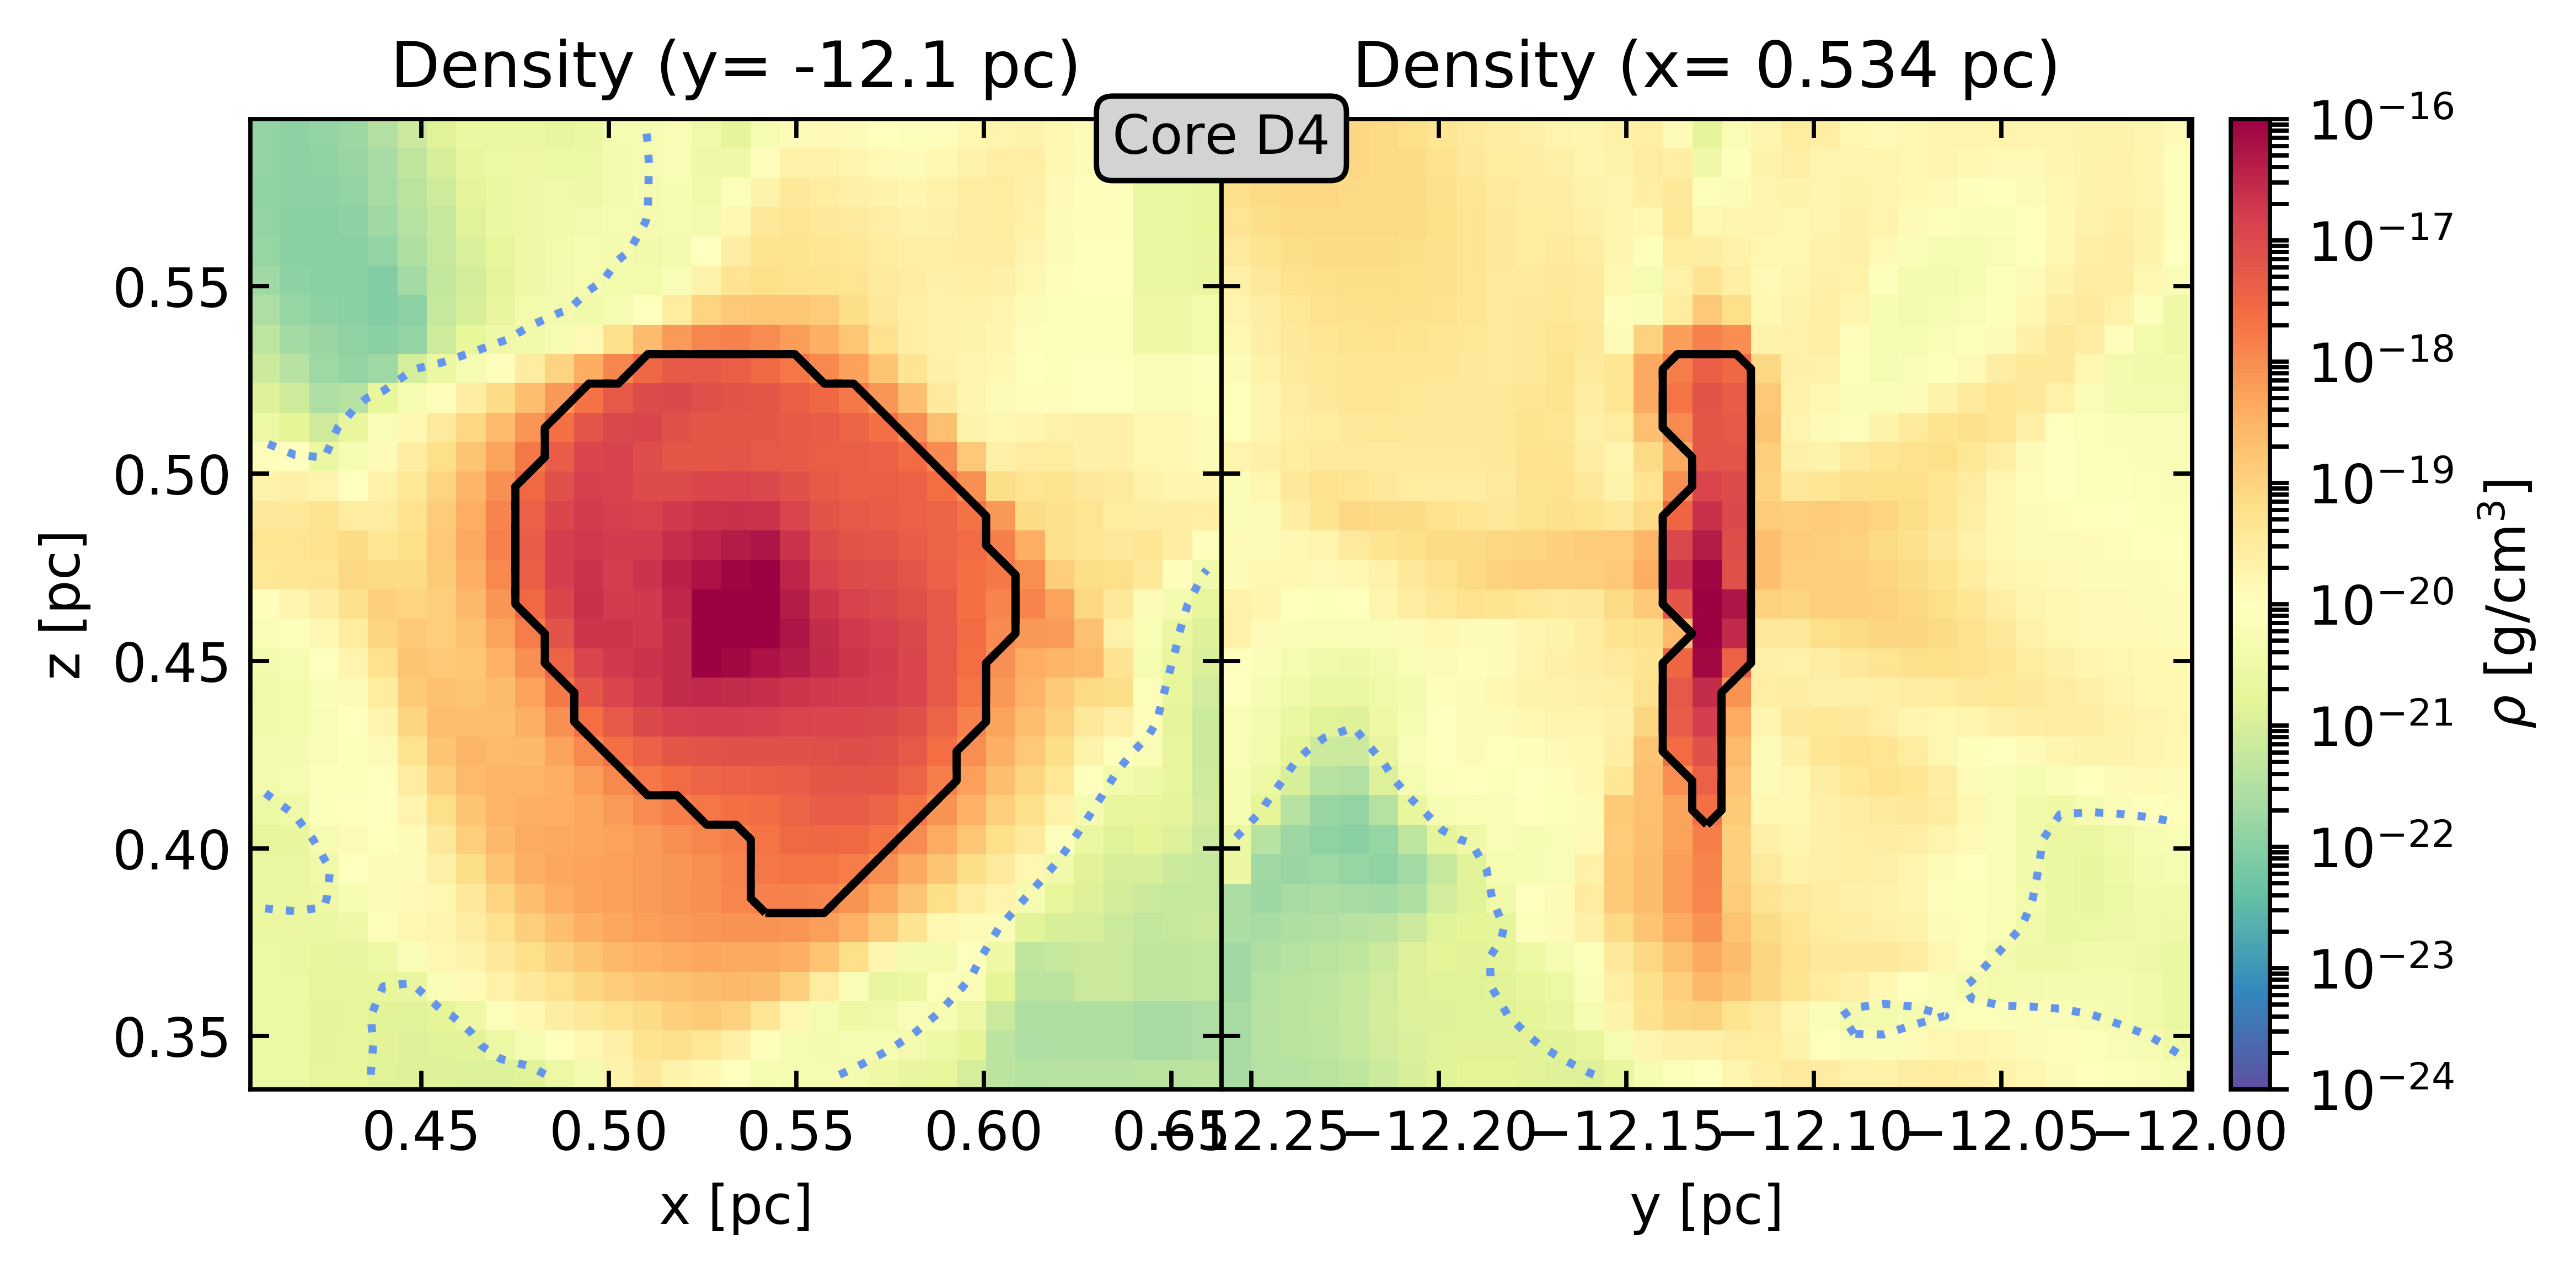
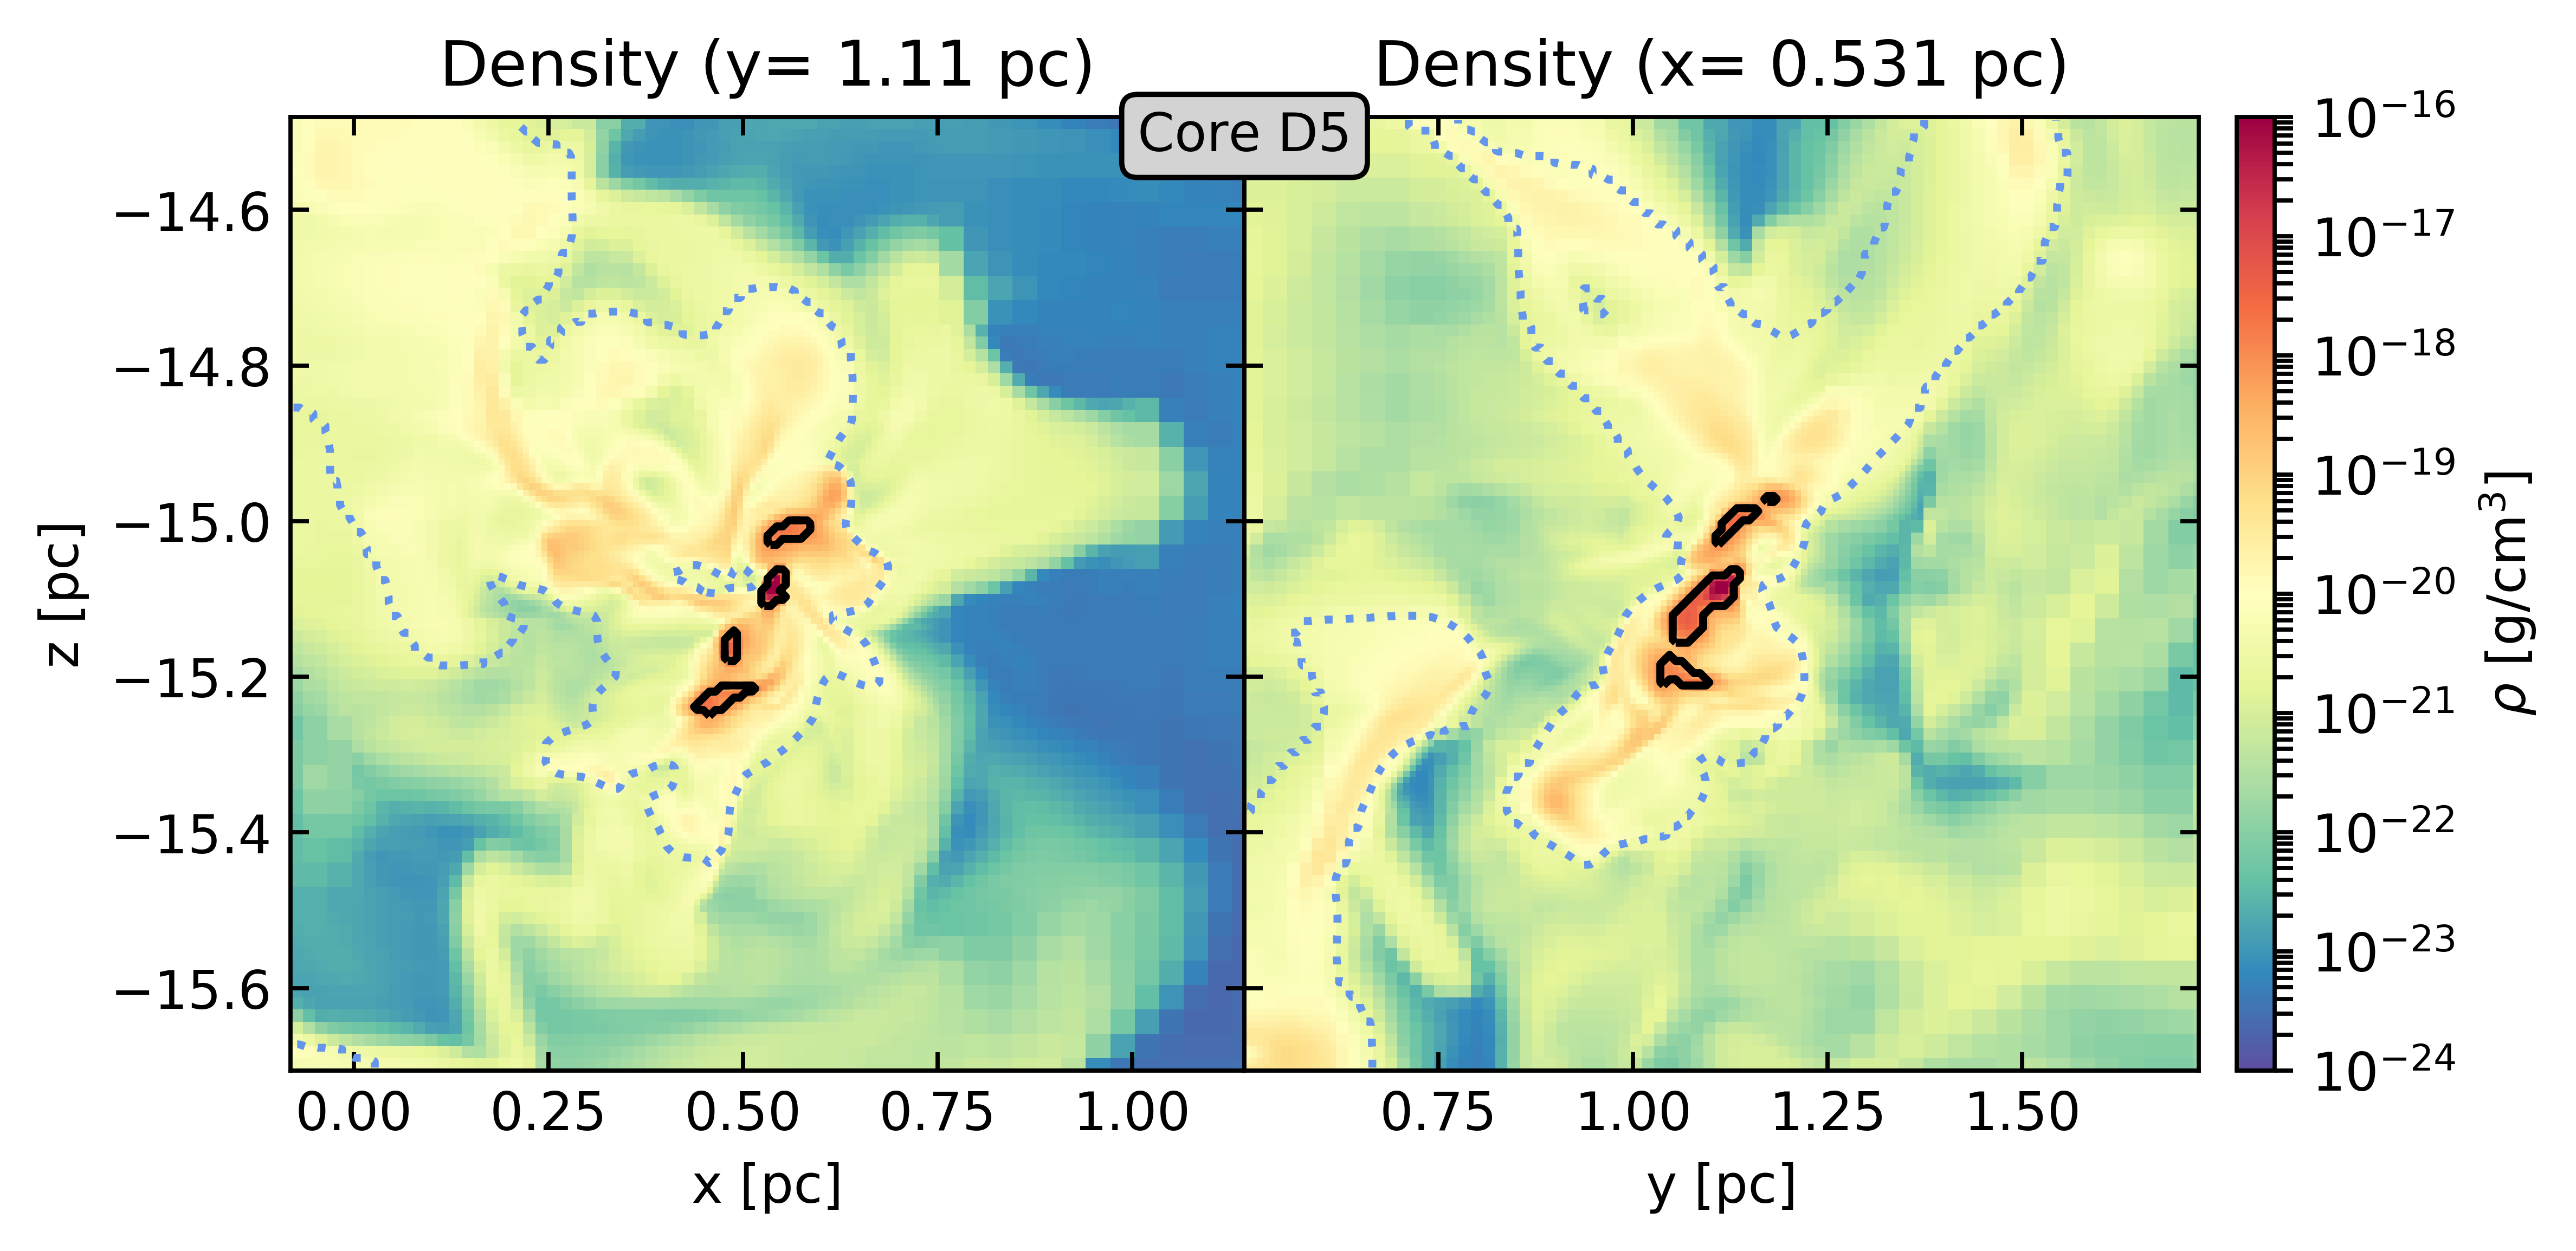
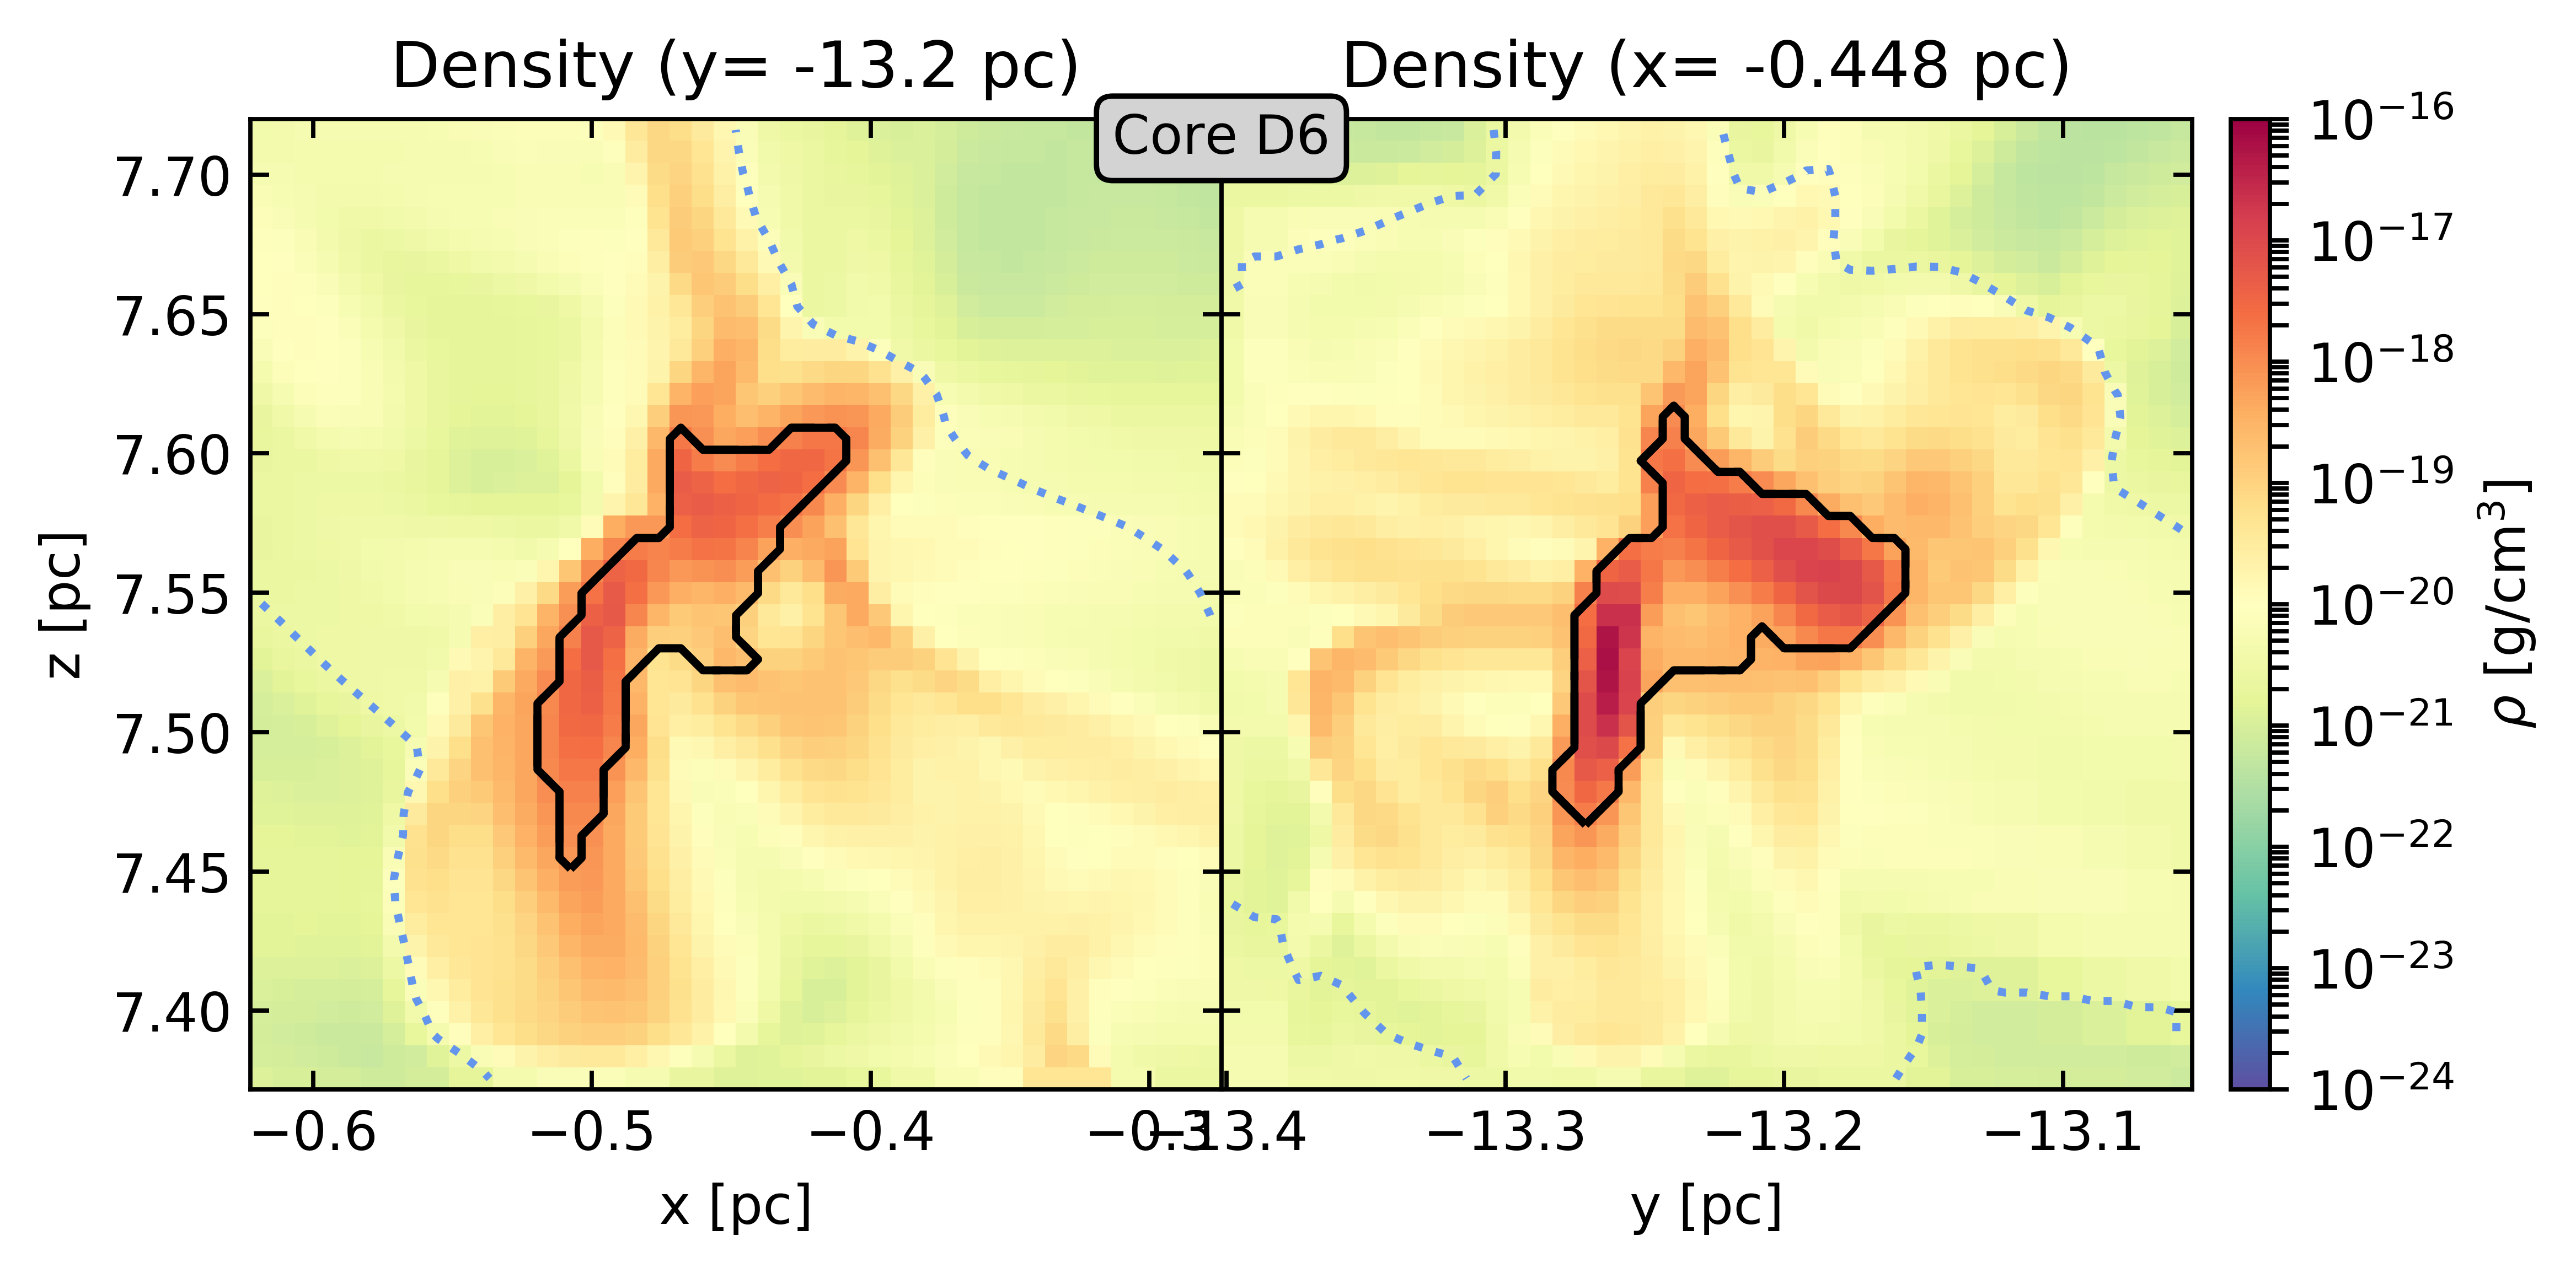
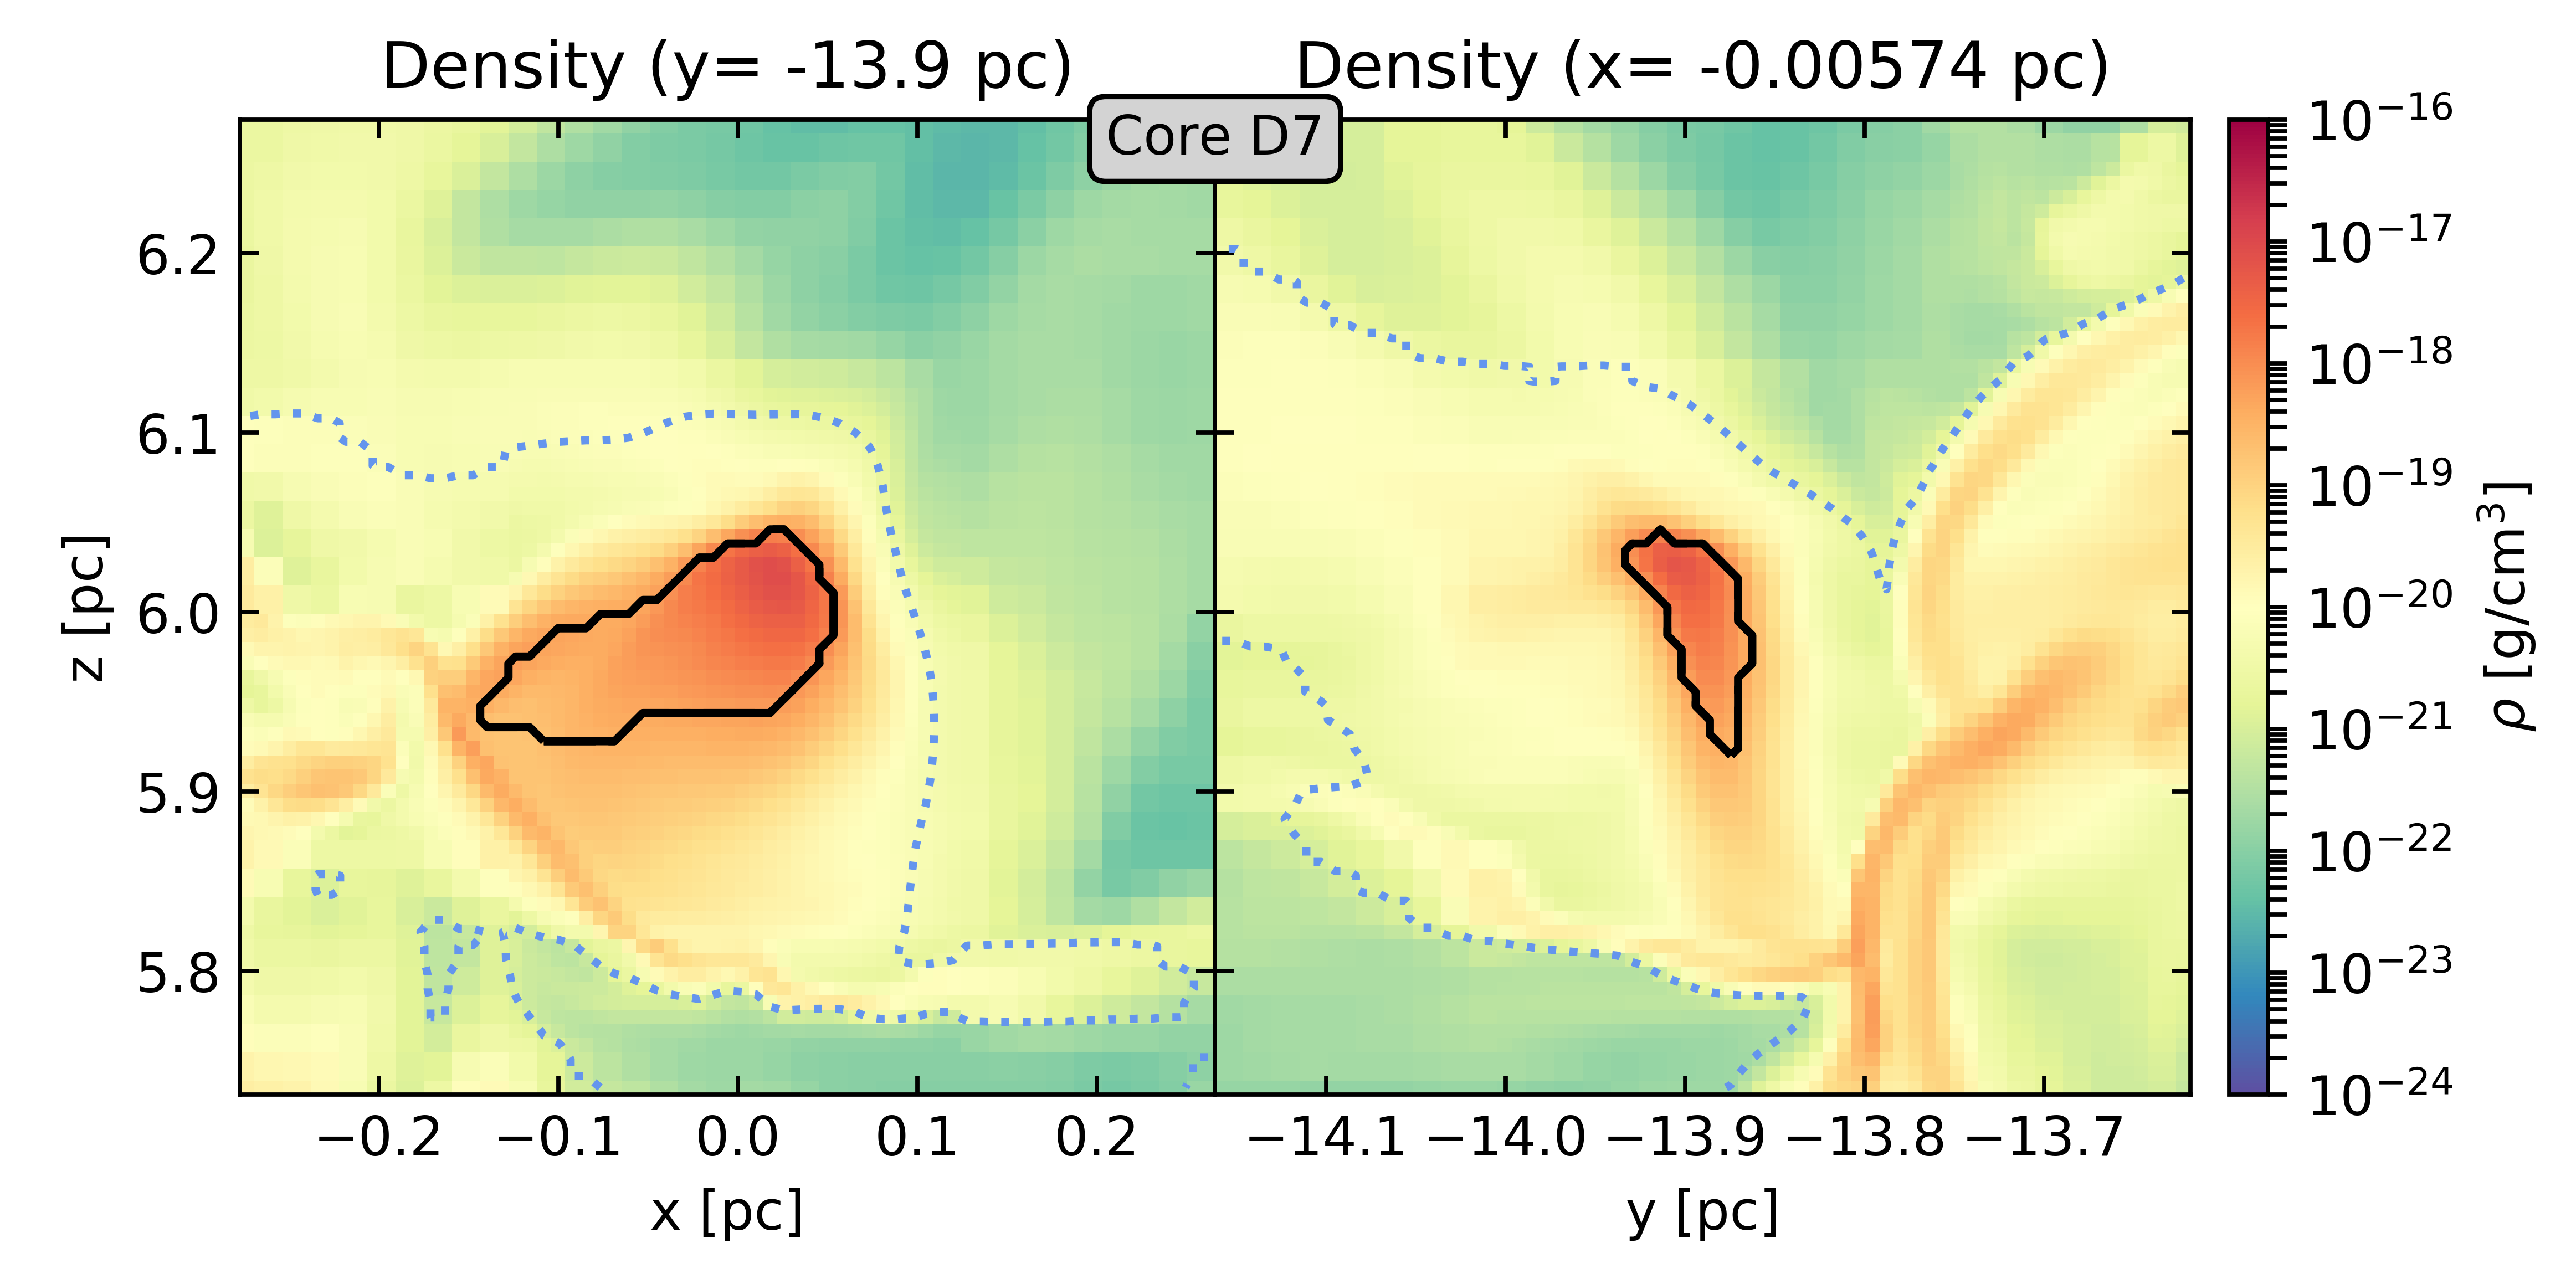
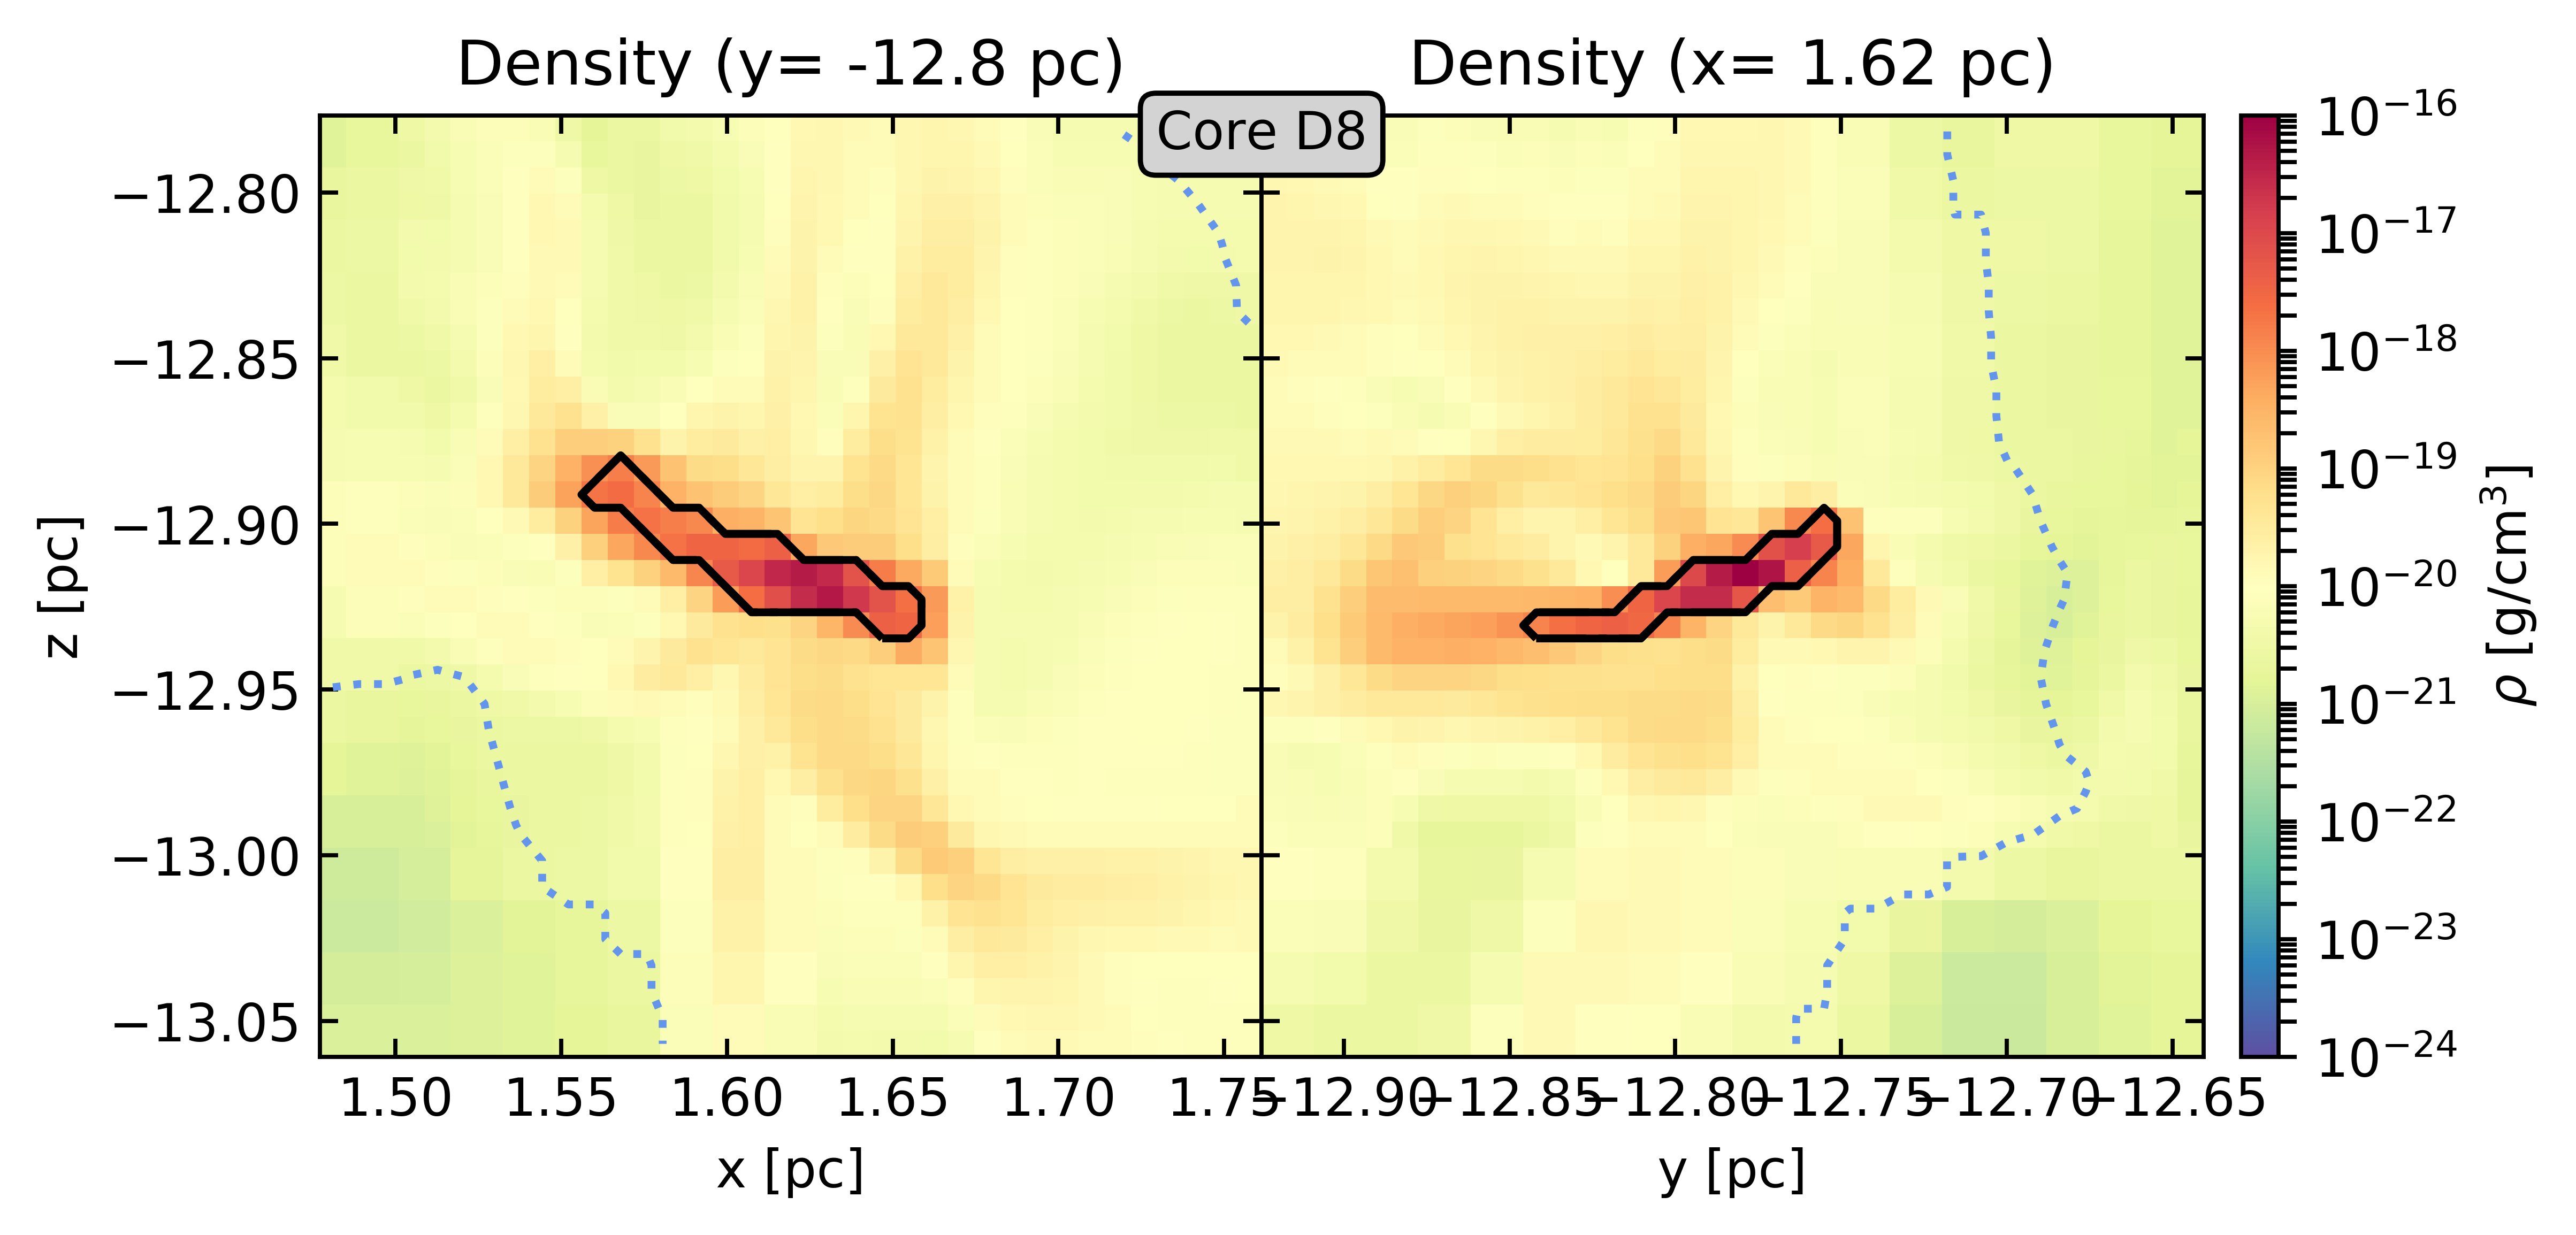
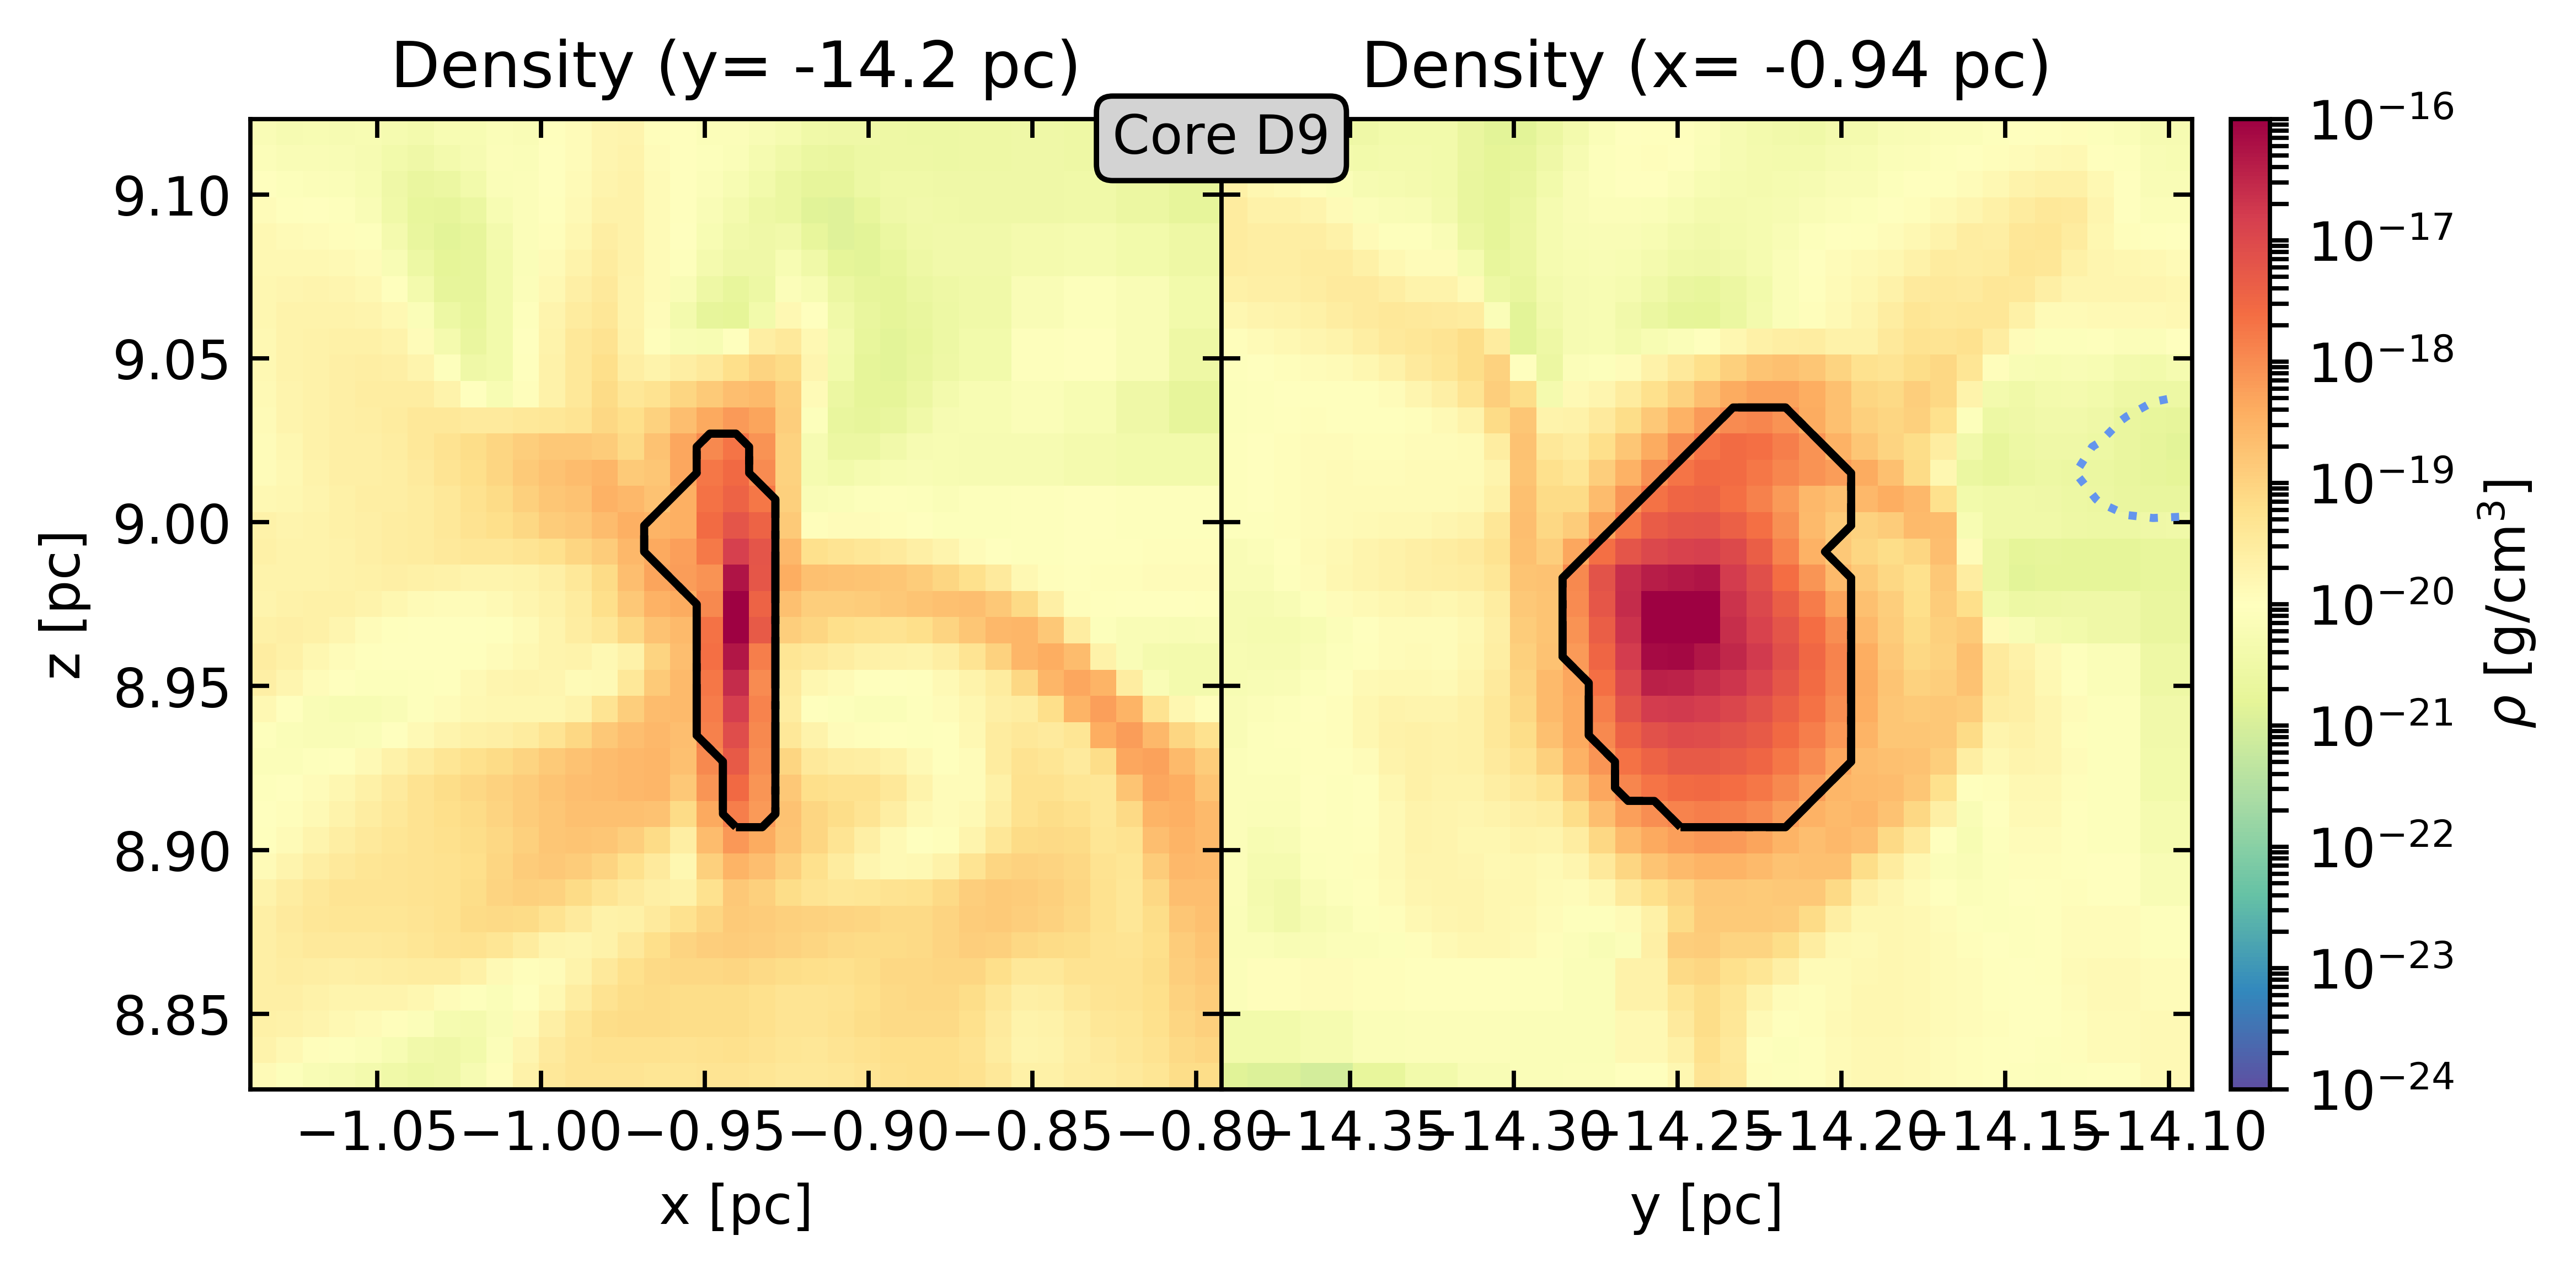
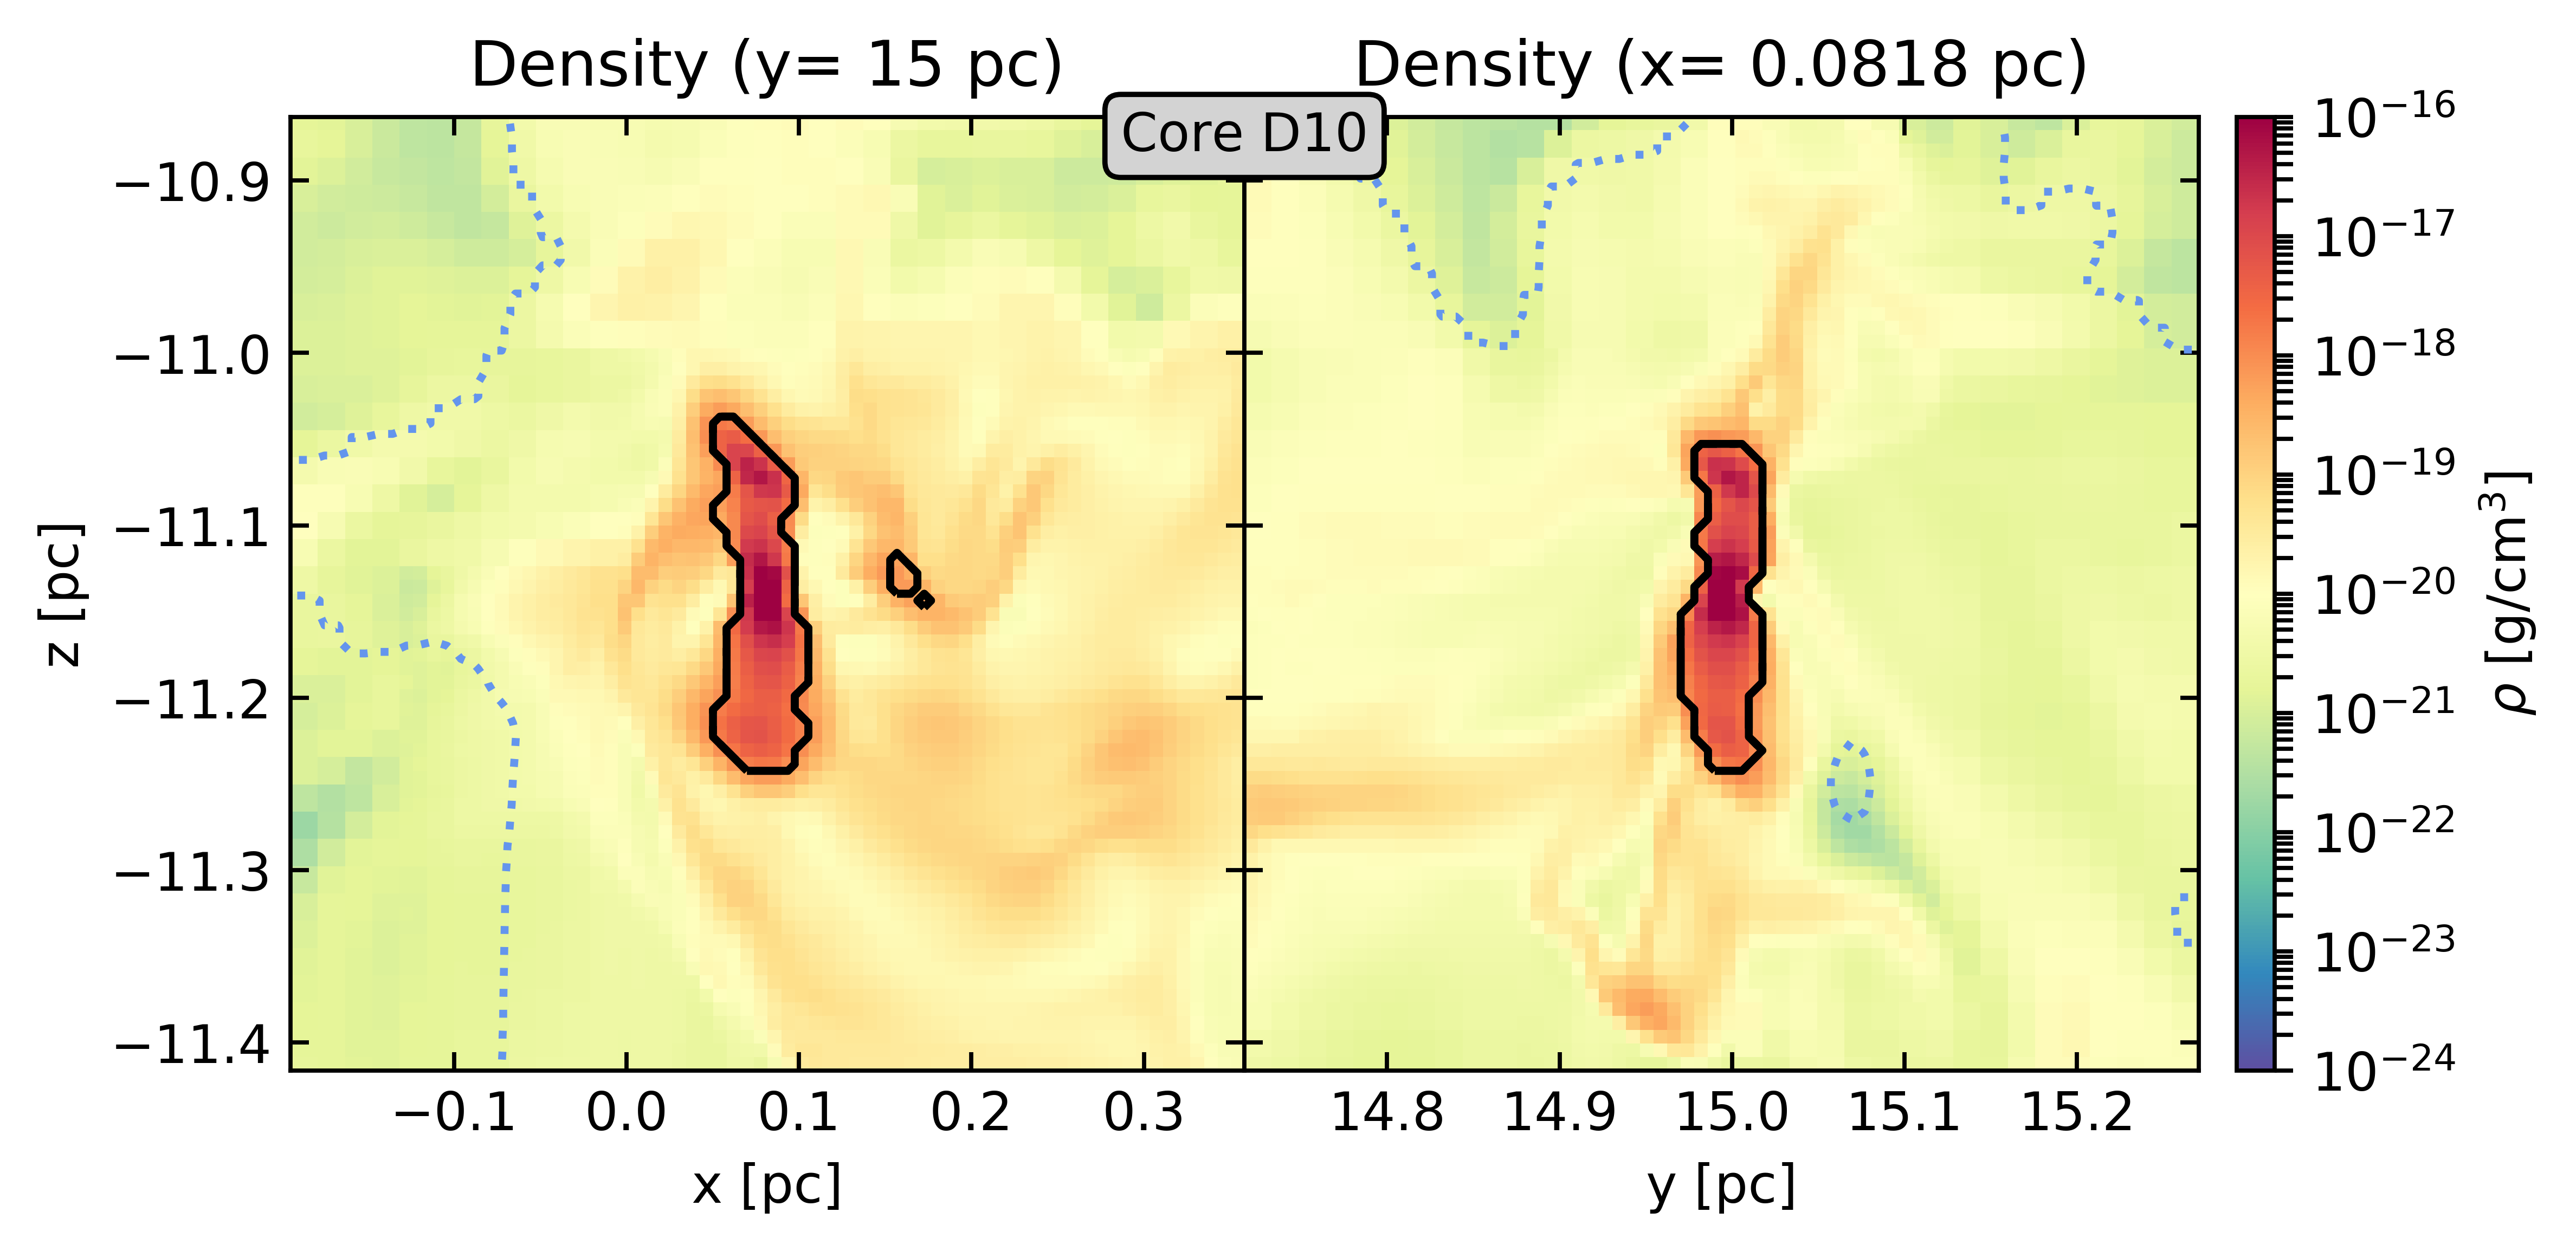
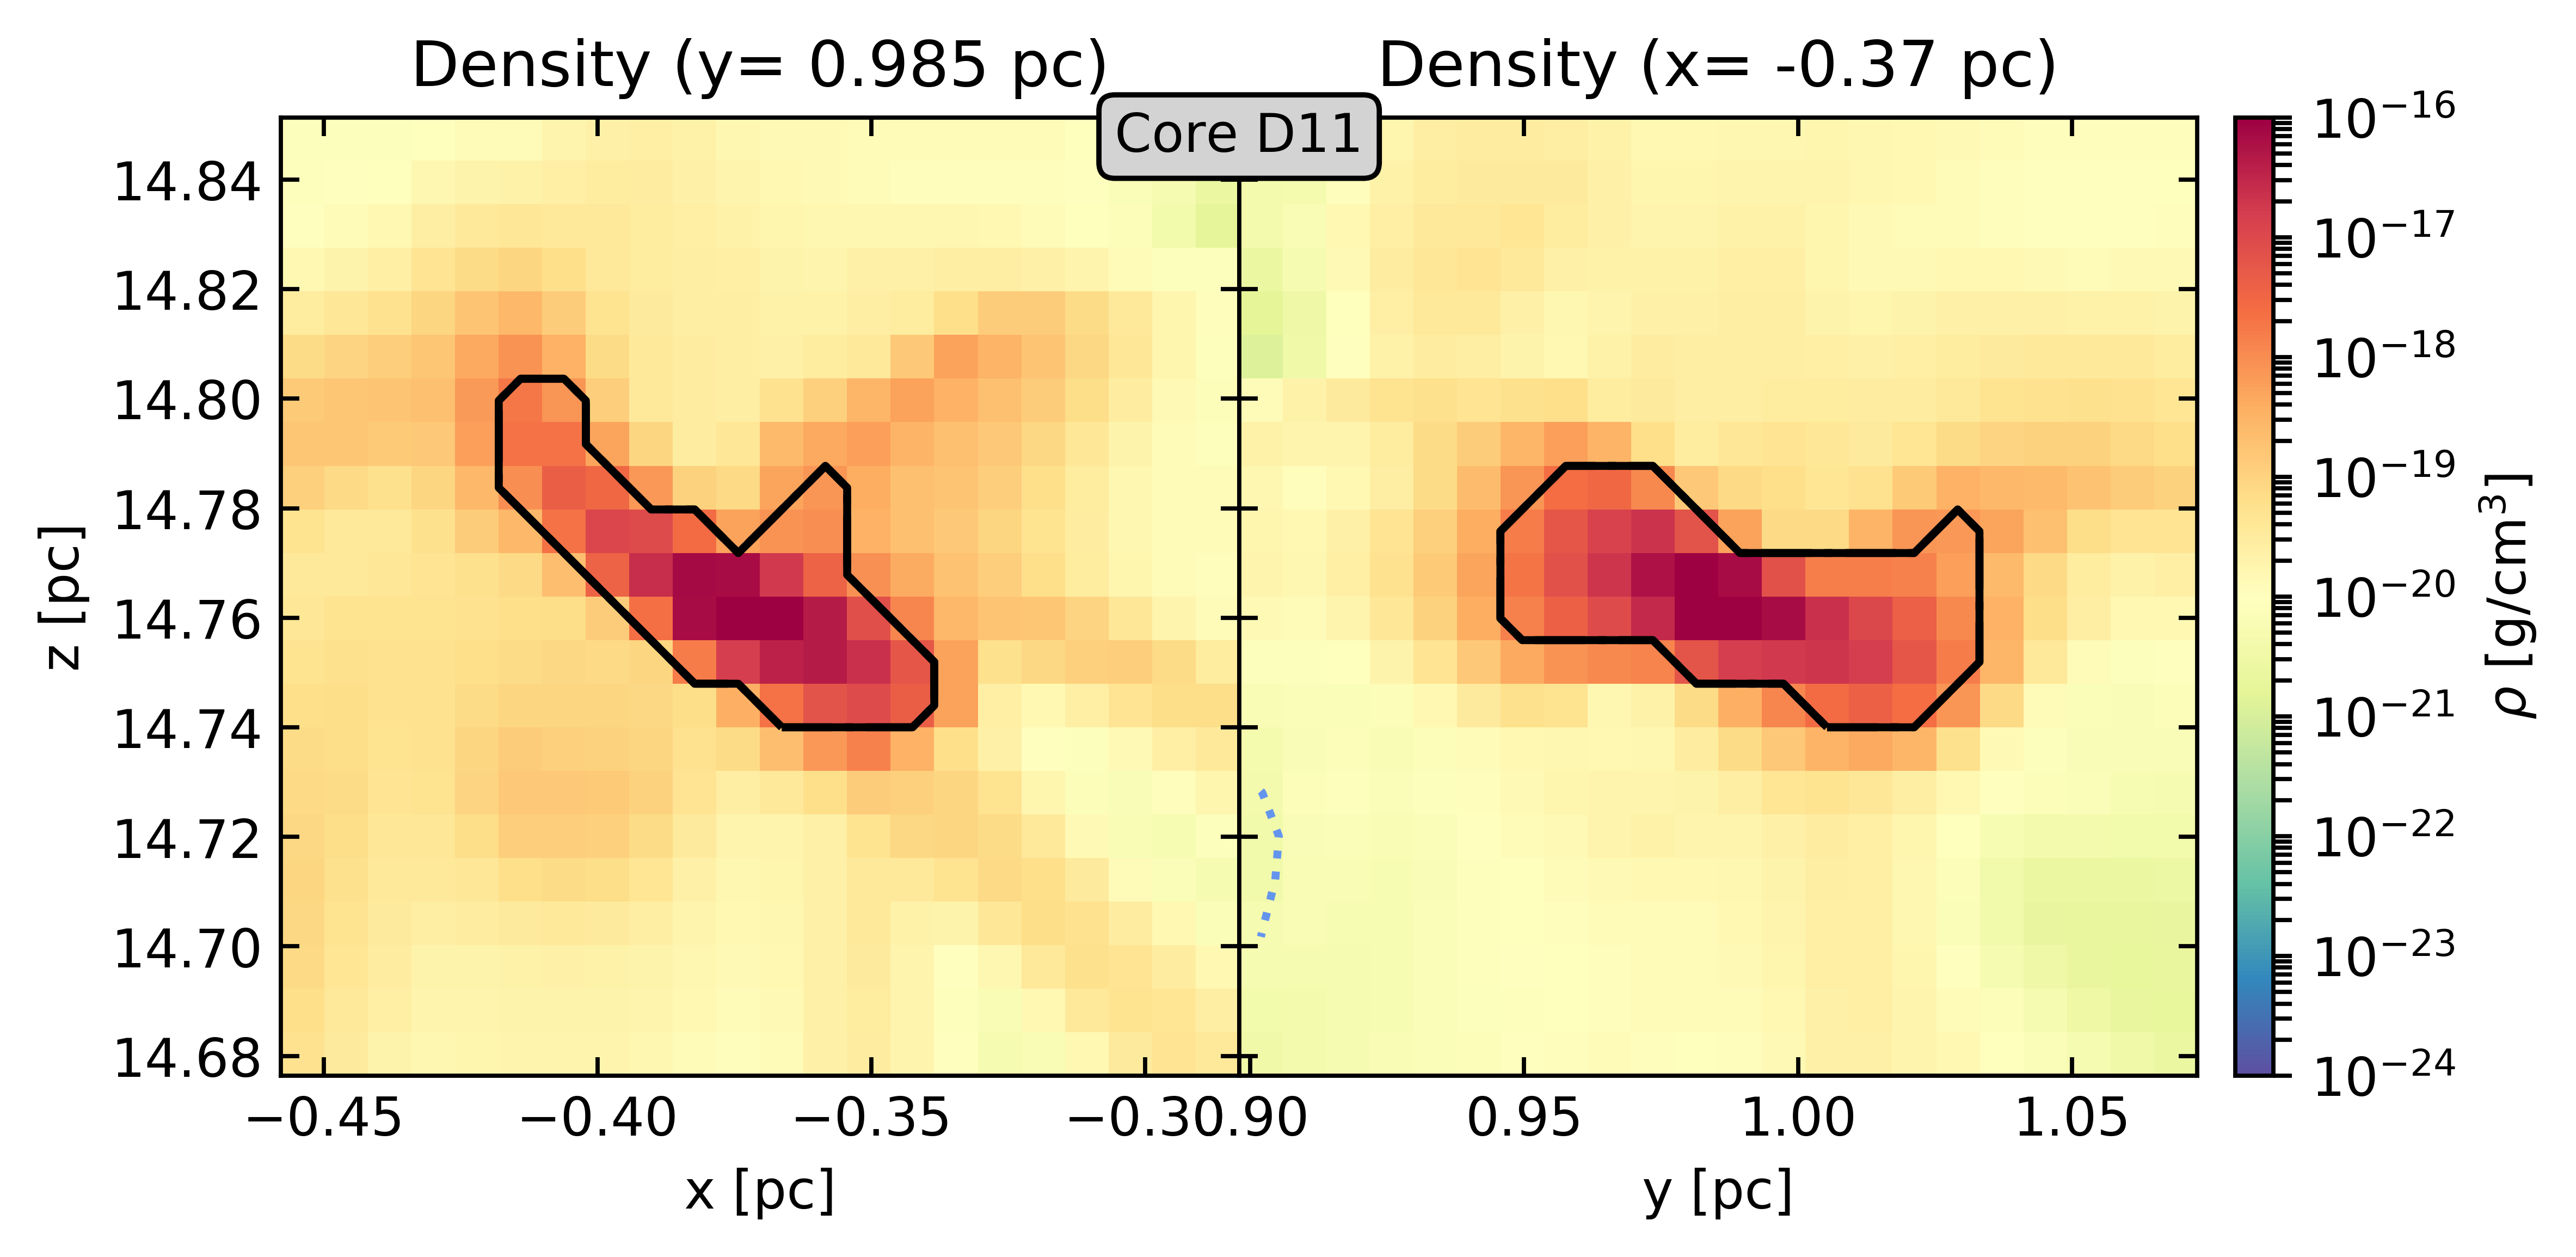
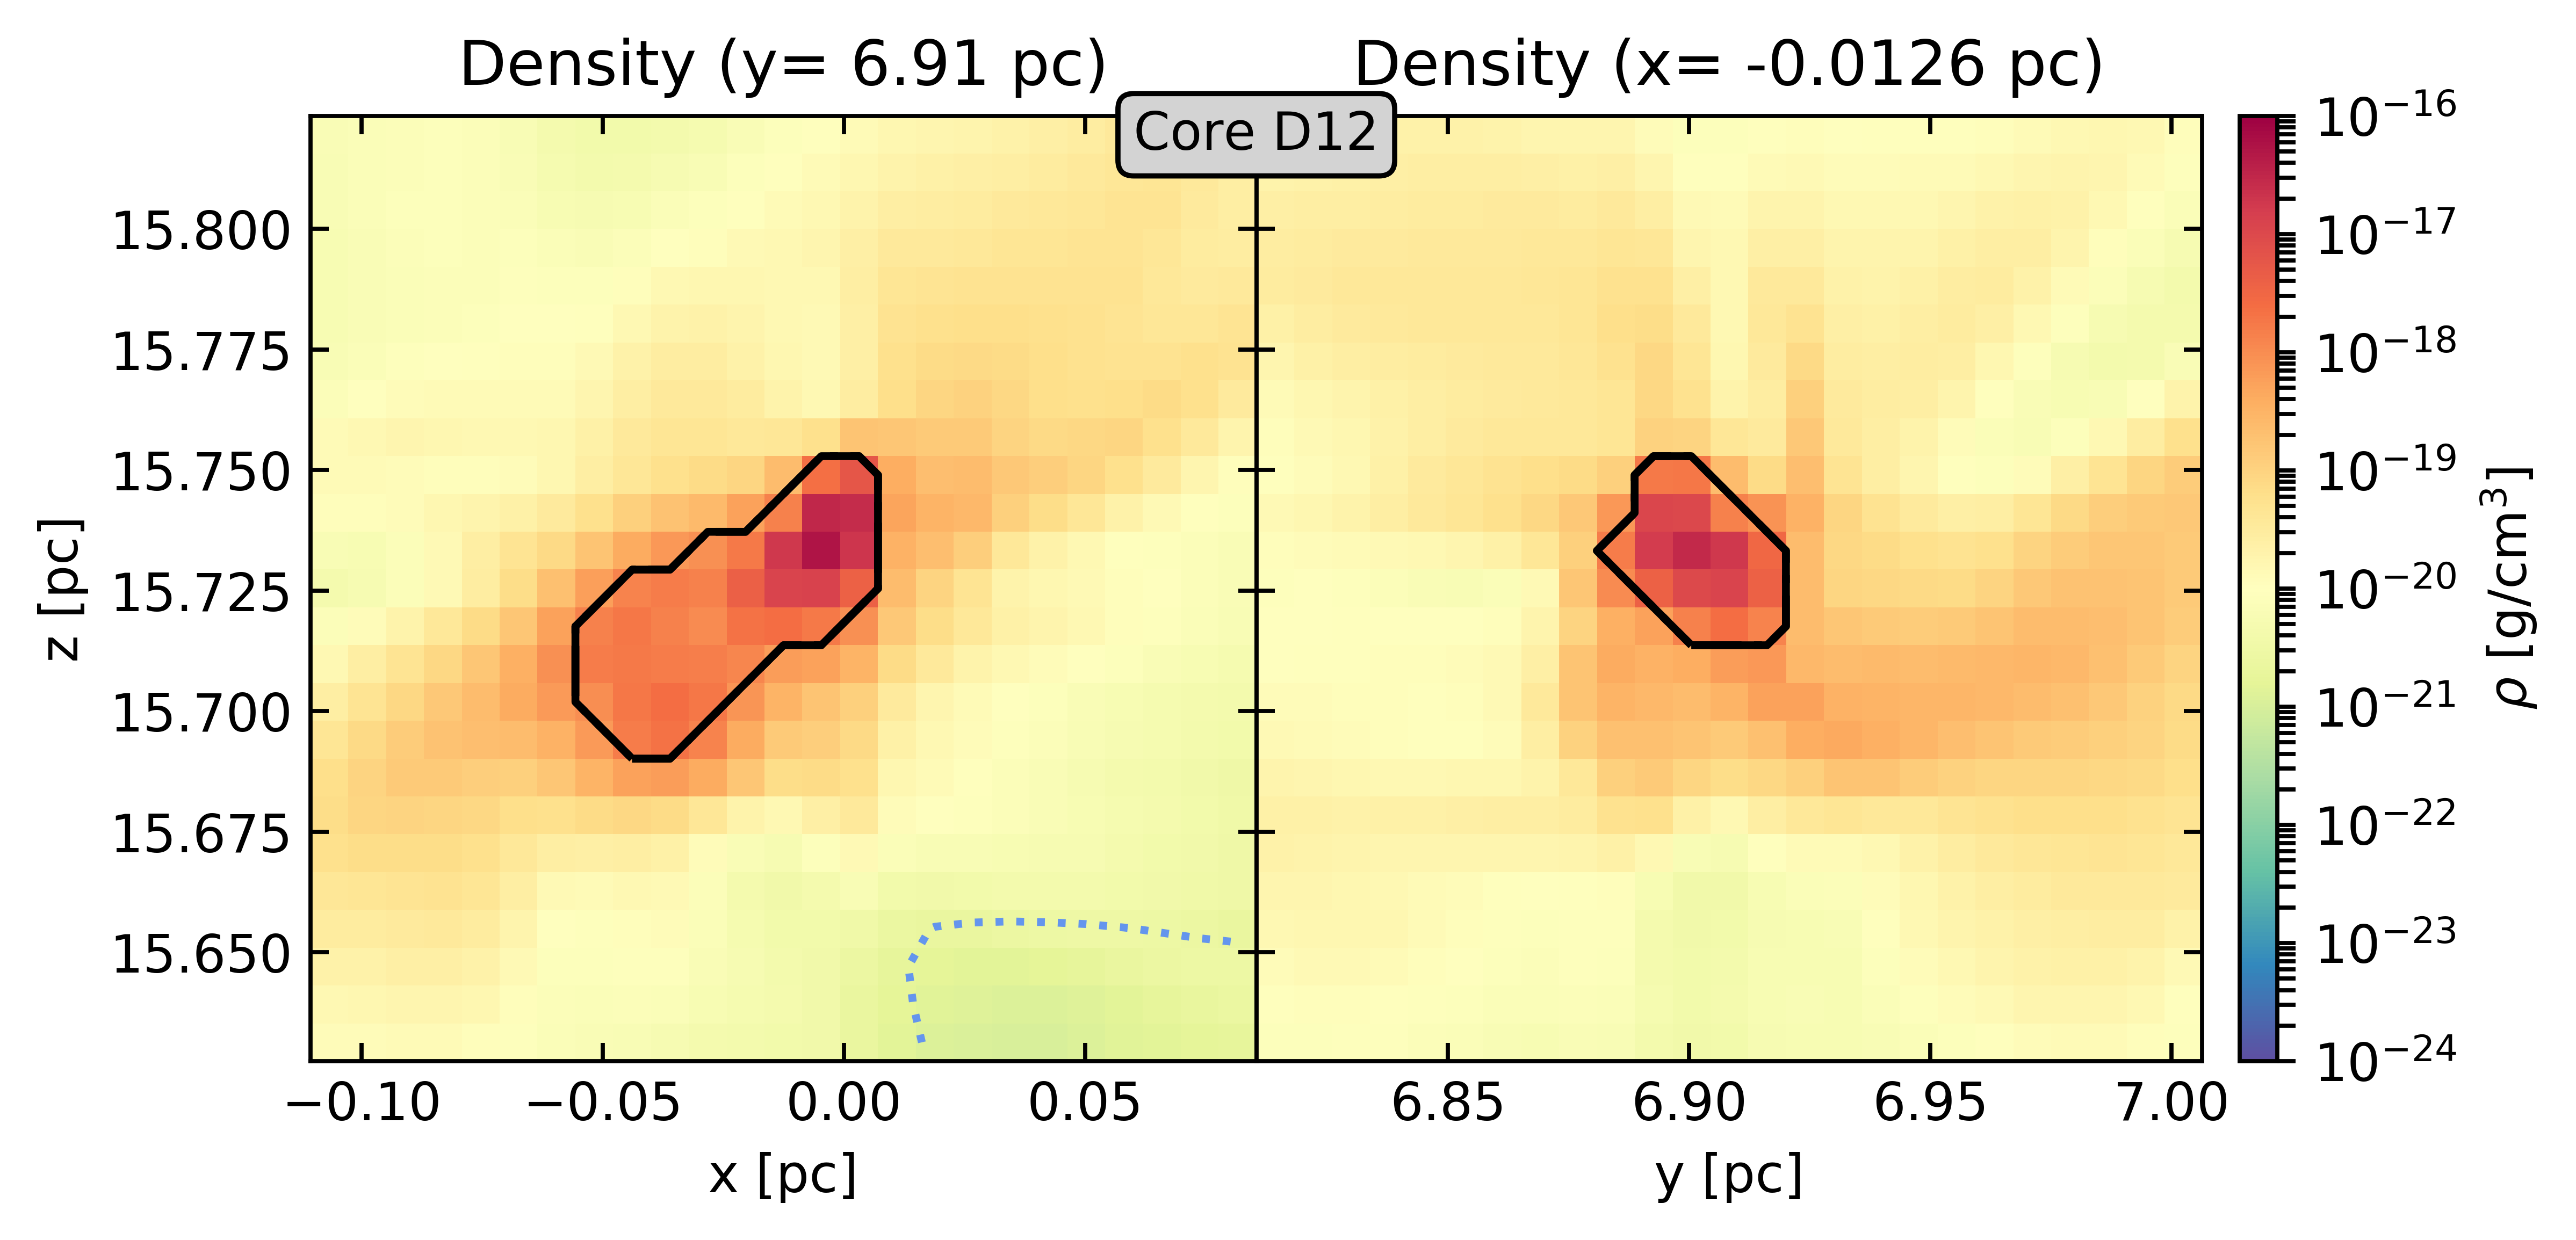
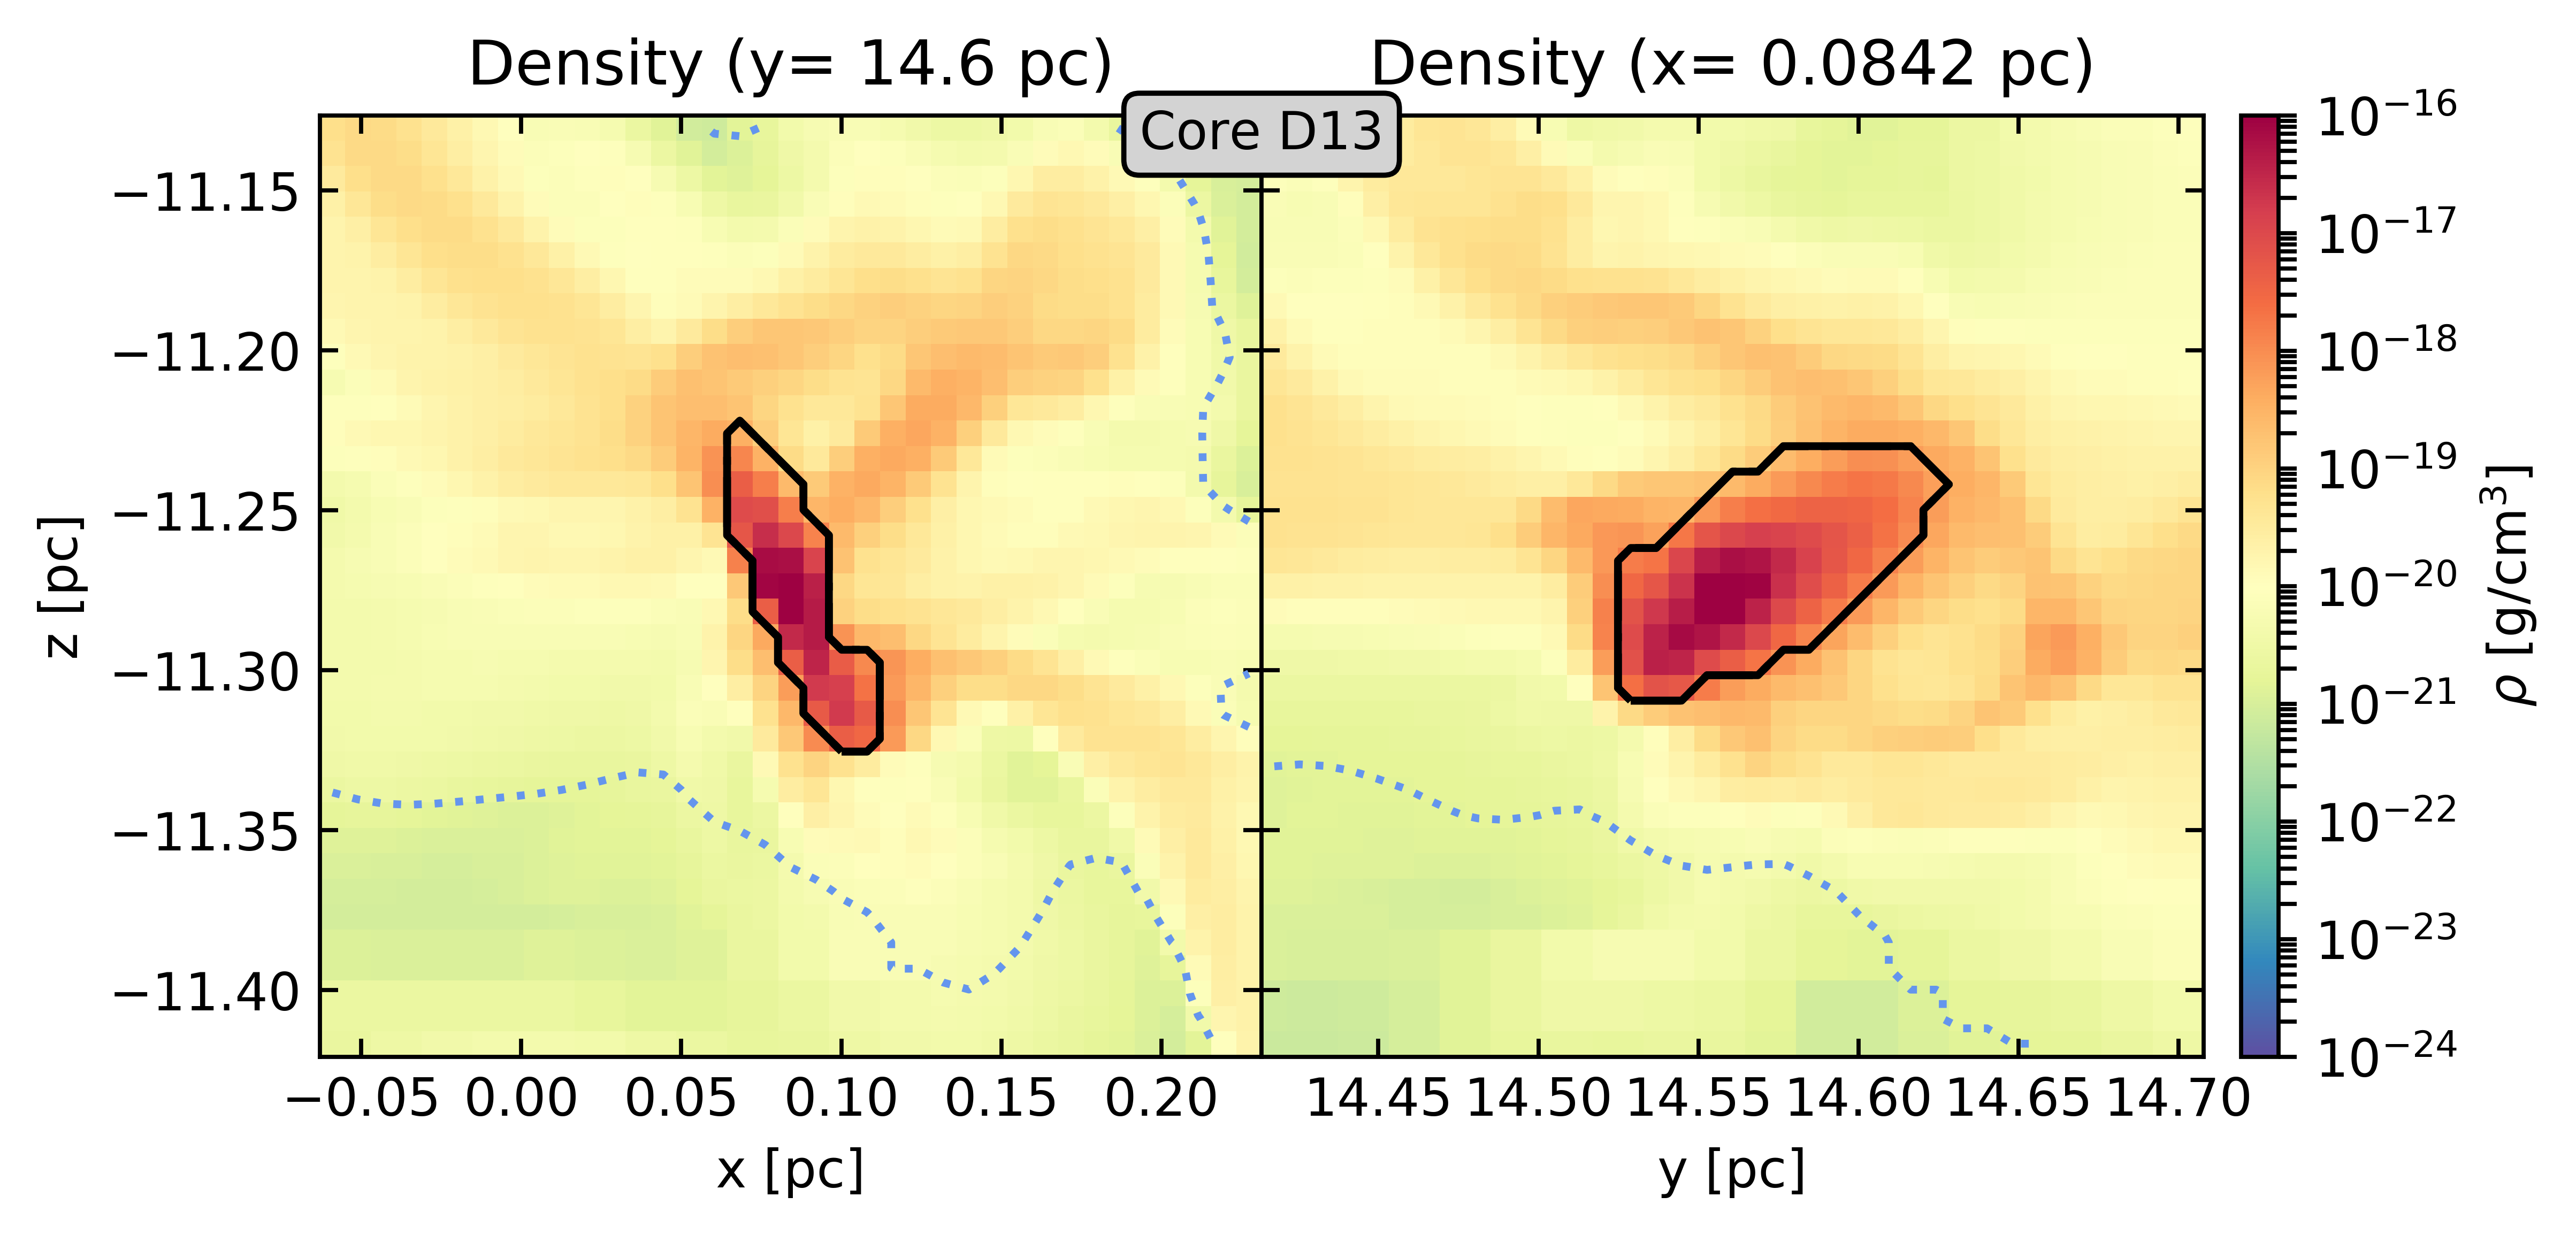
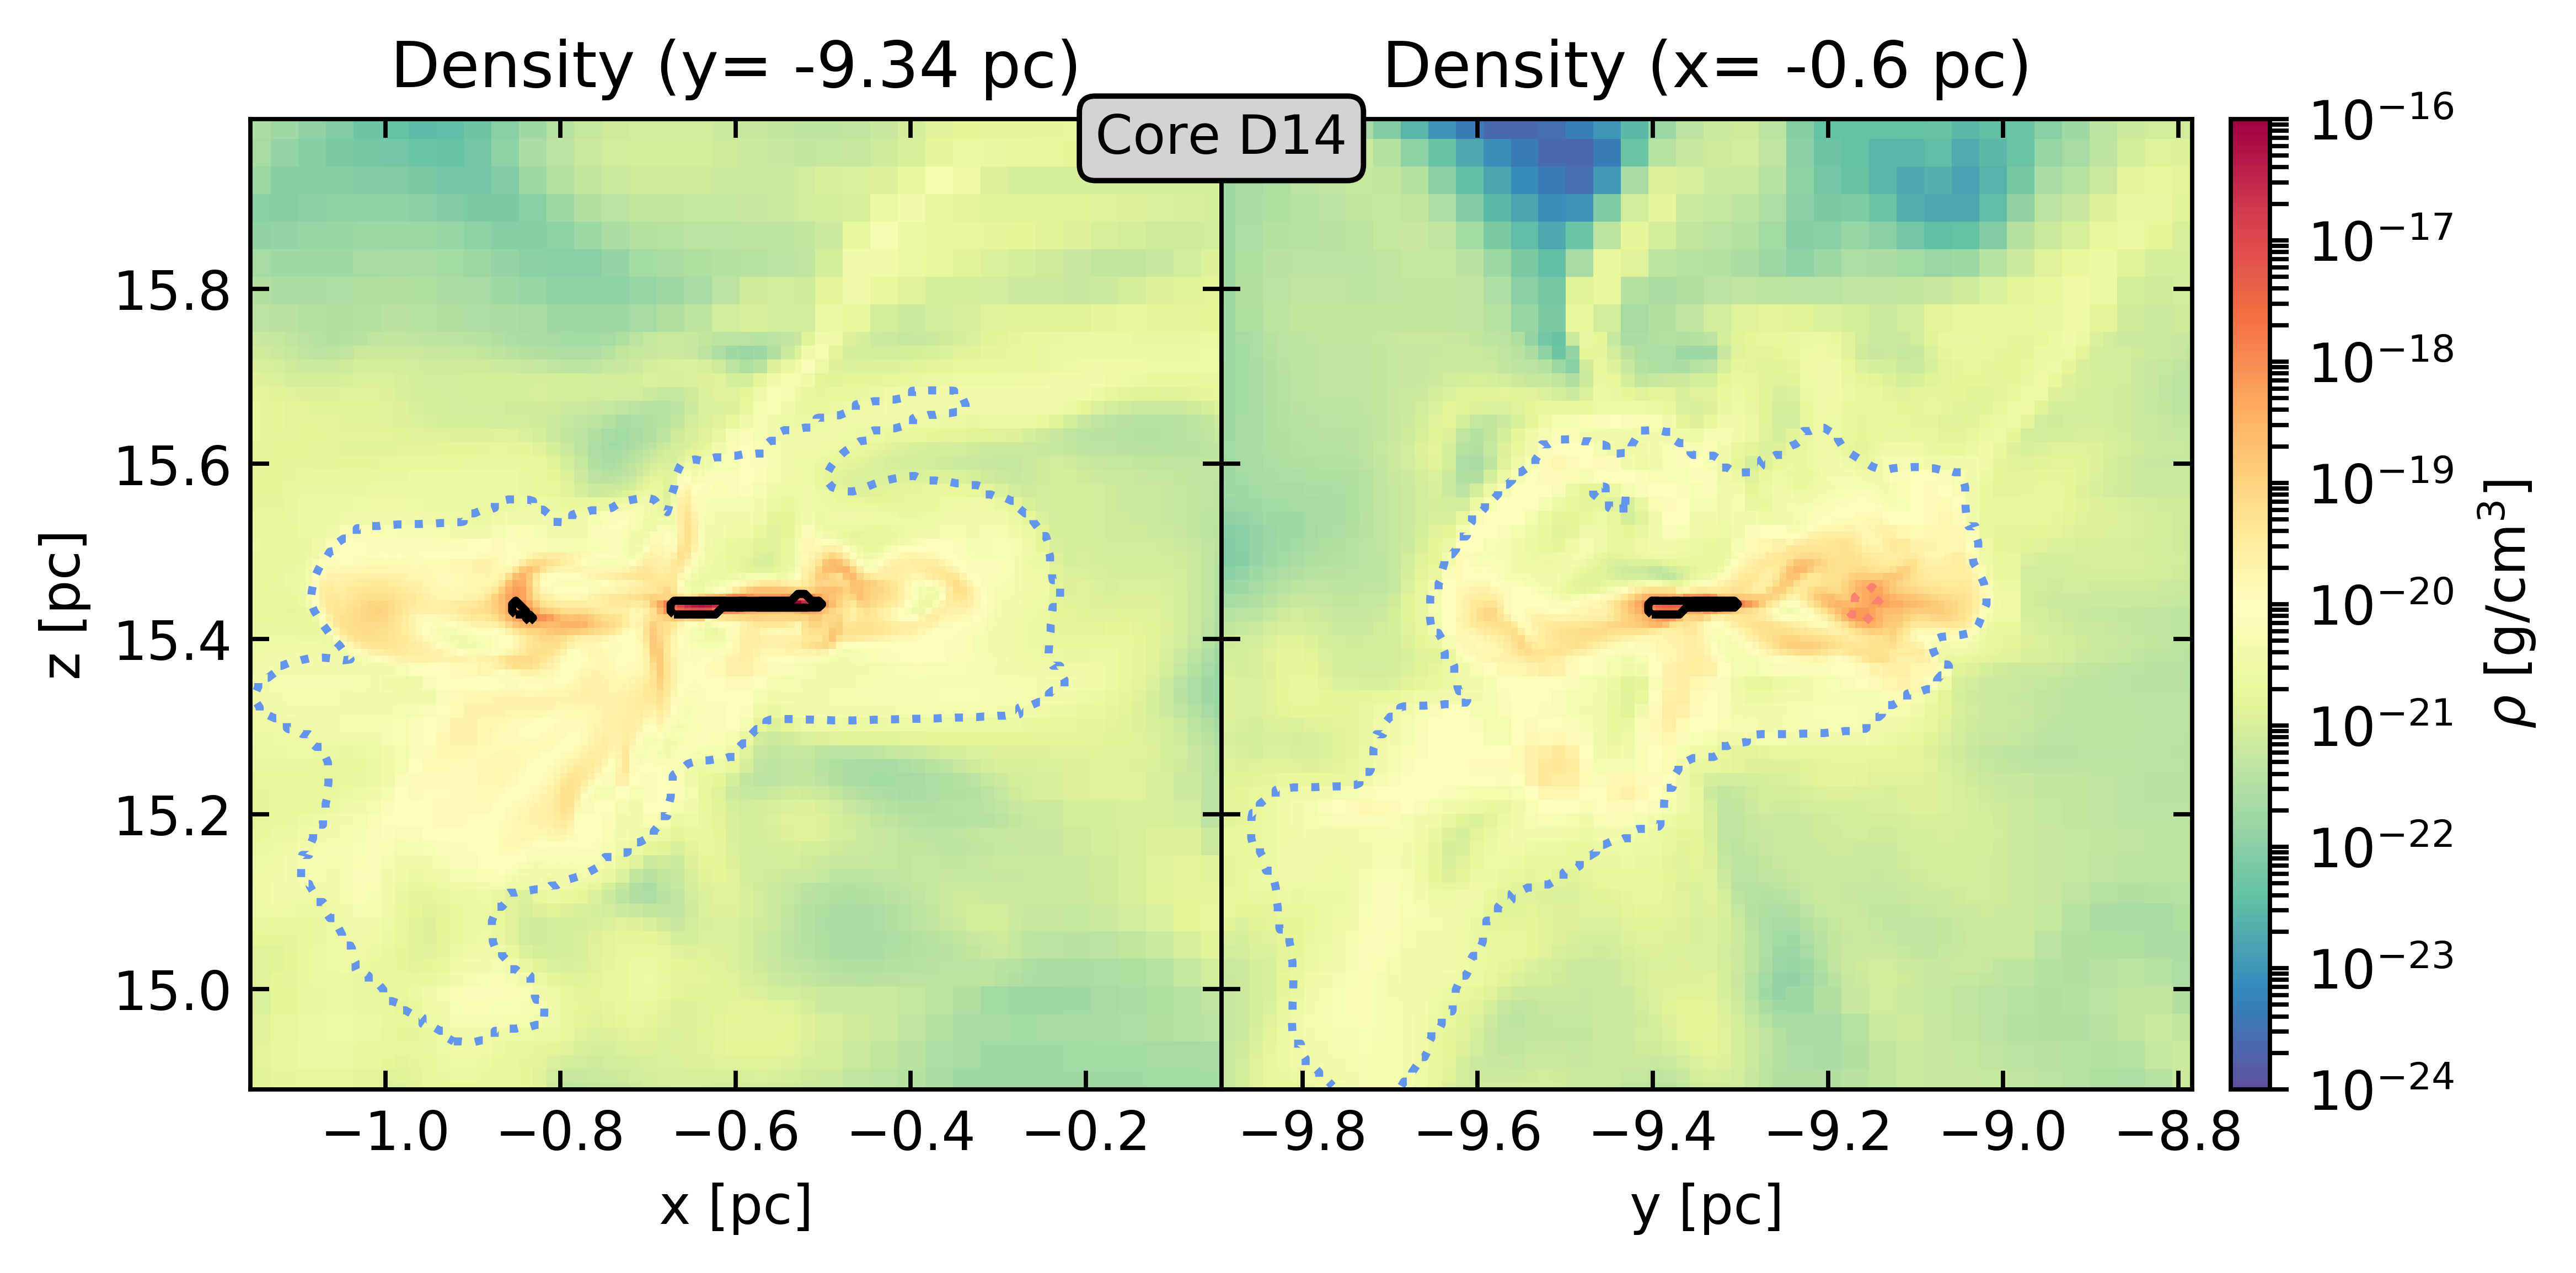
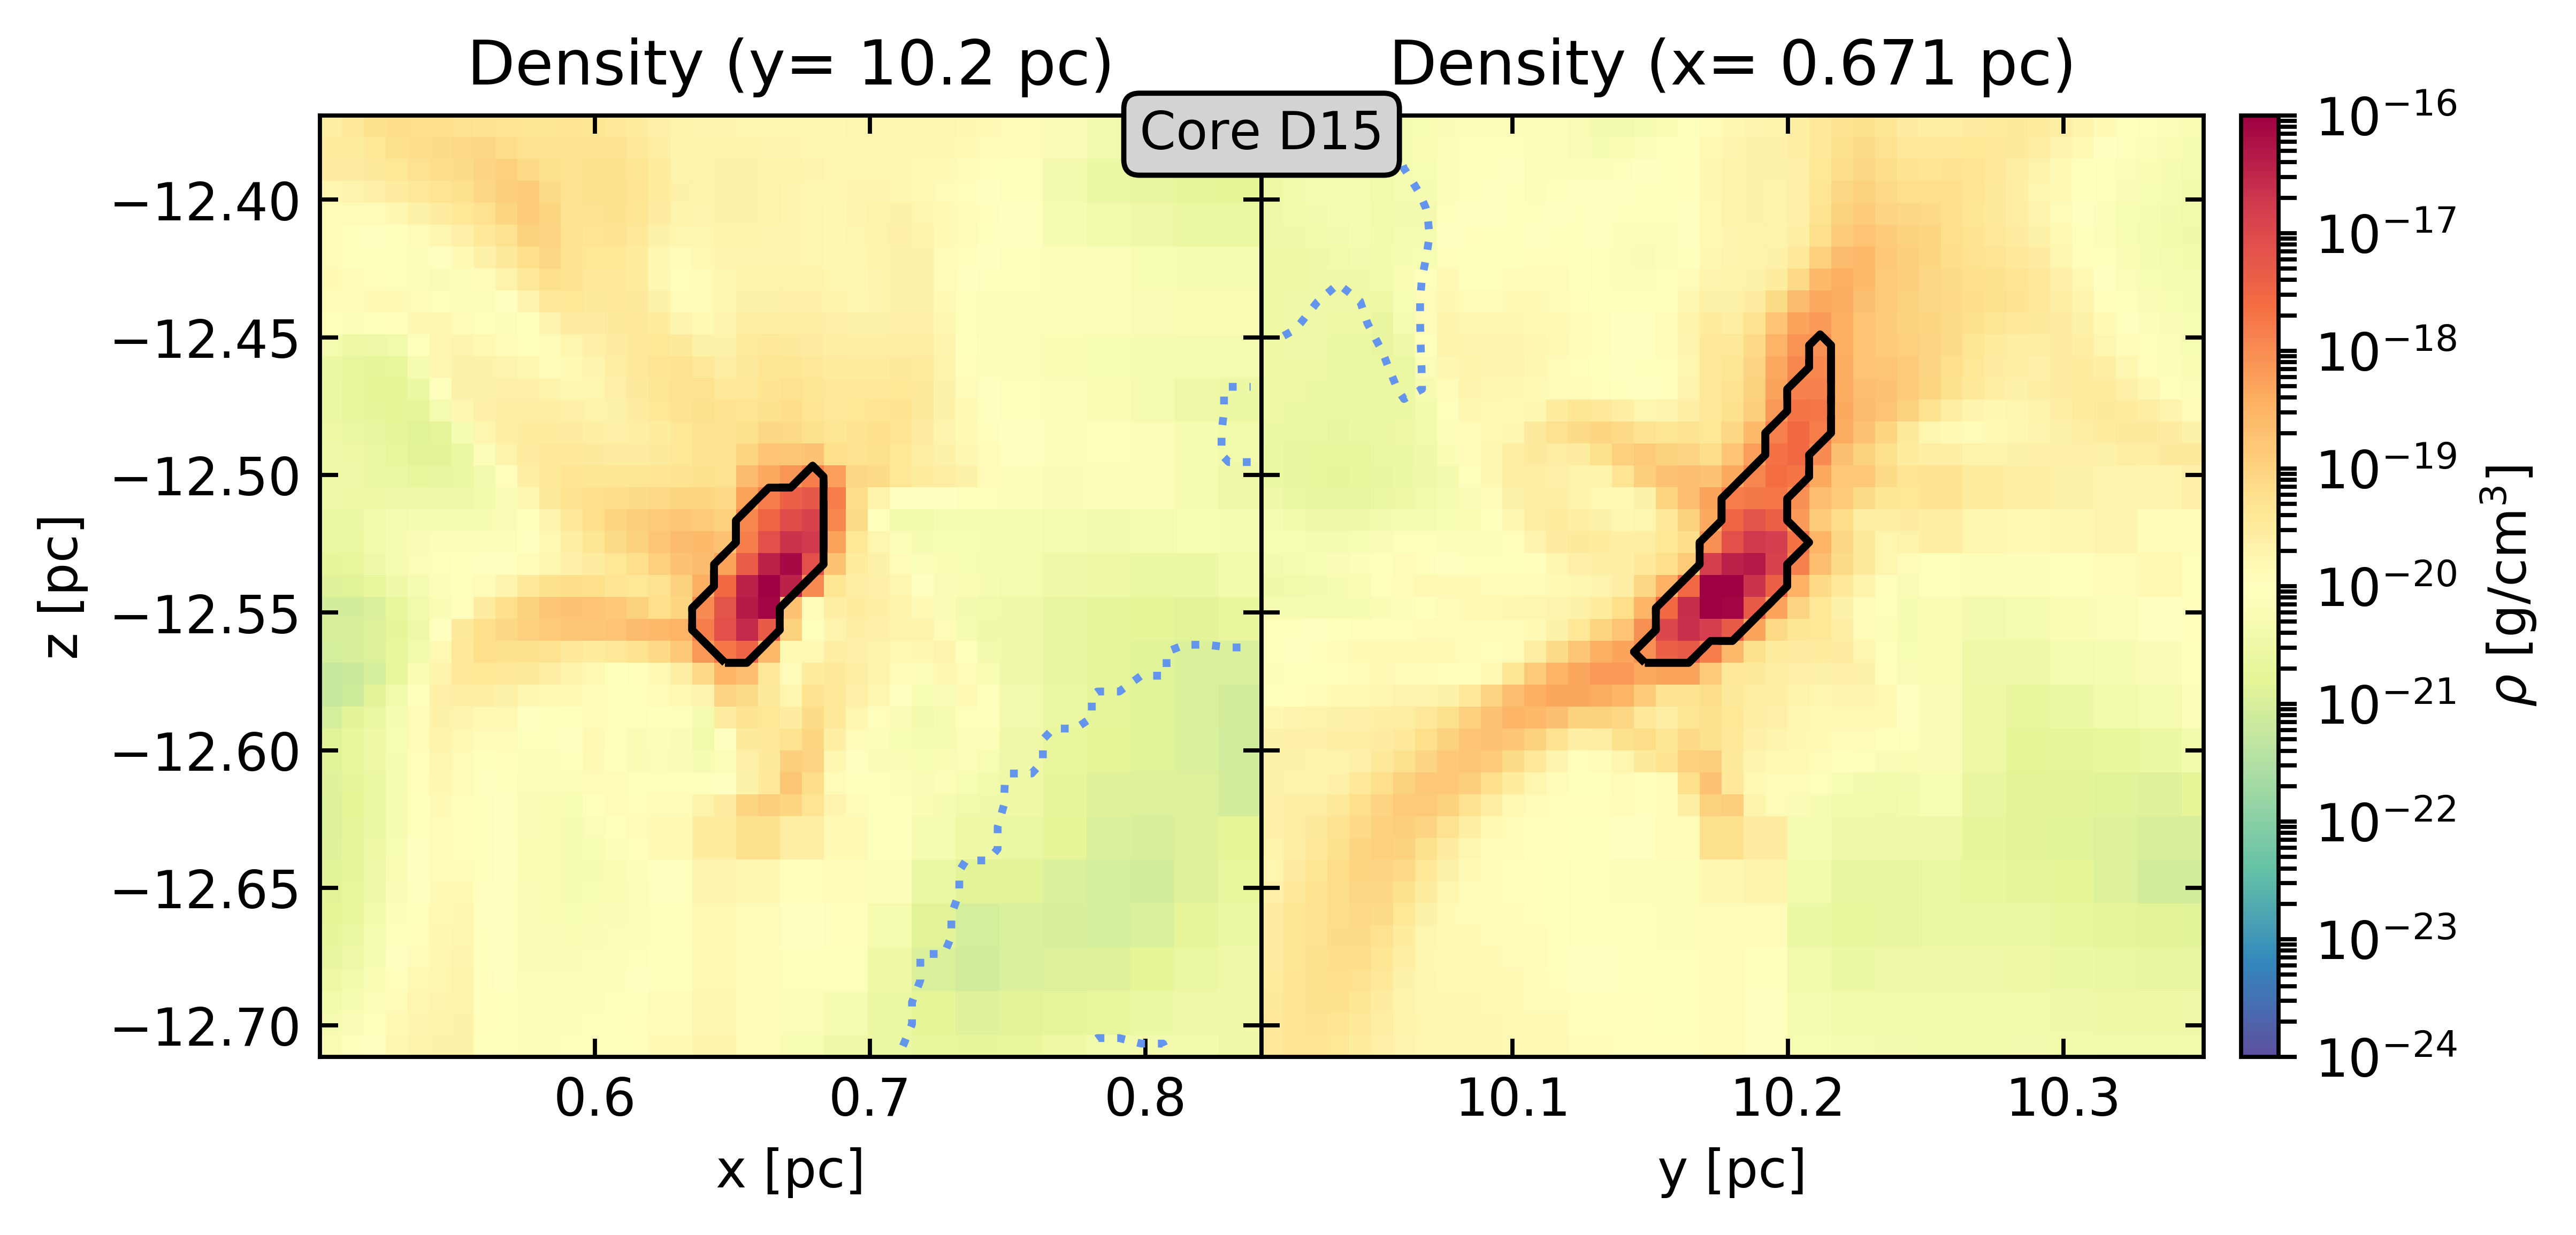
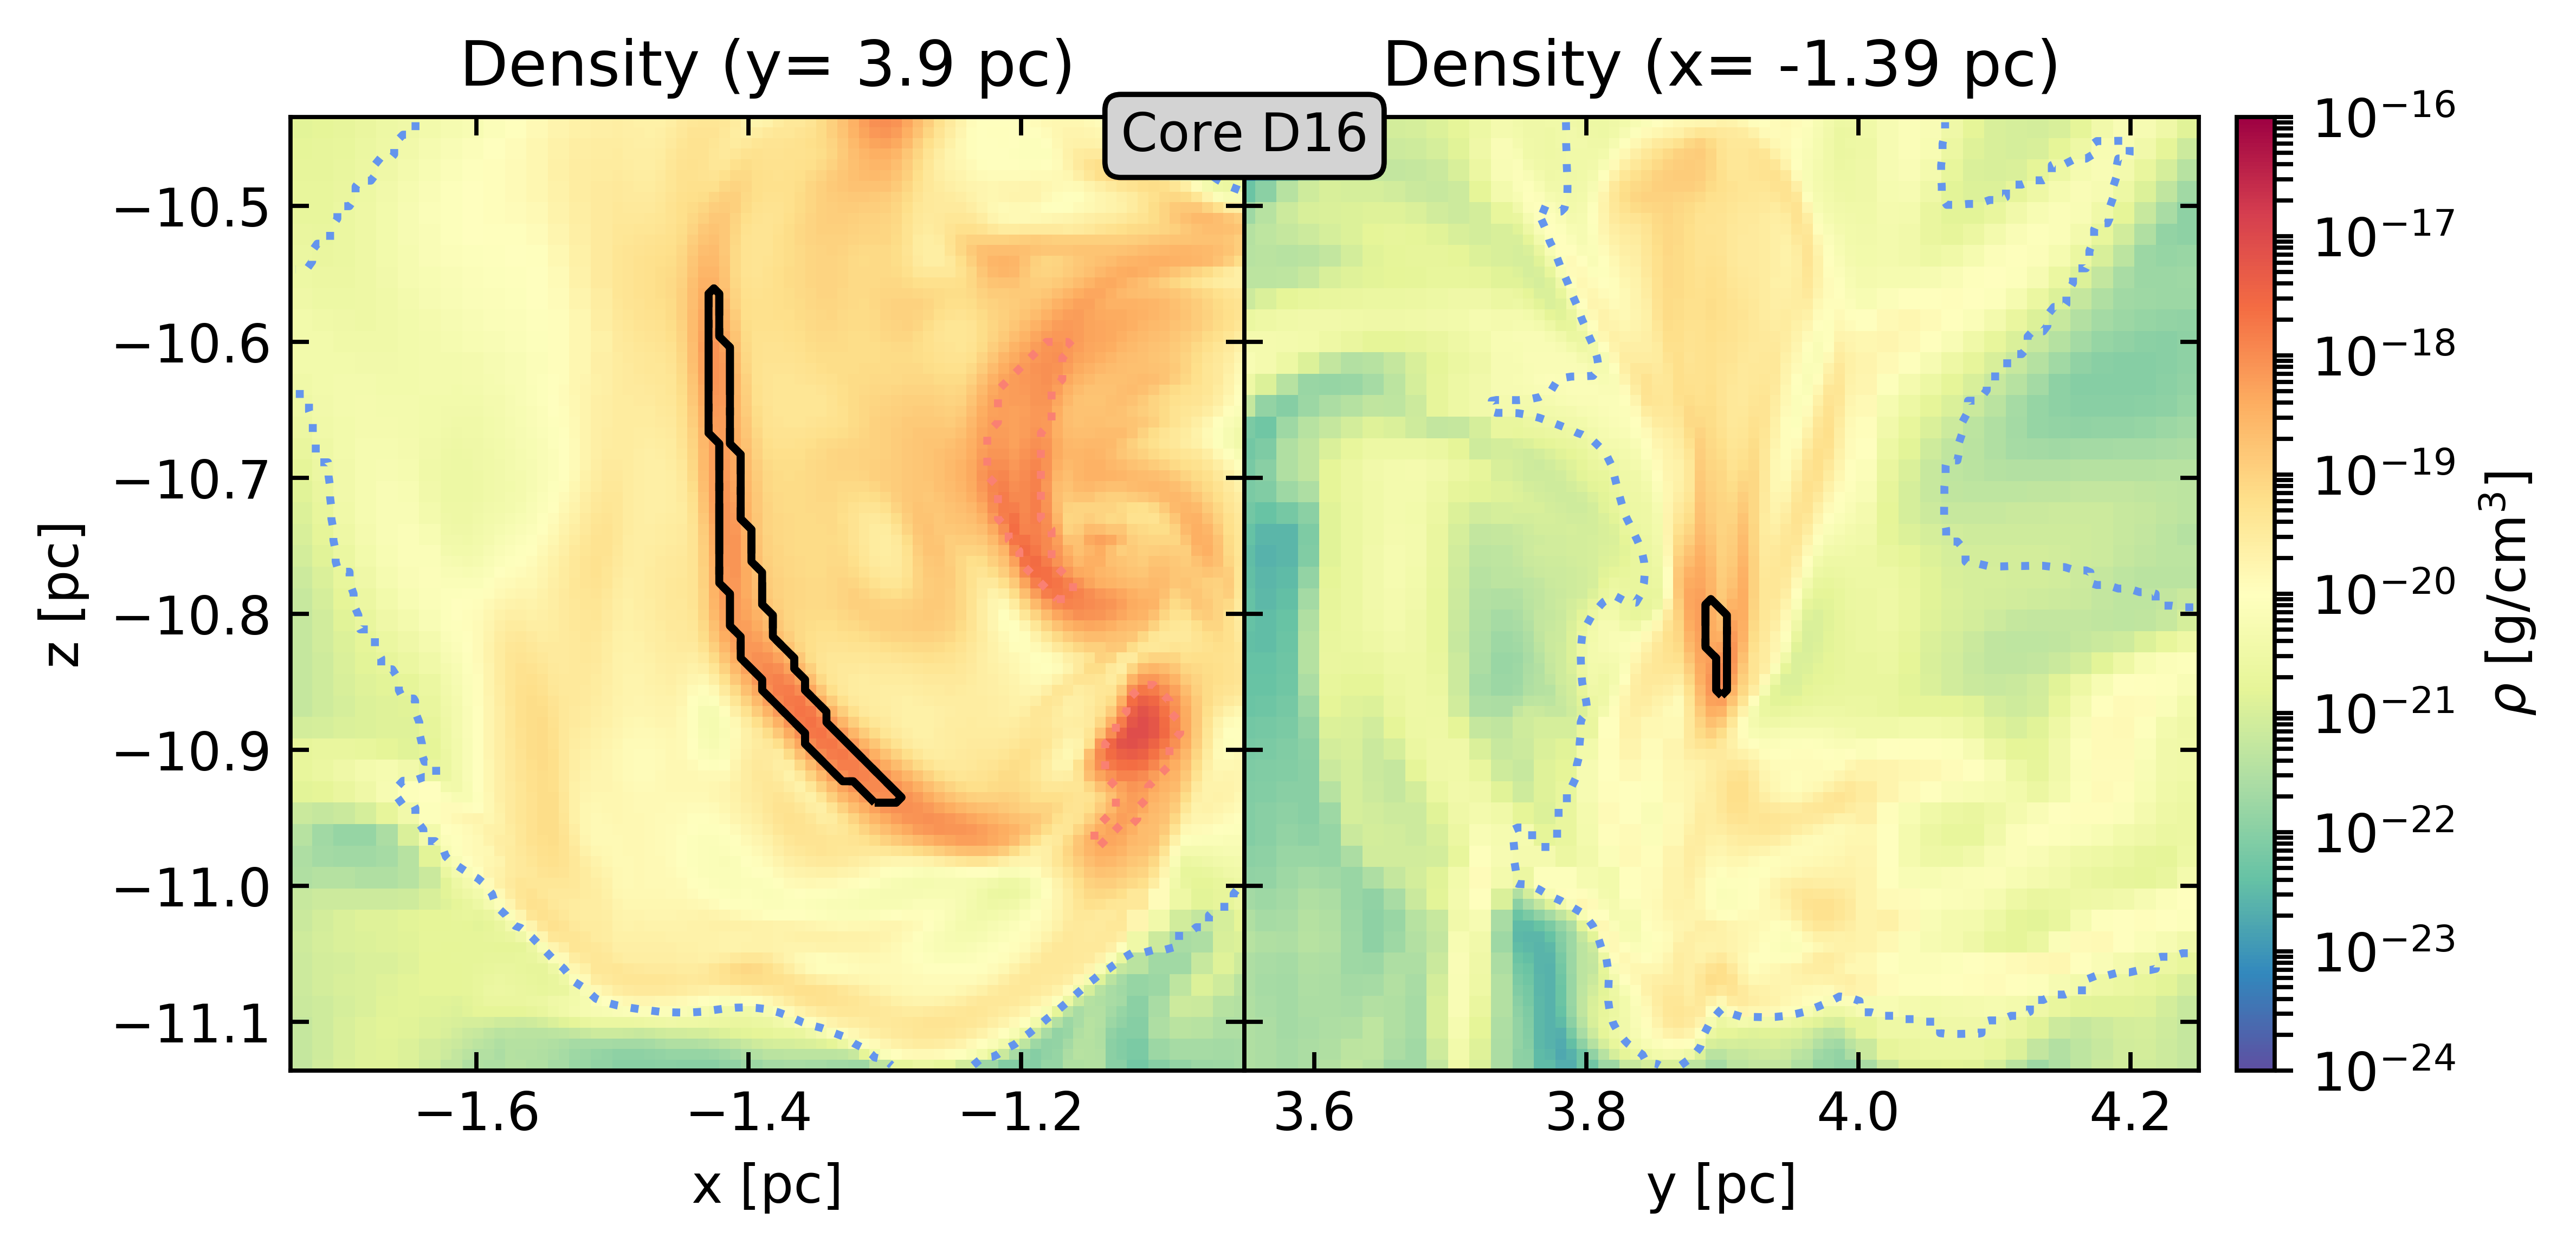
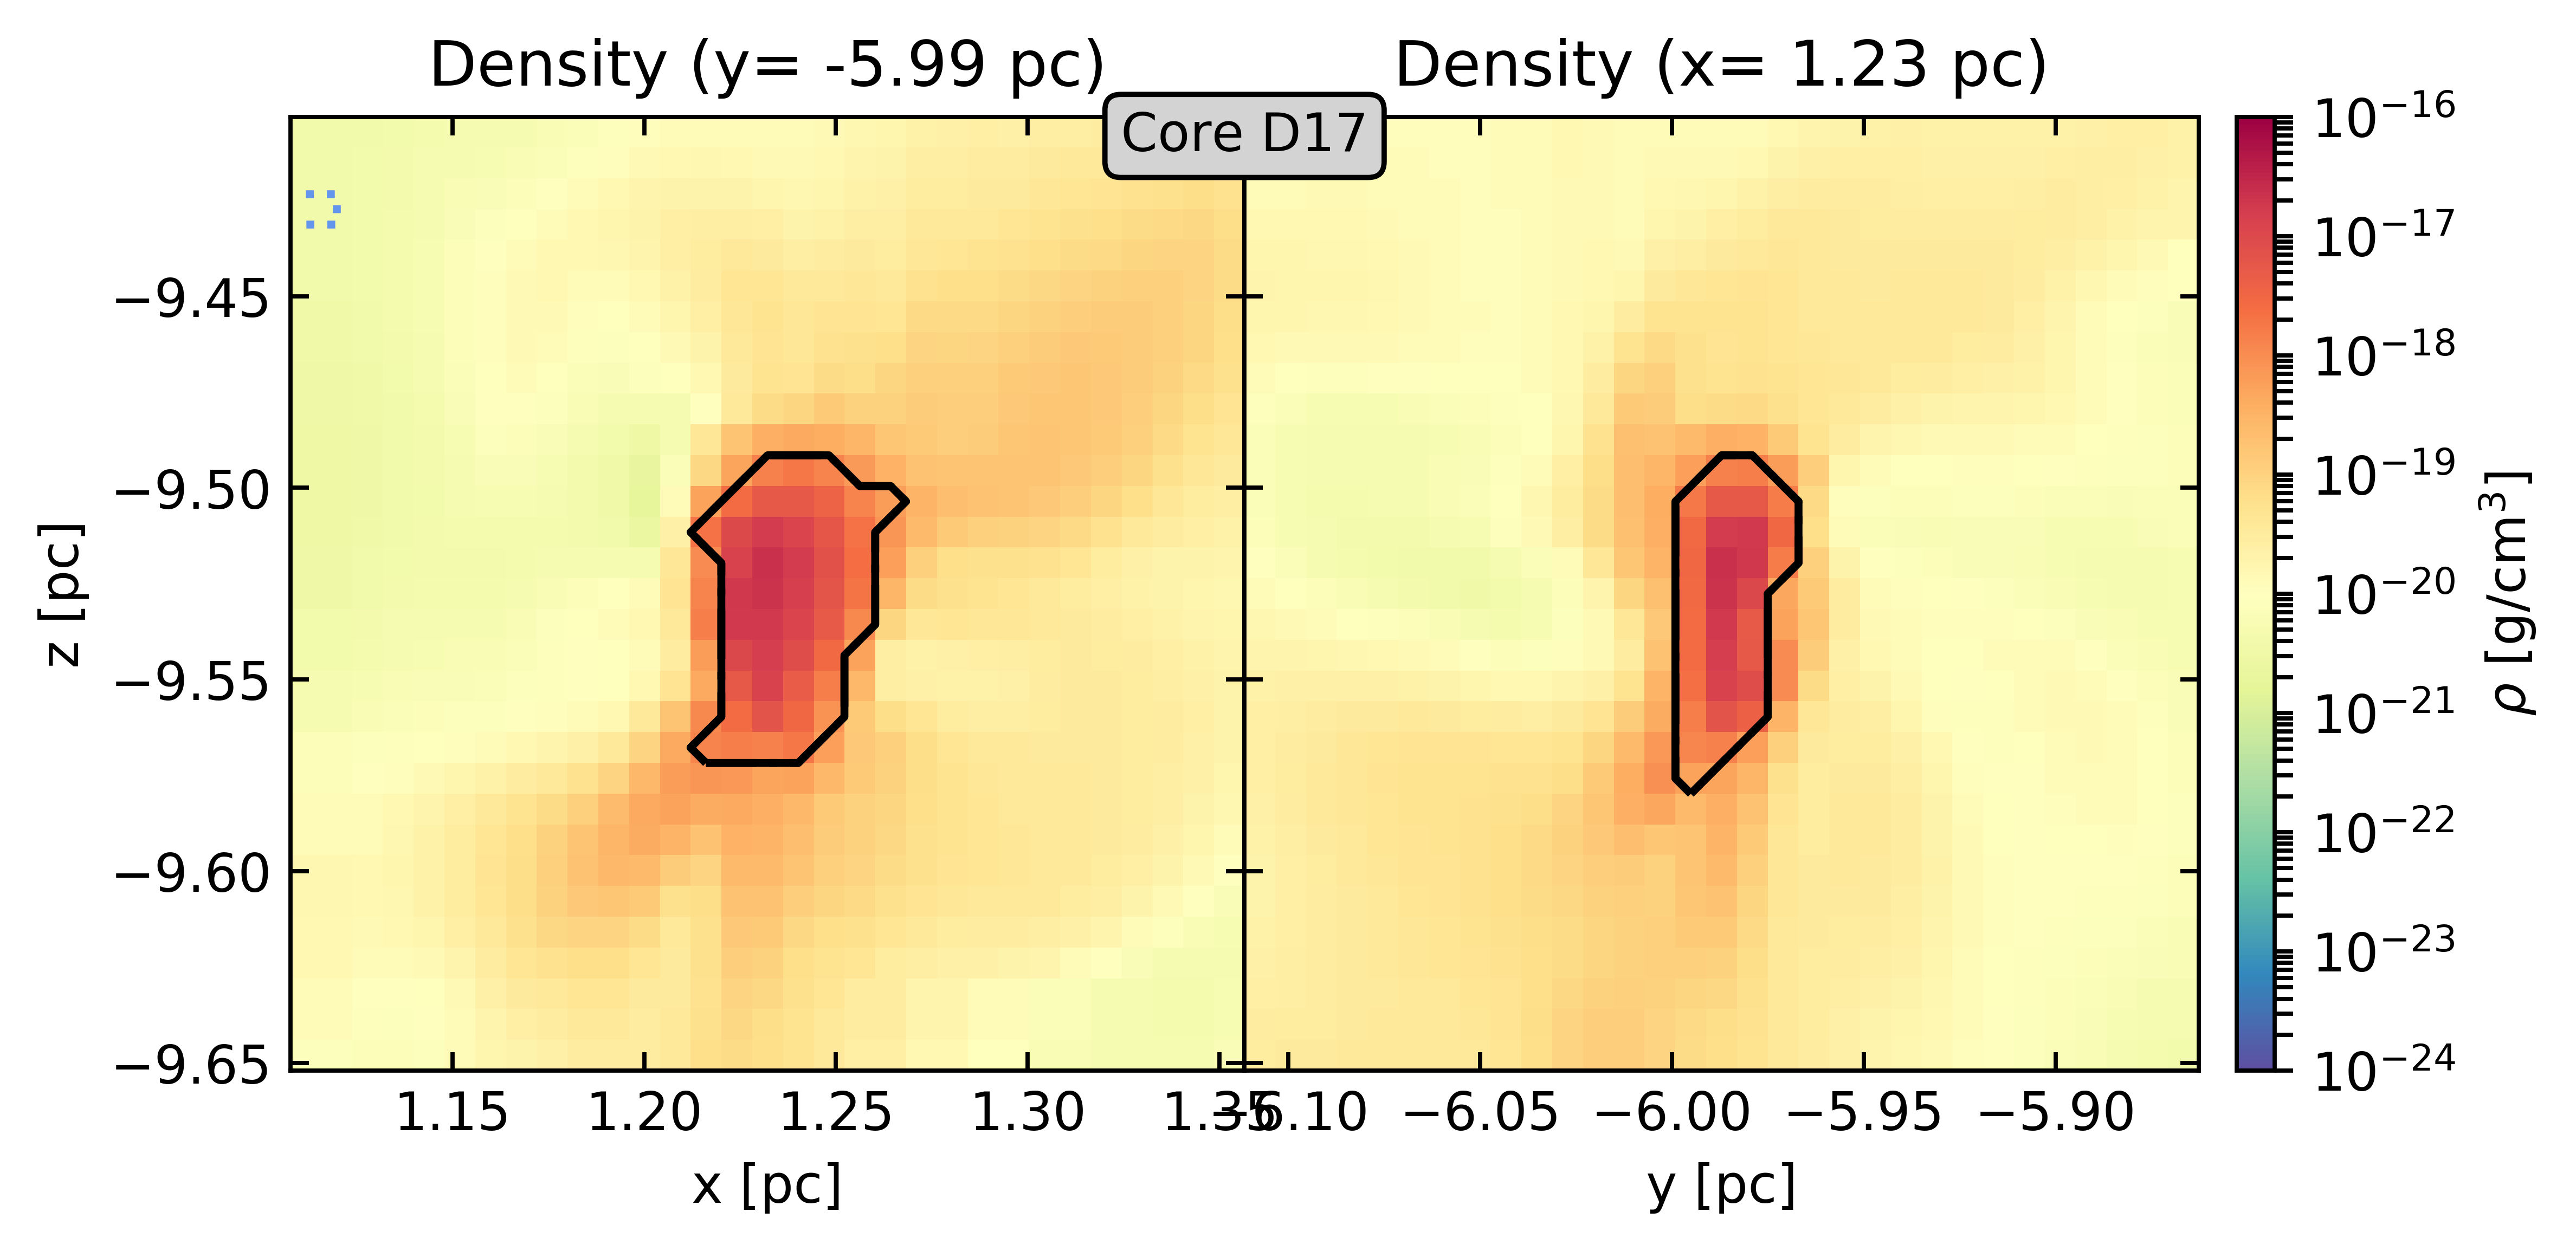
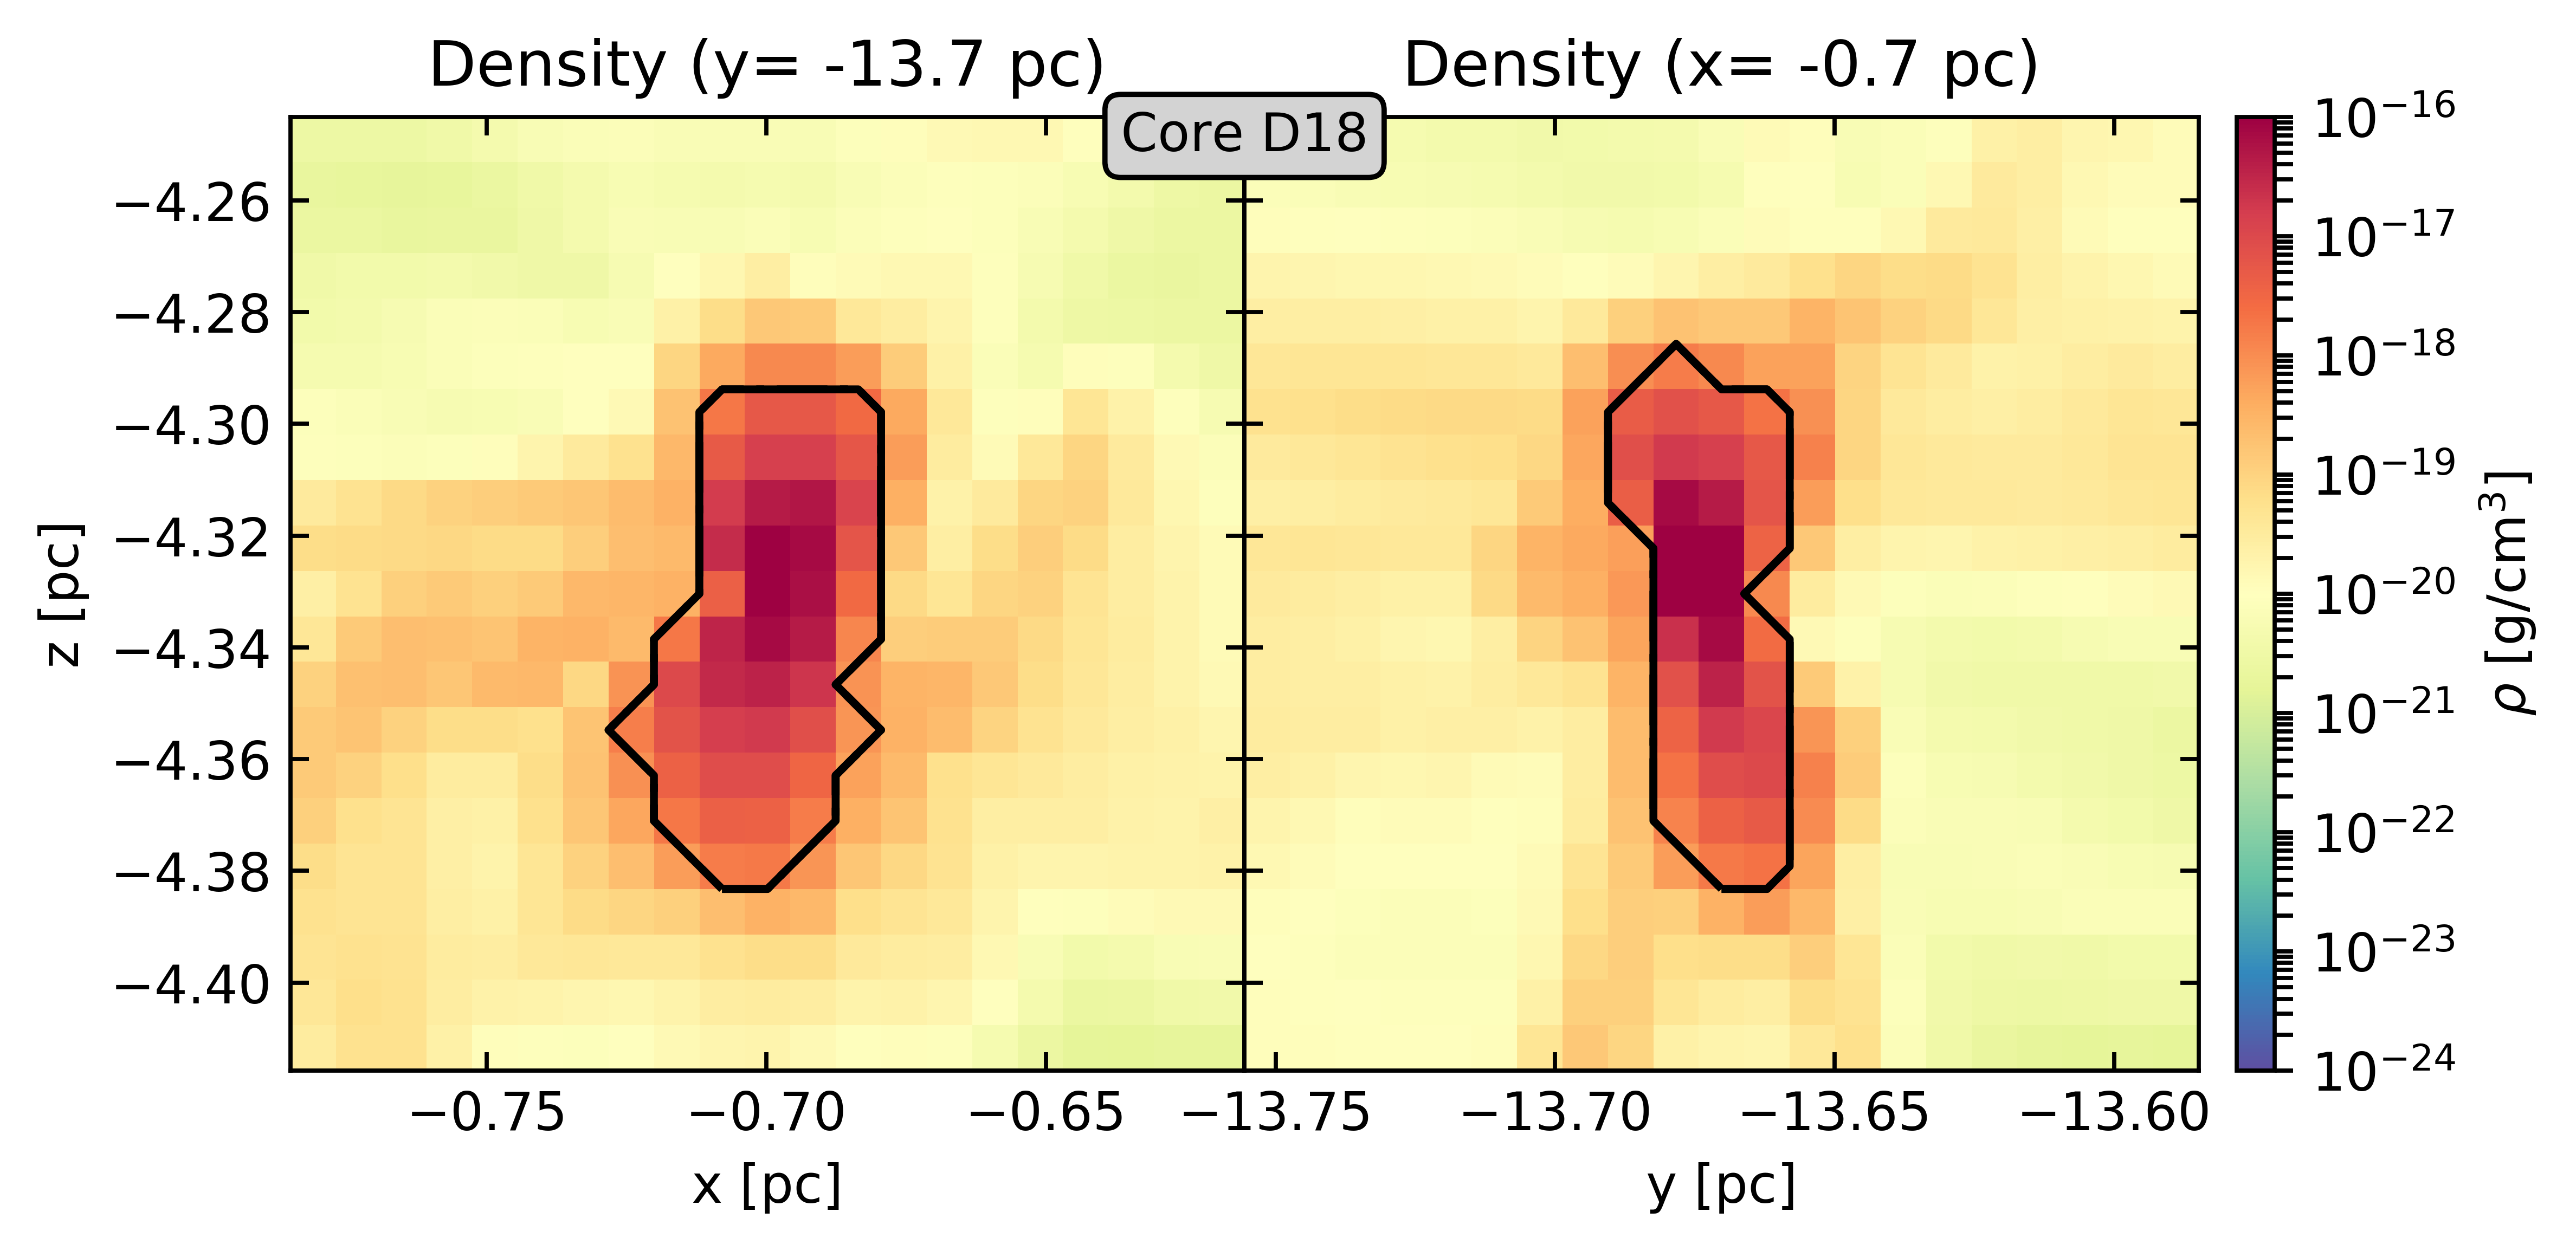
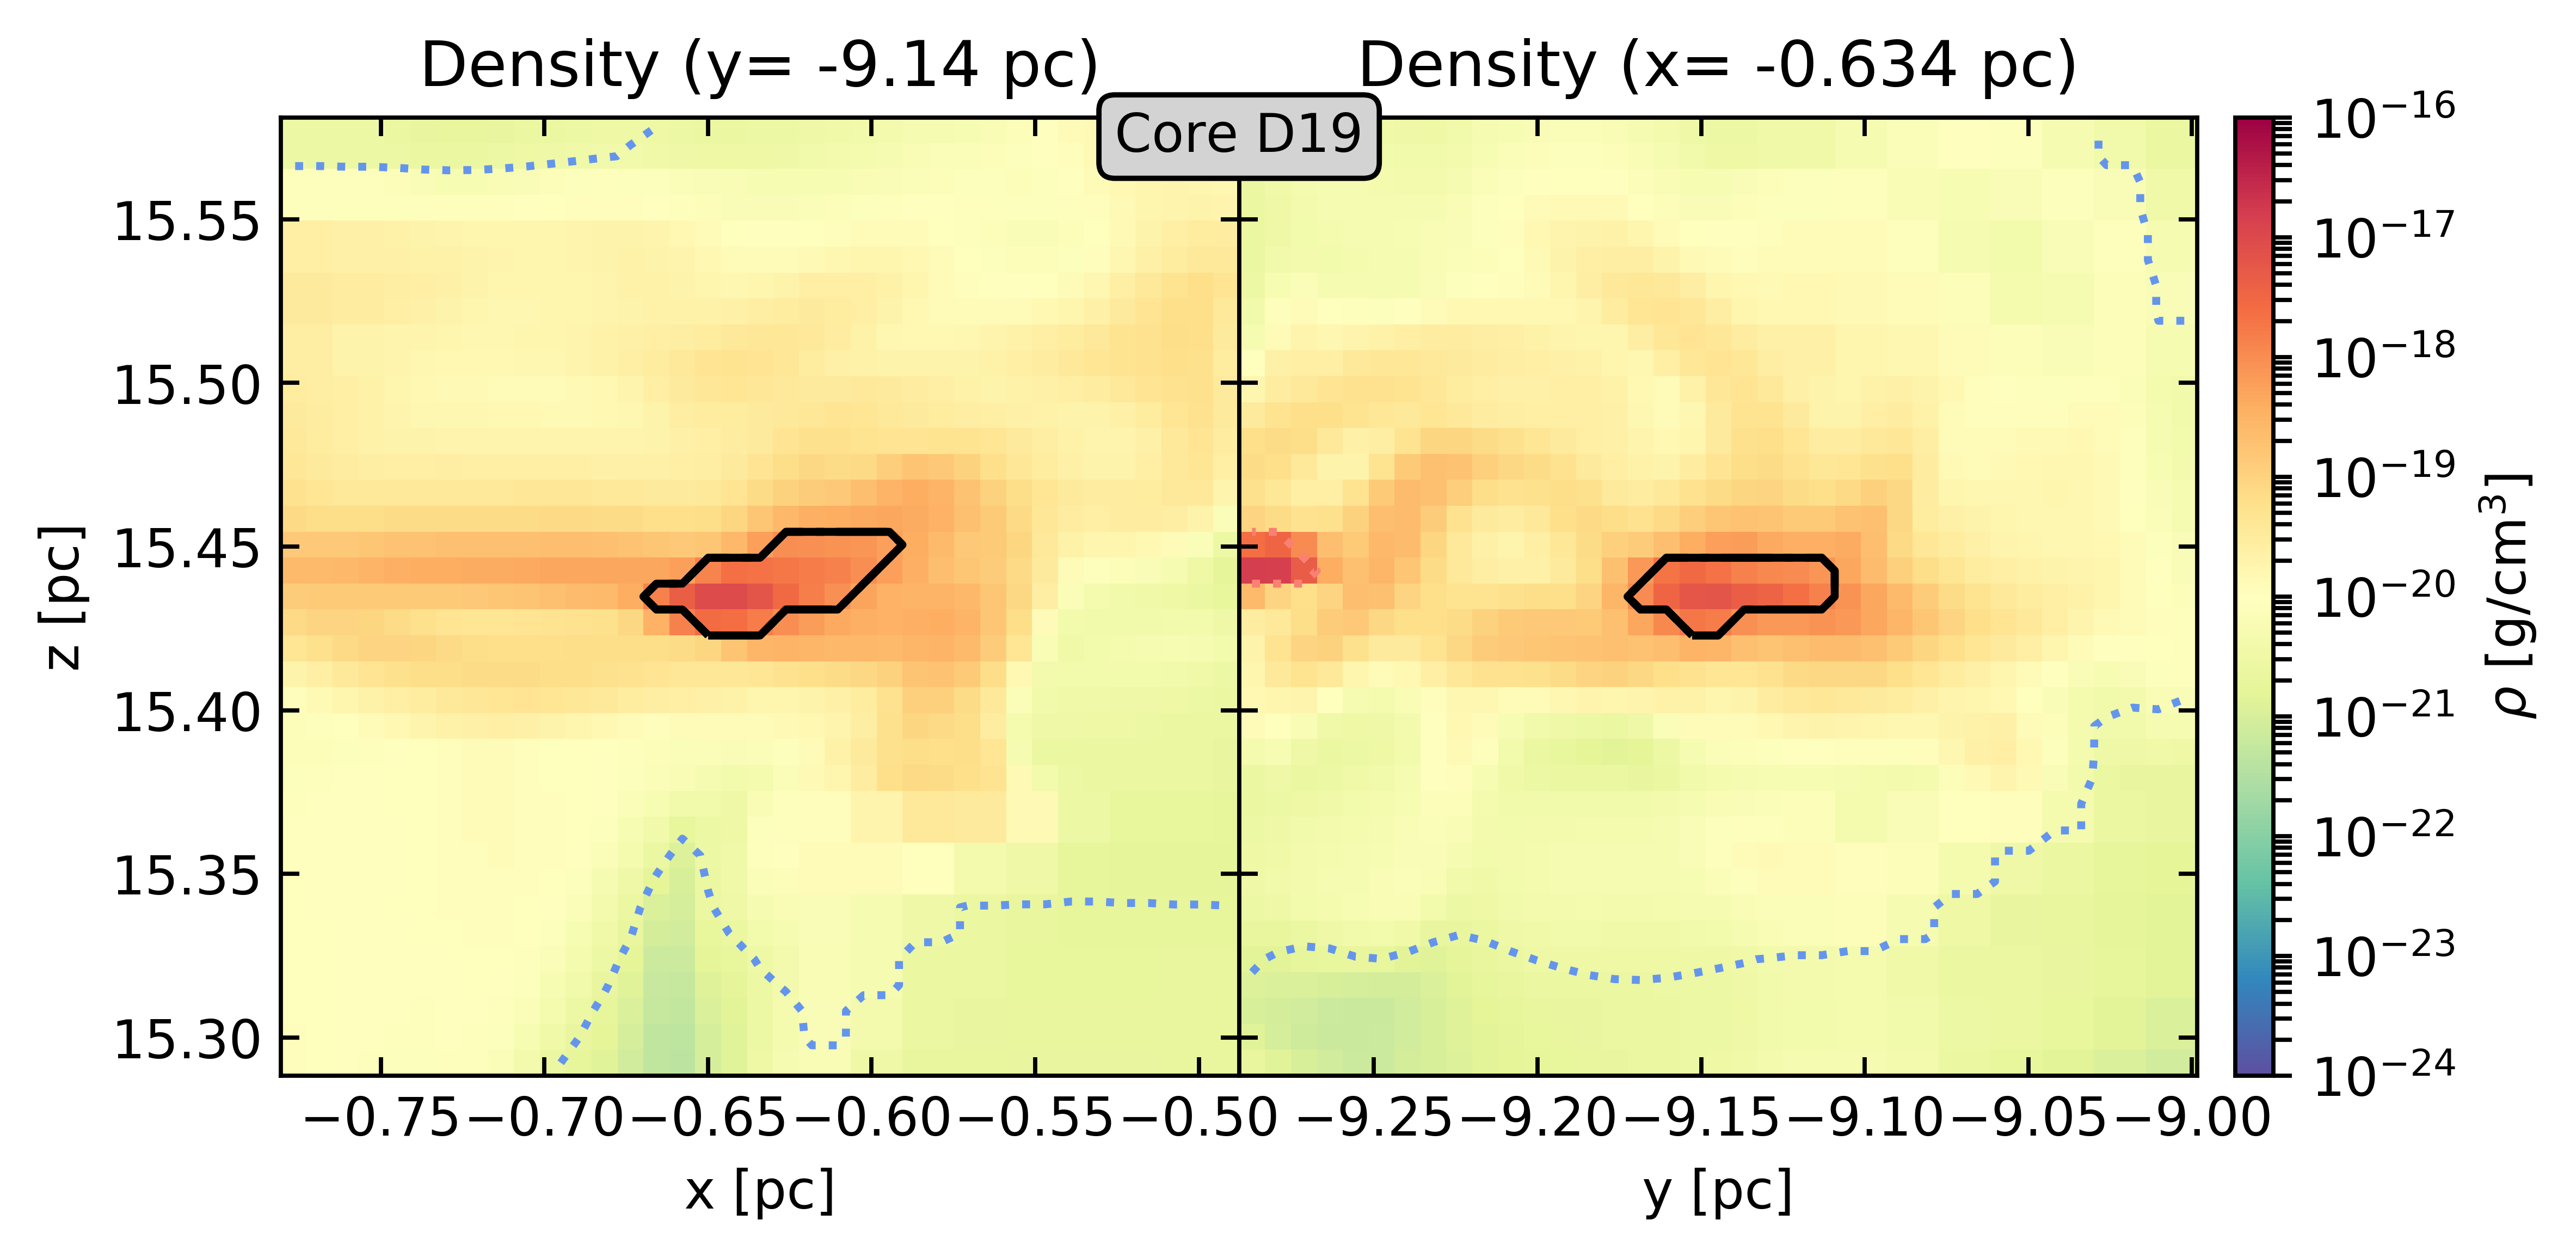
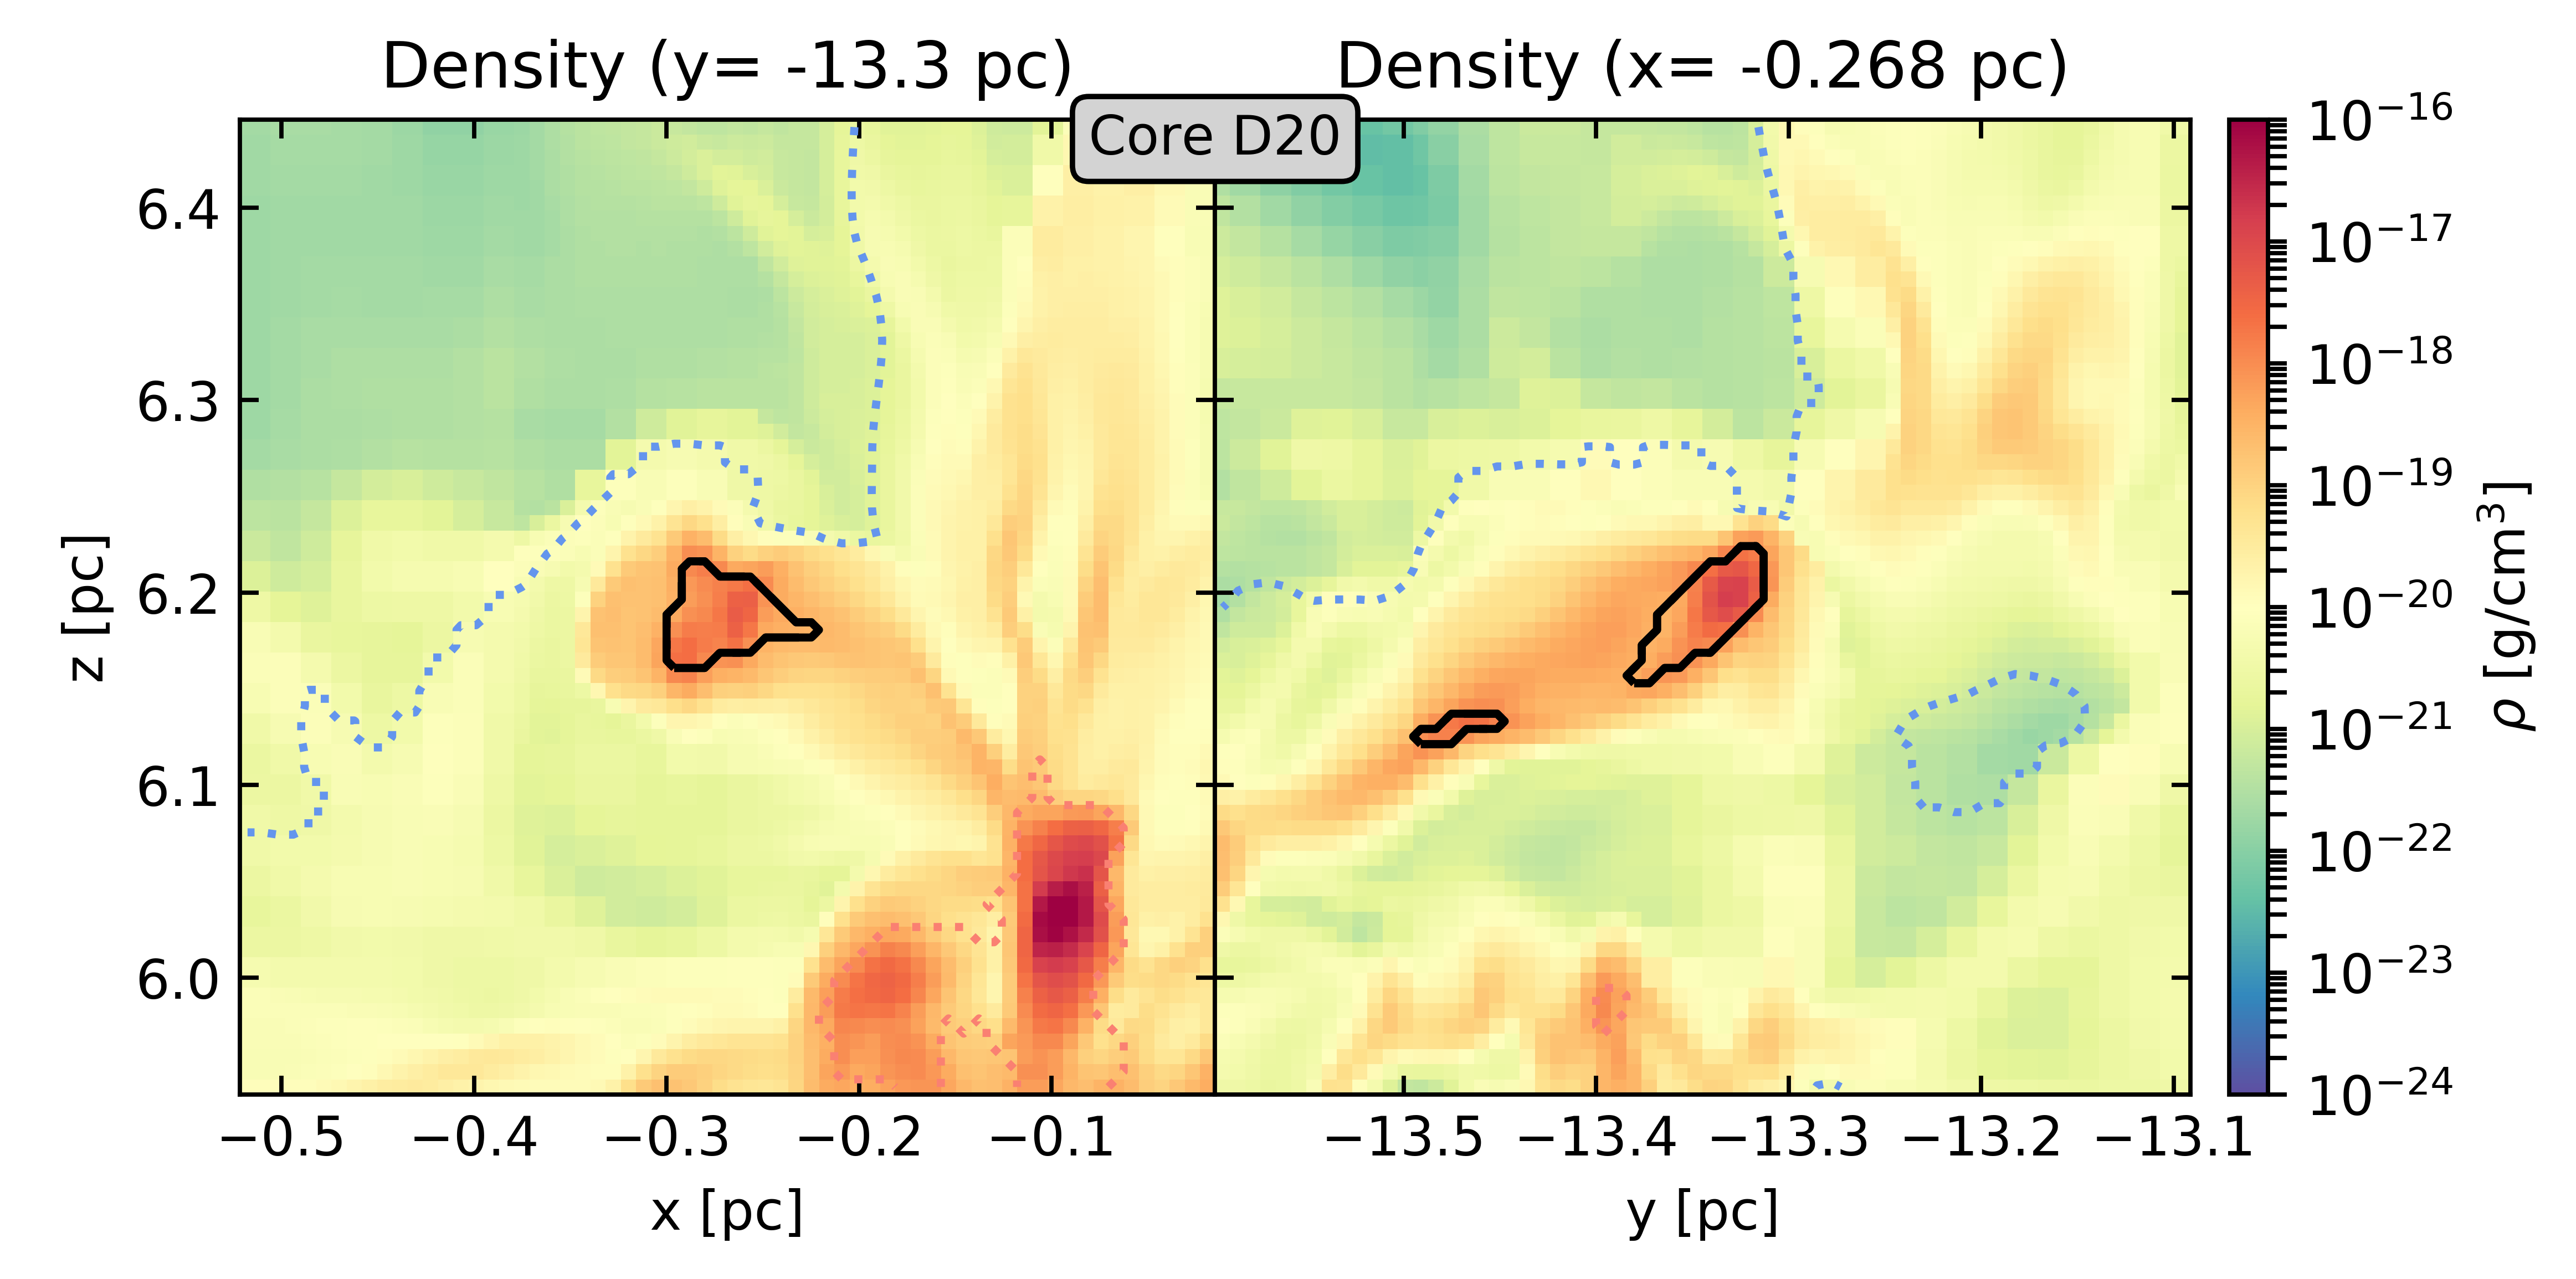
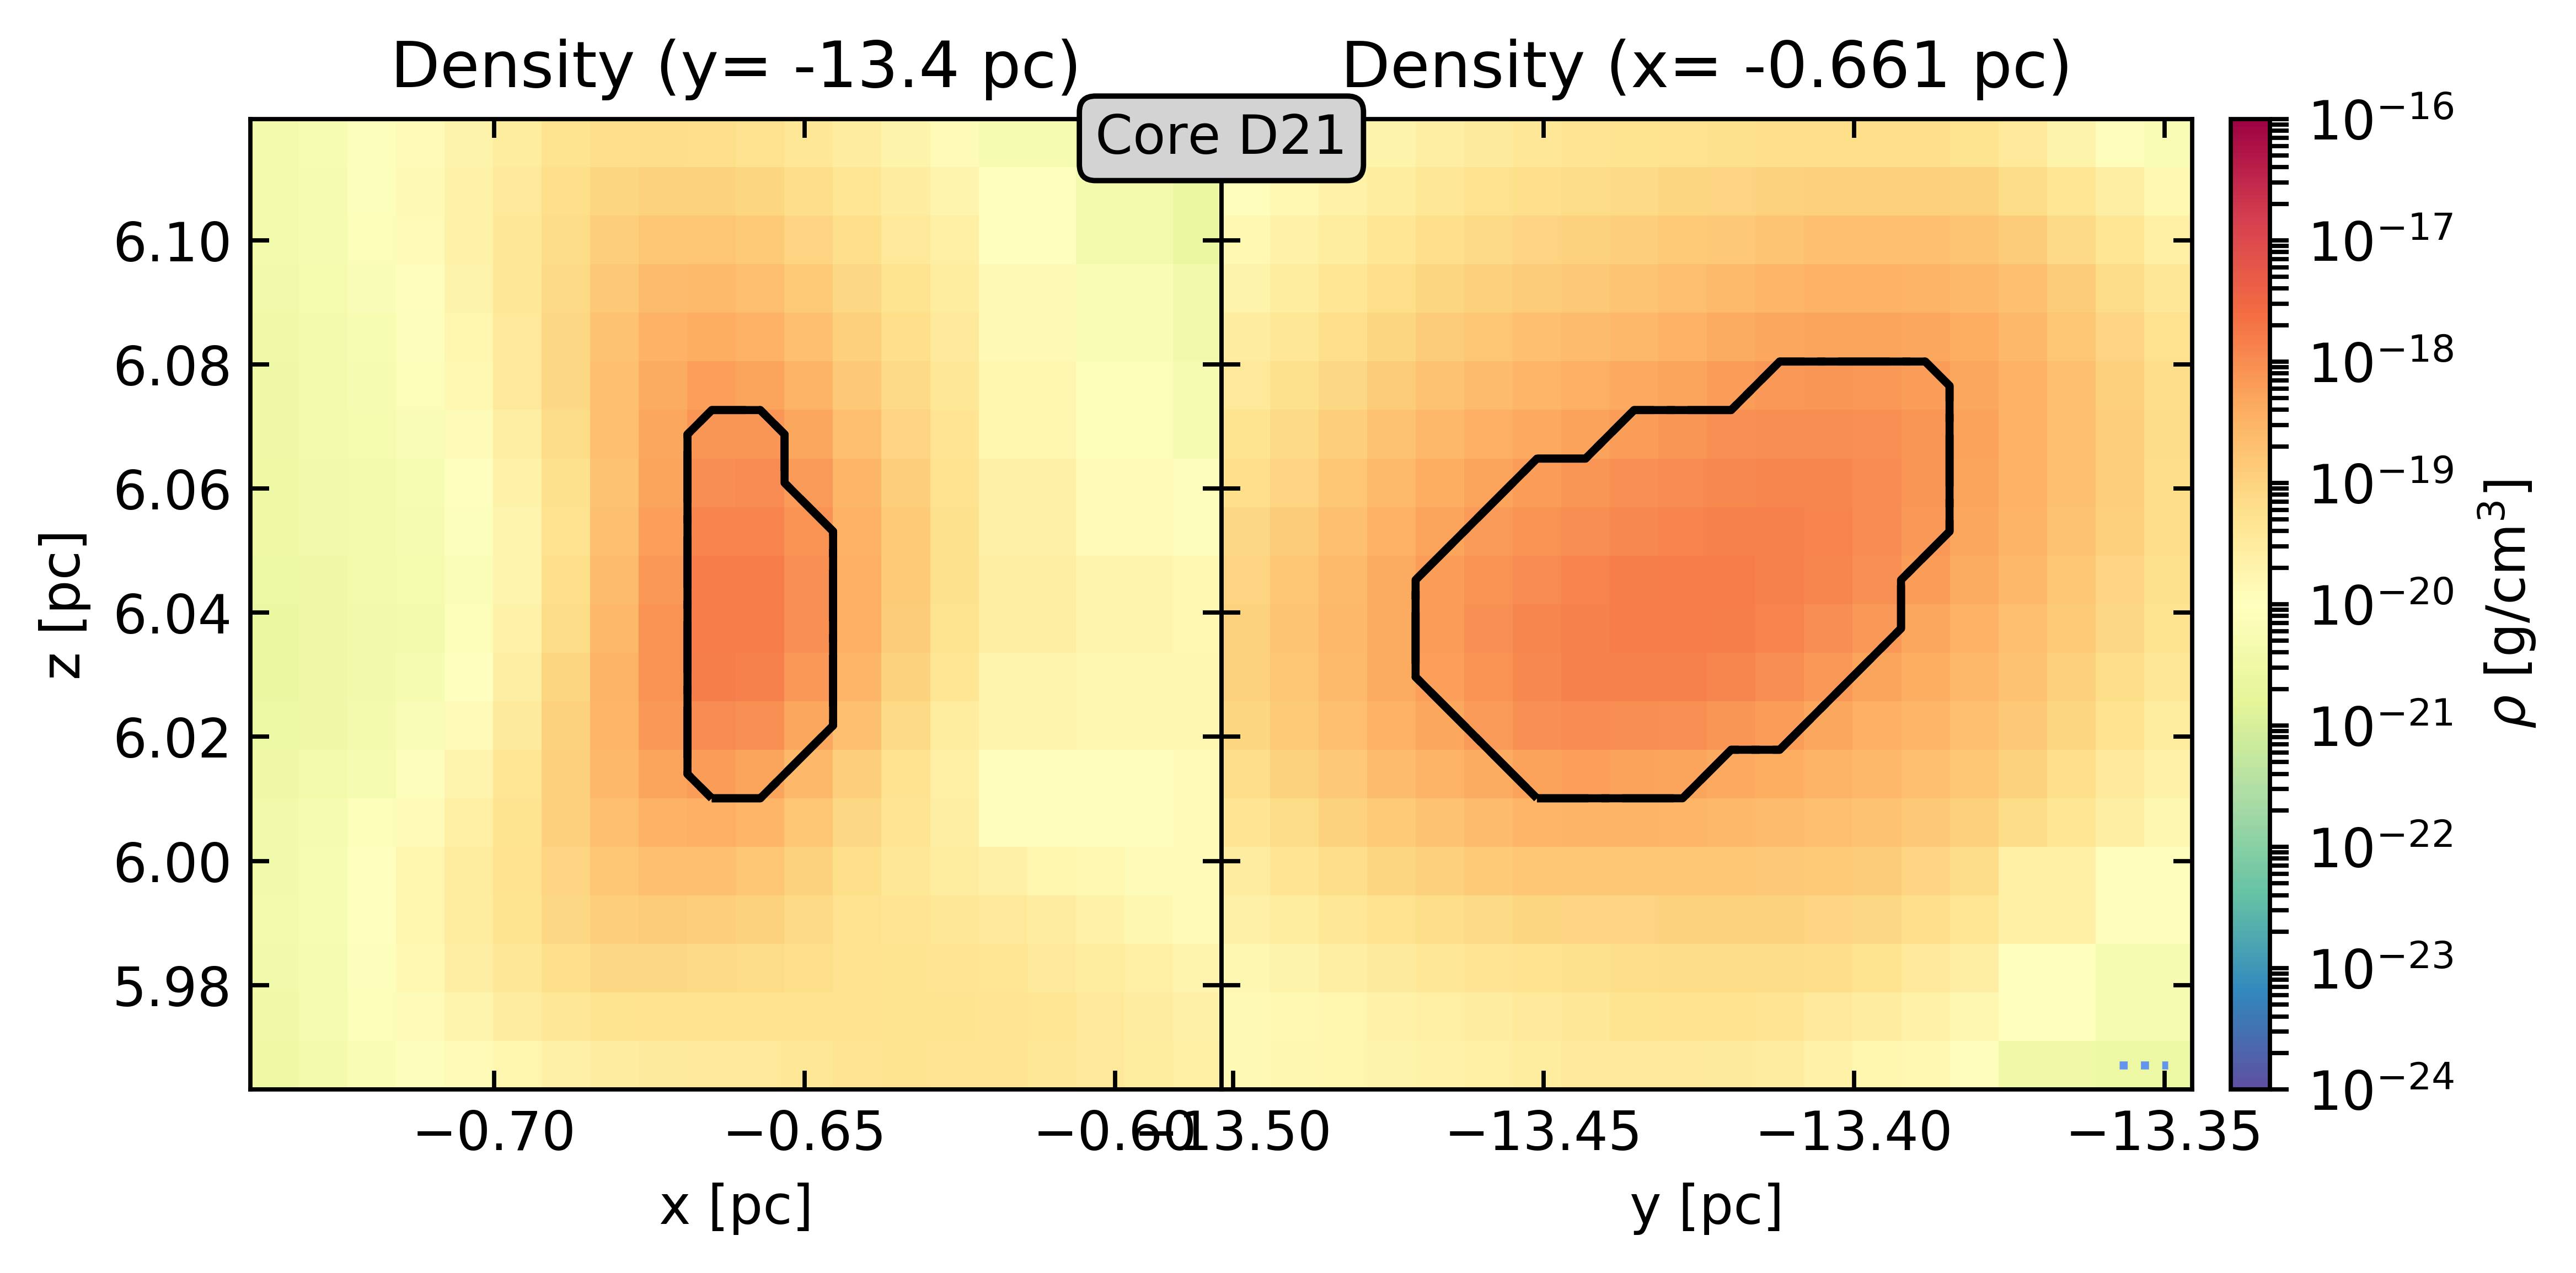
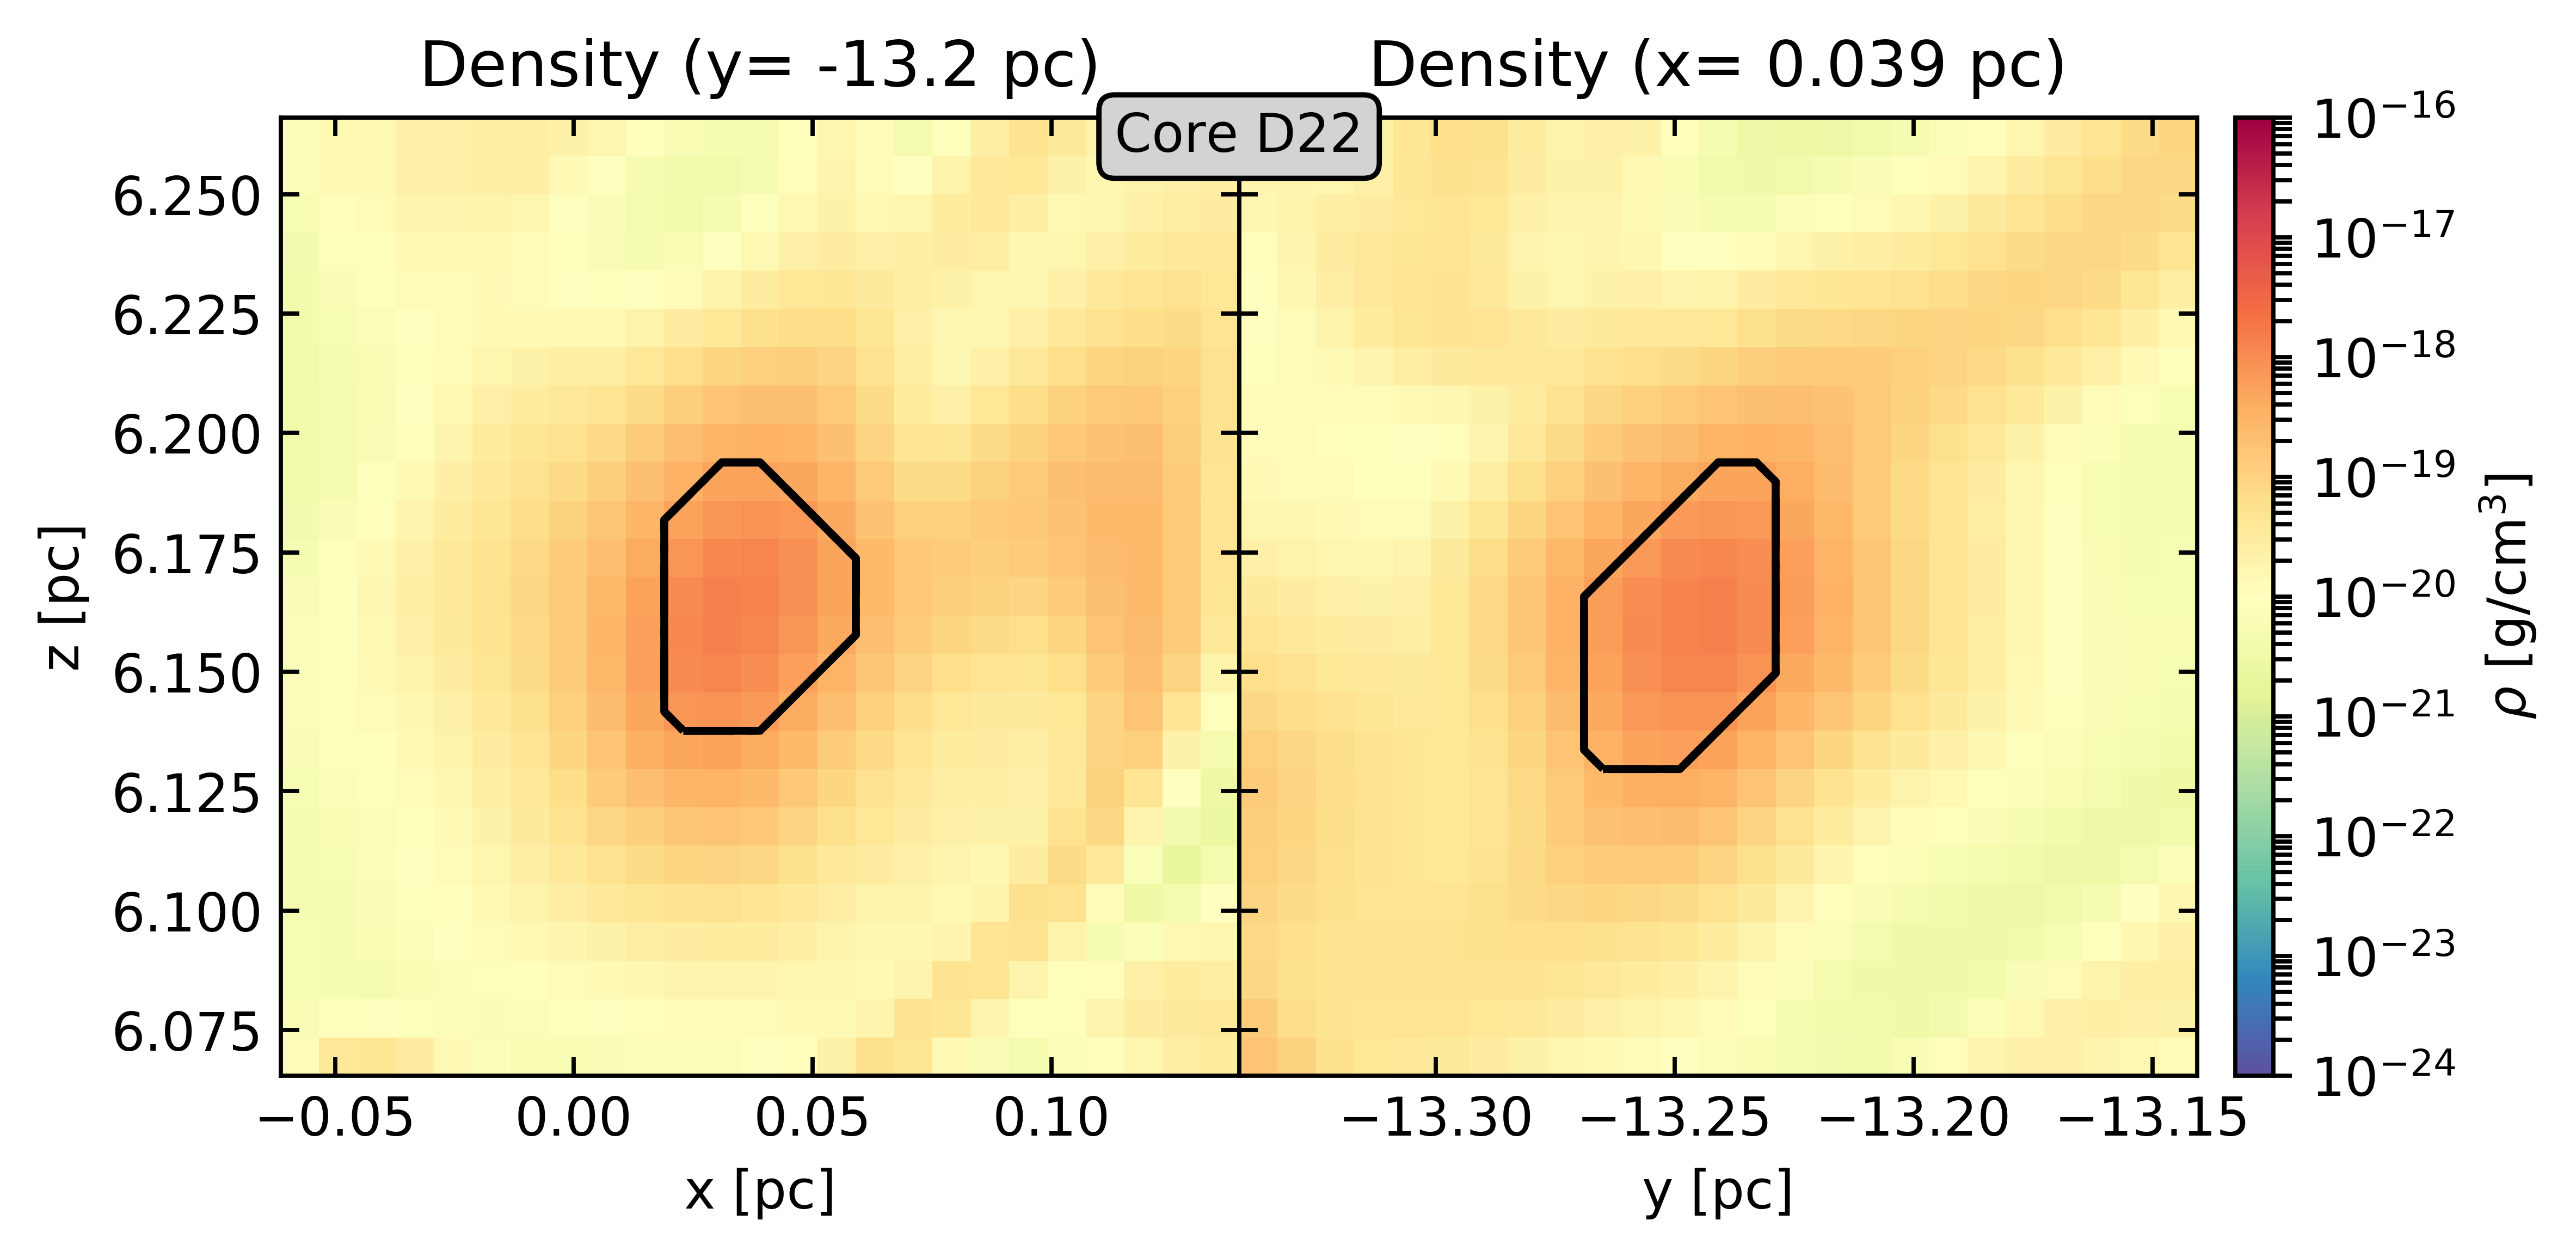
The structural analysis of the formed objects, Sec. 4.3–4.4.2, is done at , where all of the simulations have developed molecular structures. The identified clumps at that point in time are marked in Fig. 3. The identified cores are usually to small to be reasonably displayed in Fig. 3; however, slices of the cores are shown in the Appendix, Fig. 26–35.

In Fig. 7 (top panel), we show a plot of the 2D core formation efficiency (Könyves et al., 2015). Here, the core formation efficiency is calculated by dividing the mass-weighted -PDF of those columns containing cores by the corresponding -PDFs covering the entire projection map. For this, we estimate the per-column (Haid et al., 2019) by
| (21) |
where is the gas column density. In our projections, the core formation efficiency in gas, shielded by visual extinction, is in agreement with the efficiency found in the observational census of dense cores in the Aquila cloud complex done by Könyves et al. (2015) (grey line), with the non-magnetized simulation slightly below and the magnetized simulations slightly exceeding the observational efficiency. We also find that only 10% of the total gas mass is incorporated in cores at high . Hovewer, this is heavily influenced by projection effects, as the entire gas mass of each column that contains a core is considered. We also calculate the core formation efficiency based on the , Fig. 7 (bottom panel). Here, the 3-dimensional distribution of the gas mass is taken into account. We consider the 3d-shielded , as obtained from the TreeRay/OpticalDepth module, and calculate the efficiency by using the respective mass-weighted per-cell PDFs instead of per-column PDFs. In contrast to the efficiencies calculated from projections, almost the entirety of the shielded gas mass above is contained in cores (bottom). This demonstrates once more a substantial difference between the observed and the actual visual extinction (see also Seifried et al. (2020a)).
4.3 Larson relations
The algorithm used to detect the clumps and cores results in them to be connected objects. Other than that, it does not impose additional constraints about their geometry. In particular, the identified clumps and cores are not radially symmetric in general. Hence, we define an effective object radius
| (22) |
where is the radius of a homogeneous sphere with the object’s mass, , which has the same trace of the moment of inertia tensor. We also calculate its mass-weighted velocity dispersion
| (23) |
In order to avoid projection effects, we choose a definition of those quantities that utilises full the 6D (PPP,VVV) phase space information which resembles quantities that are also accessible from the observational PPV space. Using those quantities, we test the scaling relations of our substructures against the Larson relations.

In Fig. 8, we show the Larson linewidth-size relation (top row) and the mass-size relation (bottom row) for our clumps (left panels) and cores (right panels) at . The corresponding set of clumps and cores is fitted separately for each simulation using linear regression in log-space, yielding powerlaws:
| (24) | |||||
| (25) |
where is the powerlaw slope of the linewidth-size relation, and is the slope of the mass-size relation, respectively (see Table 2 for the results).
An observational correlation between the linewidth and size of molecular clouds has been established historically (Larson, 1981; Heyer & Brunt, 2004). Possible origins for a linewidth-size relation are either a turbulent energy cascade or the structures taking on a kinetic-gravitational equipartition (see below). It is at least questionable if the linewidth-size relation holds for observations of bound clumps (Traficante et al., 2018) or even smaller substructures. On the top row of Fig. 8, we overplot the original Larson relation (Larson, 1981, , dashed light grey line), as well as the revised relation described by Heyer & Brunt (2004) (, dashed, dark grey line). Except for simulation , the clump ensembles found in our simulations have , and are in excess of Larson’s relation. The large slope is mainly attributable to excessively turbulent clumps larger than , while the ensembles of smaller clumps seem to better agree with the revised relation. We note that the continuous inflow of our colliding flows model provides a constant amount of kinetic energy, which might drive large scale turbulent motions. However, We do not observe an increased level of turbulence in run , which has , which is the run with i.e. the smallest molecular gas mass and the smallest number of cores.
A large fraction of the (non-thermal) kinetic energy of the clumps is concentrated in the inner dense regions, defined by the contained cores: For our sets of cores at (Fig. 8 right), we find velocity dispersions similar to those of the containing clumps, while the corresponding radii of the cores are far smaller than those of the containing clumps. The cores also contain a considerable part of the mass of the clumps (Fig. 5 panel 3) and are (by definition of the identification algorithm) embedded within them. Similar than observed by Ballesteros-Paredes et al. (2018), those cores thus inhabit the upper-left area of the linewidth-size diagram (top right).
The third Larson relation (Larson, 1981) states that GMCs are observed to have comparable surface densities, independent of their size, thus following a density-size relation of . If the MC substructures in our simulations were to follow that relation, we would expect a mass-size relation of with . However, for our per-simulation clump ensembles at , we find slightly to moderately steeper slopes (Fig. 8 bottom panels). This is caused by the larger clumps which host cores and hence show an increase in surface density.
Larson’s second relation states that GMCs assume kinetic-gravitational equipartition (Myers, 1983), with according ensembles of objects following the relation . To be consistent with the linewidth-size relation and mass-size relation , this requires the slope coefficients to follow the relation
| (26) |
A test of that relation against our object ensembles at is shown in Table 2.
| Clumps | |||
|---|---|---|---|
| Cores | |||
For our per-simulation ensembles of clumps at , above relation is violated significantly, while for our per-simulation ensembles of cores at the above relation is roughly followed within the given uncertainties. This is consistent with a picture where the linewidth-size relation of the clumps is regulated by turbulence, while the cores are approaching kinetic-gravitational equipartition.
Slightly extending on Heyer et al. (2009) by explicitly including the object’s virial parameter , the mass of a self-gravitating object that is not in kinetic-gravitational equipartition can be expressed as
| (27) |
with . When using the column density estimate
| (28) |
and the velocity scaling coefficient
| (29) |
this recovers a modified version of Larson’s linewidth-size relation:
| (30) |
where the Larson scaling coefficient quantifies the effect on the linewidth size relation, if variations of the surface density and deviations from the kinetic-gravitational equipartition are present. We show a comparison of the Larson scaling coefficients of our clumps and cores to their approximate surface density in Fig. 9.

There, a clear distinction between those clumps which contain a core and those which do not is visible. This leads to a combination of two effects:
The clumps which do not contain a core (open circles) sit at the lower end of the surface density spectrum. Most of them are far from being in gravitational-kinetic equipartition. Thus, their ensemble is scattered over a broad range of virial parameters, centred around a large average of about . This is not equally the case for the clumps, which do contain at least one core (filled circles). These clumps, which are typically the largest clumps, are closer to . This can also be seen from Fig. 8 (bottom panels) because, according to our definition, the clump mass must always be larger than the core mass. For clumps smaller than pc, there is no corresponding core with smaller or comparable mass. Hence, the coreless clumps constitute this population of small to medium sized clumps. This implies that is particularly high for small and medium sized clumps. As a result, the linewidth-size relation is skewed towards more shallow slopes by the coreless clumps.
On the other hand, the surface density of the clumps which do contain at least one core is larger than that of the coreless population. Therefore, the Larson scaling coefficient (Eq. 30) increases considerably for these clumps. This leads to an increase in linewidth for these large clumps, despite them being close to . This effect leads to a steepening of the linewidth-size relation, which can outweigh the flattening introduced by the coreless clumps.
The combination of both effects yields a linewidth-size pattern, where the low- and medium-sized clumps are distributed around the same linewidth-size relation characterised by a slope of , while the largest clumps tend to sit above the linewidth predicted by that relation, thus leading to our observed slope coefficients in excess of Larson’s linewidth-size relation. Finally, for the identified cores, we find surface densities which are considerably higher than that of most clumps, and in excess of . This is in agreement with the recent observations by Traficante et al. (2018), who study the Larson relation for massive clumps identified in HiGal data. For almost all cores, the object mass is within a factor of 2 of their virial mass, close to gravitational-kinetic equipartition.
4.4 Time-independent virial analysis
In this section, we apply the EVT (see Section 2) to the identified clumps and cores at . Therefore, we calculate the volume energy terms (see Eqs. 6-9) for each object. We also to calculate the the surface terms (see Eqs. 15–18), as well as the gravity term (see Eq. 6), by first calculating the corresponding differentials for each cell. We then evaluate all terms by finite summation over the corresponding cells of each object. The differentials are computed using a central finite difference scheme on guarded cell data.
4.4.1 Time-independent EVT terms
This subsection focuses on the evaluation and discussion of the time-independent terms containing the volume energies , the surface terms and the gravitational binding energy on the right hand side of Eq. 1; the time-dependent term containing (see Eq. 5) is discussed in the subsequent Section 4.5.

Fig. 10 shows a comparison of the values of the kinetic (top left panel), thermal (top right panel) and magnetic surface terms (bottom left panel), as well as their aggregate (bottom right panel), to the corresponding volume energy terms in the EVT as of Eq. 1. Simulations with different initial magnetic field strength are distinguished by colour. Clumps are plotted with circles, while cores are shown using crosses. Filled symbols denote surface terms which are negative (when including their sign as appearing on the right hand sideof Eq.1), implying that the object is confined or compressed by the surface term. All three MHD volume energy terms act to stabilise the object and are positive by construction.
Overall, the surface and volume terms correlate with each other over five orders of magnitude or more for our clumps and cores at . For many objects, the highest energies are contributed by the kinetic terms. There is a trend that the volume energy terms are more important, in particular for the identified cores, but the surface terms are certainly not negligible. Independent of the initial magnetic field strength, all populations of objects show similar trends with no clear systematic difference between the different runs.
Considering the kinetic terms (top left), the surface energy term is mostly smaller than the volume energy term by up to orders of magnitude for objects with high kinetic energy. Further, the kinetic surface term is negative for some of the clumps and cores, while being positive for others. This indicates that the velocity fields affecting the objects’ surfaces promote the dispersion of some objects (empty markers), while others are confined by ram pressure (filled markers). The thermal surface term (top right) of all detected objects contributes a negative value towards the right hand side of the EVT, implying thermal pessure confinement. For a majority of clumps, the magnitude of the thermal surface term is comparable to that of the corresponding volume term. However, for almost all cores, the thermal surface term is about ten times smaller than the thermal energy inside the object. The comparison of the magnetic energy terms (bottom left) again shows that the surface and volume terms are mostly of the same magnitude. However, compared to kinetic energies, the magnetic energies are overall smaller. For most of the clumps, the effect described by the magnetic surface term is of confining nature (magnetic surface tension) and of similar order than the counteracting support from the internal magnetic pressure. Exceptions to this can mainly be attributed to objects from the high magnetization simulation (run shown in red). Interestingly, a majority of the identified cores have a positive magnetic surface term, which has a dispersing rather than confining effect. This means that the magnetic field does not control core formation. In total (bottom right panel), the surface energies of most clumps are comparable to the corresponding volume energies. However, most cores have smaller, non-confining surface terms.
4.4.2 Clumps and cores: Which Energy is important?

In Fig. 11, we show the relative significance of the magnetic, kinetic and thermal energy for each object (clumps and cores) at . Here, we introduce the combinations of surface and volume terms contributing to in Eq. 2 as
| (31) | |||||
| (32) | |||||
| (33) |
For normalization we define
| (34) |
In the appendix, Fig. 21, we show the individual contributions of volume and surface terms in ternary diagrams.
First, we note that all cores (crosses) are clustered in the upper corner of the diagram, which means that dominates. Importantly, this implies that the cores’ energetic state can be well estimated from the velocity field (kinetic energy) and gravity (see later) alone. Furthermore, the kinetic surface term is inferior for many cores (see the upper left panel of Fig. 10); yet, a few cores have high, outwards-pointing surface terms, which means that these cores could be ablated or shredded (see e.g. Scannapieco & Brüggen, 2015) by the surrounding flow. For most of the larger-scale clumps (circles), is still very important, but the contributions of in particular, and occasionally, cannot be neglected. As expected, for the clumps identified in the low-magnetization simulation , the contribution of is minuscule in comparison to the thermal and kinetic energy terms. Yet, also for most of the objects from all other simulations, including , the contribution of is minor. This is surprising, because the mass-to-flux ratios that can be expected for the central region (as of Eq. 20) suggest that at least some of the clumps should be magnetically subcritical, hence the magnetic component in the EVT should be relevant. Possible explanations for this are numerical diffusion of the magnetic field and (numerical) reconnection diffusion (Lazarian et al., 2012). Moreover, it seems that the thermal energy term can be important for the clumps, in particular for run . This could indicate the dissipation of magnetic and kinetic energy into internal energy, thus heating the clumps.
Summarized, magnetic fields seem to be of little importance for our MC substructures, i.e. our clumps as well as cores. This is in good in agreement with the flip of the magnetic field orientation with respect to dense structures to a perpendicular configuration which occurs in our simulations (Seifried et al., 2020b). This happens above 100–1000 and generally indicates a subdominant magnetic field. It also matches the results of other authors finding magnetic fields to play the least role in dense interstellar regions: A virial analysis from Ganguly et al. (2022) finds little importance of the magnetic field for even larger structures. Ibáñez-Mejía et al. (2022) find magnetic fields not to be dynamically important for dense clouds with .

The virial balance of the considered clumps and cores is given by the interplay of the MHD contributions, discussed above, with the contribution of the gravitational binding energy , towards the right hand side of the EVT, Eq. 1. A comparison of the kinetic (top left), thermal (top right), and magnetic (bottom left) terms as well as their aggregate (bottom right) as a function of the gravitational binding energy is shown in Fig. 12 for all clumps and cores at . We identify two important thresholds: At gravitational binding energies below , the thermal contribution for a majority of clumps as well as the magnetic contribution for some of the clumps exceeds the gravitational binding energy. Beyond that threshold, thermal and magnetic contributions do appear to only weakly scale with , meaning their impact on the gravitational boundedness of those objects diminishes. For most objects of gravitational binding energies below , the kinetic EVT contribution as well as the resulting aggregate of all MHD contributions (lower right panel) exceeds the gravitational binding energy, marking those objects as being gravitationally unbound. This regime of contains most of the clumps and a small number of identified cores.
For almost all objects with , the kinetic contribution approximates the gravitational binding energy. Also, the thermal and magnetic contributions are minuscule beyond that threshold. This implies that objects above this threshold are "virialized", and their dynamics is mainly of kinetic nature. The gravitational binding energy of those objects tightly correlates with the object mass and type. For the clumps, those thresholds correspond to an object mass of 9–60 , respectively; for the cores, they correspond to an object mass of 3–20 (see Fig. 23 in the appendix). Note that the clumps which do contain cores, most of the clump mass is actually in the core (see Section 4.3).
4.4.3 The importance of surface terms
In general, the effect of the gravitational field on some object can either be confining due to self-gravity or dispersing due to tidal forces caused by the external mass distribution. However, we find only two such tidally dispersed objects for which the gravitational binding energy term would be non-negative (see Fig. 23 in the appendix). Moreover, we find the thermal surface effects, expressed by the term , to be of confining nature for all objects (see Fig. 10). The magnetic and kinetic effects at the objects’ surface, expressed by the surface terms and in the EVT can be of confining or dispersing nature, which we have shown to both occur for different objects. This poses the question, whether virialized objects are confined simply by being gravitationally bound or rather by being confined by MHD forces. To explore this, we define two quantities. The virialization ratio
| (35) |
considers the time-independent terms of the EVT to give an indication of the virialization of an object, where indicates an unbound object, while indicates a virialized object and indicates an object with excess binding energy, which should be gravitationally collapsing. The confinement balance ratio, , defined as
| (36) |
with
| (37) |
provides information on all the terms which contribute negatively, i.e. in a confining/compressive way, towards the right hand side of the EVT. It can be interpreted as follows:
-
•
: Surface terms compressing, negligible gravitational energy,
-
•
: Surface terms and gravity equally compressing,
-
•
: Net zero surface terms,
-
•
: Dispersive surface terms,
-
•
: Surface term dispersion outweighs gravity.

We show a comparison of both ratios in Fig. 13. A large portion of the identified clumps experiences weak confinement (), most often caused by MHD surface terms (). Five clumps are clearly compressed beyond virialization () by the surface terms (at least for four out of the five cases: ). Few clumps are approximately virialized () with varying contributions of the MHD surface terms. Most of the cores are either virialized or close to being virialized (), with their confinement being dominated by gravity. For most of the not fully virialized cores () the deficit of confinement can be explained by an according amount of dispersive MHD surface terms ().
4.5 Time-dependent EVT term
The analysis presented in the previous section addresses the static terms present in the virial theorem. In addition to those, the virial theorem in its Eulerian formulation (see Eq. 1) contains the time-dependent component , where is given in Eq. 5. A comparison of the absolute contributions towards the EVT of the aggregated MHD component (see Eq. 2), the gravitational binding energy, , and the time-dependent term is shown in Fig. 14. The values are normalized with
| (38) |
In this way, the ternary is an isosceles triangle, displaying the relative contributions of the different terms, where a value right in the centre of the triangle implies that all three terms are equal. We show all clumps (circles) and cores (crosses) at .

In the Lagrange frame, would not exist (McKee & Zweibel, 1992) as an object would not have a fixed surface and hence the volume of the object would be allowed to change according to the flow properties. More or less any object deformation in the Lagrange frame should cause a non-zero in the Eulerian frame. In addition, accretion at a non-uniform rate also causes a contribution to (see below).
In Fig. 14, we see that is basically never zero, but is rather significant for the majority of the identified clumps, whose gravitational binding energy is small compared to the MHD contribution towards the EVT (left of the vertical center line). Some of the clumps fall onto the vertical center line implying comparable contributions of gravity and MHD terms, while can still be significant (depending on their vertical position). In contrast, a majority of the identified cores (crosses) have comparable contributions of gravity and MHD terms and exhibit only a small contribution towards the EVT.
We conclude that, while a majority of the identified clumps is gravitationally unbound (see also Fig. 12), is the dominant term for most of the unbound and some of the bound clumps. This implies that the EVT is overall not controlled by the object properties and , but mainly through the flux of at the statically defined object surface. Hence, the choice of an object with a fixed surface is extremely difficult. Most clump-like objects seem to be random fluctuations in the turbulent flow rather than well defined entities. Only clumps which actually contain cores develop in such a way that their dynamics "decouples" from the surrounding turbulent flow. We further conclude that the identified cores are either gravitationally bound or at least gravitationally supported, with the quantity mainly evolving along and .
From Eq. 5, can be viewed as contributing towards by means of a mass flux density accreting mass through the static surface elements at a distance from the centre of mass, henceforth adding to the inertia quantity (Eq. 3). We now consider a simplified model for by assuming mass flux onto a sphere of radius as of Eq. 22,
| (39) |
and its time derivative
| (40) |
where is the object’s mass accretion rate. We note that while, due to the Eulerian reference frame, a static outer surface is assumed for the clumps and cores, the radius approximation as of Eq. 22 is still time-dependent, as it is dependent on the distribution of the mass inside the volume that is bounded by that surface.
Fig. 15 shows a comparison of the -component from Eq. 40 against the value of as obtained by numerical differentiation of the value obtained by Eq. 15. We note that we apply a central differencing scheme in time on the basis of single MHD time steps.

Both quantities are correlated for clumps and cores. For many of the clumps and independent of the initial magnetic field strength, both quantities agree within factor 3 or better, often within a factor of 2, while for most of the cores, the quantity is lower than . We conclude that for the clumps, the quantity is closely related to changes of the objects mass accretion rate, as calculated in the Eulerian reference frame. All cores seem to lie slightly below the one-to-one relation. This seems to be counter-intuitive as we would expect the cores rather than the clumps to be dominated by accretion. However, we only plot the first term of Eq. 40 in Fig. 15 and neglect the change of , which occurs when adding mass to a self-gravitating object.
5 Discussion
5.1 Time evolution of cores in the Euler vs. Lagrange frame
The time dependencies as given hitherto are related to the Eulerian reference frame, but they are not suited to trace the identified objects over time.
To capture the time evolution of our cores, we first run the object identification for a number of consecutive simulation snapshots, separated by each. We then re-identify the cores from each of the snapshots and link them in order to determine their evolutionary tracks. We use the following algorithm in order to determine if any two identified structures from consecutive snapshots should be identified as the same object: We first calculate the relative bulk velocity of both objects. The cell-centre coordinates of the earlier object are then propagated forward by . For each structure, we define a "forward inclusion value , by calculating the mass weighted fraction of forward propagated cell centres of the structure from the earlier snapshot that are located inside the structure found in the later snapshot. The set of forward inclusion values for each of the earlier structures is then scaled according to:
| (41) |
In an analogous way, we calculate the "backwards inclusion value", , by tracing the structure found in the later snapshot backwards in time. The earlier structure is then considered to be a part of the later structure if , and vice versa using . Both structures are then considered to represent the same object if they are a part of each other by above definition; the objects’ track at that time step is considered "undisturbed".
We only apply the tracking algorithm to the cores (starting at in both directions in time), as they are found to have high inclusion values, while the clumps seem to be more transient and are hence harder to track over time.

In Fig. 16, we show the resulting mass as a function of time for the cores in different simulations. Most cores seem to be accreting, with typical accretion rates in the order of and the trend of having decelerating accretion rates. A few of the cores do not stay in isolation but merge with others or fragment, respectively. These are depicted using dotted lines.

From the mass evolution, we calculate the relative rate of change of the mass accretion rate, . We may also compute the same quantity from the mass flux across the cores’ surface at a given time in the Eulerian reference frame. The two approaches are compared in Fig. 17. Note that we show the absolute values , while positive and negative values are indicated with different symbols. A separate comparison for the accretion rate and its rate of change is shown in the appendix, Figures 24, 25. Most cores have a positive as derived from the mass tracks, while the respective quantity for the same objects obtained from the Eulerian frame are roughly equally positive or negative. Also, the typical values of are different between the different methods: from the mass tracks, we find typical values of , while we obtain a mean of from the Eulerian approach. A Kendall rank correlation test measuring the correlation between both quantities gives a coefficient as low as . We conclude that , as measured by tracking the actual cores, is very weakly correlated to the same quantity measured in the Eulerian reference frame. This implies that an object’s surface area as well as its volume are not very well defined and change as a function of time. Hence the time-evolution of individual objects seems to be not very well captured by the Eulerian analysis. This result is supported by the fact that we find large -terms (see Section 4.5).
5.2 Analysis of identified cores
An indication of the virial state of a molecular cloud structure that can be derived from observational data is given by the Heyer plot, Fig. 9. In contrast, the more comprehensive assessment of the virial state is obtained from the evaluation of the EVT for the same object, Fig. 14. A comparison of both results is shown in Fig. 18. Slices through the center of mass of the cores can be found in the appendix, Fig. 26–35.

The comparison shows that the two methods of assessing the virial state of a core are not fully consistent with each other: All identifed cores occupy the range . In contrast, some of them exhibit small virialization ratios , as defined in Eq. 35, in a range of , which implies they are actually far from being virialized when considering all relevant terms.
We stress that for determining , only information on the velocity and mass distribution inside the object volume is incorporated, while from the full virial analysis is constructed using knowledge on the kinetic, thermal and magnetic state of the gas inside the objects volume and on its surface as well as the gravitational field configuration caused by the global mass distribution. The difference in assessment between both methods can be attributed to lacking information on any of those particular fields in the construction of .
This inconsistency is not caused by tidal interactions arising from the respective external mass distribution because the cores masses are well correlated with their gravitational binding energies (see Fig. 23). Kinetic interactions dominate the virial state of the identified cores, while thermal as well as magnetic interactions are of little importance (see Fig. 11). For all cores, the thermal and magnetic surface terms are considerably smaller than the corresponding volume energy terms in the EVT (see Fig. 10), whereas it can be different for the kinetic surface term. Furthermore, considering the confinement balance ratio (Fig. 13), the kinetic as well as total surface term for most of the cores is positive and clearly correlated with the binding energy deficit, as compared with a virialized state of those cores. This suggests that the kinetic surface term is the main source of the inconsistency between and .
6 Conclusions
We use 3D ideal MHD simulations, which include gravity and a chemical model that considers radiative cooling and heating, to simulate a scenario of colliding magnetized gas flows in order to model the formation of molecular clouds and their substructures. We analyse four simulations with varying initial magnetic field strength between 0.01–5 G.
As a function of the initial magnetic field strength the structure of the molecular cloud changes gradually. With increasing field strength filamentary structures get less prominent since gas motions perpendicular to the magnetic field direction are suppressed. Instead, the whole sheet starts to fragment, leading to a higher number of fragments with a smaller average mass each.
Based on the local CO abundance, we detect molecular clumps, i.e. connected volumes with at least 100 cells, in the simulations. Additionally, cores are defined to exhibit a local visual extinction of more than 8 mag. Hence cores are always sub-structures of clumps. We find that after , 30%-50% of the total molecular mass in our simulations is found in clumps, 20%-60% of which are concentrated in the contained cores. We find projection effects to be important: Core formation efficiencies around 10%, as derived from the 2D projected column density maps, seem to fit observations (Könyves et al., 2015). However, like Haid et al. (2019), we find that the gas column-density-based visual extinction overestimates the actual UV shielding in a 3D fractal structure, which is measured locally for each cell using . The cores actually comprise almost the entire shielded gas above (We note that, while this is implied by our core detection criterion, criteria based on density or gravitational field strength yielded similar results).
For each of our simulations, at , the ensemble of smaller clumps roughly follows the -size relation found by Heyer & Brunt (2004), which is steeper than the original Larson Relation. However, clumps which are more massive than approximately deviate towards higher velocity dispersions. This is explained by the increased average surface density of those clumps caused by the occurrence of contained cores. Overall, we observe -size and mass-size relations for our clumps that are rather consistent with them being transient objects that are formed by turbulence. Most clumps exhibit a virial parameter that is not consistent with objects in gravitational-kinetic equipartition, populating a low surface density tail in the Heyer relation. The detected cores’ surface densities are larger than those of most clumps and populate the range of virial parameters. Interestingly, there is no clear correlation of the clump and core ensembles’ -size- and mass-size-slopes, as well as of the scaling coefficient in the Heyer relation, with the initial magnetic field strength .
Our full virial analysis reveals most of the detected clumps to be unbound objects far from virial equilibrium. For those, the virial surface and volume quantities are often of comparable magnitude, suggesting that they are transient objects. Thermal and magnetic energy are only significant for a few of the less massive, coreless clumps. Compression (or confinement), if present, is mostly driven by ram pressure or thermal pressure rather than gravity (considering self-gravity and the weight of the surrounding medium), except for the largest clumps. On the other hand, more massive clumps (containing cores) tend to be closer to virial equilibrium (). They are dominated by the interplay of volume kinetic energy and gravity and can be found towards higher surface densities in the Heyer relation.
All cores are kinetically dominated while thermal and magnetic contributions towards the virial theorem are small. In fact, most cores are close to virial equilibrium, yet some are slightly affected by dispersing kinetic surface effects. Hence, the cores are overall well described by the normal virial parameter, which explains them located close to in the Heyer relation, valid for objects in gravitational-kinetic equipartition.
The quantitative analysis of the EVT’s time-dependent term () shows that the flux of the moment of inertia through an objects’ surface is typically significant for the unbound clumps. This term becomes less important for the denser clumps, which host cores, and for the cores themselves. We show that this term is mostly caused by the rate of change of the mass accretion rate through the objects’ static surface in the Eulerian reference frame. However, this mass flow does not correspond to a real accretion rate following the common interpretation of self-gravitating, well-defined cores which gain mass by accretion. This can be seen when we compare the rate of change of the mass accretion rate derived from the EVT to the same value derived for specific cores which can be tracked in time.
Data availability
The data underlying this article will be shared on reasonable request to the corresponding author.
Acknowledgements
We thank the Deutsche Forschungsgemeinschaft (DFG) for funding through the SFB 956 ”The conditions and impact of star formation” (sub-projects C5 and C6). The software used in this work was developed in part by the DOE NNSA- and DOE Office of Science-supported Flash Center for Computational Science at the University of Chicago and the University of Rochester. We particularly thank the Regional Computing Center Cologne for providing the computational facilities for this project by hosting our supercomputing cluster "Odin" and the Leibniz-Computing Center in Garching for providing computational resources on SuperMuc via project pr62ni. The authors are also thankful for VisIt (Childs et al., 2012), which allowed us to produce volume-rendered visualizations. VisIt is supported by the Department of Energy with funding from the Advanced Simulation and Computing Program and the Scientific Discovery through Advanced Computing Program.
References
- André et al. (2014) André P., Di Francesco J., Ward-Thompson D., Inutsuka S. I., Pudritz R. E., Pineda J. E., 2014, in Beuther H., Klessen R. S., Dullemond C. P., Henning T., eds, Protostars and Planets VI. p. 27 (arXiv:1312.6232), doi:10.2458/azu_uapress_9780816531240-ch002
- Audit & Hennebelle (2005) Audit E., Hennebelle P., 2005, A&A, 433, 1
- Ballesteros-Paredes et al. (2007) Ballesteros-Paredes J., Klessen R., Mac Low M., Vazquez-Semadeni E., Reipurth B., Jewitt D., Keil K., 2007, University of Arizona Press (arXiv: 0603357)
- Ballesteros-Paredes et al. (2018) Ballesteros-Paredes J., Vázquez-Semadeni E., Palau A., Klessen R. S., 2018, MNRAS, 479, 2112
- Beaumont et al. (2013) Beaumont C. N., Offner S. S. R., Shetty R., Glover S. C. O., Goodman A. A., 2013, ApJ, 777, 173
- Bergin & Tafalla (2007) Bergin E. A., Tafalla M., 2007, ARA&A, 45, 339
- Bouchut et al. (2010) Bouchut F., Klingenberg C., Waagan K., 2010, Numerische Mathematik, 115, 647
- Chandrasekhar & Fermi (1953) Chandrasekhar S., Fermi E., 1953, ApJ, 118, 116
- Chen et al. (2020) Chen H. H.-H., Offner S. S. R., Pineda J. E., Goodman A. A., Burkert A., Ginsburg A., Choudhury S., 2020, arXiv e-prints, p. arXiv:2006.07325
- Chevance et al. (2020) Chevance M., et al., 2020, MNRAS, 493, 2872
- Childs et al. (2012) Childs H., et al., 2012, in , High Performance Visualization–Enabling Extreme-Scale Scientific Insight. pp 357–372, doi:10.1201/b12985
- Clark et al. (2012a) Clark P. C., Glover S. C. O., Klessen R. S., 2012a, MNRAS, 420, 745
- Clark et al. (2012b) Clark P. C., Glover S. C. O., Klessen R. S., Bonnell I. A., 2012b, MNRAS, 424, 2599
- Crutcher (2012) Crutcher R. M., 2012, ARA&A, 50, 29
- Dib et al. (2007) Dib S., Kim J., Vázquez-Semadeni E., Burkert A., Shadmehri M., 2007, ApJ, 661, 262
- Draine & Bertoldi (1996) Draine B. T., Bertoldi F., 1996, ApJ, 468, 269
- Dubey et al. (2008) Dubey A., Reid L. B., Fisher R., 2008, Physica Scripta Volume T, 132, 014046
- Elmegreen (2000) Elmegreen B. G., 2000, ApJ, 530, 277
- Fryxell et al. (2010) Fryxell B., et al., 2010, FLASH: Adaptive Mesh Hydrodynamics Code for Modeling Astrophysical Thermonuclear Flashes, Astrophysics Source Code Library, record ascl:1010.082 (ascl:1010.082)
- Ganguly et al. (2022) Ganguly S., Walch S., Clarke S. D., Seifried D., 2022, arXiv e-prints, p. arXiv:2204.02511
- Glover & Clark (2012) Glover S. C. O., Clark P. C., 2012, MNRAS, 421, 9
- Glover & Jappsen (2007) Glover S. C. O., Jappsen A. K., 2007, ApJ, 666, 1
- Glover & Mac Low (2007) Glover S. C. O., Mac Low M.-M., 2007, ApJ, 659, 1317
- Glover et al. (2010) Glover S. C. O., Federrath C., Mac Low M. M., Klessen R. S., 2010, MNRAS, 404, 2
- Górski et al. (2005) Górski K. M., Hivon E., Banday A. J., Wandelt B. D., Hansen F. K., Reinecke M., Bartelmann M., 2005, ApJ, 622, 759
- Hacar et al. (2022) Hacar A., Clark S., Heitsch F., Kainulainen J., Panopoulou G., Seifried D., Smith R., 2022, arXiv e-prints, p. arXiv:2203.09562
- Haid et al. (2019) Haid S., Walch S., Seifried D., Wünsch R., Dinnbier F., Naab T., 2019, MNRAS, 482, 4062
- Heiderman et al. (2010) Heiderman A., Evans Neal J. I., Allen L. E., Huard T., Heyer M., 2010, ApJ, 723, 1019
- Heitsch et al. (2005) Heitsch F., Burkert A., Hartmann L. W., Slyz A. D., Devriendt J. E. G., 2005, ApJ, 633, L113
- Heitsch et al. (2008) Heitsch F., Hartmann L. W., Burkert A., 2008, ApJ, 683, 786
- Heitsch et al. (2009) Heitsch F., Ballesteros-Paredes J., Hartmann L., 2009, ApJ, 704, 1735
- Heitsch et al. (2011) Heitsch F., Naab T., Walch S., 2011, MNRAS, 415, 271
- Heyer & Brunt (2004) Heyer M. H., Brunt C. M., 2004, ApJ, 615, L45
- Heyer et al. (2009) Heyer M., Krawczyk C., Duval J., Jackson J. M., 2009, ApJ, 699, 1092
- Hollenbach & McKee (1989) Hollenbach D., McKee C. F., 1989, ApJ, 342, 306
- Holman et al. (2013) Holman K., Walch S. K., Goodwin S. P., Whitworth A. P., 2013, MNRAS, 432, 3534
- Ibáñez-Mejía et al. (2022) Ibáñez-Mejía J. C., Mac Low M.-M., Klessen R. S., 2022, ApJ, 925, 196
- Inoue & Inutsuka (2008) Inoue T., Inutsuka S.-i., 2008, ApJ, 687, 303
- Joshi et al. (2019) Joshi P. R., Walch S., Seifried D., Glover S. C. O., Clarke S. D., Weis M., 2019, MNRAS, 484, 1735
- Kerr et al. (2019) Kerr R., et al., 2019, ApJ, 874, 147
- Könyves et al. (2015) Könyves V., et al., 2015, A&A, 584, A91
- Körtgen & Banerjee (2015) Körtgen B., Banerjee R., 2015, MNRAS, 451, 3340
- Krumholz & McKee (2008) Krumholz M. R., McKee C. F., 2008, Nature, 451, 1082
- Lada et al. (2010) Lada C. J., Lombardi M., Alves J. F., 2010, ApJ, 724, 687
- Larson (1981) Larson R. B., 1981, MNRAS, 194, 809
- Lazarian et al. (2012) Lazarian A., Esquivel A., Crutcher R., 2012, ApJ, 757, 154
- Loren (1989) Loren R. B., 1989, ApJ, 338, 925
- Mao et al. (2020) Mao S. A., Ostriker E. C., Kim C.-G., 2020, ApJ, 898, 52
- McKee & Ostriker (2007) McKee C. F., Ostriker E. C., 2007, ARA&A, 45, 565
- McKee & Zweibel (1992) McKee C. F., Zweibel E. G., 1992, ApJ, 399, 551
- Myers (1983) Myers P. C., 1983, ApJ, 270, 105
- Nakano & Nakamura (1978) Nakano T., Nakamura T., 1978, PASJ, 30, 671
- Nelson & Langer (1997) Nelson R. P., Langer W. D., 1997, ApJ, 482, 796
- Scannapieco & Brüggen (2015) Scannapieco E., Brüggen M., 2015, ApJ, 805, 158
- Schneider & Elmegreen (1979) Schneider S., Elmegreen B. G., 1979, ApJS, 41, 87
- Seifried et al. (2011) Seifried D., Schmidt W., Niemeyer J. C., 2011, A&A, 526, A14
- Seifried et al. (2017) Seifried D., et al., 2017, MNRAS, 472, 4797
- Seifried et al. (2020a) Seifried D., Haid S., Walch S., Borchert E. M. A., Bisbas T. G., 2020a, MNRAS, 492, 1465
- Seifried et al. (2020b) Seifried D., Walch S., Weis M., Reissl S., Soler J. D., Klessen R. S., Joshi P. R., 2020b, MNRAS, 497, 4196
- Sembach et al. (2000) Sembach K. R., Howk J. C., Ryans R. S. I., Keenan F. P., 2000, ApJ, 528, 310
- Shimoikura et al. (2019) Shimoikura T., Dobashi K., Hirose A., Nakamura F., Shimajiri Y., Sugitani K., 2019, PASJ, 71, S6
- Traficante et al. (2018) Traficante A., et al., 2018, MNRAS, 477, 2220
- Valdivia et al. (2016) Valdivia V., Hennebelle P., Gérin M., Lesaffre P., 2016, A&A, 587, A76
- Vázquez-Semadeni et al. (2005) Vázquez-Semadeni E., Kim J., Shadmehri M., Ballesteros-Paredes J., 2005, ApJ, 618, 344
- Waagan et al. (2011) Waagan K., Federrath C., Klingenberg C., 2011, Journal of Computational Physics, 230, 3331
- Walch et al. (2010) Walch S., Naab T., Whitworth A., Burkert A., Gritschneder M., 2010, MNRAS, 402, 2253
- Walch et al. (2015) Walch S., et al., 2015, MNRAS, 454, 238
- Walder & Folini (1998) Walder R., Folini D., 1998, Ap&SS, 260, 215
- Williams et al. (1994) Williams J. P., de Geus E. J., Blitz L., 1994, ApJ, 428, 693
- Williams et al. (2000) Williams J. P., Blitz L., McKee C. F., 2000, in Mannings V., Boss A. P., Russell S. S., eds, Protostars and Planets IV. p. 97 (arXiv:astro-ph/9902246)
- Wünsch et al. (2018) Wünsch R., Walch S., Dinnbier F., Whitworth A., 2018, MNRAS, 475, 3393
- Zuckerman & Evans (1974) Zuckerman B., Evans N. J. I., 1974, ApJ, 192, L149
Appendix A TreeRay optical depth
The TreeRay/OpticalDepth module is used to calculate the local extinction of the external UV field. This section provides a short overview of the algorithm; for a complete description of the algorithm and its implementation, please refer to Wünsch et al. (2018).
The module works by evaluating the solution to
| (42) |
where is the specific intensity of the UV field at the target location and at frequency , is the specific intensity of the external field source, and is the optical depth, which is proportional to the total hydrogen column density along the path connecting both as well as its associated absorption cross-section.
For any target cell in the simulation domain, a healpix sphere (Górski et al., 2005) using pixels is constructed, each pixel representing a beam radiating towards the pixel from a specific direction. Those pixels then comprise a temporary column density map, with each pixel mapped to the AMR octree-nodes on the line of sight along the beam. The TreeRay mechanism then walks the entire octree at each timestep, in turn filling those maps. The mean visual extinction of a given cell is then determined by
| (43) |
where is the ratio between the hydrogen column density and the visual extinction given by Draine & Bertoldi (1996).
Fig. 19 shows a mass-weighted PDF of the resulting 3D visual extinction .

Appendix B Virial analysis tests
To test the numerical validity of our virial analysis, we compare the temporal evolution of the moment of inertia of the selected spaces containing the clumps and cores in our simulations, to that indicated by evaluation of the Eulerian virial theorem. Fig. 20 shows a comparison of the value of determined by evaluation of the aggregate of all virial terms represented by the right hand sideof Eq. 1 at to the analogous value determined by numerical double differentiation of via application of a finite difference scheme to three consecutive time-steps of simulation data encompassing that point in simulation time.

For the vast majority of clumps, it shows the virial analysis to predict the numerical value of with little deviation over several orders of magnitude.
Appendix C Balance of volume- and surface terms

Fig. 21 shows the clumps volume energy as well as their surface term to be dominated by the value of the respective magnetic energy term. While all of the components of the volume energy terms are strictly positive, the surface terms can be both negative or positive, depending on the configuration of the respective clump.
Furthermore, the volume energy of some of the cores to be largely dominated by kinetic energy, whereas the other cores are distributed over all sectors of the ternary, indicating none of the terms to be negligible. The surface term composition of the cores is distinct to that of the volume energy, in that the thermal surface term is only an inferior part of the surface term for most of the clumps, hinting at most of the cores not being pressure confined by their surroundings.
Appendix D Additional figures
Supplementing Fig. 3 in Section 4.1, Fig. 22 shows the edge-on column density maps for all simulations at , , , and . The line of sight is along the -direction and perpendicular to the flow direction.
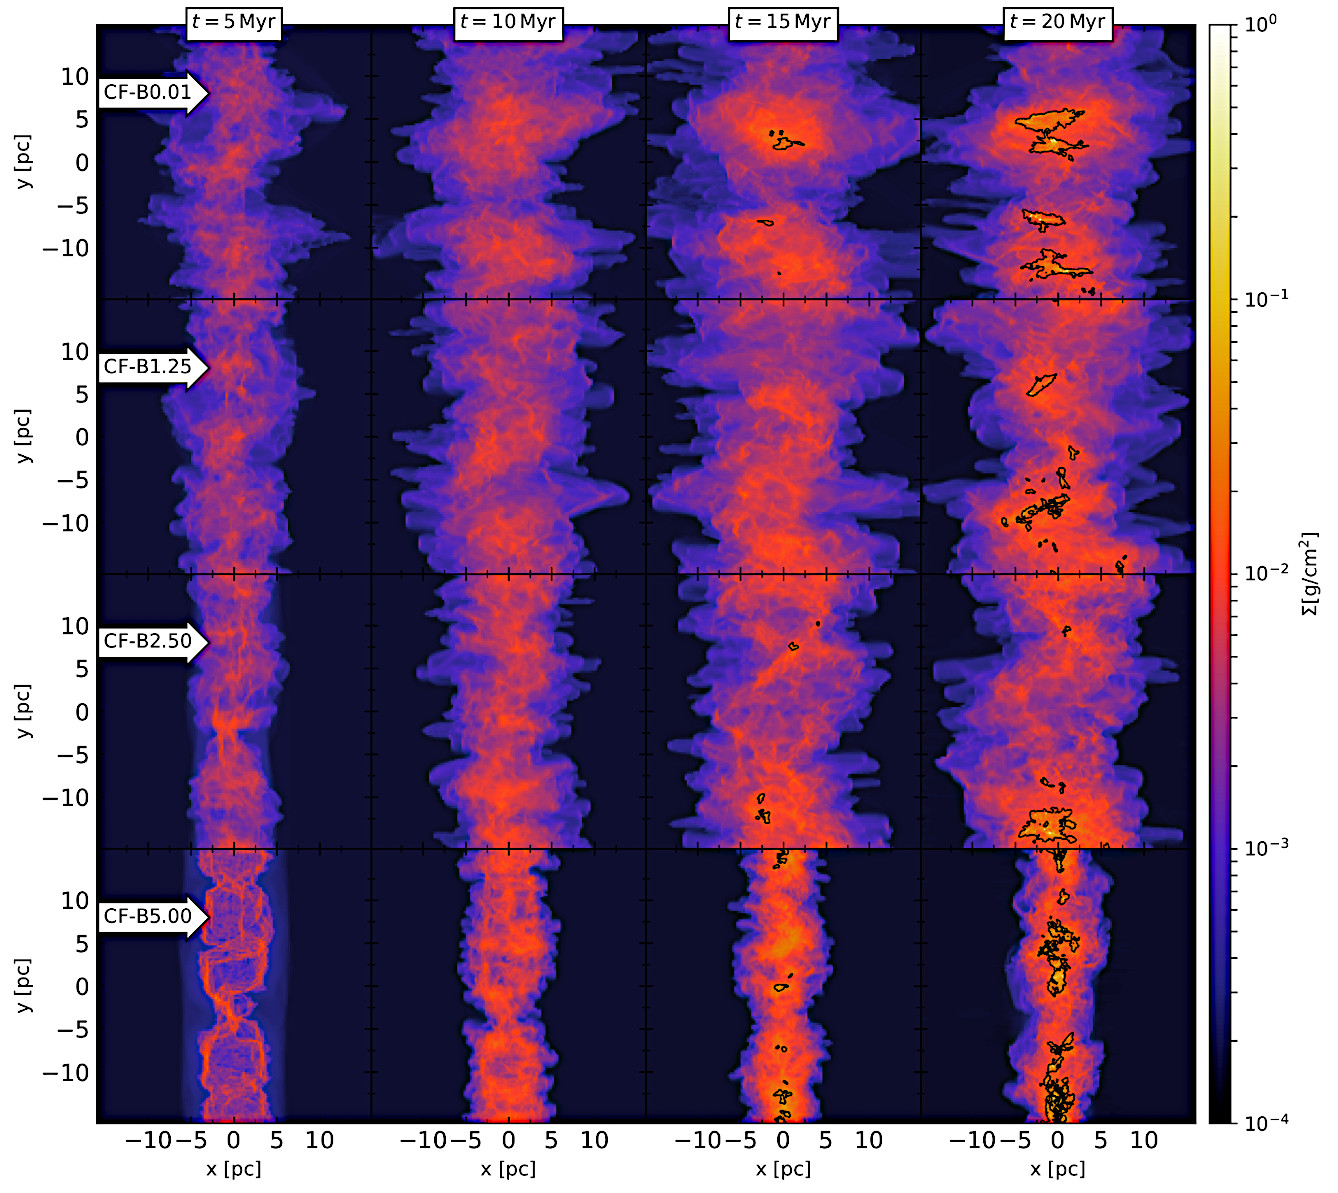
Fig. 23 shows the relation between the mass and the gravitational binding energy of the detected cores. For the cores and the coreless clumps, there is a power-law like correlation between and , respectively, albeit differing in coefficient.

Fig. 24 shows a comparison of the mass accretion rates of trackable cores, as obtained from the mass evolution, versus measured in the Eulerian frame for the same objects, at . For most of the trackable cores, both values are of similar size, with a tendency to overestimate when using the value from the Eulerian frame.

Fig. 25 shows a comparison of the rates of change of the mass accretion rate of trackable cores, as obtained from the mass evolution by object tracking, versus measured in the Eulerian frame, at . We note that while only the absolute values are displayed in the Figure, the shape of the symbol indicates the sign of both the Eulerian value (-axis) and the mass evolution value (-axis). The values are largely uncorrelated, with even the sign disagreeing for some cores.

Appendix E Gallery of detected cores
Fig. 26–35 show density slices of the detected cores. The slice directions are perpendicular to the (left) and the directions. The black outlines mark the in-slice cross sections of the detected cores.
