Morpheus Reveals Distant Disk Galaxy Morphologies with JWST:
The First AI/ML Analysis of JWST Images
Abstract
The dramatic first images with James Webb Space Telescope (JWST) demonstrated its power to provide unprecedented spatial detail for galaxies in the high-redshift universe. Here, we leverage the resolution and depth of the JWST Cosmic Evolution Early Release Science Survey (CEERS) data in the Extended Groth Strip (EGS) to perform pixel-level morphological classifications of galaxies in JWST imaging using the Morpheus deep learning framework for astronomical image analysis. By cross-referencing with existing photometric redshift catalogs from the Hubble Space Telescope (HST) CANDELS survey, we show that JWST images indicate the emergence of disk morphologies before and with candidates appearing as early as . By modeling the light profile of each object and accounting for the JWST point-spread function, we find the high-redshift disk candidates have exponential surface brightness profiles with an average Sérsic (1968) index and displaying “disky” profiles (). Comparing with prior Morpheus classifications in CANDELS we find that a plurality of JWST disk galaxy candidates were previously classified as compact based on the shallower HST imagery, indicating that the improved optical quality and depth of the JWST helps to reveal disk morphologies that were hiding in the noise. We discuss the implications of these early disk candidates on theories for cosmological disk galaxy formation.
1 Introduction
The formation and evolution of disk galaxies in the context of our cosmology remains as one of the most complex problems in astrophysics. The violent, hierarchical nature of galaxy mass assembly at high redshifts can destroy dynamically cold disks, and yet thin disk galaxies are plentiful in the local universe. Determining the era when the first disk galaxies could form would provide an important milestone in understanding how galaxy morphology develops over cosmic time. This Letter presents first results of applying artificial intelligence/machine learning (AI/ML) techniques to James Webb Space Telescope (JWST) images, searching for distant disk galaxies by analyzing JWST data with the Morpheus deep learning framework (Hausen & Robertson, 2020, hereafter H20).
Observations of disk galaxy formation in the distant universe have advanced greatly over the last two decades. Integral field spectroscopy of disk galaxies at intermediate redshifts () established that the ionized gas dynamics of many early-forming disks differed substantially from those in the local universe, with lower ratios of rotational velocity to velocity dispersion than in the present day (e.g., Genzel et al., 2006; Law et al., 2007; Genzel et al., 2008; Stott et al., 2016; Simons et al., 2017; Förster Schreiber et al., 2018; Wisnioski et al., 2019). Large, star-forming disk galaxies at redshifts can be baryon-dominated, with relatively little dark matter contributing to their rotation curves (Wuyts et al., 2016; Genzel et al., 2017; Übler et al., 2018; Price et al., 2020; Genzel et al., 2020). The structure of early disks can be distinct from dynamically colder disk galaxies at the present, perhaps reflecting a transition between disks heavily influenced by the hierarchical mass assembly process to more ordered rotation at lower redshifts (e.g., Kassin et al., 2012; Simons et al., 2017; Tiley et al., 2021). This transition may mirror the evolution of observed axis ratios, as observations with HST have established a smaller fraction of disk galaxies at earlier cosmic times (e.g., Law et al., 2012; van der Wel et al., 2014; Zhang et al., 2019).
Observations of [CIII] and CO emission at even higher redshifts with the Atacama Large Millimeter/Submillimeter Array (ALMA) have discovered evidence for rotationally-supported disk galaxies in the first two billion years of cosmic history (Smit et al., 2018; Neeleman et al., 2020; Rizzo et al., 2020, 2021; Fraternali et al., 2021; Lelli et al., 2021; Tsukui & Iguchi, 2021). These galaxies show , substantially larger than those predicted for the bulk population of disk galaxies by cosmological simulations (e.g., Pillepich et al., 2019). Recent theoretical work suggests that relatively massive galaxies may sustain cold disks even in the early universe (Kretschmer et al., 2022; Gurvich et al., 2022), but understanding how rare such objects are, elucidating the role of the kinematical tracer, and determining their relationship to the broader galaxy population all require more investigation.
The new JWST data can address outstanding questions raised by these previous results. When did the first disk galaxy candidates appear in the universe? What is the relative gas to stellar mass content of these galaxies, and how does that influence their formation? JWST can contribute substantially to answering these questions, both through better constraints on the stellar population properties of early disks and through kinematic measures via its unprecedented spectroscopic capabilities. Addressing these questions with JWST will require the identification of more high-redshift disk galaxy candidates. Here, we perform pixel-level analysis of the JWST Cosmic Evolution Early Release Science Survey (CEERS; Finkelstein et al., in prep.) data in the Extended Groth Strip (EGS) using the Morpheus deep learning model (H20) to search for high-redshift () disk galaxy candidates. Morpheus has been trained to classify galaxies, stars, and sky pixels in space-based astronomical images, and we apply the model directly to the EGS JWST mosaic without modification. We identify galaxies with photometric redshifts with dominant disk morphologies as determined by Morpheus. We then verify via surface brightness model fitting that the vast majority of candidates are structurally consistent with being high-redshift disks. These results indicate that AI/ML methods like Morpheus will effectively identify distant disk galaxy candidates for kinematic follow-up observations with spectroscopy. Our AI/ML approach complements other recent work identifying disk galaxy candidates in deep JWST images through traditional analyses (e.g., Fudamoto et al., 2022; Nelson et al., 2022; Ferreira et al., 2022; Jacobs et al., 2022; Wu et al., 2022). Where necessary, we assume parameters for the flat CDM cosmology determined by the Planck Collaboration et al. (2020) survey (i.e., , ).
2 Method
The identification of high-redshift disk galaxy candidates in the JWST CEERS images proceeded by first fully re-reducing the imaging data products and then performing object detection and photometry (§2.1). We then analyzed the JWST images with Morpheus to identify objects with disk morphologies (§2.2), and cross-referenced with catalogs from the literature to select disk candidates at (§2.3).
2.1 Imaging, Detection, and Photometry
The JWST CEERS EGS images (34.5 arcmin2, see Finkelstein et al., 2022, Finkelstein in prep.) were downloaded and processed with the STScI JWST pipeline (v1.6.2) using custom treatments for data artifacts to remove “wisps” and “snowballs” (e.g., §6 of Rigby et al., 2022), background subtraction and sky flats (jwst_0953.pmap), and -noise correction. The exposures were astrometrically aligned to the CEERS HST F160W image and mosaiced onto a 0.03”/pixel image.
Object detection and photometry were performed using a set of custom scripts based on photutils methods. We created a detection image from an inverse-variance weighted stack of the long-wavelength , , , and mosaics to provide a deep, rest-frame optical selection. Contiguous regions in the detection image with pixels were identified as objects in a segmentation map, and forced aperture photometry was performed about their centroids.
2.2 Morphological Analysis
The JWST images were analyzed using a version of Morpheus (H20) trained on HST F160W images at a similar observed wavelength. Morpheus is a UNet (Ronneberger et al., 2015) convolutional neural network with residual links (He et al., 2015) that performs pixel-level classification, assigning a “model probability” that each pixel in a science-quality FITS image (Wells et al., 1981) belongs to spheroid, disk, irregular, compact/point source, or background classes. A “classification image” for each class is produced to record the pixel-level model probabilities, which can be agglomerated into object-level classifications by summations over the pixels. H20 used the visual classifications of CANDELS galaxies provided by Kartaltepe et al. (2015) (90% completeness limit for an AB selection) to train the model, and then used Morpheus to classify all the pixels in CANDELS by processing the HST , , , and images. Morpheus has since been updated to include an accelerated attention mechanism (Wang et al., 2017; Vaswani et al., 2017; Hu et al., 2020) that improves the model performance by using non-local image features and allows for larger regions of the image to be classified at once, providing a roughly 100 speed up in classification efficiency relative to H20 with comparable performance (for a discussion of related changes to Morpheus, see Hausen & Robertson, 2022). The updated Morpheus model was previously trained to perform classification on HST images alone using the Adam optimizer (Kingma & Ba, 2014). We leverage this training to provide a first attempt at classification of the JWST images at a similar observed wavelength and validate our classifications with surface brightness profile modeling.
2.3 Disk Galaxy Candidate Selection
To identify disk galaxy candidates, we used the Morpheus classification images with the segmentation maps and detection images (see §2.1) to create SNR-weighted object-level model probabilities for each class. We cross-matched our sources against the CANDELS v1 EGS photometric redshift and stellar population synthesis analysis catalogs (Stefanon et al., 2017), and then selected all objects at redshifts with a Morpheus-assigned object-level model probability . For this initial analysis, we restrict our sample to objects with photometric redshift estimates available in the CANDELS catalogs (90% complete for point sources , see Stefanon et al., 2017, for details on detection and photometric redshift determinations) and spatially close centroid matches ( pixels). Over the NIRCam EGS footprint, we find good spatial matches to sources in the CANDELS catalog before redshift or morphological cuts. Over all redshifts, about 1600 CANDELS EGS sources are classified as disk by Morpheus.
3 Results
The selection criteria (§2.3) applied to the analysis of JWST NIRCam images with Morpheus (§2.2) identified 202 disk galaxy candidates out of 2507 catalog matches with redshifts . The average photometric redshift of the sample is , with 42 disk candidates at redshifts (out of 988) and 10 disk candidates at redshifts (out of 353). Below, we examine the visual morphologies of the objects (§3.1) and perform surface brightness model fitting to verify consistency with structural disk galaxy properties (§3.2).
3.1 Visual Morphologies
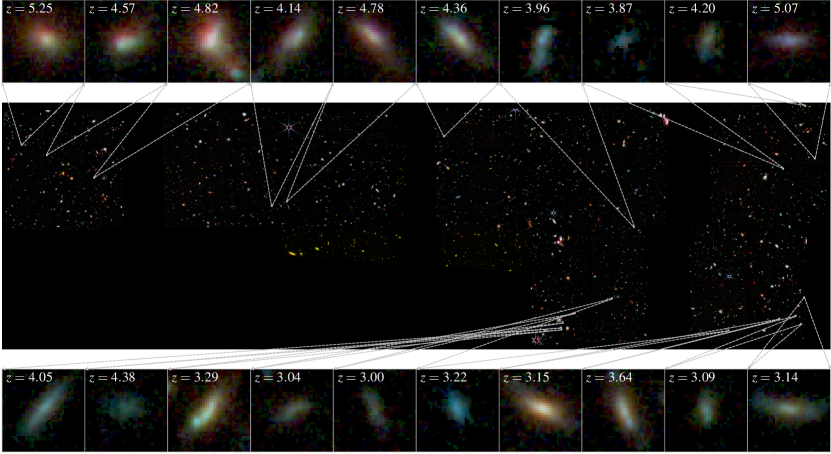
Figure 1 shows a JWST -- RGB false color image of the CEERS EGS mosaic, highlighting 20 candidates with large CANDELS photometric redshifts as 0.3”0.3” thumbnails above and below the mosaic. Many candidates show disk-like visual morphologies, often with flattened, extended light distributions. Some galaxies show central concentrations, clumps, or amorphous light distributions in addition to their extended disk morphologies. Of the 202 high-redshift disk candidates, only 21% were brighter than the AB completeness limit for visual classification by Kartaltepe et al. (2015) and of these 57% were classified as disk in our prior HST-based analysis. Of the 160 objects fainter than AB, only 8 (5%) were previously classified as disk. The plurality (49%) of objects were previously classified as compact/point source as the HST imaging quality was not detailed or deep enough for the model to choose a distinctive morphology for many objects. The remaining objects were previously classified as spheroid (5%), irregular (16%), or not detected by the algorithm and labeled as background (25%). To compare with previous AI/ML classifications, over 800 arcmin2 of HST CANDELS images Huertas-Company et al. (2016) reported finding 413 objects with redshifts that they classify as disks, whereas with Morpheus applied to JWST we find 202 candidate disk galaxies at over only 34.5 arcmin2. Given the wide range of redshifts , the colors of the objects vary with AB and AB, and mean colors AB and AB. From the CANDELS catalogs, we find that the typical stellar masses are , with 40% of objects inferred to have less than a billion solar masses in stars.
3.2 Surface Brightness Profiles
Following the identification of high-redshift disk galaxy candidates by Morpheus, an evaluation of the candidates through a traditional morphological analysis can help assess the efficacy of our AI/ML approach even without retraining on JWST images. If traditional metrics of “diskiness” agree with the Morpheus results, our confidence in the AI/ML classifications would be strengthened. In Hausen & Robertson (2020), the ability of Morpheus to classify Sérsic (1968) profiles based on traditional associations between surface brightness profile and morphology was demonstrated. Morpheus classifies extended objects with Sérsic indices (exponential profiles) as disk, whereas objects with indices are usually classified as spheroid or compact/point source. In this work, we used the forcepho (Johnson et al., in prep.) and ProFit (Robotham et al., 2017) Bayesian profile fitting codes to model the surface brightness profile of each high-redshift disk galaxy candidate selected by Morpheus. We note that Morpheus can spatially distinguish between the bulge and disk components of galaxies, and can also classify pixels in the star-forming regions of disks as irregular (see H20). We will explore these composite morphologies in JWST imagery in future work.
3.2.1 ForcePho Modeling
When using forcepho, a 3” 3” region about each object centroid was cutout from the JWST , , and flux and flux error images. Source locations from the detection catalog were supplied to forcepho, which then fit Sérsic models to the surface brightness profiles of each object in the cutout, accounting for possible flux contributions from neighboring sources. The PSFs used in convolving the models to the data resolution were generated from a mixture of Gaussians matched to reproduce the pre-flight WebbPSF (Perrin et al., 2014) model for each JWST filter. The forcepho code performs Monte Carlo Markov Chain sampling of the nine free parameters including , , fluxes, the RA and DEC of each object, the isophotal position angle, the axis ratio, the Sérsic index, and the half-light radius. This procedure allows for uncertainties on the model parameters to be computed and possible parameter covariances to be studied. A single profile shape is fit to each filter by allowing only the amplitude to vary between them, and we do not attempt here to model wavelength-dependent shape variations.
3.2.2 ProFit Modeling
For the ProFit modeling, a 3” 3” region about each object centroid was cutout from the JWST flux and flux error images. These images, along with corresponding cutouts from the segmentation map and a PSF model generated by WebbPSF, were supplied to ProFit and a single-component Sérsic model was fit to each image. We used eight free parameters, including the pixel centroids, total flux, effective radius, Sérsic profile indices (), axis ratio, position angle, and isophotal boxiness. One hundred and ninety out of 202 objects received successful ProFit fits, with the reduced for the sample. Failed ProFit single component fits showed evidence for multiple components, and many of these objects were successfully modeled with forcepho.
3.2.3 Surface Brightness Profile Model Results
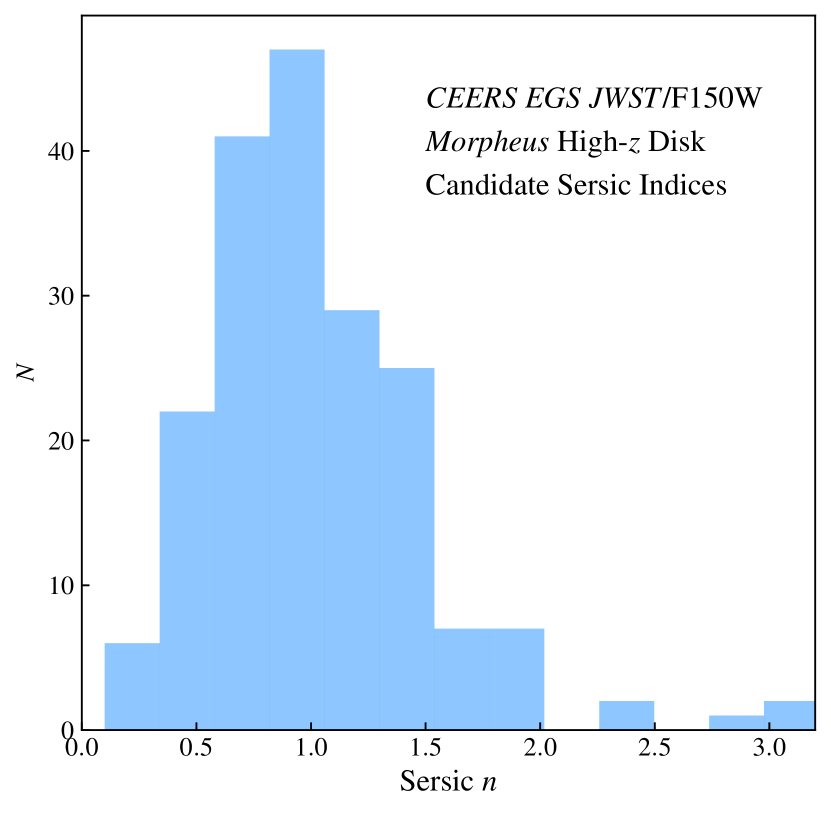
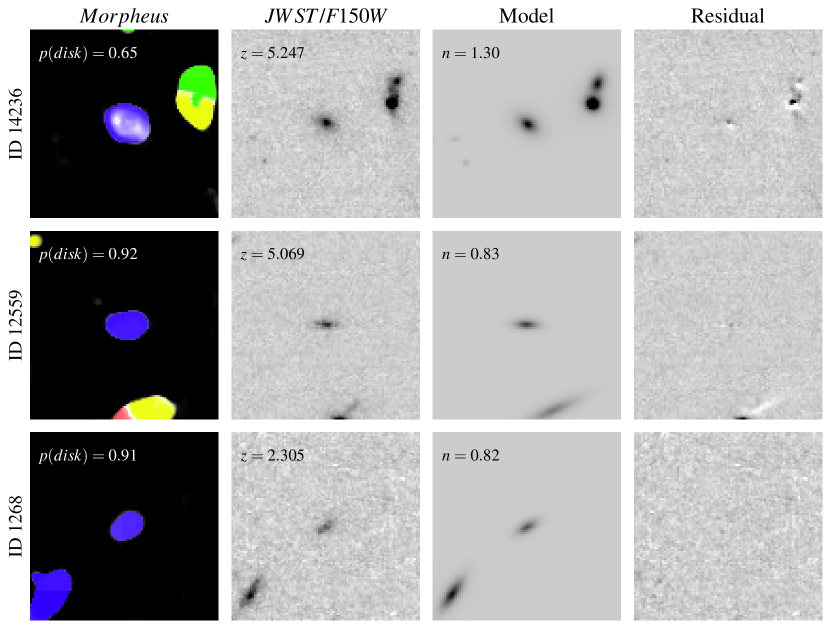
Figure 2 shows a histogram of the best-fit Sérsic indices for the entire Morpheus high-redshift disk sample from ProFit modeling. The vast majority (183/190; 96%) of the successful fits displayed “disky” () Sérsic indices, with a mean of and median . The forcepho model fits show good agreement, with mean and median Sérsic indices of and , and 97% of the disk candidates displaying . Figure 3 presents three example high-redshift disk galaxy candidates identified by Morpheus with photometric redshifts of . Shown are the Morpheus pixel-level classification maps for each object (left panels), their JWST flux images (center left panels), the best-fit forcepho models of their surface brightness distributions (center right panels), and the residuals between the model and the data (right panels). As these examples demonstrate, the objects Morpheus classified as disks appear flattened and have best-fit Sérsic profiles with indices as expected for exponential disks. In summary, the AI/ML classifications from Morpheus and the traditional Sérsic index morphological correspondence show excellent agreement. See H20 for more details on how Morpheus classifies galaxies with Sérsic profiles.
Beyond Sérsic index, the distribution of axis ratios can be used to assess the fraction of our candidates that are likely to be disks rather than prolate, potentially triaxial spheroids. Both the forcepho and ProFit models show very consistent axis ratios, with typical with a spread . We follow Law et al. (2012) and perform Monte Carlo simulations of disks and spheroid projected axis ratio distributions. We then use a Kolmogorov-Smirnov test to compare consistency between the model and observed axis ratio distribution. Since the distributions are not uniform, and given prior HST results (e.g., Law et al., 2012; van der Wel et al., 2014; Zhang et al., 2019), we expect spheroids to contribute to the population of flattened, low-Sérsic objects and so not all of our candidates will truly be disks. Given the measured axis ratio distributions, we find an upper limit (3) that 57% of the sample can be pure disks with with the remainder being triaxial or prolate spheroids. We cannot yet rule out a mix of triaxial spheroids with a wide range of axis ratios contributing to the majority of the sample. We also note that there is evidence from H20 that Morpheus is incomplete for face-on disks, and we expect this issue to be exacerbated for faint objects. Correcting for this incompleteness would raise the upper limits on pure disks. We leave a more detailed analysis for future work, but suggest that kinematic measurements from spectroscopic observations will be required to confirm our candidates as high-redshift disks.
4 Discussion
The ability of JWST to perform AI/ML-aided identification of distant disk galaxy candidates will add to the growing observational information we have on how early disk galaxies might form in our cosmology. Many of our disk candidates lie at where there are substantial constraints on disk kinematical structure (e.g., Förster Schreiber & Wuyts, 2020), but less is known about the high-redshift end of our sample. Recent Atacama Large Millimeter/Submillimeter Array (ALMA) observations, when combined with stellar population modeling, suggest that early star-forming main-sequence galaxies are extremely gas-rich (; Heintz et al., 2022). ALMA observations of [CII] also show evidence of rotating disk galaxies as early as (Herrera-Camus et al., 2022) and rotation in quasars as early as (Yue et al., 2021). As techniques for identifying high-redshift disk galaxies with JWST become more refined, including the first results from AI/ML techniques presented here, possible targets for gas kinematical measurements will become more prevalent. In principle, the JWST NIRSpec integral field unit spectrograph could also help reveal the kinematics of these disk candidates and confirm or refute the connection between the visual morphology and dynamical structure of these objects.
Early forming disk galaxies place important constraints on our theories of disk galaxy formation. While cosmological simulations of disk galaxy formation found only moderate success (e.g., Robertson et al., 2004; Governato et al., 2007), more recent simulations have made substantial advances in reproducing disk galaxy morphologies (e.g., Aumer et al., 2013; Marinacci et al., 2014; Wetzel et al., 2016; Grand et al., 2017; El-Badry et al., 2018; Pillepich et al., 2019; Libeskind et al., 2020). However, disk formation at early epochs still remains challenging theoretically, especially for systems with large rotational support. The large seen in some early-forming systems (e.g., Neeleman et al., 2020; Rizzo et al., 2020, 2021; Fraternali et al., 2021; Lelli et al., 2021; Tsukui & Iguchi, 2021) does not appear in the bulk population of disks simulated cosmologically (e.g., Pillepich et al., 2019), although there are recent reports of success for individual simulated galaxies (Kretschmer et al., 2022; Gurvich et al., 2022; Segovia Otero et al., 2022) and very early populations of disks at (Feng et al., 2015). The presence of these early disks may be sensitive to the galaxy mass (Gurvich et al., 2022) and the gas-rich merger history (e.g., Robertson et al., 2006). Identifying candidate early disk galaxies and characterizing their population properties will help us refine our picture for disk galaxy formation and understand the cosmological evolution of galaxy morphology. The combination of JWST and AI/ML techniques like Morpheus appears promising for identifying distant disk galaxy candidates for further study.
5 Summary
We present first results applying AI/ML analysis to JWST imagery, using the Morpheus deep-learning framework for pixel-level astronomical image analysis with the JWST Cosmic Evolution Early Release Science Survey (CEERS; Finkelstein et al., in prep.) data in the Extended Groth Strip (EGS) to identify high-redshift () disk galaxy candidates. We selected objects with dominant disk classifications determined by Morpheus () and photometric redshifts as determined by the CANDELS survey catalogs (Stefanon et al., 2017), identifying 202 high-redshift disk galaxy candidates. We then use the ProFit surface brightness distribution fitting code (Robotham et al., 2017) to infer single component (Sérsic, 1968) profiles from the JWST images. We find the high-redshift disk galaxy candidates identified by Morpheus predominantly display exponential (Sérsic ) profiles common for disk galaxy morphologies, with an average Sérsic index of . We conclude that Morpheus identifies galaxies as disks that would be so classified by traditional methods, and that Morpheus shows surprising efficacy at disk classification even as it was trained on HST images and was applied to the JWST mosaics without any modification. The identification of high-redshift disk galaxy candidates in JWST imagery suggests that disk galaxies may form early, with candidates in our sample displaying photometric redshifts as early as , and may indicate an early epoch of gas-rich disk formation through hierarchical processes in the early universe (e.g., Robertson et al., 2006). This work motivates further spectroscopic observations of high-redshift disk candidates to constrain their kinematical structure.
References
- Abadi et al. (2016) Abadi, M., Agarwal, A., Barham, P., et al. 2016, arXiv e-prints, arXiv:1603.04467. https://arxiv.org/abs/1603.04467
- Astropy Collaboration et al. (2013) Astropy Collaboration, Robitaille, T. P., Tollerud, E. J., et al. 2013, A&A, 558, A33, doi: 10.1051/0004-6361/201322068
- Astropy Collaboration et al. (2018) Astropy Collaboration, Price-Whelan, A. M., Sipőcz, B. M., et al. 2018, AJ, 156, 123, doi: 10.3847/1538-3881/aabc4f
- Aumer et al. (2013) Aumer, M., White, S. D. M., Naab, T., & Scannapieco, C. 2013, MNRAS, 434, 3142, doi: 10.1093/mnras/stt1230
- El-Badry et al. (2018) El-Badry, K., Quataert, E., Wetzel, A., et al. 2018, MNRAS, 473, 1930, doi: 10.1093/mnras/stx2482
- Feng et al. (2015) Feng, Y., Di Matteo, T., Croft, R., et al. 2015, ApJ, 808, L17, doi: 10.1088/2041-8205/808/1/L17
- Ferreira et al. (2022) Ferreira, L., Adams, N., Conselice, C. J., et al. 2022, arXiv e-prints, arXiv:2207.09428. https://arxiv.org/abs/2207.09428
- Finkelstein et al. (2022) Finkelstein, S. L., Bagley, M. B., Arrabal Haro, P., et al. 2022, arXiv e-prints, arXiv:2207.12474. https://arxiv.org/abs/2207.12474
- Förster Schreiber & Wuyts (2020) Förster Schreiber, N. M., & Wuyts, S. 2020, ARA&A, 58, 661, doi: 10.1146/annurev-astro-032620-021910
- Förster Schreiber et al. (2018) Förster Schreiber, N. M., Renzini, A., Mancini, C., et al. 2018, ApJS, 238, 21, doi: 10.3847/1538-4365/aadd49
- Fraternali et al. (2021) Fraternali, F., Karim, A., Magnelli, B., et al. 2021, A&A, 647, A194, doi: 10.1051/0004-6361/202039807
- Fudamoto et al. (2022) Fudamoto, Y., Inoue, A. K., & Sugahara, Y. 2022, arXiv e-prints, arXiv:2208.00132. https://arxiv.org/abs/2208.00132
- Genzel et al. (2006) Genzel, R., Tacconi, L. J., Eisenhauer, F., et al. 2006, Nature, 442, 786, doi: 10.1038/nature05052
- Genzel et al. (2008) Genzel, R., Burkert, A., Bouché, N., et al. 2008, ApJ, 687, 59, doi: 10.1086/591840
- Genzel et al. (2017) Genzel, R., Förster Schreiber, N. M., Übler, H., et al. 2017, Nature, 543, 397, doi: 10.1038/nature21685
- Genzel et al. (2020) Genzel, R., Price, S. H., Übler, H., et al. 2020, ApJ, 902, 98, doi: 10.3847/1538-4357/abb0ea
- Governato et al. (2007) Governato, F., Willman, B., Mayer, L., et al. 2007, MNRAS, 374, 1479, doi: 10.1111/j.1365-2966.2006.11266.x
- Grand et al. (2017) Grand, R. J. J., Gómez, F. A., Marinacci, F., et al. 2017, MNRAS, 467, 179, doi: 10.1093/mnras/stx071
- Gurvich et al. (2022) Gurvich, A. B., Stern, J., Faucher-Giguère, C.-A., et al. 2022, arXiv e-prints, arXiv:2203.04321. https://arxiv.org/abs/2203.04321
- Hausen & Robertson (2022) Hausen, R., & Robertson, B. 2022, arXiv e-prints, arXiv:2201.04714. https://arxiv.org/abs/2201.04714
- Hausen & Robertson (2020) Hausen, R., & Robertson, B. E. 2020, ApJS, 248, 20, doi: 10.3847/1538-4365/ab8868
- He et al. (2015) He, K., Zhang, X., Ren, S., & Sun, J. 2015, arXiv e-prints, arXiv:1512.03385. https://arxiv.org/abs/1512.03385
- Heintz et al. (2022) Heintz, K. E., Oesch, P. A., Aravena, M., et al. 2022, arXiv e-prints, arXiv:2206.07763. https://arxiv.org/abs/2206.07763
- Herrera-Camus et al. (2022) Herrera-Camus, R., Förster Schreiber, N. M., Price, S. H., et al. 2022, arXiv e-prints, arXiv:2203.00689. https://arxiv.org/abs/2203.00689
- Hu et al. (2020) Hu, P., Perazzi, F., Caba Heilbron, F., et al. 2020, arXiv e-prints, arXiv:2007.03815. https://arxiv.org/abs/2007.03815
- Huertas-Company et al. (2016) Huertas-Company, M., Bernardi, M., Pérez-González, P. G., et al. 2016, MNRAS, 462, 4495, doi: 10.1093/mnras/stw1866
- Jacobs et al. (2022) Jacobs, C., Glazebrook, K., Calabrò, A., et al. 2022, arXiv e-prints, arXiv:2208.06516. https://arxiv.org/abs/2208.06516
- Kartaltepe et al. (2015) Kartaltepe, J. S., Mozena, M., Kocevski, D., et al. 2015, ApJS, 221, 11, doi: 10.1088/0067-0049/221/1/11
- Kassin et al. (2012) Kassin, S. A., Weiner, B. J., Faber, S. M., et al. 2012, ApJ, 758, 106, doi: 10.1088/0004-637X/758/2/106
- Kingma & Ba (2014) Kingma, D. P., & Ba, J. 2014, ArXiv e-prints. https://arxiv.org/abs/1412.6980
- Kretschmer et al. (2022) Kretschmer, M., Dekel, A., & Teyssier, R. 2022, MNRAS, 510, 3266, doi: 10.1093/mnras/stab3648
- Law et al. (2007) Law, D. R., Steidel, C. C., Erb, D. K., et al. 2007, ApJ, 669, 929, doi: 10.1086/521786
- Law et al. (2012) Law, D. R., Steidel, C. C., Shapley, A. E., et al. 2012, ApJ, 745, 85, doi: 10.1088/0004-637X/745/1/85
- Lelli et al. (2021) Lelli, F., Di Teodoro, E. M., Fraternali, F., et al. 2021, Science, 371, 713, doi: 10.1126/science.abc1893
- Libeskind et al. (2020) Libeskind, N. I., Carlesi, E., Grand, R. J. J., et al. 2020, MNRAS, 498, 2968, doi: 10.1093/mnras/staa2541
- Marinacci et al. (2014) Marinacci, F., Pakmor, R., & Springel, V. 2014, MNRAS, 437, 1750, doi: 10.1093/mnras/stt2003
- Neeleman et al. (2020) Neeleman, M., Prochaska, J. X., Kanekar, N., & Rafelski, M. 2020, Nature, 581, 269, doi: 10.1038/s41586-020-2276-y
- Nelson et al. (2022) Nelson, E. J., Suess, K. A., Bezanson, R., et al. 2022, arXiv e-prints, arXiv:2208.01630. https://arxiv.org/abs/2208.01630
- Perrin et al. (2014) Perrin, M. D., Sivaramakrishnan, A., Lajoie, C.-P., et al. 2014, in Society of Photo-Optical Instrumentation Engineers (SPIE) Conference Series, Vol. 9143, Space Telescopes and Instrumentation 2014: Optical, Infrared, and Millimeter Wave, ed. J. Oschmann, Jacobus M., M. Clampin, G. G. Fazio, & H. A. MacEwen, 91433X, doi: 10.1117/12.2056689
- Pillepich et al. (2019) Pillepich, A., Nelson, D., Springel, V., et al. 2019, MNRAS, 490, 3196, doi: 10.1093/mnras/stz2338
- Planck Collaboration et al. (2020) Planck Collaboration, Aghanim, N., Akrami, Y., et al. 2020, A&A, 641, A6, doi: 10.1051/0004-6361/201833910
- Price et al. (2020) Price, S. H., Kriek, M., Barro, G., et al. 2020, ApJ, 894, 91, doi: 10.3847/1538-4357/ab7990
- Rigby et al. (2022) Rigby, J., Perrin, M., McElwain, M., et al. 2022, arXiv e-prints, arXiv:2207.05632. https://arxiv.org/abs/2207.05632
- Rizzo et al. (2021) Rizzo, F., Vegetti, S., Fraternali, F., Stacey, H. R., & Powell, D. 2021, MNRAS, 507, 3952, doi: 10.1093/mnras/stab2295
- Rizzo et al. (2020) Rizzo, F., Vegetti, S., Powell, D., et al. 2020, Nature, 584, 201, doi: 10.1038/s41586-020-2572-6
- Robertson et al. (2006) Robertson, B., Bullock, J. S., Cox, T. J., et al. 2006, ApJ, 645, 986, doi: 10.1086/504412
- Robertson et al. (2004) Robertson, B., Yoshida, N., Springel, V., & Hernquist, L. 2004, ApJ, 606, 32, doi: 10.1086/382871
- Robotham et al. (2017) Robotham, A. S. G., Taranu, D. S., Tobar, R., Moffett, A., & Driver, S. P. 2017, MNRAS, 466, 1513, doi: 10.1093/mnras/stw3039
- Ronneberger et al. (2015) Ronneberger, O., Fischer, P., & Brox, T. 2015, arXiv e-prints, arXiv:1505.04597. https://arxiv.org/abs/1505.04597
- Segovia Otero et al. (2022) Segovia Otero, Á., Renaud, F., & Agertz, O. 2022, arXiv e-prints, arXiv:2206.08379. https://arxiv.org/abs/2206.08379
- Sérsic (1968) Sérsic, J. L. 1968, Atlas de Galaxias Australes
- Simons et al. (2017) Simons, R. C., Kassin, S. A., Weiner, B. J., et al. 2017, ApJ, 843, 46, doi: 10.3847/1538-4357/aa740c
- Smit et al. (2018) Smit, R., Bouwens, R. J., Carniani, S., et al. 2018, Nature, 553, 178, doi: 10.1038/nature24631
- Stefanon et al. (2017) Stefanon, M., Yan, H., Mobasher, B., et al. 2017, ApJS, 229, 32, doi: 10.3847/1538-4365/aa66cb
- Stott et al. (2016) Stott, J. P., Swinbank, A. M., Johnson, H. L., et al. 2016, MNRAS, 457, 1888, doi: 10.1093/mnras/stw129
- Tiley et al. (2021) Tiley, A. L., Gillman, S., Cortese, L., et al. 2021, MNRAS, 506, 323, doi: 10.1093/mnras/stab1692
- Tsukui & Iguchi (2021) Tsukui, T., & Iguchi, S. 2021, Science, 372, 1201, doi: 10.1126/science.abe9680
- Übler et al. (2018) Übler, H., Genzel, R., Tacconi, L. J., et al. 2018, ApJ, 854, L24, doi: 10.3847/2041-8213/aaacfa
- van der Wel et al. (2014) van der Wel, A., Chang, Y.-Y., Bell, E. F., et al. 2014, ApJ, 792, L6, doi: 10.1088/2041-8205/792/1/L6
- Vaswani et al. (2017) Vaswani, A., Shazeer, N., Parmar, N., et al. 2017, arXiv e-prints, arXiv:1706.03762. https://arxiv.org/abs/1706.03762
- Wang et al. (2017) Wang, X., Girshick, R., Gupta, A., & He, K. 2017, arXiv e-prints, arXiv:1711.07971. https://arxiv.org/abs/1711.07971
- Wells et al. (1981) Wells, D. C., Greisen, E. W., & Harten, R. H. 1981, A&AS, 44, 363
- Wetzel et al. (2016) Wetzel, A. R., Hopkins, P. F., Kim, J.-h., et al. 2016, ApJ, 827, L23, doi: 10.3847/2041-8205/827/2/L23
- Wisnioski et al. (2019) Wisnioski, E., Förster Schreiber, N. M., Fossati, M., et al. 2019, ApJ, 886, 124, doi: 10.3847/1538-4357/ab4db8
- Wu et al. (2022) Wu, Y., Cai, Z., Sun, F., et al. 2022, arXiv e-prints, arXiv:2208.08473. https://arxiv.org/abs/2208.08473
- Wuyts et al. (2016) Wuyts, S., Förster Schreiber, N. M., Wisnioski, E., et al. 2016, ApJ, 831, 149, doi: 10.3847/0004-637X/831/2/149
- Yue et al. (2021) Yue, M., Yang, J., Fan, X., et al. 2021, ApJ, 917, 99, doi: 10.3847/1538-4357/ac0af4
- Zhang et al. (2019) Zhang, H., Primack, J. R., Faber, S. M., et al. 2019, MNRAS, 484, 5170, doi: 10.1093/mnras/stz339