Mechanisms of adsorbing hydrogen gas on metal decorated graphene
Abstract
Hydrogen is a key player in global strategies to reduce greenhouse gas emissions. In order to make hydrogen a widely-used fuel, we require more efficient methods of storing it than the current standard of pressurized cylinders. An alternative method is to adsorb H2 in a material and avoid the use of high pressures. Among many potential materials, layered materials such as graphene present a practical advantage as they are lightweight. However, graphene and other 2D materials typically bind H2 too weakly to store it at the typical operating conditions of a hydrogen fuel cell. Modifying the material, for example by decorating graphene with adatoms, can strengthen the adsorption energy of H2 molecules, but the underlying mechanisms are still not well understood. In this work, we systematically screen alkali and alkaline earth metal decorated graphene sheets for the adsorption of hydrogen gas from first principles, and focus on the mechanisms of binding. We show that there are three mechanisms of adsorption on metal decorated graphene and each leads to distinctly different hydrogen adsorption structures. The three mechanisms can be described as weak van der Waals physisorption, metal adatom facilitated polarization, and Kubas adsorption. Among these mechanisms, we find that Kubas adsorption is easily perturbed by an external electric field, providing a way to tune H2 adsorption.
I Introduction
There is an urgent need to reduce the use of fossil fuels and develop alternative, less polluting, methods of energy production. To this end, H2 is long-standing potential candidate fuel.Allendorf et al. (2018) There is an energy cost to producing H2 in the first place, but H2 molecules provide almost three times the energy density by weight as fossil fuelsArmaroli and Balzani (2011) and burning H2 produces water with no additional harmful pollutants. In addition to burning, hydrogen can be combined with oxygen more efficiently in fuel cells, producing electricity and still only water as waste. At present, H2 is stored as pressurised gas and more efficient H2 storage materials are needed to propel this fuel into wide-scale use.
A promising method of storing hydrogen fuel is to physisorb H2 molecules in a lightweight material. Cycling weakly adsorbed hydrogen gas through a material is expected to have minimal degradation effect on the storage material as H2 molecules remain intact. Other adsorption mechanisms of storage, such as the spillover method, rely on H2 dissociating and forming covalent bonds with the storage material which makes the material more susceptible to deformation. In addition, weakly adsorbed hydrogen molecules require less energy to be released from a material relative to chemisorbed hydrogen atoms. The window for ideal H2 adsorption energy can be estimated in a heuristic approach and considering the typical working temperature and pressure of fuel cells. The pressure (), temperature (), and the adsorption energy (), can be approximately related according to:
| (1) |
where () is the Boltzmann constant, is Planck’s constant, is the mass of H2, is the moment of inertia, is the harmonic frequency of vibration of the H2 molecule with respect to the substrate. For a full account of how Eq. 1 is used and the approximations we make, see the Appendix.
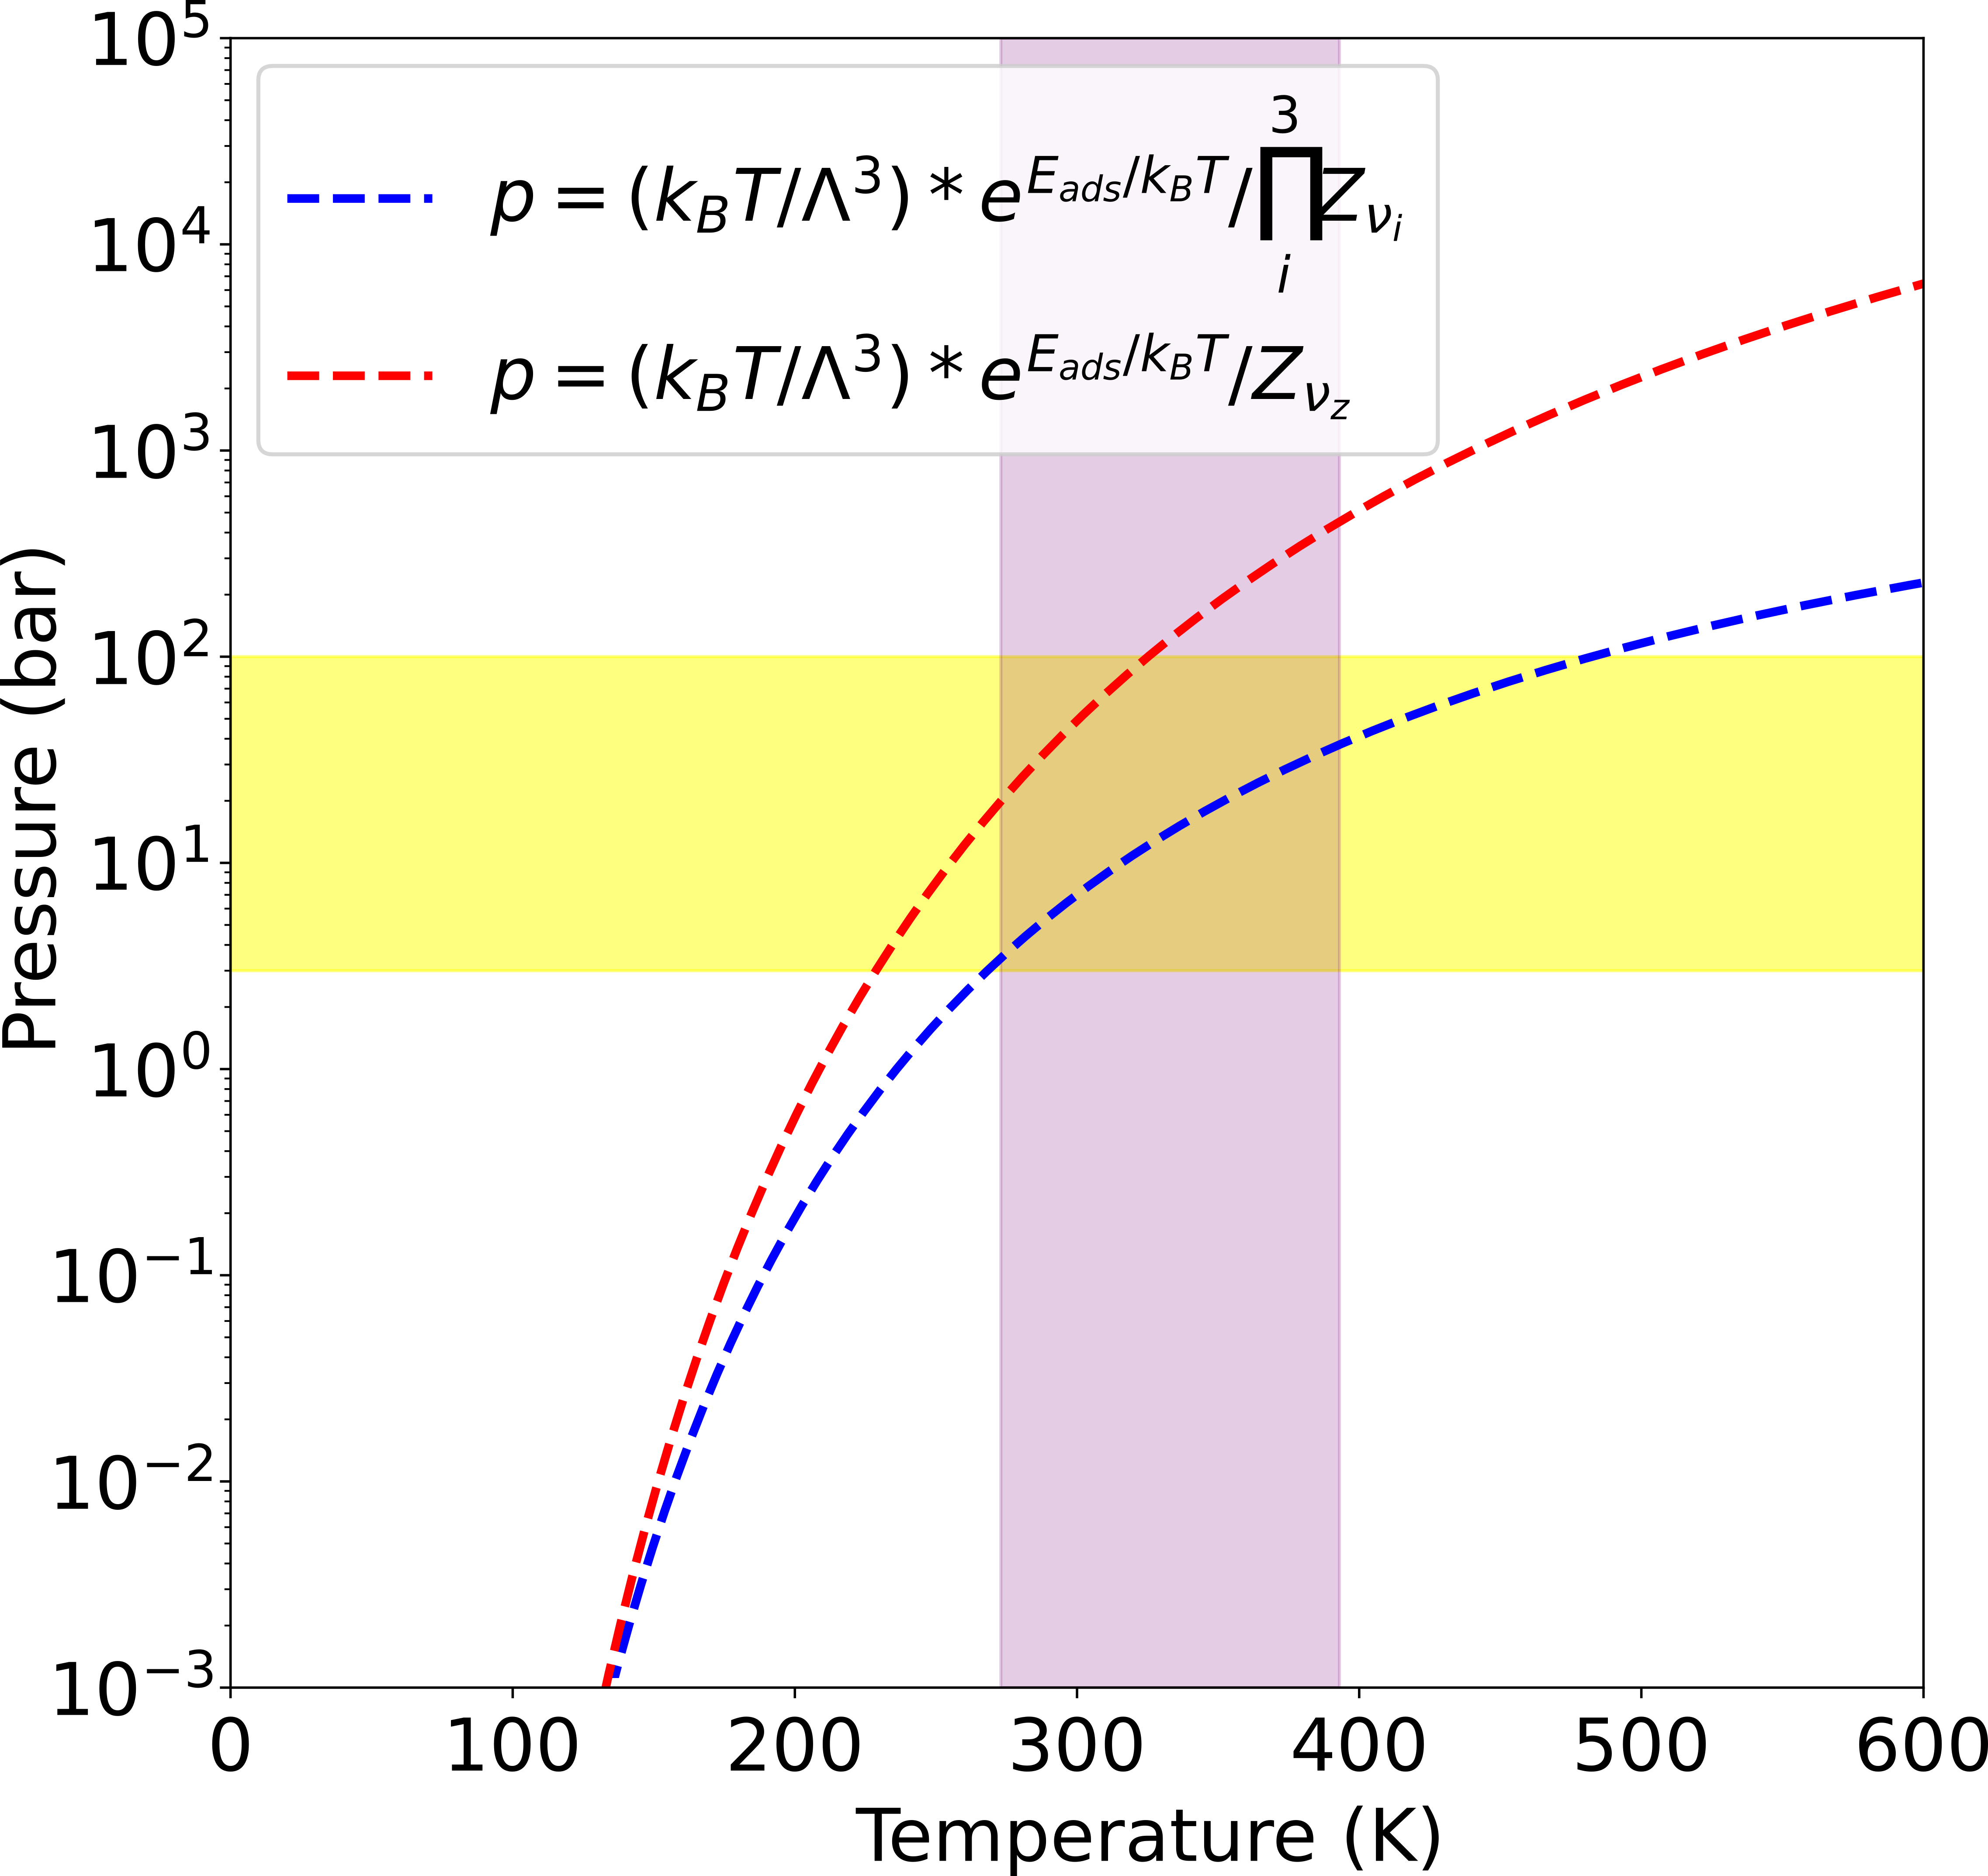
Polymer electrolyte membrane (PEM) fuel cells have been developed for a range of operating temperatures, with high temperature PEM fuel cells functioning above 370 K.Ogungbemi et al. (2021); Salam et al. (2020) Taking into account intermediate and high temperature PEM fuel cells, we consider working temperatures of 270-390 K in this work. The typical operating pressure of a PEM fuel cell is bars of H2 pressureOgungbemi et al. (2021) which means that the storage material must have a higher H2 vapor pressure to readily release H2 to the fuel cell. In addition, an upper-bound of 100 bar has been proposed for the H2 vapor pressure to avoid similar technological challenges as containing a highly pressurized gas Ahmed et al. (2019). Under such conditions, it is generally accepted that the free energy of H2 adsorption in a material is to meV per H2 molecule as can be seen from Fig. 1. The challenge of finding a material that binds H2 suitably is also exacerbated by additional factors such as the weight and volume of the storage material.Armaroli and Balzani (2011); Allendorf et al. (2018); Lai et al. (2019) Evidently, lighter and low-volume materials are required for practical and energy efficient fuel storage for mobile applications.
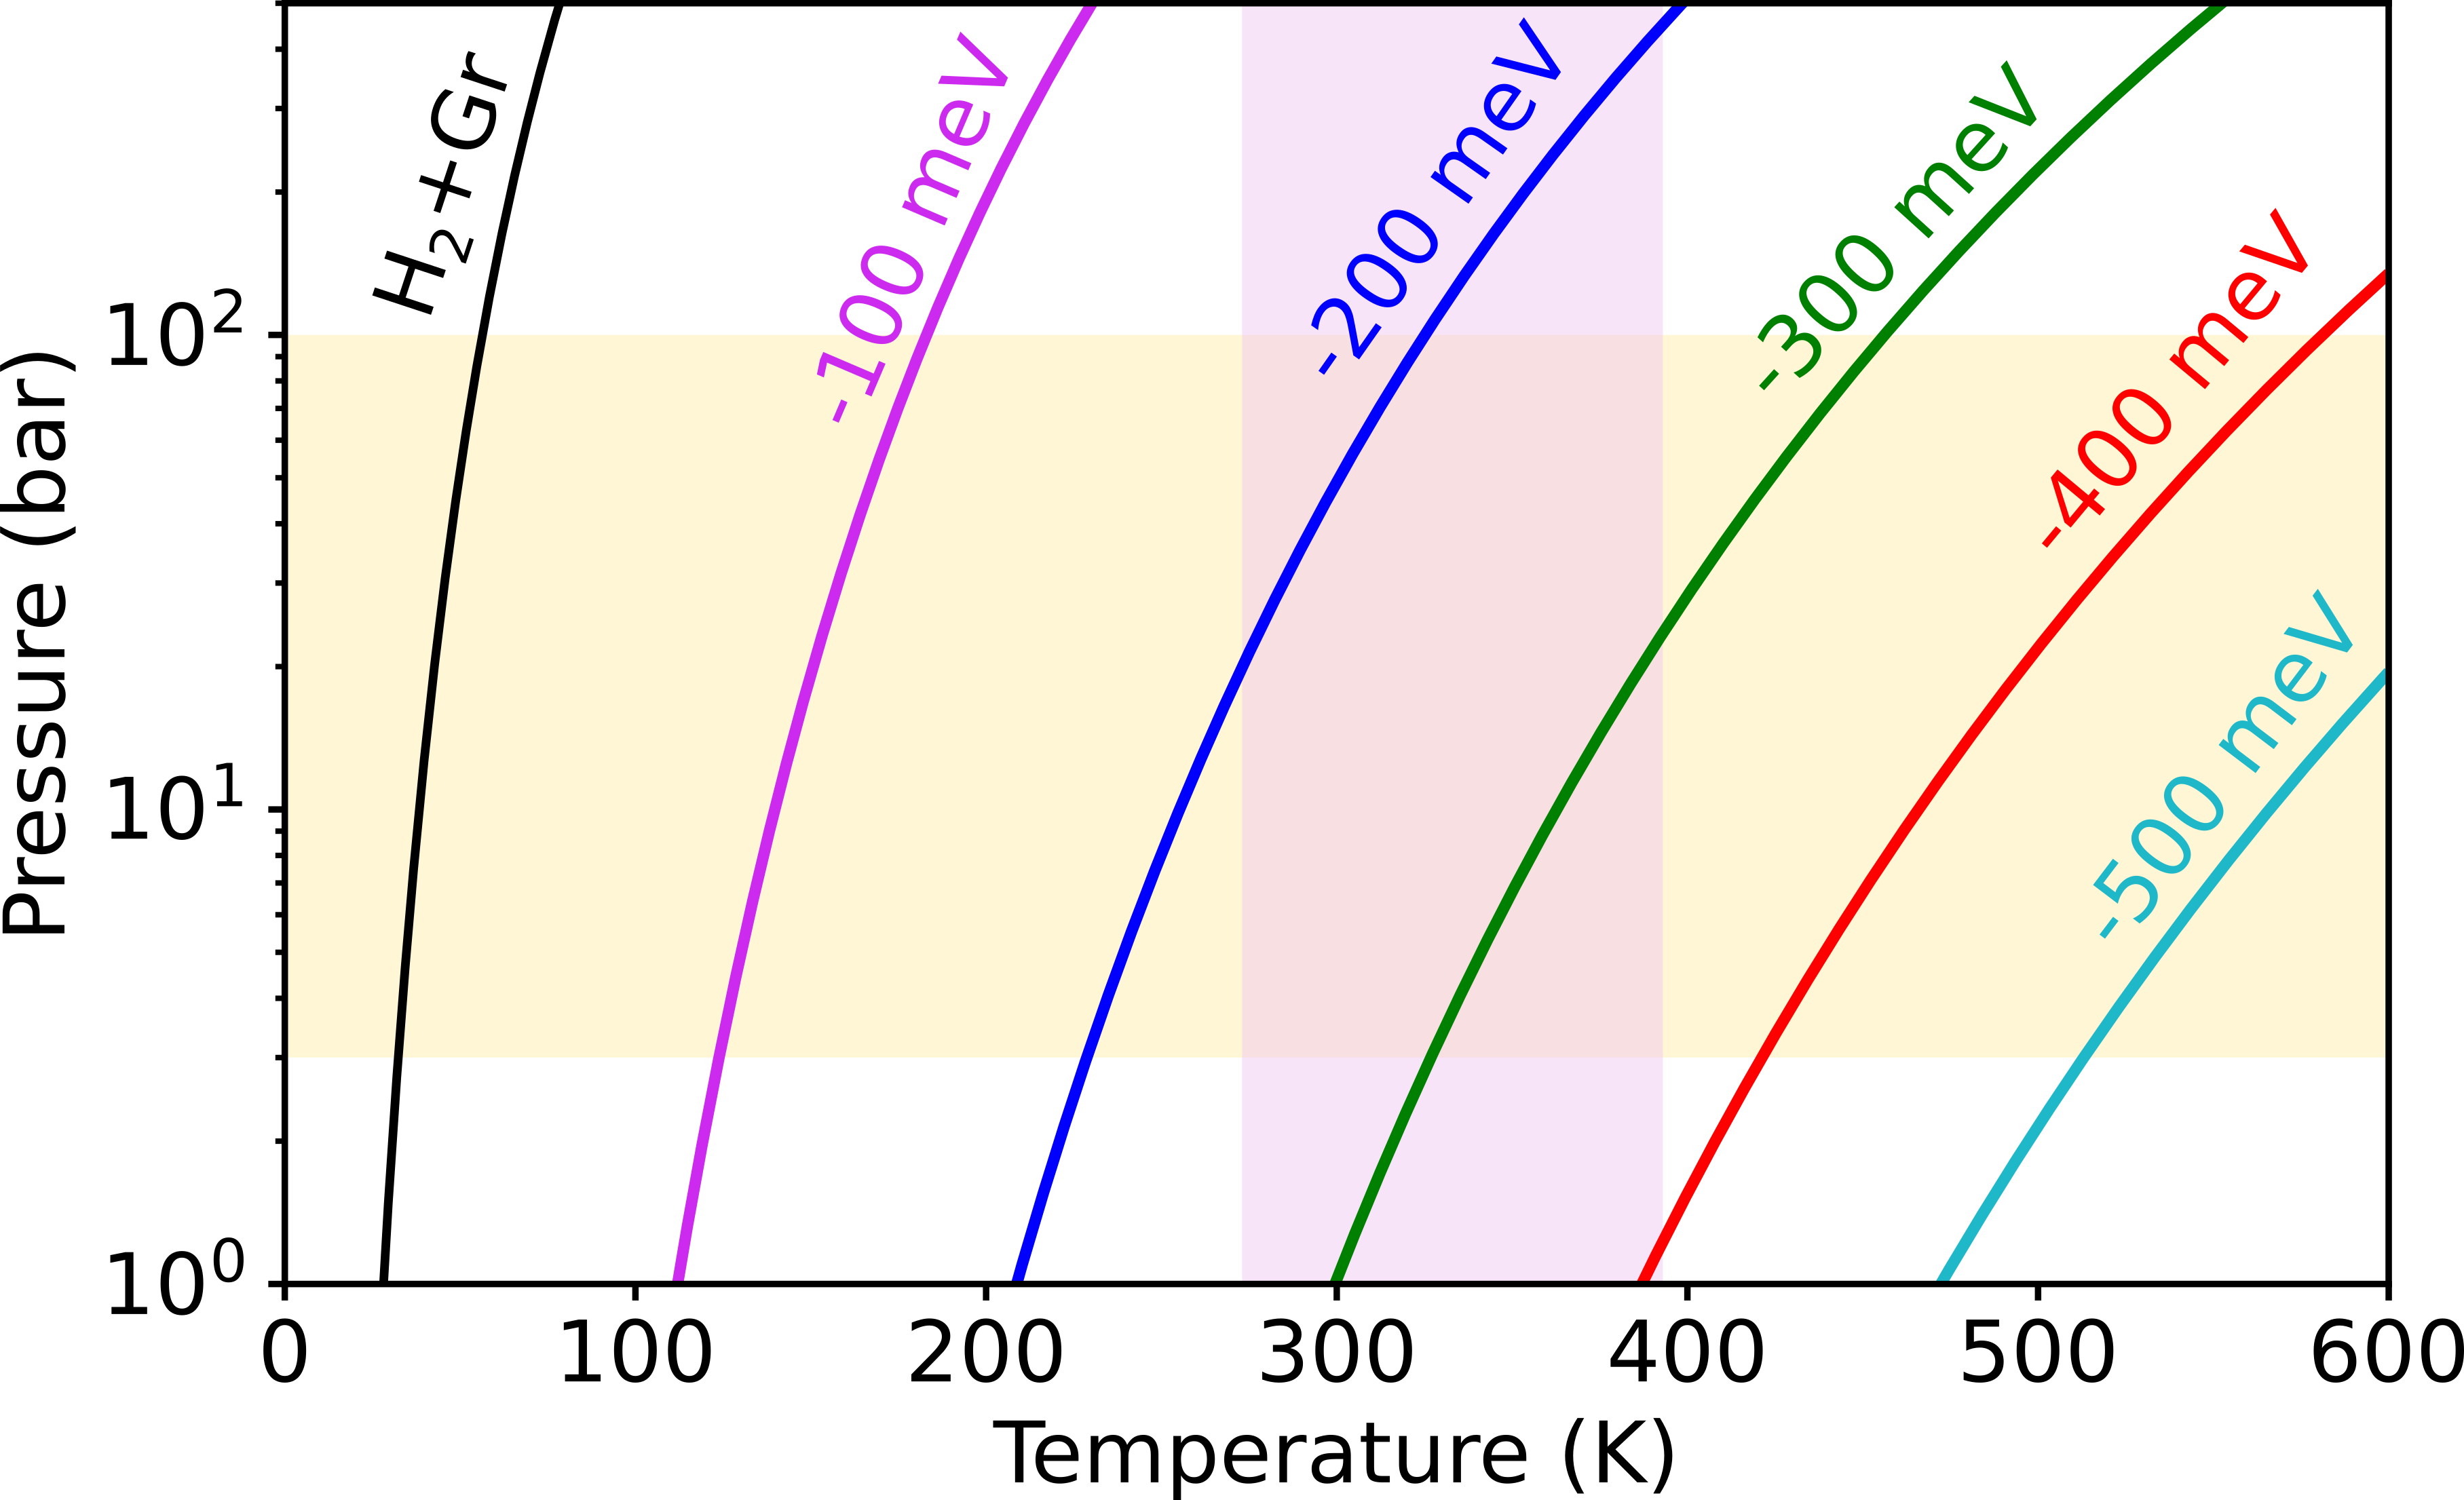
There are various promising materials for H2 storage and among them, we are interested in layered materials, such as graphene, as they are lightweight and are able to adsorb molecular hydrogen. However, the adsorption energy of H2 on pristine graphene is predicted to be less than meVAl-Hamdani, Alfè, and Michaelides (2017) which is too weak for viable hydrogen storage (see Fig. 1). Structural defects and decoration by adatoms is known to enhance the adsorption energy of molecules on grapheneSpyrou, Gournis, and Rudolf (2013) and there are countless combinations that can be considered. However, it is experimentally challenging to produce well controlled and characterized graphene with defects or adatoms and therefore it is difficult to ascertain the H2 storage capacity of such potentially useful materials.
To date, there have been indications that decorating graphene with alkali and alkaline earth metal adatoms facilitates H2 adsorption,Wong et al. (2014); Reunchan and Jhi (2011); Wen et al. (2017); Amaniseyed and Tavangar (2019); Sun et al. (2010); Beheshti, Nojeh, and Servati (2011); Ataca, Aktürk, and Ciraci (2009); Zhou et al. (2012) potentially yielding adequate H2 capacities by weight. However, experimental information is scarce and computational efforts to understand H2 adsorption on metal decorated graphene are difficult to unify. For example, in different studies H2 adsorption energies have been predicted using different density functional approximations preventing us from drawing reliable trends. In addition, the structure of H2 molecules adsorbed around different metal adatoms on graphene has not received systematic focus and stands to be better understood.
Among alkali and alkaline earth metals, Ca decorated graphene is one of the most studied systems.Ataca, Aktürk, and Ciraci (2009); Beheshti, Nojeh, and Servati (2011); Wong et al. (2014); Wen et al. (2017); Reunchan and Jhi (2011); Cha, Choi, and Park (2011) This is partly due to favorable H2 adsorption energies being predicted on this material as well as the relatively low cohesive energy of Ca, which is expected to prevent agglomeration on graphene. Specifically, Ataca et al. suggested over a decade ago that Ca adatoms facilitate the adsorption of H2 molecules via Kubas-type binding.Ataca, Aktürk, and Ciraci (2009) This mechanism involves stabilizing the state of Ca relative to and donating electron density from into the H2 state.Kubas (2001) Since then, a number of wavefunction based methods have been used to understand the Ca+-4H2 cluster (without a graphene substrate) and deduce whether a Ca adatom is able to bind H2 using the Kubas mechanism.Cha et al. (2009); Bajdich, Reboredo, and Kent (2010); Sun et al. (2010); Cha, Choi, and Park (2011); Park et al. (2012); Purwanto et al. (2011); Ohk, Kim, and Jung (2010) The general conclusion from these works is that Ca is unlikely to bind H2 using a Kubas-type binding and hence, cast doubt on the accuracy of density functional theory (DFT) approximations. However, graphene has been shown to affect adsorption and importantly, some metal adatoms (including Ca) make the adatom-graphene system metallic. Therefore, it is not straightforward to infer the nature of interaction on graphene from predictions on gas phase clusters.
Alongside Ca, other alkali and alkaline earth metals on graphene have been considered for H2 adsorption.Zhou et al. (2012); Amaniseyed and Tavangar (2019); Reunchan and Jhi (2011); Wen et al. (2017); Wong et al. (2014) In brief, previous works have focused on assessing the adsorption strength of H2 on a given material and in some cases methods without dispersion were used to predict adsorption energies.Reunchan and Jhi (2011); Zhou et al. (2012) We seek to build a better understanding of the mechanisms underpinning H2 adsorption on different alkali and alkaline earth metal adatoms on graphene. In this work, we systematically compute H2 adsorption on alkali and alkaline earth metal decorated graphene and draw mechanistic insights. We outline our computational setup and methods in Section II. In Section III we report the results of screening 1 to 7 H2 molecules per metal adatom on graphene. We refine and analyze the adsorption of H2 for a subset of systems in Section IV. In doing so, we elucidate the mechanisms of adsorption and find that they can be summarized in three physically distinct categories. In Section V, we report the effect of applying an external electric field on the H2 interaction with the substrate and find that it depends strongly on the binding mechanism. We conclude in Section VI with a brief discussion of the results.
II Methods
The initial screening of adsorption energies was performed with CP2K v.7.1Kühne et al. (2020); Vandevondele et al. (2005) and Goedecker-Teter-Hutter pseudopotentialsGoedecker and Teter (1996); Krack (2005) in combination with DZVP-MOLOPT-SR-GTH basis sets.VandeVondele and Hutter (2007) A maximum plane-wave cut-off of 300 Ry was used across 5 grids, with a relative cut-off of 30 Ry. Our CP2K calculations were spin-polarised and performed at -point only for a () unit cell of graphene. The geometries were optimized with the BFGS method until the maximum force was less than 5 Ha . All parameters of the CP2K geometry optimizations can be seen in the example input in the SM. The Perdew-Burke-Ernzerhof (PBE) exchange-correlation functionalPerdew, Burke, and Ernzerhof (1996) was used in combination with Grimme’s D3 dispersion methodGrimme et al. (2010) with zero-type damping and three-body Axilrod-Teller-Muto terms included, to account for van der Waals interactions. It is known that the choice of exchange-correlation functional has a notable impact on the H2 adsorption energy on graphene-type surfaces.Al-Hamdani, Alfè, and Michaelides (2017); Wong et al. (2014) Particularly in the case of physisorption, long-range dispersion interactions are expected to play an important role and therefore it is necessary to use a dispersion method. However, in the absence of experimental reference adsorption energies for the systems we are considering, it is difficult to ascertain which dispersion method yields the most accurate results. In general, dispersion methods have been shown to predict consistent structures and relative energies.Bučko et al. (2010); Carter and Rohl (2014); Bedolla et al. (2014); Klimeš and Michaelides (2012); Carrasco, Klimeš, and Michaelides (2013); Rosa, Corni, and Felice (2014) Absolute adsorption energies, on the other hand, can vary considerably among different density approximations. Previously, we established diffusion Monte Carlo (DMC) reference adsorption energies for H2 inside and outside a carbon nanotube (CNT) and found that add-on dispersion methods are more accurate than seamless density-dependent dispersion functionals for the adsorption of H2 inside a carbon nanotube.Al-Hamdani, Alfè, and Michaelides (2017) Add-on dispersion methods include the D3,Grimme et al. (2010) D4,Caldeweyher, Bannwarth, and Grimme (2017) and many-body-dispersion (MBD)Ambrosetti et al. (2014); Tkatchenko et al. (2012) methods. These partially account for beyond two-body dispersion interactions which can play an important role in graphene-like materials.Gobre and Tkatchenko (2013) In our work, we combine results from two DFT packages and therefore, to be consistent, we use PBE+D3 as it is implemented in CP2K and VASP. Note that PBE+MBD and PBE+D3 both predict an H2 adsorption energy of meV on pristine graphene, while DMC yields meV.Al-Hamdani, Alfè, and Michaelides (2017)
Metal decorated graphene (M@Gr) was modelled using a () unit cell of graphene with unit cell parameters optimized using PBE+D3. A single metal atom (M) was placed at the hollow site and fully optimized for Li, Be, Na, Mg, K, Ca, Rb, Sr, Cs, and Ba. H2 molecules were placed upright relative to graphene and surrounding the metal atom in every initial structure. An inter-layer spacing of 20 Å is applied along the -axis between graphene sheets and dipole correctionsNeugebauer and Scheffler (1992); Makov and Payne (1995) along -direction also computed. Up to 7 H2 molecules were fully optimized on each M@Gr system, totalling 70 systems, with all atoms in the cell allowed to relax. We report the results of this screening in Section III.
For a better understanding of the binding mechanisms and to assess the quality of the initial screening, we performed fine-grained optimizations of the resulting geometries from the screening. We used VASP v.5.4.4Kresse and Hafner (1993, 1994); Kresse and Furthmüller (1996a, b) with standard PAW potentials and a 500 eV plane-wave cut-off. Since the neutral metal atoms are easily ionized, potentials with explicit semi-core states were used for all metals. Na has the highest energy core states amongst the metal atoms we considered and we found that the interaction energy of 4H2 on Na@Gr is converged with a 500 eV plane-wave cut-off to within 2 meV. In addition, the decoration of graphene with metal atoms makes the system metallic and hence we used a dense k-point mesh of centred on . We found the interaction energy of 4H2 on Ca@Gr is converged within 1 meV per H2 using a k-point mesh of and therefore we expect an even denser mesh to be sufficient for all the systems we considered. The fine-grained geometry relaxations for 3-5 H2 molecules on each substrate were converged with residual forces less than 0.01 eV Å-1. Densities of states were obtained using a k-point mesh and the SUMO codeGanose, Jackson, and Scanlon (2018) was used in post-processing the data. For the application of external electric force fields in Section V, we used a sawtooth potential as implemented in VASP and applied the field along the z-direction in the unit cell, i.e. perpendicular to the graphene sheet. We also performed geometry optimizations of 4H2 adsorbed on Ca@Gr at two electric fields (0.2 V Å-1 and V Å-1) using a k-point mesh of .
III Screening H2 adsorption on metal decorated graphene
Decorating graphene with single metal atoms has previously been found to strengthen the adsorption of H2 molecules for some metals such as Ca and Li.Ataca, Aktürk, and Ciraci (2009); Zhou et al. (2012) In some cases, such as Mg@Gr, the adsorption of H2 remains weak.Amaniseyed and Tavangar (2019) We focus specifically on alkali and alkaline earth metals, from Li to Ba, with the aim to understand the mechanisms underpinning the interactions. The indication from previous works is that dispersion interactions contribute significantly to the adsorption energyWong et al. (2017) and H2 is bound too weakly to be useful for hydrogen storage.Singh and Yakobson (2012); Spyrou, Gournis, and Rudolf (2013) However, it appears from the range of adsorption energies reported, that it is difficult to establish consistent adsorption energies from DFT approximations.Singh and Yakobson (2012) Moreover, a systematic analysis of the adsorption geometries is missing from our current understanding and we aim to address that here. An approximate overview of the relative strength of H2 adsorption as the number of H2 molecules are increased is given by the crude screening in this section. The results of the rapid DFT screening of H2 adsorption energies on M@Gr is shown in Fig. 2. The adsorption energy () is defined as:
| (2) |
where is the total energy of H2 molecules adsorbed on M@Gr, is the total energy of the fully relaxed M@Gr substrate, is the total energy of the gas phase relaxed H2 molecule, and is the number of H2 molecules adsorbed.
Screening calculations were performed at the -point only and using atom-centered basis sets without correcting for basis set superposition error. As a result, the PBE+D3 adsorption energies in Fig. 2 are likely to be overestimated. For reliable PBE+D3 adsorption energies see Table 1 where we report adsorption details for systems with 3-5 H2 molecules as well as the adsorption energy of metal adatoms on graphene.
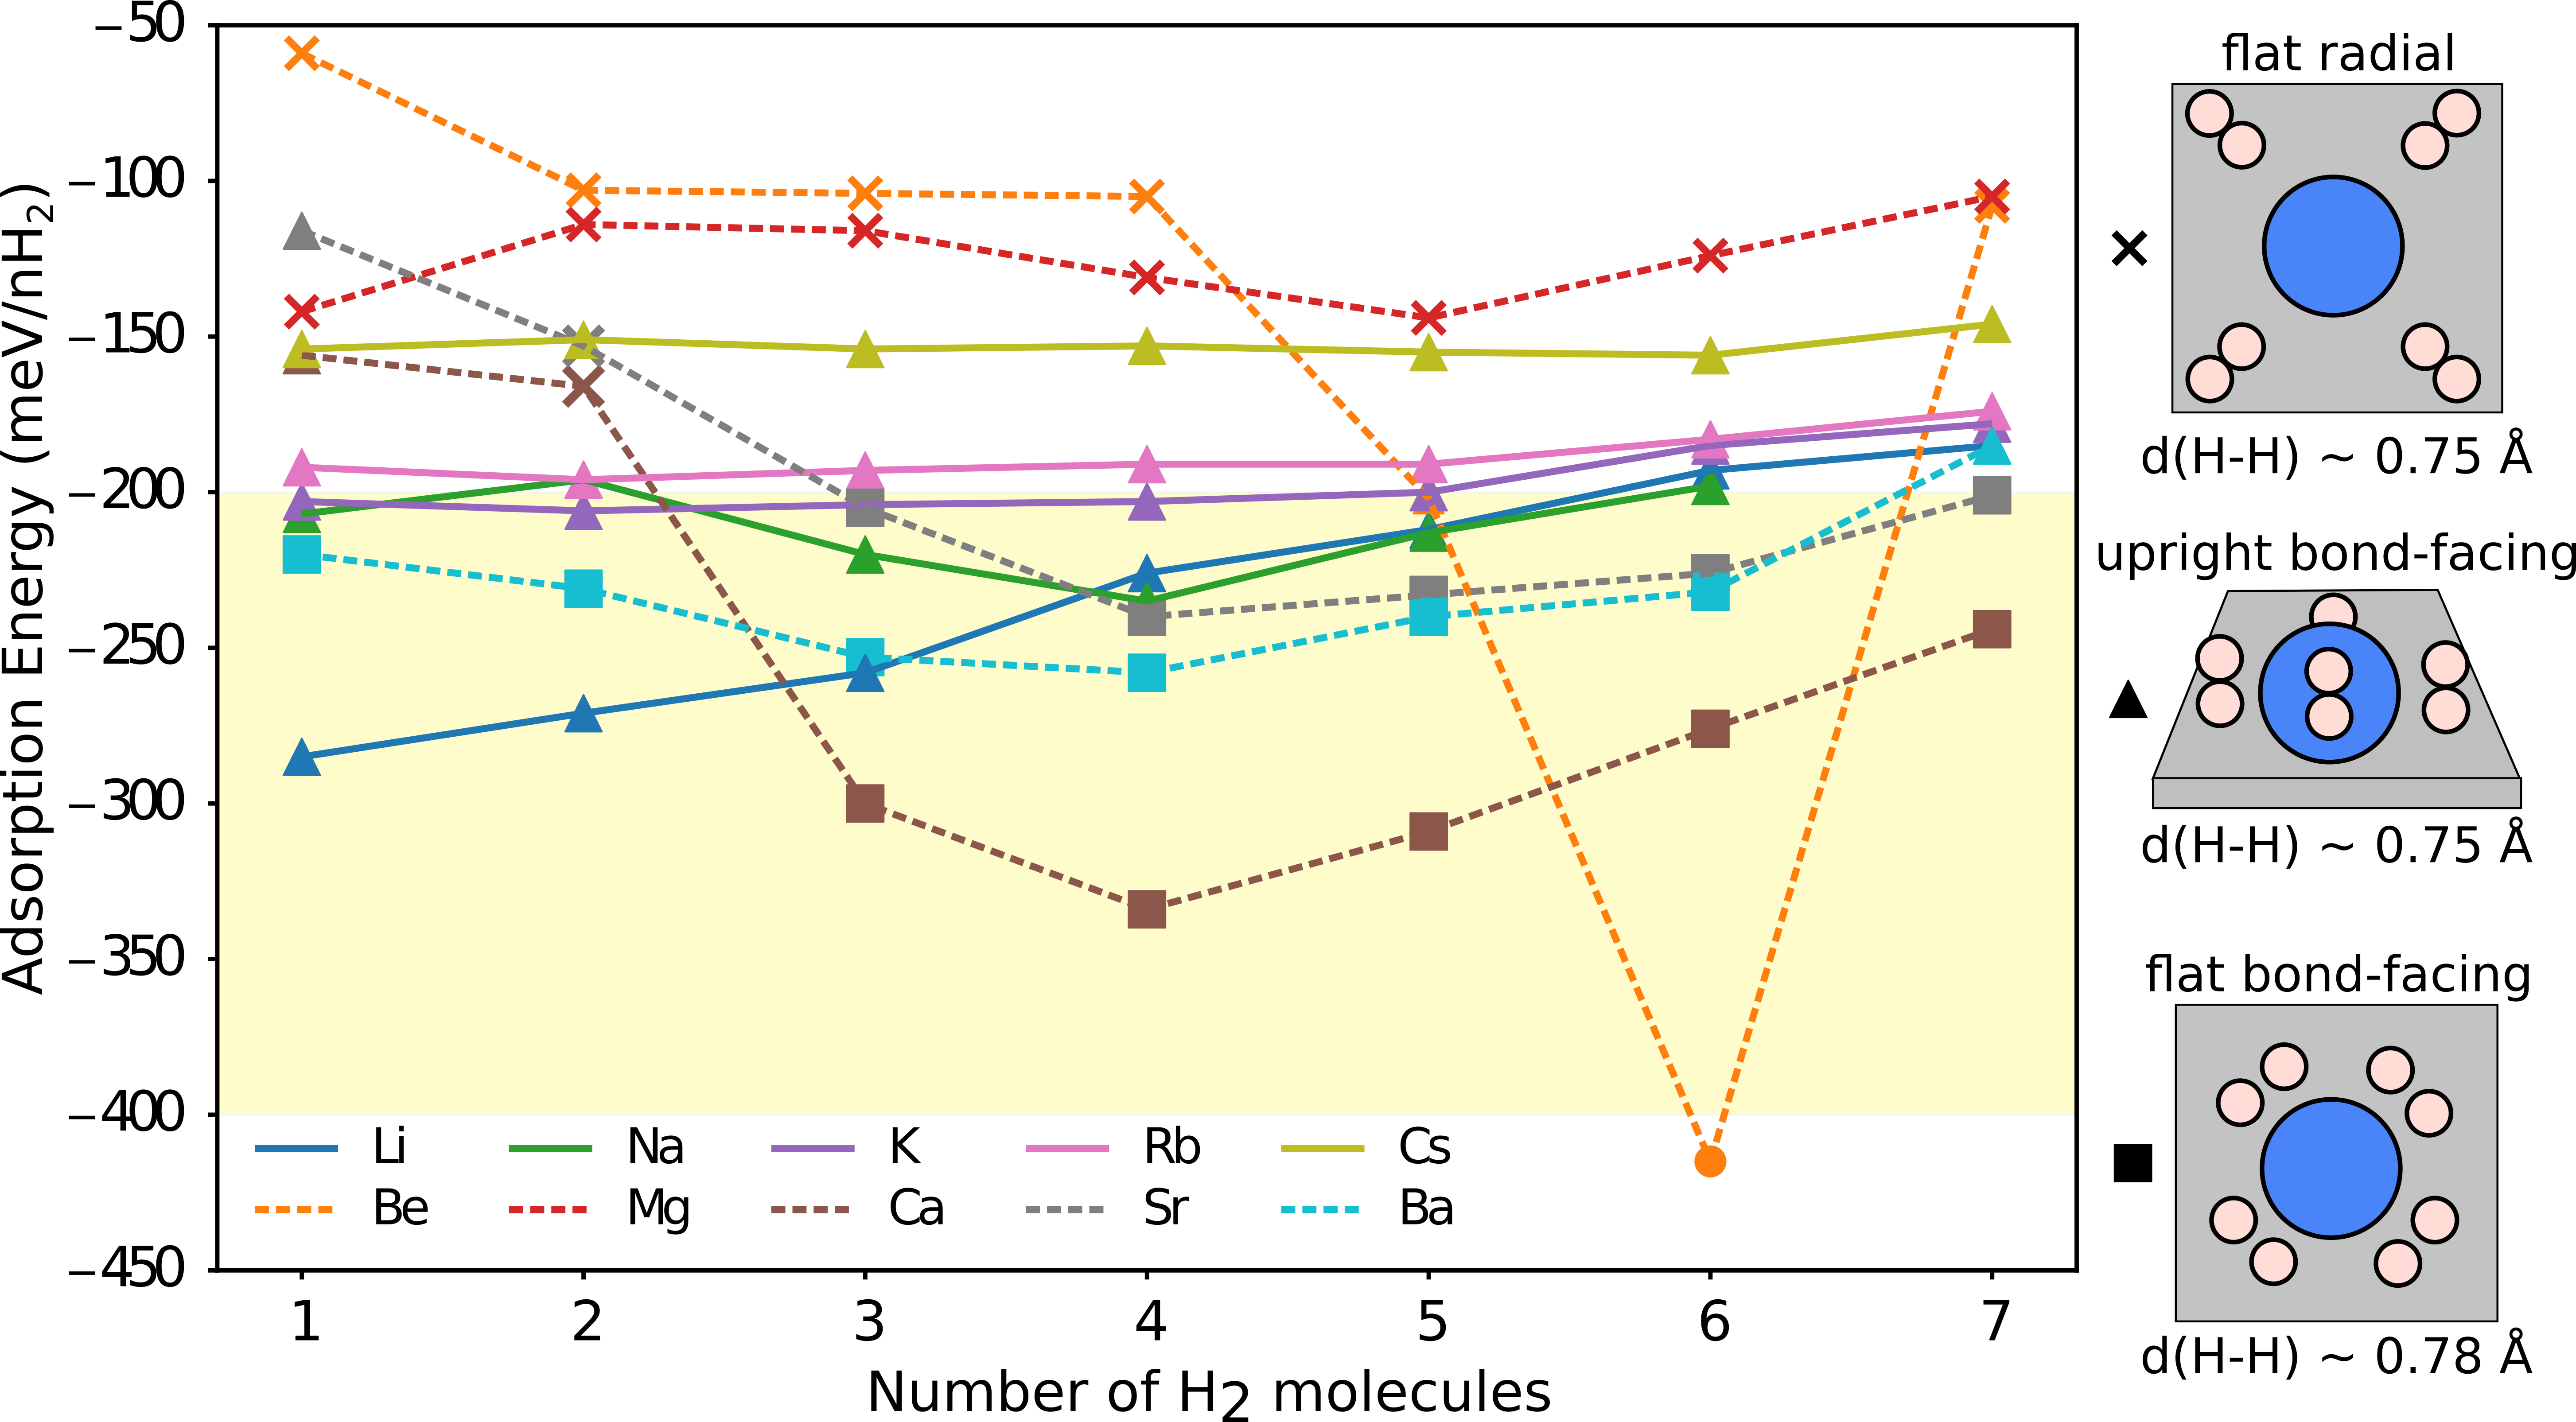
The geometry optimization of H2 molecules on M@Gr broadly yields three orientations of H2 molecules, as can be seen from Fig. 2. There are several features to note from these preliminary adsorption profiles. First, the weakest adsorption profile is seen for Be@Gr and Mg@Gr, where the H2 molecules prefer to be flat on the graphene sheet and pointing radially to the metal atom. An example of this flat radial configuration is illustrated in Fig. 2. This configuration suggests the main contribution to adsorption is between H2 and graphene, with an additional weak interaction with the metal adatom. Note that Be has a degeneracy in its valence states that is known to make it reactive with hydrogen, forming Be–H bonds. This occurs in one of the geometry optimizations, when 6 H2 molecules are placed near Be, leading to the dissociative adsorption of a H2 molecule. Therefore, Mg and Be are not likely to be suitable adatoms on graphene for H2 storage via weak adsorption. Second, all alkali M@Gr substrates adsorb H2 in the upright bond-facing (BF) configuration and the adsorption energy profile is near-linear with increasing number of molecules. For K, Rb, and Cs, the adsorption profile is particularly flat, varying by less than 30 meV in the adsorption energy per H2 molecule, from 1 to 7 H2 molecules. Adsorption is strongest among alkali metals for Li@Gr with up to 3 H2 molecules. However the H2 adsorption energy on Li@Gr shows a steady weakening with increasing number of H2 molecules. This is due to H2 molecules not fitting around the small Li adatom and therefore spreading further away on the surface. In the case of Na@Gr, there is a small meV variation in the H2 adsorption energy, with the most favorable binding occurring at 4H2 molecules. However, the configurations remain upright BF across the profile. We can see from Fig. 2 that another configuration of H2 (flat BF) results on Ca, Sr, and Ba, decorated graphene. The flat BF configuration is not exclusive on these substrates and both upright BF and flat radial configurations can be seen for 1, 2, and 7 H2 adsorbed molecules. Indeed, these heavier alkaline earth elements exhibit the most variation in their H2 adsorption profiles, varying by more than 70 meV with respect to the number of H2 molecules adsorbed. However, the strongest adsorption for graphene decorated with Ca, Sr, and Ba, is consistently predicted at 4 H2 molecules in the flat BF orientation. In addition, the flat BF configurations of H2 have a distinct H–H bond length of 0.78 Å, i.e. a elongation with respect to the equilibrium bond length. On the other hand, in the flat radial and upright BF configurations the H–H bond length stays close to equilibrium (0.75 Å). The longer bond length for the flat BF configuration of H2 is therefore indicative of a different interaction mechanism that involves the state of the H2 molecule. This is known as the Kubas type bonding interaction and it has been discussed in previous works that considered Ca adatoms.Singh and Yakobson (2012); Ataca, Aktürk, and Ciraci (2009); Cha, Choi, and Park (2011); Sun et al. (2010) Here, we see that this configuration manifests more generally when graphene is decorated with alkaline earth metals that have available -states, such as Sr and Ba. We also describe this mechanism in more detail in Section IV.
Our screening of H2 adsorption on alkali and alkaline earth metal decorated graphene suggests that the strongest non-dissociative adsorption of H2 for more than 3 molecules per adatom, occurs on Ca, Sr, and Ba decorated graphene. For less than 3 H2 molecules per adatom, Li@Gr is predicted to bind H2 strongly. However, adsorption energies in this screening are only approximate as loose technical parameters have been used and the PBE+D3 method is also a source of uncertainty. In the next section we report adsorption energies from well-converged geometry optimizations for a subset of systems with PBE+D3.
IV Mechanism of adsorption and the role of graphene
To understand the electronic structure mechanisms underlying the three distinct configurations of H2 adsorption we find, we performed well-converged geometry relaxations on all adatom systems with 3-5 H2 molecules from Section III. The computational details are given in Section II and we note that the main improvement is in the k-mesh density (using a grid on a unit cell of graphene). We have also performed calculations with alternative starting geometries to see if flat BF configurations can be stabilized over upright BF on alkali metals, and vice versa on alkaline earth metals. We find that the orientation of H2 molecules predicted in Section III is consistent and that the graphene-adatom distances change by less than or 0.16 Å . Similarly, the H2-adatom distance changes by, at most, 10 or Å (more details provided in the SM).
The PBE+D3 H2 adsorption energies on M@Gr substrates and metal adatom adsorption energies on graphene are reported for well-converged optimized structures in Table 1. The PBE+D3 metal adatom adsorption energies () show that Mg and Be adsorb weaker than meV on graphene, while other metal adatoms adsorb by over meV. The average H2-metal adatom and graphene-metal adatom separation distances are also reported in Table 1 for each metal considered. We can see that stronger H2 adsorption is accompanied by shorter H2-metal adatom separation distances and that Ca and Ba adatoms best facilitate the adsorption of H2 molecules with adsorption energies of up to and meV per H2 molecule, respectively. It is evident that the screening in Section III led to overestimated adsorption energies, but we note that the most favorable adsorption energy predicted here with PBE+D3 is within 10 meV of the range that is expected to be useful for H2 storage.
Forming an understanding of the H2 adsorption mechanisms under idealized conditions may guide experiments towards realizing these systems and provides a basis for more accurate theoretical work. It is important to note, however, that the accuracy of PBE+D3 is not established for predicting M@Gr systems as there is no experimental or theoretical reference information. What is more, the zero-point energy contributions to the adsorption energy have not been taken into account and diffusion of molecules and atoms at the surface of graphene at finite temperatures is also likely to be an important factor in the ultimate use of such a material for H2 storage. To provide some indication of the stability of the materials predicted in this work, we computed the dissociation of H2 on Ca@Gr – as it is the material with the strongest H2 adsorption among the systems considered. H2 dissociating on Ca@Gr would indicate storage via the spillover effect instead and we gauge the likelihood of this by fully relaxing 2H+Ca@Gr, with H atoms chemisorbed on graphene in the vicinity of Ca for two configurations. The fully relaxed structures and computational details can be found in the SM. We find that 2H+Ca@Gr is eV less stable than H2+Ca@Gr, suggesting that intact H2 is thermodynamically stable on Ca@Gr. These calculations provide preliminary indications, but further work is needed to cement our predictions.
| Adatom (M) | (eV) | (Å) | (eV) | (eV) | (eV) | (Å) | (Å) |
| Li | 1.704 | 0.755 | 2.348 | ||||
| Na | 2.189 | 0.756 | 2.516 | ||||
| K | 2.571 | 0.754 | 2.964 | ||||
| Rb | 2.730 | 0.754 | 3.209 | ||||
| Cs | 2.903 | 0.753 | 3.435 | ||||
| Be | 3.218 | – | – | 0.754 | 2.875 | ||
| Mg | 3.322 | – | – | 0.754 | 3.180 | ||
| Ca | 2.314 | 0.784 | 2.287 | ||||
| Sr | 2.497 | 0.779 | 2.478 | ||||
| Ba | 2.577 | 0.771 | 2.722 |
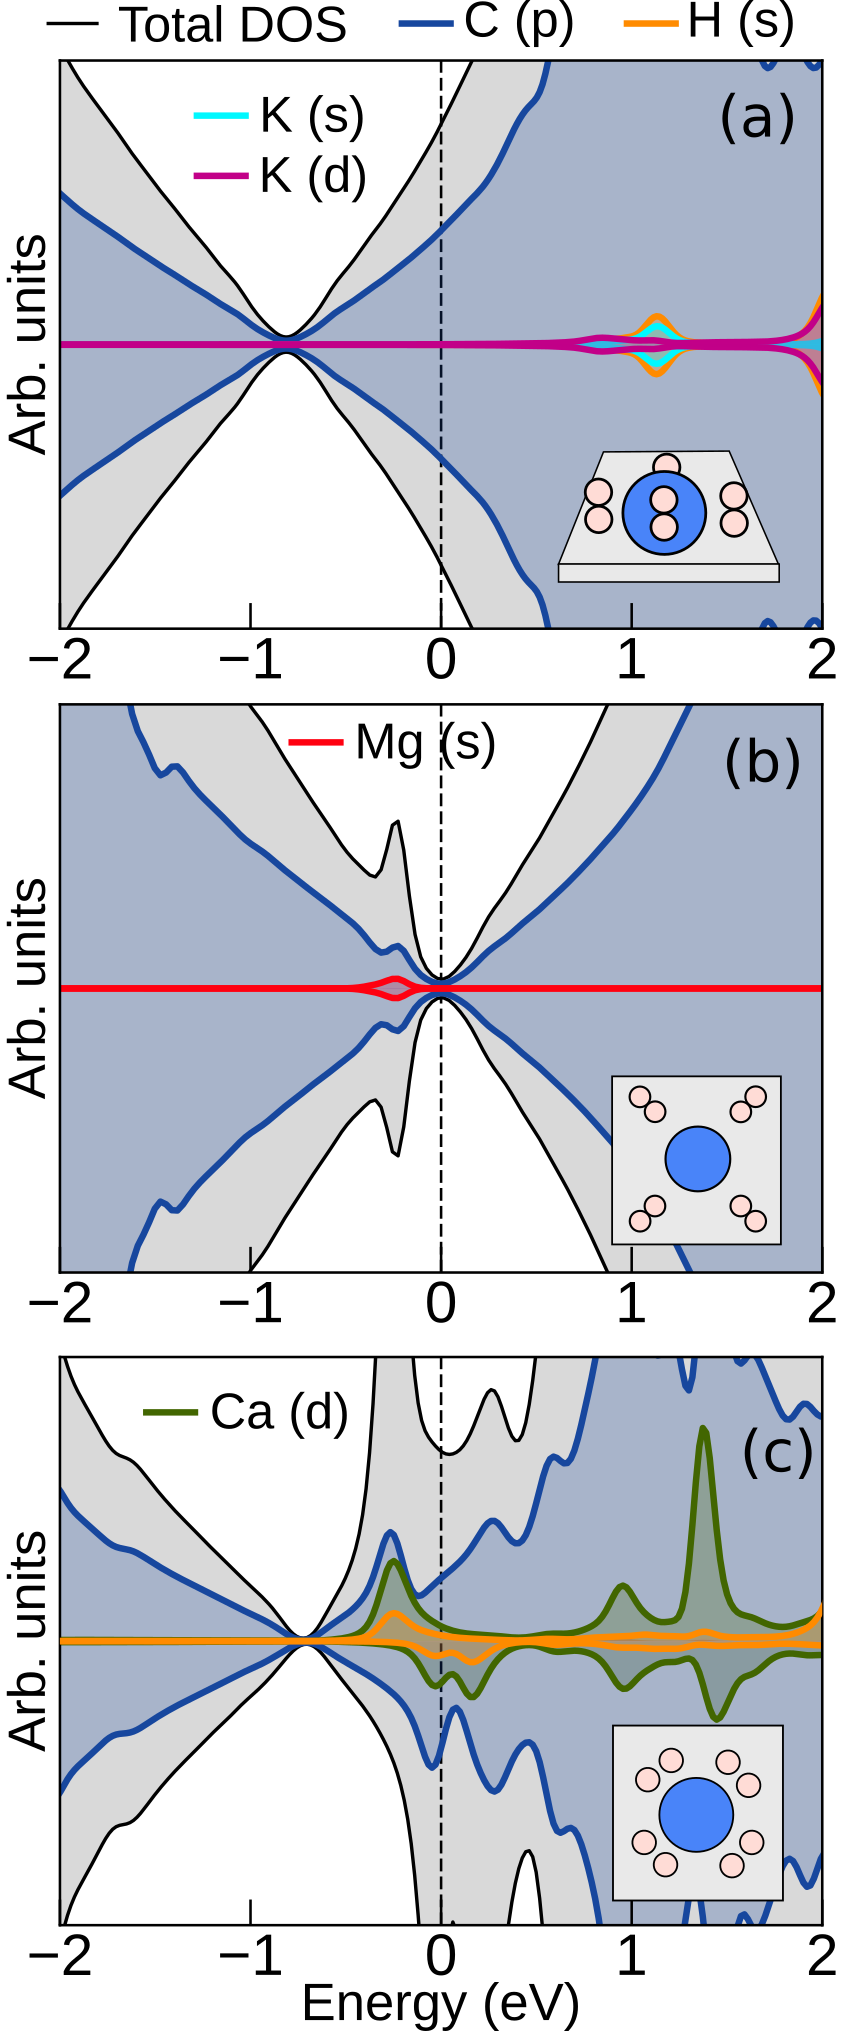
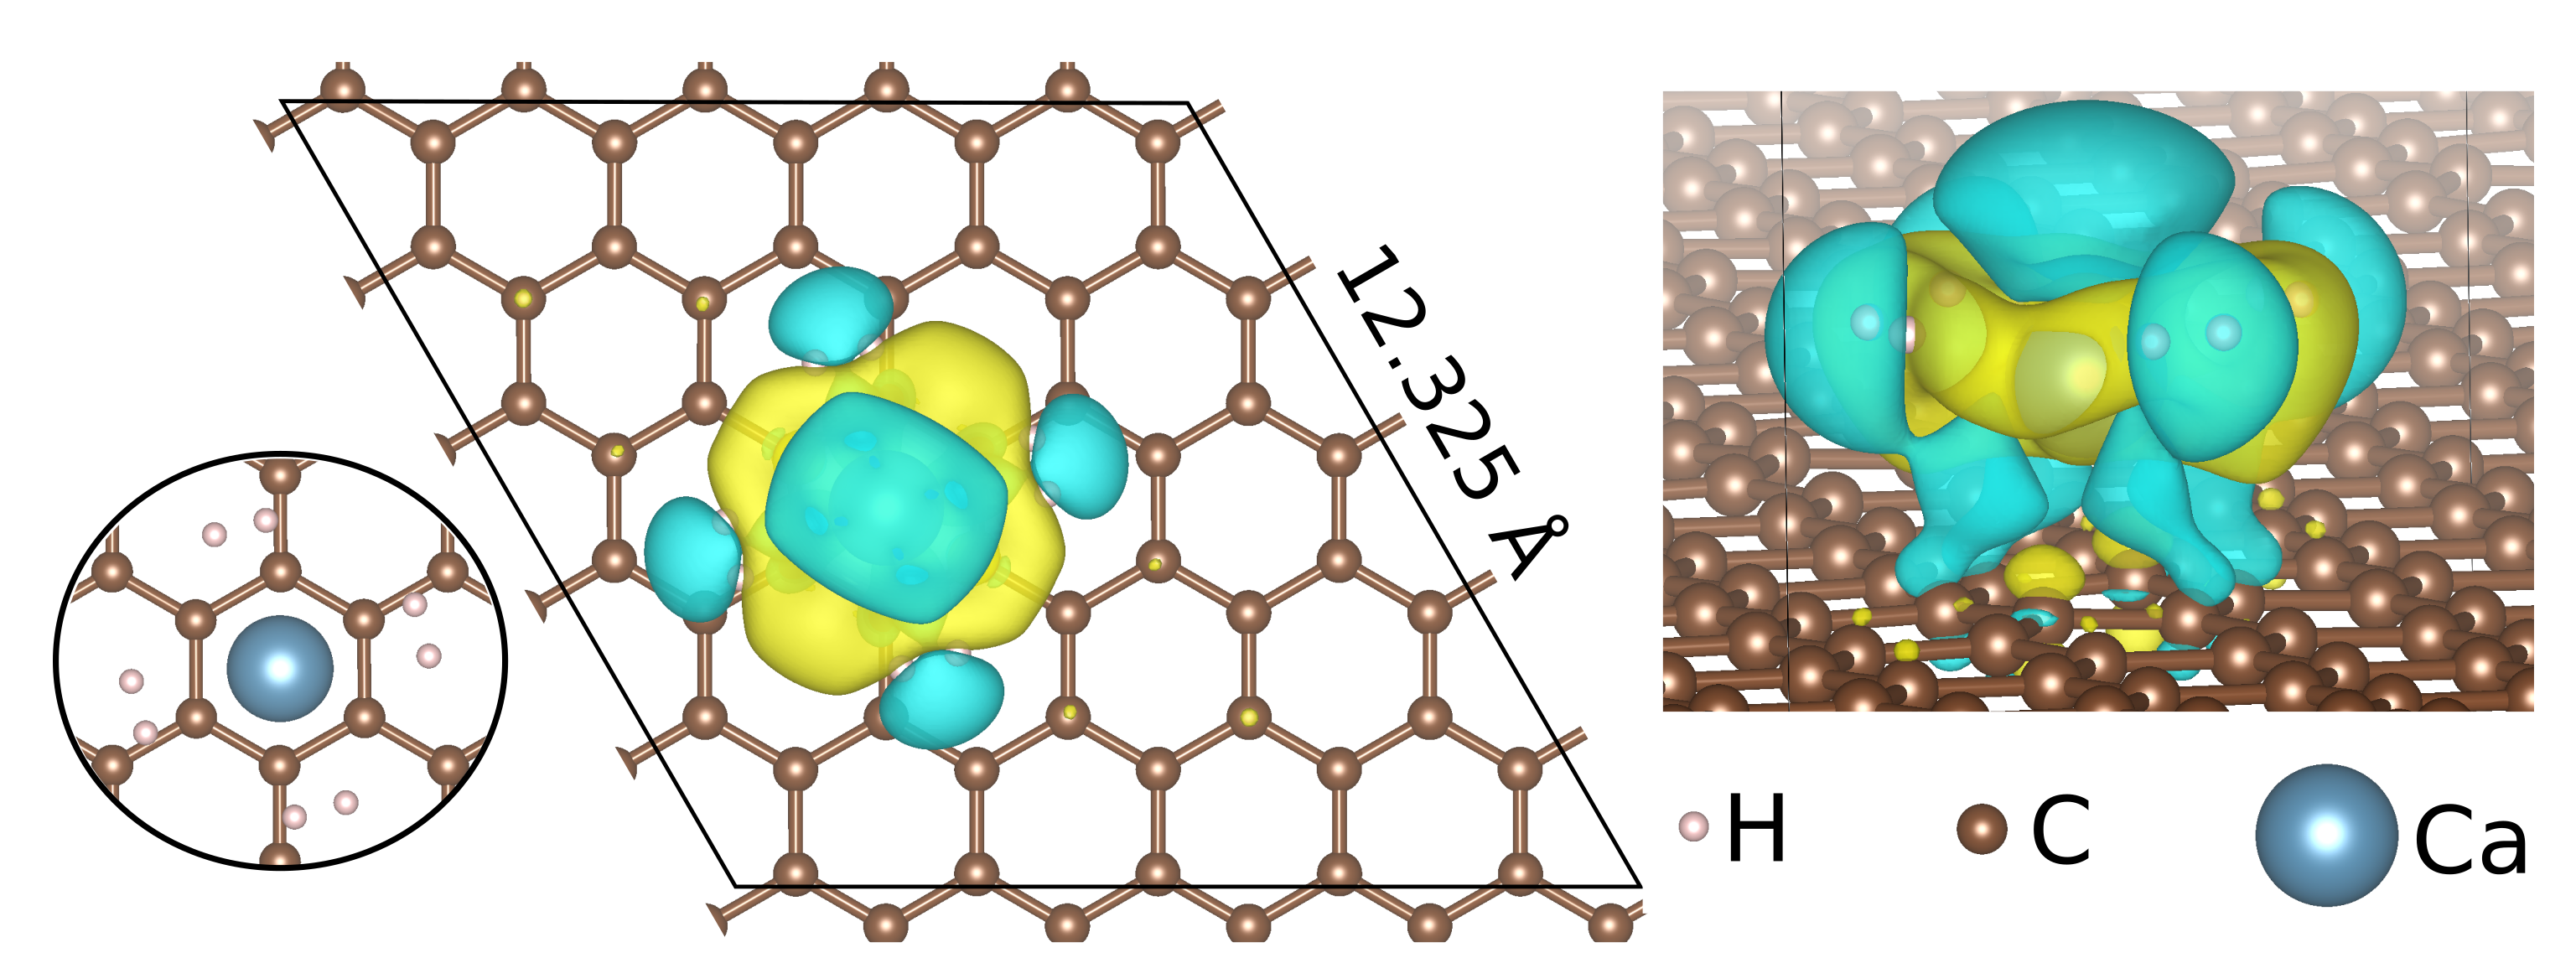
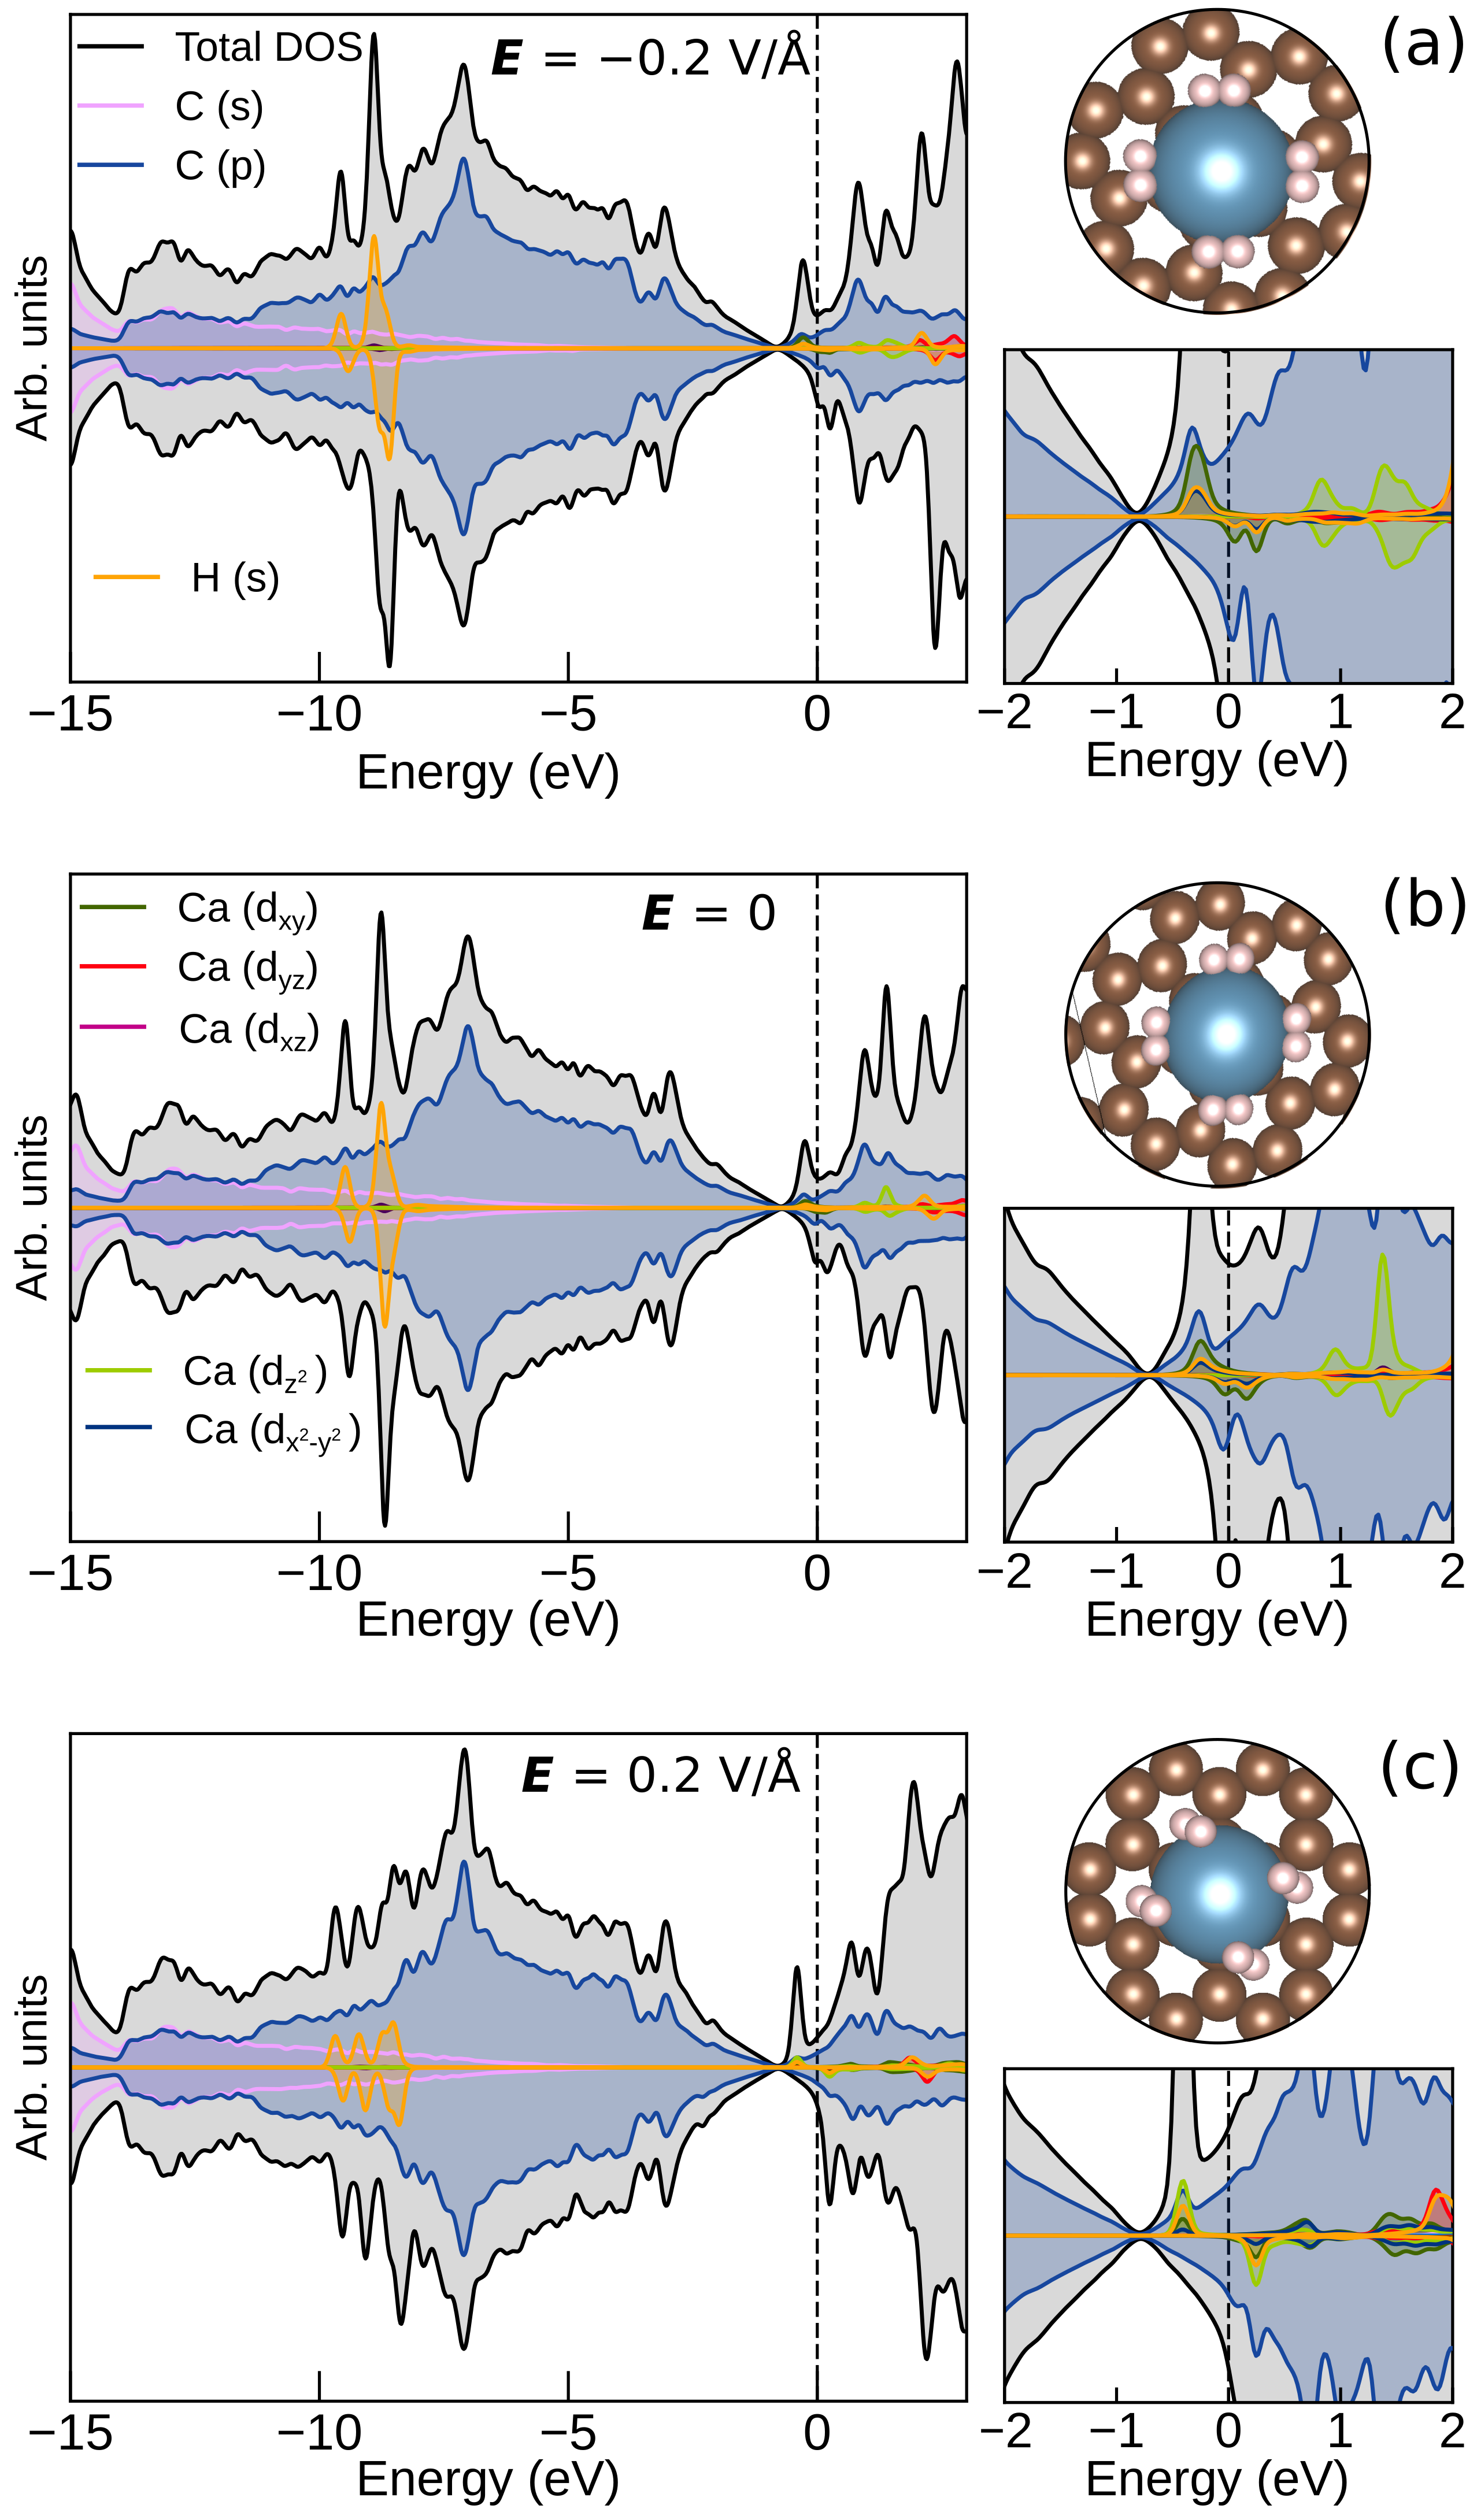
First, we focus on the 4H2+Ca@Gr system, where the adsorption energy is the strongest and there is a long-standing effort to establish whether the system is viable for H2 storage. The unit cell, adsorption configuration, and charge density difference for adsorbing 4H2 molecules can be seen in Fig. 4. We can see that there is charge accumulation in the region between the Ca adatom and the H2 molecules and charge depletion above the Ca adatom and within the H–H bonding regions, in agreement with the work of Ataca et al. Ataca, Aktürk, and Ciraci (2009) Charge depletion along H2 covalent bonds is consistent with longer H–H bond lengths, from 0.75 Å in the gas phase equilibrium structure to 0.78 Å in the adsorbed flat BF configurations. This form of binding has been discussed previouslyAtaca, Aktürk, and Ciraci (2009); Singh and Yakobson (2012) and is known as a Kubas interaction. More specifically, it arises from stabilization of the 3 state of Ca over the state and back-donation of electron density from the valence Ca state to the state of the H2 molecule. This mechanism is corroborated in the projected density of states (PDOS) of 4H2+Ca@Gr, shown in Fig 3(c). H2 bond-weakening can also be found on Sr@Gr and Ba@Gr, indicating that the Kubas mechanism underpins the adsorption of H2 in these systems also.
Adsorbed H2 molecules on Li, Na, K, Rb, and Cs metal decorated graphene, which are in an upright BF configuration, do not exhibit H–H bond weakening and the effect on the charge density from adsorption is also distinctly different (see SM for the charge density difference for 4H2 on Na@Gr). Indeed, the PDOS of 4H2 on K@Gr in Fig. 3(a) shows no K occupied states near the Fermi energy, indicating complete charge transfer of the K valence electron to graphene and no occupation of the states of the H2 molecules. Given that alkali adatoms lose their single valence electron to graphene, the resulting positively charged adatom facilitates the adsorption of H2 on the surface through a direct static polarization interaction with H2 molecules. We can see from the adsorption energies in Table 1 that the order of H2 adsorption strength coincides with the polarizing strength of the alkali cation for 3H2 adsorbed, such that the Li adatom binds H2 the most strongly and the Cs adatom binds H2 the least among the alkali metal adatoms we consider. With more than three H2 molecules adsorbed, the trend holds from Na as Li is small and H2 molecules become sterically hindered.
When the adsorption of H2 is very weak, as in the case of Be and Mg decorated graphene, H2 is radially orientated to the adatom while lying flat on graphene. The resulting H2 configuration is similar to H2 physisorption on pristine graphene.Al-Hamdani, Alfè, and Michaelides (2017) Indeed, it was previously reported that the PBE+D3 adsorption energy of H2 on pristine graphene is meV,Al-Hamdani, Alfè, and Michaelides (2017) while we find that the adsorption energy is meV on Mg@Gr. The different adsorption mechanism of H2 on Mg and Be adatoms to other alkaline earth metals can be understood in terms of the metal atom electronic structure. First, the valence and electrons of Be and Mg, respectively, cannot be stabilized to a state and therefore they cannot bind H2 molecules via Kubas bonding. Second, the ionization energies of Be and Mg are too high for graphene to oxidize the adatoms. The PDOS of 4H2+Mg@Gr in Fig. 3(b) demonstrates the intact Mg valence state and can be seen as an occupied state just under the Fermi energy of graphene. As a result, Be and Mg remain uncharged atoms that H2 molecules weakly interact with.
V Tuning the H2 adsorption energy using an electric field
An ideal storage material for H2 would allow the reversible cycling of gas and easy tuning of the H2 adsorption energy would be an additional welcome feature. To this end, we report the effect of applying an electric field on the interaction with H2 bound via the three mechanisms we have established. For the results in Fig. 6 we do not allow the atomic positions to relax under the applied electric field and as such, the results indicate the response of only the electron density to an applied field (i.e. the high-frequency limit). Specifically, we look at the interaction defined as:
| (3) |
where is the total energy of the system with 4H2 adsorbed on M@Gr fully optimized at zero-field, while and are the total energies of unrelaxed M@Gr and 4H2 in the adsorption configuration at zero-field. Since Eq. 3 does not take into account any atomic relaxation, the resulting interaction energies do not convey the final adsorption energy at the applied electric field (low frequency limit). For example, it can be seen from Fig. 6 that at zero-field is lower than reported in Table 1 and this is due to the unrelaxed reference subsystems in the definition of .
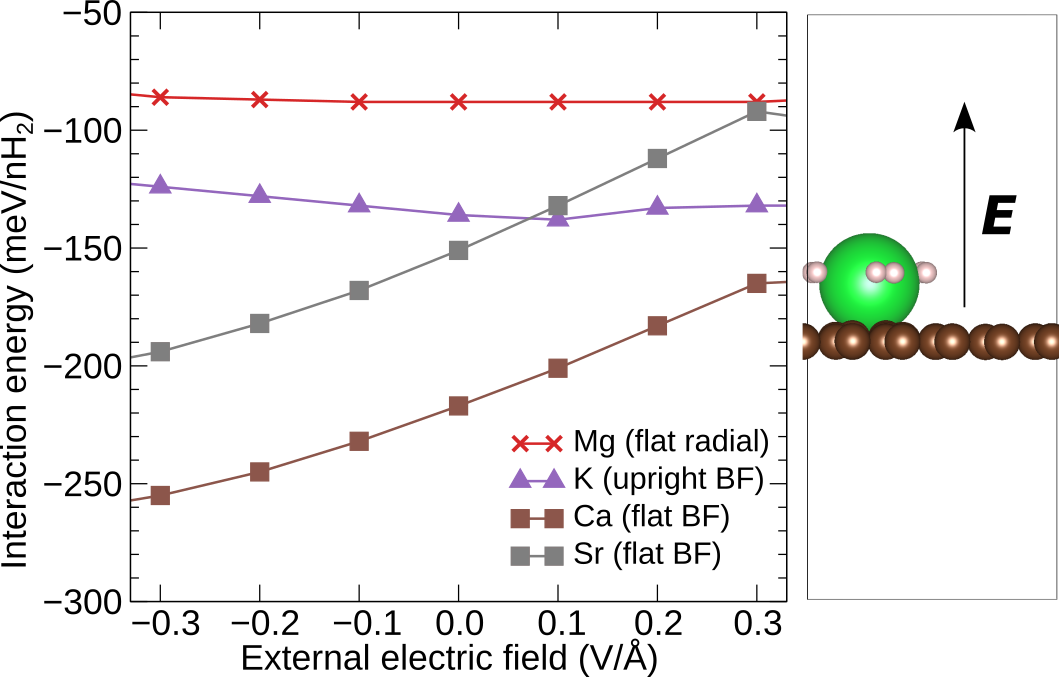
It can be seen from Fig. 6 that the effect of an external electric field (applied in the -direction) on the H2 interaction energy with K and Mg decorated graphene is minimal. The results suggests that interaction with H2 is not easily perturbed for H2 bound using weak physisorption (flat radial configurations on Be@Gr and Mg@Gr) or static polarization interactions (upright BF on alkali@Gr systems). However, it can be seen from Fig. 6 that the H2 molecule interaction with Ca and Sr decorated graphene is strongly affected by an external electric field. With electric fields from V Å-1 to 0.3 V Å-1 in the -direction, the interaction is decreased by meV per H2 molecule. Since a positive electric field perpendicular to the graphene sheet draws electrons from the adatom towards graphene, H2 adsorption weakens as the adatom electron density is depleted.
On relaxation of the 4H2+Ca@Gr system under a positive electric field, we find that the H2 molecules reorient themselves to the upright BF configuration (see Fig. 5(c)) while the H–H bond length remains elongated (0.78 Å). This is also reflected in the PDOS of 4H2+Ca@Gr shown in Fig. 5(c), where the Ca and states at the valence band edge overlap with H2 state under zero-field and V Å-1 electric field, whereas under a positive electric field the state of Ca is overlapping with H2 . In addition, it can be seen that the exchange splitting between the occupied spin-up state and the corresponding unoccupied spin-down state is ca. 0.5 eV under a positive electric field which indicates single electron occupancy of this state. Under zero or negative electric field, the exchange splitting is smaller ( eV) and we see that the corresponding spin-down state is partially occupied. In addition, it can be seen from Fig. 5 that occupation of Ca states near the Fermi energy increases with the electric field decreasing (i.e. from +0.2 to V Å-1). This corroborates that there is a higher density of electrons around the Ca adatom under zero and negative electric fields, facilitating a stronger Kubas interaction with H2 molecules. By relaxing a single gas phase hydrogen molecule and the Ca@Gr substrate at and 0.2 V Å-1 electric force fields (along the same -direction), we find that the adsorption energy of 4H2 on Ca@Gr is and meV, respectively, per H2 molecule. The difference of meV in H2 adsorption energy on Ca@Gr when applying and 0.2 V Å-1 electric force fields is consistent with the difference in the interaction energy reported in Fig. 6.
VI Conclusion
We predicted H2 adsorption energies and structures on alkali and alkaline earth metal decorated graphene materials to understand how these substrates can facilitate H2 adsorption. We find three distinct adsorption mechanisms which manifest from the electronic structure of the metal adatom. First, alkali metal adatoms act as positive charges interacting with H2 molecules via attractive electrostatic interactions. Under this mechanism, the H2 molecules are upright on graphene, exposing the most electron-rich bonding region of the H2 molecules to the positively charged adatom. Li@Gr best facilitates this mechanism of binding, with an adsorption energy of meV per H2 molecule in 3H2+Li@Gr. Second, small alkaline earth metal atoms, Be and Mg, retain their gas phase electronic structure when adsorbed on graphene and have a negligible impact on adsorbing H2 molecules, leading to weak physisorption. Larger alkaline earth metals, i.e. Ca, Sr, and Ba, are partially depleted of valence electron density and more importantly, the and states of these atoms are stabilized in favour of the gas phase valence state. Therefore, in the third mechanism, H2 molecules prefer to bind to the adatoms via Kubas bonding, receiving electron density into the H2 state. This H2 adsorption mechanism is distinguishable due to the resulting elongated H–H bond length. Kubas bonding also results in the strongest adsorption of H2 among the materials we considered, with 4H2 molecules on Ca decorated graphene adsorbing at meV per H2 molecule. While this is meV shy of the adsorption strength we estimate to be necessary for viable H2 storage, a number of factors have not been taken into account at this stage including: zero-point energy vibrations, finite temperature, and importantly, the accuracy of the DFT approximation. In addition, we applied a range of external electric fields to a subset of systems and we find that the adsorption energy of H2 is easily perturbed when H2 molecules are bound via the Kubas interaction. Therefore, it is feasible that a metal decorated graphene system can be made into a viable storage material for hydrogen fuel. More generally, we expect the mechanisms outlined in this work to apply in similar adatom decorated materials. For example, covalent organic frameworks and metal organic frameworks are also promising low-dimensional storage materials, where alkali and alkaline earth metals may play a similar role in binding H2. The experimental synthesis and clear characterization of such materials will be a key step towards the fruition of H2 storage in low dimensional materials. To this end, our results provide some useful indications of which materials to target and what properties can be probed, e.g. elongated H–H bonds. In summary, the findings provide a systematic overview of H2 adsorption on alkali and alkaline earth metal decorated graphene and form a basis for developing H2 physisorption storage materials.
*
Appendix A Derivation of eq. 1.
The H2 vapor pressure is a key factor in determining the suitability of H2 storage materials. Theoretical estimations of ideal H2 vapor pressures have been proposed previously,Li et al. (2003); Bhatia and Myers (2006) resulting in ca. to meV adsorption energy range which is typically considered. The window of adsorption energies ultimately depends on several factors including the choice of fuel cells, device functionality, and the properties of the storage material. In our estimate we considered pressures from 3 bar to 100 bar and temperatures from 270 K to 390 K which covers intermediate and high temperature fuel cells.Ogungbemi et al. (2021); Salam et al. (2020) In the following heuristic approach, we show how we evaluate the H2 vapor pressure, using coronene as a model substrate for flat carbon based materials such as graphene, to arrive at our ideal adsorption energy estimate. We begin with the Gibbs free energy: , where is pressure, is temperature, is the internal energy, is volume and is entropy. The chemical potential, , is the Gibbs free energy normalized for the number of particles : . For the system at equilibrium: , and we can separate the electronic contribution to the energy, , which we compute from DFT, leaving the chemical potential of the phase-state (ps) , : , where accounts for the electronic energy at 0 K without zero-point energy contributions. According to Eq. 2, follows from the electronic contributions and thus we can write:
| (4) |
where the phase-state is gas for H2 and we assume H2@Gr and Gr are solids. As H2 is a homonuclear diatomic gas we assume it here to be ideal such that can be expressed as:
| (5) |
where is the de Broglie thermal wavelength, is the rotational partition function and is the vibrational partition function. As a first approximation , where is the moment of inertia. Within the harmonic approximation, the vibrational partition function is , where is the harmonic vibrational frequency of H2.
In the case of solids only phonons need to be considered (in the leading approximation, as the volumes are negligible with respect to the gas phase, so the term can be neglected) such that,
| (6) |
for H2@Gr and Gr, where the vibrational partition function can be evaluated within the harmonic approximation as ; here is the vibrational frequency of the -th normal mode. H2@Gr has 6 more vibrational modes than Gr due to 5 vibrations from H2 interacting with Gr and 1 mode corresponding to the H2 internal vibration. As a leading order approximation, we assume that the vibrations of H2 and Gr are the same in H2@Gr, which allows us to simplify in Eq. 4 as follows:
| (7) |
Here, is the vibrational partition function for the 5 inter-system modes, having the vibrational frequencies , .
Thus, by using Eq. 5 and Eq. 7 in Eq. 4, we arrive at an expression:
| (8) |
From this expression we extract the H2 vapor pressure:
| (9) |
In computing the vapor pressure, we can make a further approximation by assuming that physisorbed H2 rotates freely such that drops out along with two inter-system vibrational frequencies (which are essentially H2 rotating on the substrate). Furthermore, we assume that 2 inter-system vibrations parallel to the surface (-plane) that are cm-1 are too weak for the harmonic approximation to be useful and thus we can neglect them, leaving us with the working equation:
| (10) |
Expanding , and in Eq. 10 yields Eq. 1. We consider the effect of this last approximation in Fig. 7 by comparison with using three inter-system vibrations (i.e. including those along the -plane that we deem too weak for the harmonic approximation). We can see that the inclusion of the weak vibrational modes would suggest that even lower adsorption energies could be sufficient at the operating conditions of a fuel cell.
Finally, it is important to note that we used a molecular system, H2 on coronene, as a model for H2 on pristine graphene, to have an estimate frequency , which is ca. 200 cm-1. The ORCA quantum chemistry package,Neese et al. (2020) and the PBE+D3 functional was used to compute vibrational frequencies. For a more accurate pressure-temperature profile, the inter-system vibrational frequencies would need to be known for each substrate material that is considered. Nonetheless, it is interesting that our estimated window of ideal adsorption energy is consistent with previous estimations.Li et al. (2003); Bhatia and Myers (2006)
Acknowledgements.
Y.S.A. is supported by Leverhulme grant no. RPG-2020-038. A.Z. also acknowledges support by RPG-2020-038. The authors acknowledge the use of the UCL Kathleen High Performance Computing Facility (Kathleen@UCL), and associated support services, in the completion of this work. This research used resources of the Oak Ridge Leadership Computing Facility at the Oak Ridge National Laboratory, which is supported by the Office of Science of the U.S. Department of Energy under Contract No. DE-AC05-00OR22725). A.Z. acknowledge allocation of CPU hours by CSCS under Project ID s1112. Calculations were also performed using the Cambridge Service for Data Driven Discovery (CSD3) operated by the University of Cambridge Research Computing Service (www.csd3.cam.ac.uk), provided by Dell EMC and Intel using Tier-2 funding from the Engineering and Physical Sciences Research Council (capital grant EP/T022159/1 and EP/P020259/1), and DiRAC funding from the Science and Technology Facilities Council (www.dirac.ac.uk). This work also used the ARCHER UK National Supercomputing Service (https://www.archer2.ac.uk), the United Kingdom Car Parrinello (UKCP) consortium (EP/ F036884/1).References
- Allendorf et al. (2018) M. D. Allendorf, Z. Hulvey, T. Gennett, A. Ahmed, T. Autrey, J. Camp, E. Seon Cho, H. Furukawa, M. Haranczyk, M. Head-Gordon, S. Jeong, A. Karkamkar, D.-J. Liu, J. R. Long, K. R. Meihaus, I. H. Nayyar, R. Nazarov, D. J. Siegel, V. Stavila, J. J. Urban, S. P. Veccham, and B. C. Wood, “An assessment of strategies for the development of solid-state adsorbents for vehicular hydrogen storage,” Energy Environ. Sci. 11, 2784 (2018).
- Armaroli and Balzani (2011) N. Armaroli and V. Balzani, “The Hydrogen Issue,” ChemSusChem 4, 21–36 (2011).
- Ogungbemi et al. (2021) E. Ogungbemi, T. Wilberforce, O. Ijaodola, J. Thompson, and A. G. Olabi, “Review of operating condition, design parameters and material properties for proton exchange membrane fuel cells,” Int. J. Energy Res. 45, 1227 (2021).
- Salam et al. (2020) M. A. Salam, M. S. Habib, P. Arefin, K. Ahmed, M. S. Uddin, T. Hossain, and N. Papri, “Effect of temperature on the performance factors and durability of proton exchange membrane of hydrogen fuel cell: A narrative review,” Mater. Sci. Res. India 17, 179 (2020).
- Ahmed et al. (2019) A. Ahmed, S. Seth, J. Purewal, A. G. Wong-Foy, M. Veenstra, A. J. Matzger, and D. J. Siegel, “Exceptional hydrogen storage achieved by screening nearly half a million metal-organic frameworks,” Nat. Commun. 10, 1–9 (2019).
- Lai et al. (2019) Q. Lai, Y. Sun, T. Wang, P. Modi, C. Cazorla, U. B. Demirci, J. R. Ares Fernandez, F. Leardini, and K. Aguey-Zinsou, “How to Design Hydrogen Storage Materials? Fundamentals, Synthesis, and Storage Tanks,” Adv. Sustain. Syst. 3, 1900043 (2019).
- Al-Hamdani, Alfè, and Michaelides (2017) Y. S. Al-Hamdani, D. Alfè, and A. Michaelides, “How strongly do hydrogen and water molecules stick to carbon nanomaterials?” J. Chem. Phys. 146, 094701 (2017).
- Spyrou, Gournis, and Rudolf (2013) K. Spyrou, D. Gournis, and P. Rudolf, “Hydrogen Storage in Graphene-Based Materials: Efforts Towards Enhanced Hydrogen Absorption,” ECS J. Solid State Sci. Technol. 2, M3160 (2013).
- Wong et al. (2014) J. Wong, S. Yadav, J. Tam, and C. Veer Singh, “A van der Waals density functional theory comparison of metal decorated graphene systems for hydrogen adsorption,” J. App. Phys. 115, 224301 (2014).
- Reunchan and Jhi (2011) P. Reunchan and S. H. Jhi, “Metal-dispersed porous graphene for hydrogen storage,” App. Phys. Lett. 98, 2009–2012 (2011).
- Wen et al. (2017) Y. Wen, F. Xie, X. Liu, X. Liu, R. Chen, K. Cho, and B. Shan, “Tunable H2 binding on alkaline and alkaline earth metals decorated graphene substrates from first-principles calculations,” Int. J. Hydrog. Energy 42, 10064 (2017).
- Amaniseyed and Tavangar (2019) Z. Amaniseyed and Z. Tavangar, “Hydrogen storage on uncharged and positively charged Mg-decorated graphene,” Int. J. Hydrog. Energy 44, 3803 (2019).
- Sun et al. (2010) Y. Y. Sun, K. Lee, L. Wang, Y.-H. Kim, W. Chen, Z. Chen, and S. B. Zhang, “Accuracy of density functional theory methods for weakly bonded systems: The case of dihydrogen binding on metal centers,” Phys. Rev. B 82, 073401 (2010).
- Beheshti, Nojeh, and Servati (2011) E. Beheshti, A. Nojeh, and P. Servati, “A first-principles study of calcium-decorated, boron-doped graphene for high capacity hydrogen storage,” Carbon 49, 1561 (2011).
- Ataca, Aktürk, and Ciraci (2009) C. Ataca, E. Aktürk, and S. Ciraci, “Hydrogen storage of calcium atoms adsorbed on graphene: First-principles plane wave calculations,” Phys. Rev. B 79, 1 (2009).
- Zhou et al. (2012) W. Zhou, J. Zhou, J. Shen, C. Ouyang, and S. Shi, “First-principles study of high-capacity hydrogen storage on graphene with Li atoms,” J. Phys. Chem. Solids 73, 245 (2012).
- Cha, Choi, and Park (2011) J. Cha, C. H. Choi, and N. Park, “Ab initio study of Kubas-type dihydrogen fixation onto d-orbital states of Ca adatoms,” Chem. Phys. Lett. 513, 256 (2011).
- Kubas (2001) G. J. Kubas, “Metal-dihydrogen and -bond coordination: The consummate extension of the Dewar-Chatt-Duncanson model for metal-olefin bonding,” J. Organomet. Chem. 635, 37 (2001).
- Cha et al. (2009) J. Cha, S. Lim, C. H. Choi, M. H. Cha, and N. Park, “Inaccuracy of density functional theory calculations for dihydrogen binding energetics onto ca cation centers,” Phys. Rev. Lett. 103, 2 (2009).
- Bajdich, Reboredo, and Kent (2010) M. Bajdich, F. A. Reboredo, and P. R. C. Kent, “Quantum Monte Carlo calculations of dihydrogen binding energetics on Ca cations: An assessment of errors in density functionals for weakly bonded systems,” Phys. Rev. B 82, 081405 (2010).
- Park et al. (2012) N. Park, K. Choi, J. Hwang, D. W. Kim, D. O. Kim, and J. Ihm, “Progress on first-principles-based materials design for hydrogen storage,” Proc. Natl. Acad. Sci. U.S.A. 109, 19893 (2012).
- Purwanto et al. (2011) W. Purwanto, H. Krakauer, Y. Virgus, and S. Zhang, “Assessing weak hydrogen binding on Ca+ centers: An accurate many-body study with large basis sets,” J. Chem. Phys. 135, 164105 (2011).
- Ohk, Kim, and Jung (2010) Y. Ohk, Y.-H. Kim, and Y. Jung, “Comment on “Inaccuracy of Density Functional Theory Calculations for Dihydrogen Binding Energetics onto Ca Cation Centers”,” Phys. Rev. Lett. 104, 179601 (2010).
- Kühne et al. (2020) T. D. Kühne, M. Iannuzzi, M. Del Ben, V. V. Rybkin, P. Seewald, F. Stein, T. Laino, R. Z. Khaliullin, O. Schütt, F. Schiffmann, D. Golze, J. Wilhelm, S. Chulkov, M. H. Bani-Hashemian, V. Weber, U. Borštnik, M. Taillefumier, A. S. Jakobovits, A. Lazzaro, H. Pabst, T. Müller, R. Schade, M. Guidon, S. Andermatt, N. Holmberg, G. K. Schenter, A. Hehn, A. Bussy, F. Belleflamme, G. Tabacchi, A. Glöß, M. Lass, I. Bethune, C. J. Mundy, C. Plessl, M. Watkins, J. VandeVondele, M. Krack, and J. Hutter, “CP2K: An electronic structure and molecular dynamics software package - Quickstep: Efficient and accurate electronic structure calculations,” J. Chem. Phys. 152, 194103 (2020).
- Vandevondele et al. (2005) J. Vandevondele, M. Krack, F. Mohamed, M. Parrinello, T. Chassaing, and J. Hutter, “Quickstep: Fast and accurate density functional calculations using a mixed Gaussian and plane waves approach,” Comput. Phys. Commun. 167, 103 (2005).
- Goedecker and Teter (1996) S. Goedecker and M. Teter, “Separable dual-space Gaussian pseudopotentials,” Phys. Rev. B 54, 1703 (1996), 9512004 .
- Krack (2005) M. Krack, “Pseudopotentials for H to Kr optimized for gradient-corrected exchange-correlation functionals,” Theor. Chem. Acc. 114, 145 (2005).
- VandeVondele and Hutter (2007) J. VandeVondele and J. Hutter, “Gaussian basis sets for accurate calculations on molecular systems in gas and condensed phases,” J. Chem. Phys. 127, 114105 (2007).
- Perdew, Burke, and Ernzerhof (1996) J. P. Perdew, K. Burke, and M. Ernzerhof, “Generalized Gradient Approximation Made Simple,” Phys. Rev. Lett. 77, 3865 (1996).
- Grimme et al. (2010) S. Grimme, J. Antony, S. Ehrlich, and H. Krieg, “A consistent and accurate ab initio parametrization of density functional dispersion correction (DFT-D) for the 94 elements H-Pu,” J. Chem. Phys. 132, 154104 (2010).
- Bučko et al. (2010) T. Bučko, J. Hafner, S. Lebègue, and J. G. Ángyán, “Improved description of the structure of molecular and layered crystals: ab initio dft calculations with van der waals corrections,” J. Phys. Chem. A 114, 11814 (2010).
- Carter and Rohl (2014) D. J. Carter and A. L. Rohl, “Benchmarking calculated lattice parameters and energies of molecular crystals using van der waals density functionals,” J. Chem. Theory Comput. 10, 3423 (2014).
- Bedolla et al. (2014) P. O. Bedolla, G. Feldbauer, M. Wolloch, S. J. Eder, N. Dörr, P. Mohn, J. Redinger, and A. Vernes, “Effects of van der waals interactions in the adsorption of isooctane and ethanol on fe(100) surfaces,” J. Phys. Chem. C 118, 17608 (2014).
- Klimeš and Michaelides (2012) J. Klimeš and A. Michaelides, “Perspective: Advances and challenges in treating van der waals dispersion forces in density functional theory,” J. Chem. Phys. 137, 120901 (2012).
- Carrasco, Klimeš, and Michaelides (2013) J. Carrasco, J. Klimeš, and A. Michaelides, “The role of van der waals forces in water adsorption on metals,” J. Chem. Phys. 138, 024708 (2013).
- Rosa, Corni, and Felice (2014) M. Rosa, S. Corni, and R. D. Felice, “Van der waals effects at molecule-metal interfaces,” Phys. Rev. B 90, 125448 (2014).
- Caldeweyher, Bannwarth, and Grimme (2017) E. Caldeweyher, C. Bannwarth, and S. Grimme, “Extension of the d3 dispersion coefficient model,” J. Chem. Phys. 147, 034112 (2017).
- Ambrosetti et al. (2014) A. Ambrosetti, A. M. Reilly, R. A. Distasio, and A. Tkatchenko, “Long-range correlation energy calculated from coupled atomic response functions,” J. Chem. Phys. 140, 18A508 (2014).
- Tkatchenko et al. (2012) A. Tkatchenko, R. A. Distasio, R. Car, and M. Scheffler, “Accurate and efficient method for many-body van der waals interactions,” Phys. Rev. Lett. 108, 236402 (2012).
- Gobre and Tkatchenko (2013) V. V. Gobre and A. Tkatchenko, “Scaling laws for van der waals interactions in nanostructured materials,” Nat. Commun. 4, 1 (2013).
- Neugebauer and Scheffler (1992) J. Neugebauer and M. Scheffler, “Adsorbate-substrate and adsorbate-adsorbate interactions of na and k adlayers on al(111),” Phys. Rev. B 46, 16067 (1992).
- Makov and Payne (1995) G. Makov and M. C. Payne, “Periodic boundary conditions in ab initio calculations,” Phys. Rev. B 51, 4014 (1995).
- Kresse and Hafner (1993) G. Kresse and J. Hafner, “ab initio molecular dynamics for liquid metals,” Phys. Rev. B 47, 558 (1993).
- Kresse and Hafner (1994) G. Kresse and J. Hafner, “Ab initio molecular-dynamics simulation of the liquid-metal–amorphous-semiconductor transition in germanium,” Phys. Rev. B 49, 14251 (1994).
- Kresse and Furthmüller (1996a) G. Kresse and J. Furthmüller, “Efficient iterative schemes for ab initio total-energy calculations using a plane-wave basis set,” Phys. Rev. B 54, 11169 (1996a).
- Kresse and Furthmüller (1996b) G. Kresse and J. Furthmüller, “Efficiency of ab-initio total energy calculations for metals and semiconductors using a plane-wave basis set,” Comput. Mater. Sci. 6, 15 (1996b).
- Ganose, Jackson, and Scanlon (2018) A. M. Ganose, A. J. Jackson, and D. O. Scanlon, “sumo: Command-line tools for plotting and analysis of periodic ab initio calculations,” J. Open Source Softw. 3, 717 (2018).
- Wong et al. (2017) D. Wong, F. Corsetti, Y. Wang, V. W. Brar, H.-Z. Tsai, Q. Wu, R. K. Kawakami, A. Zettl, A. A. Mostofi, J. Lischner, and M. F. Crommie, “Spatially resolving density-dependent screening around a single charged atom in graphene,” Phys. Rev. B 95, 205419 (2017).
- Singh and Yakobson (2012) A. K. Singh and B. I. Yakobson, “First principles calculations of H-storage in sorption materials,” J. Mater. Sci. 47, 7356 (2012).
- Li et al. (2003) J. Li, T. Furuta, H. Goto, T. Ohashi, Y. Fujiwara, and S. Yip, “Theoretical evaluation of hydrogen storage capacity in pure carbon nanostructures,” J. Chem. Phys. 119, 2376 (2003).
- Bhatia and Myers (2006) S. K. Bhatia and A. L. Myers, “Optimum conditions for adsorptive storage,” Langmuir 22, 1688 (2006).
- Neese et al. (2020) F. Neese, F. Wennmohs, U. Becker, and C. Riplinger, “The orca quantum chemistry program package,” J. Chem. Phys. 152, 224108 (2020).