Quality Matters: Embracing Quality Clues for Robust 3D Multi-Object Tracking
Abstract
3D Multi-Object Tracking (MOT) has achieved tremendous achievement thanks to the rapid development of 3D object detection and 2D MOT. Recent advanced works generally employ a series of object attributes, e.g., position, size, velocity, and appearance, to provide the clues for the association in 3D MOT. However, these cues may not be reliable due to some visual noise, such as occlusion and blur, leading to tracking performance bottleneck. To reveal the dilemma, we conduct extensive empirical analysis to expose the key bottleneck of each clue and how they correlate with each other. The analysis results motivate us to efficiently absorb the merits among all cues, and adaptively produce an optimal tacking manner. Specifically, we present Location and Velocity Quality Learning, which efficiently guides the network to estimate the quality of predicted object attributes. Based on these quality estimations, we propose a quality-aware object association (QOA) strategy to leverage the quality score as an important reference factor for achieving robust association. Despite its simplicity, extensive experiments indicate that the proposed strategy significantly boosts tracking performance by 2.2% AMOTA and our method outperforms all existing state-of-the-art works on nuScenes by a large margin. Moreover, QTrack achieves 48.0% and 51.1% AMOTA tracking performance on the nuScenes validation and test sets, which significantly reduces the performance gap between pure camera and LiDAR based trackers.
1 Introduction
3D Multi-Object Tracking (MOT) has been recently drawing increasing attention since it is widely applied to 3D perception scenes, e.g., autonomous driving, and automatic robot. The 3D MOT task aims at locating objects and associating the targets of the same identities to form tracklets. According to the used sensors, existing 3D MOT methods can mainly be categories into two classes, i.e., camera-based and LiDAR-based schemes. In this paper, we mainly delve into the camera-only scheme since it contains semnatic information and is more economical.
Existing 3D MOT methods mostly adopt the tracking-by-detection paradigm. In this regime, a 3d detector is firstly employed to predict 3D boxes and the corresponding classfication scores, and then some post-processing methods (e.g., motion-based (Kalman 1960) or appearance-based) are used to line detected targets to form trajectories. In the camera scheme, it is natural to extract objects’ discriminative appearance features (Chaabane et al. 2021; Hu et al. 2022) to represent targets and use the features to measure the similarities among detected targets. However, the procedure of extracting the appearance feature is cumbersome since it requires predicting high-dimensional embedding, which is hard for joint training due to the optimization contradiction between the detection and embedding branches (Yu et al. 2022). Moreover, it is difficult to deal with the notorious occlusion and motion blur issues. Some other methods (Weng et al. 2020a; Pang, Li, and Wang 2021) build a motion model (Kalman Filter) to obtain some desired states of tracking clues (e.g, center position, size, size ratio, or rotation) by a linear motion assumption. Nevertheless, this process involves various hyper-parameters (e.g., initialization uncertainty of measurement, state and process, etc.) and executes complex matrix transpose operation. Different from the aforementioned methods, CenterPoint (Yin, Zhou, and Krahenbuhl 2021) reasonably leverages predicted center locations and velocities of targets for building motion. In detail, it uses time lag between two moments of observations to multiply the predicted velocity for linear location prediction. Afterwards, the L2 distance among targets acts as a measurement metric for the association procedure. For simplicity, we call this tracking framework CV method. It shows effectiveness to achieve remarkable tracking performance, while only conducting a simple operation (i.e., matrix addition and multiplication) for parallel cost computation.
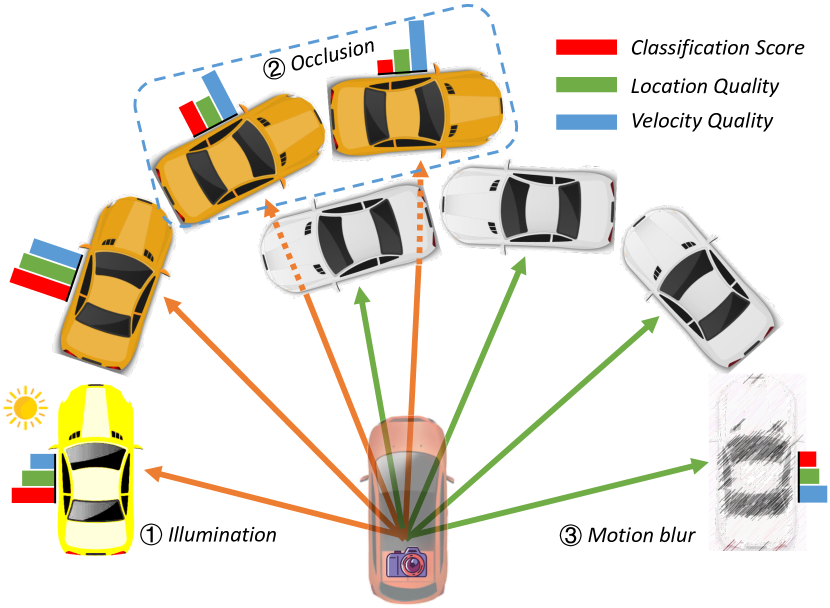
Although the CV framework shows efficiency for 3D MOT task, it relies heavily on the predicted quality of center location and velocity. The requirement may be harsh for the 3D base detector, since estimating the center location and velocity of an object from a single image is exactly an ill-posed problem. As shown in Fig. 1, notorious occlusion, motion blur, and the illumination of external issues will significantly disturb the estimation performance. To further confirm this issue, we conduct an empirical analysis to study the predicted center location and velocity quality distribution as well as their correlations. Our study reveals two valuable points: (1) There exists a significant gap between the estimation error of 3D centers and that of velocities; (2) The predicted quality of location and velocity is extremely misaligned. The imbalanced tracking cues have little effect on the detection performance but play a dramastical role in MOT. The analysis cues motivate us to endow each predicted box with the self-diagnosis ability to tracking clues for realizing stable tracking association.
To this end, we propose to forecast the quality of tracking clues from the base 3D detector. Specifically, we introduce a Normalized Gaussian Quality (NGQ) metric with two dimensions to measure the quality of predicting center location and velocity. NGQ metric comprehensively considers the vector errors of the two predictions in a 2D vector space, which is a prerequisite for our tracking framework. Based on the quality estimation of NGQ, we design a robust association mechanism, i.e, Quality-aware Object Association (QOA) strategy. It adopts the velocity quality to filter out low quality motion candidates, and leverages the location quality to further rule out center positions of boxes with bad estimations. Therefore, QOA not only effectively deals with hard cases, but also avoids dangerous association. In a sense, our method is subordinate to the idea of ”Put Quality Before Quantity” principle.
Through combining the proposed methods with the baseline 3D detector, we obtain a simple and robust 3D MOT framework, namely quality-aware 3D tracker (QTrack). We conduct extensive experiments on nuScenes dataset (Caesar et al. 2020), showing significant improvements in the 3D MOT task. Comprehensively, the contributions of this work are summarized as follows:
-
•
We conduct extensive empirical analysis to point out that the predicted quality of center location and velocity exist large distribution gap and misalignment relationship, making efficient CV tracking framework fall into sub-optimal performance.
-
•
We first propose to predict the quality of velocity and location quality measured by our designed NGQ metric. Afterwards, we further introduce QOA to leverage the two qualities for insuring safe association in 3D MOT task.
-
•
The overall 3D MOT framework (QTrack) achieves SOTA performance on nuScenes dataset which outperforms other camera-based methods by a large margin. Specially, QOA improves the baseline tracker by +2.2% AMOTA among several 3D detector settings, showing its effectiveness.
2 Related Work
2.1 3D Multi-object Tracking
Thanks to the development of 3D detection (Huang et al. 2021; Li et al. 2022a; Liu et al. 2022) and 2D MOT technologies (Han et al. 2022; Yu et al. 2022; Yu, Li, and Han 2022; Zhang et al. 2022b), recent 3D MOT methods (Weng et al. 2020a; Yin, Zhou, and Krahenbuhl 2021; Chaabane et al. 2021; Hu et al. 2022; Pang, Li, and Wang 2021) mainly follow tracking-by-detection paradigm. These trackers following this paradigm first utilize a 3D object detector to localize the targets in the 3D space (including location, rotation, and velocity) and then associate the detected objects with the trajectories according to various cues (location or appearance).
Traditional 3D MOT usually uses a motion model (Kalman filter) to predict the location of the tracklets and then associate the candidate detections using 3D (G)IoU (Weng et al. 2020a; Pang, Li, and Wang 2021) or L2 distance (Yin, Zhou, and Krahenbuhl 2021). Some works also utilize advanced appearance model (ReID) (Chaabane et al. 2021; Weng et al. 2020b; Chaabane et al. 2021) or temporal model (LSTM) (Marinello, Proesmans, and Van Gool 2022; Hu et al. 2022) to provide more reference cues for the association. Recently, Transformer (Vaswani et al. 2017) has been used in 3D detection (Wang et al. 2022) and MOT (Li and Jin 2022; Zhang et al. 2022a) to learn 3D deep representations with 2D visual information and trajectory encoded. Although these methods achieved remarkable performance, when they are applied to complex scenarios (e.g., occlusion, motion blur, or light weakness), the tracking performance becomes unsatisfactory. In this work, we argue that a simple velocity clue with quality estimation can deal with the corner cases and achieve robust tracking performance. Our proposed QTrack focuses on how to assess the quality of the location and velocity prediction, and then make full use of these quality scores in the matching process.
2.2 Prediction Quality Estimation
To estimate the quality of model’s prediction is a non-trivial, which can be applied to tackle prediction imbalance or decision-making. In the field of object detection, advanced works (Wang et al. 2021; Tian et al. 2019; Jiang et al. 2018) introduce to predict a box’s centerness or IoU for perceiving the quality of prediction (3D) boxes. (Huang et al. 2019) employ the method to perceive the mask predicted quality. These methods can alleviate the imbalance between classification score and location accuracy. (Li et al. 2022b) introduces a uncertainty based method to estimate the predicted quality of several depth factors, and then the quality is employed to make optimal decisions. In this paper, we introduce to predict the predicted quality of velocity and location. Afterwards, the predicted quality will be adopted to eliminate the non-robust association case of tracking task. To our knowledge, our work is the first effort to perceive the quality velocity and location for the decision-making in 3D MOT task.
2.3 Multi-View 3D Object Detection
3D object detection is the predecessor task for 3D MOT task. It can be split into two stream methods including point-based detectors (Lang et al. 2019; Yan, Mao, and Li 2018; Yin, Zhou, and Krahenbuhl 2021; Shi, Wang, and Li 2019; Shi et al. 2020; Yang et al. 2022c) and camera-based ones (Wang et al. 2021; Huang et al. 2021; Li et al. 2022a; Wang et al. 2022; Liu et al. 2022; Li et al. 2022c). In this paper, we focus on the 3D MOT for the multi-view camera based framework, which has made tremendous advance. Transformer based methods (Wang et al. 2022; Liu et al. 2022; Li et al. 2022c) introduce 3D object queries to interact with the multi-view image feature map. 3D object queries are constantly refined to predict 3D boxes and other tasks in an end-to-end manner. BEVDet (Huang et al. 2021) and BEVDepth (Li et al. 2022a) directly project the multi-view image feature into BEV representation and attach a center-based head (Yin, Zhou, and Krahenbuhl 2021) to conduct detection task. Standing on the shoulders of giants, we aim to equip BEVDepth with the ability to perceive the quality of velocity and center locatopn, which is the key to diagnose non-robust association for tracking. Then we introduce a novel “tracking by detection” (QTrack) to endow BEVDepth with effiective and efficient tracking ability.
3 Methodology
3.1 Delve into the Quality Distribution
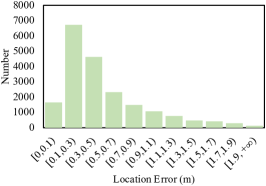
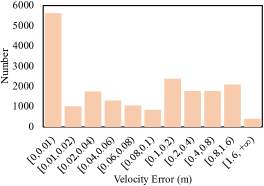
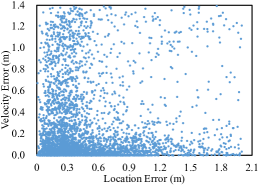
We aim to solve the task of 3D multi-object tracking (3D MOT), the goal of which is to locate the objects in the 3D space and then associate the detected targets with the same identity into the tracklets. The key challenge is how to associate the tracklets efficiently and correctly. In contrast to the motion-based and appearance-based association strategies, we argue that the simple velocity clue (CV method) is enough for the association, which is more lightweight and deployment-friendly. However, the performance of the existing CV tracking framework is not satisfactory. To analyze the reason for the limited performance of tracking with velocity, we count and visualize the distribution of the prediction error between location and velocity. As illustrated in Fig. 2 (a) and (b), we can observe that the distribution of the location and velocity quality (prediction error) is scattered, and a sizable number of low-quality boxes are included. Moreover, Fig. 2 (c) shows that the distribution correlation between the location and velocity error is nonlinear, which means the quality of the location and velocity is seriously misaligned.
Based on these observations, we conclude that the limited performance of tracking with velocity is due to the following reasons: (1) Low quality of the location or velocity. When one of the location and velocity predictions is not accurate enough, the tracker can not perform well even if the other prediction is reliable. (2) Misalignment between the quality of location and velocity. We should take both location and velocity quality into consideration. Driven by this analysis, we propose Location and Velocity Quality Learning to learn the quality uncertainty of the location, and velocity that can assist the tracker to select high-quality candidates for the association.
3.2 Base 3D Object Detector
Our method can be easily coupled with most existing 3D object detectors with end-to-end training. In this paper, we take BEVDepth (Li et al. 2022a) as an example. BEVDepth is a camera-based Bird’s-Eye-View (BEV) 3D object detector that transfers the multi-view image features to the BEV feature through a depth estimation network and then localizes and classifies the objects in the BEV view. It consists four kinds of modules: an image-view encoder, a view transformer with explicit depth supervision utilizing encoded intrinsic and extrinsic parameters, a BEV encoder and a task-specific head. The entire network is optimized with a multi-task loss function:
| (1) |
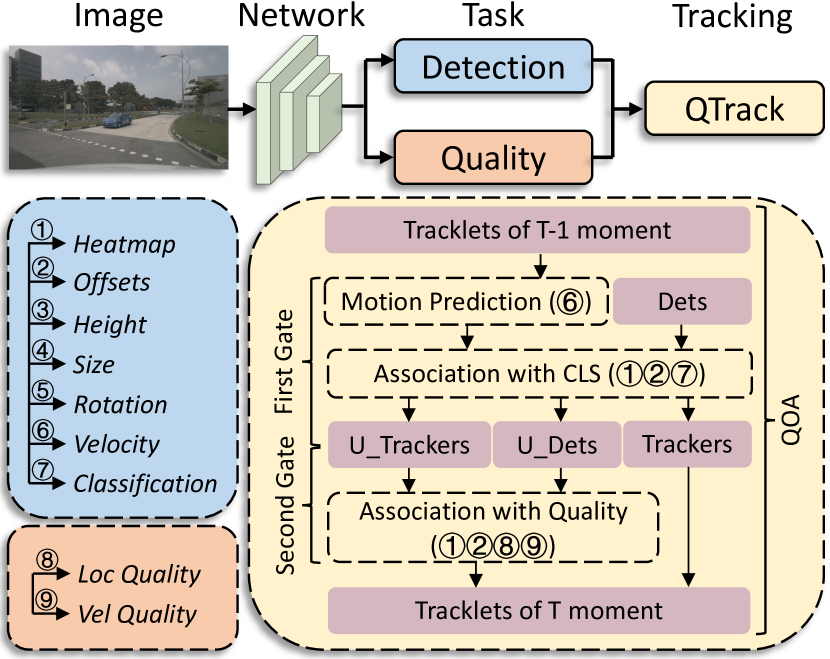
where the depth loss , classification loss and regression loss remain the same setting as the original paper. As illustrated in Fig. 3, the task of the regression branch includes heatmap, offsets, height, size, rotation and velocity.
3.3 Location and Velocity Quality Learning
To effectively estimate the quality of location and velocity, it first needs to define the quality measurement metric. Technically, the box’s center location is calculated by incorporating predicted heatmap and corresponding offsets so that the location quality can be simplified to offset predicted quality. Specially, the offsets and velocity are defined in a 2-dimensional vector space. We introduce a Normalized Gaussian Quality (NGQ) metric to represent their quality. Given a predicted vector and ground truth vector , we formulate NGQ metric as:
| (2) |
where the subscripts and indicate the value in the x and y directions while is a hyper-parameter to control the value distribution of NGQ. We set to 1.0 and 3.0 for location and velocity, respectively. and can be instantiated as predicting offset and velocity. When the prediction is equal to ground truth, NGQ = 1, while the predicted error is larger, NGQ is closer to 0.
After defining the quality, we elaborate on how to learn it. As shown in Fig. 3, we attach a convolution layer for offset and velocity branch to predict location quality and velocity quality , respectively. The quality supervision is conducted by binary cross entropy (BCE) loss:
| (3) | ||||
where is the ground truth quality calculated by Eq. 2. This far, the total loss for our detector is formulated as:
| (4) |
| Methods | Modality | AMOTA | AMOTP | RECALL | MOTA | IDS |
| Validation Split | ||||||
| CenterPoint (Yin, Zhou, and Krahenbuhl 2021) | LiDAR | 0.665 | 0.567 | 69.9% | 0.562 | 562 |
| SimpleTrack (Pang, Li, and Wang 2021) | LiDAR | 0.687 | 0.573 | 72.5% | 0.592 | 519 |
| DEFT (Chaabane et al. 2021) | Camera | 0.201 | N/A | N/A | 0.171 | N/A |
| QD3DT (Hu et al. 2022) | Camera | 0.242 | 1.518 | 39.9% | 0.218 | 5646 |
| TripletTrack (Marinello, Proesmans, and Van Gool 2022) | Camera | 0.285 | 1.485 | N/A | N/A | N/A |
| MUTR3D (Zhang et al. 2022a) | Camera | 0.294 | 1.498 | 42.7% | 0.267 | 3822 |
| QTrack (Ours) | Camera | 0.511 | 1.090 | 58.5% | 0.465 | 1144 |
| Test Split | ||||||
| CenterTrack (Zhou, Koltun, and Krähenbühl 2020) | Camera | 0.046 | 1.543 | 23.3% | 0.043 | 3807 |
| DEFT (Chaabane et al. 2021) | Camera | 0.177 | 1.564 | 33.8% | 0.156 | 6901 |
| Time3D (Li and Jin 2022) | Camera | 0.210 | 1.360 | N/A | 0.173 | N/A |
| QD3DT (Hu et al. 2022) | Camera | 0.217 | 1.550 | 37.5% | 0.198 | 6856 |
| TripletTrack (Marinello, Proesmans, and Van Gool 2022) | Camera | 0.268 | 1.504 | 40.0% | 0.245 | 1044 |
| MUTR3D (Zhang et al. 2022a) | Camera | 0.270 | 1.494 | 41.1% | 0.245 | 6018 |
| PolarDETR (Chen et al. 2022) | Camera | 0.273 | 1.185 | 40.4% | 0.238 | 2170 |
| SRCN3D (Shi et al. 2022) | Camera | 0.398 | 1.317 | 53.8% | 0.359 | 4090 |
| QTrack (Ours) | Camera | 0.480 | 1.107 | 56.9% | 0.431 | 1484 |
| Methods | Backbone | AMOTA | AMOTP | RECALL | MOTA | MOTP | IDS | FRAG | MT | ML |
|---|---|---|---|---|---|---|---|---|---|---|
| BEVDepth + KF | ResNet-50 | 0.303 | 1.337 | 39.7% | 0.284 | 0.705 | 1290 | 780 | 1462 | 3344 |
| BEVDepth + CV | ResNet-50 | 0.325 | 1.276 | 42.8% | 0.300 | 0.710 | 903 | 907 | 1843 | 3299 |
| BEVDepth + SimpleTrack | ResNet-50 | 0.338 | 1.294 | 43.9% | 0.304 | 0.742 | 950 | 904 | 1798 | 3213 |
| BEVDepth + Ours | ResNet-50 | 0.347 | 1.347 | 42.6% | 0.309 | 0.722 | 944 | 1106 | 1758 | 3137 |
| BEVDepth + KF | ResNet-101 | 0.301 | 1.345 | 40.2% | 0.287 | 0.685 | 1444 | 841 | 1591 | 3156 |
| BEVDepth + CV | ResNet-101 | 0.323 | 1.282 | 42.1% | 0.299 | 0.696 | 807 | 885 | 2359 | 3256 |
| BEVDepth + SimpleTrack | ResNet-101 | 0.333 | 1.302 | 42.4% | 0.303 | 0.701 | 887 | 904 | 1835 | 3174 |
| BEVDepth + Ours | ResNet-101 | 0.339 | 1.349 | 42.8% | 0.309 | 0.691 | 1100 | 1187 | 1956 | 2890 |
The overall training procedure is an end-to-end manner while the quality prediction task will not damage the performance of the base detector. Moreover, the quality estimation is used in our proposed Quality-aware Object Association (QOA) module, which will be discussed next section.
3.4 Quality-aware Object Association
After obtaining the quality of the center location and velocity, we have more reference cues to achieve robust and accurate association. To this end, we propose a simple but effective quality-aware object association strategy (QOA). Specifically, QOA sets up two ”gates”. The first gate is the classification confidence score (cls score). We first separate the candidate detection boxes into high score ones and low score ones according to their cls scores. The high score candidates are first associated with the tracklets. Then the unmatched tracklets are associated with the low score candidates. These low score candidates are most caused by occlusion, motion blur, or light weakness, which are easily confused with the miscellaneous boxes. To deal with the issue, the second gate, quality uncertainty score, is introduced. After getting the second association results between the unmatched tracklets and the low score candidates, we then recheck the matched track-det pairs according to the location and velocity quality scores. Only high-quality matched track-det pairs can remain and low-quality pairs are regarded as the mismatch. The pseudo-code of QOA is shown in Algorithm 1.
Benefiting from the quality estimation, QOA does not need a complex motion or appearance model to provide association cues. A simple velocity prediction (CV) is enough (line #15). Hence, we use the velocity of the tracklet at frame to predict the center location at frame and then compute the L2 distance between predictions and candidate detections (line #17 and line #20) as the similarity. At last, we apply the similarity with the Hungarian algorithm to get the association results. Mathematically,
| (5) | ||||
where , represents the center location and velocity of the tracklets at frame . is the candidate detection center location at frame and is the time lag.
4 Experiments
4.1 Datasets and Metrics
Datasets. We mainly evaluate our QTrack on the 3D detection and tracking datasets of nuScenes. nuScenes dataset is a large-scale autonomous driving benchmark that consists of 1000 real-world sequences, 700 sequences for training, 150 for validation, and 150 for the test. Each sequence has roughly 40 keyframes, which are annotated by each sensor (e.g., LiDAR, Radar, and Camera) with a sampling rate of 2 FPS. Each frame includes images from six cameras with a full 360-degree field of view. For the detection task, there are 1.4 M annotated 3D bounding boxes from 10 categories. For the tracking task, it provides 3D tracking bounding boxes from 7 categories.
Metrics. For 3D detection task, we report nuScenes Detection Score (NDS), mean Average Prediction (mAP), as well as five True Positive (TP) metrics including mean Average Translation Error (mATE), mean Average Scale Error (mASE), mean Average Orientation Error (mAOE), mean Average Velocity Error (mAVE), mean Average Attribute Error (mAAE). For 3D tracking task, we report Average Multi-object Tracking Accuracy (AMOTA) and Average Multi-object Tracking Precision (AMOTP). We also report metrics used in 2D tracking task from CLEAR (Bernardin, Elbs, and Stiefelhagen 2006), e.g., MOTA, MOTP, and IDS.
4.2 Implementation Details
Following BEVdepth, we adopt three types of backbone: ResNet-50 (He et al. 2016), ResNet-101, and VoVNet-99 (Initialized from DD3D (Park et al. 2021)) as the image backbone. If not specified, the image size is processed to . The data augmentation includes random cropping, random scaling, random flipping, and random rotation. In addition, we also adopt BEV data augmentations including random scaling, random flipping, and random rotation. We use AdamW as optimizer with learning rate of and batch size of 64. When compared with other methods, QTrack is trained for 24 epochs for ResNet and 20 epochs for VoVNet with CBGS (Zhu et al. 2019).
4.3 Comparision with Preceding SOTAs
Test and validation set. We compare the performance of QTrack with preceding SOTA methods on the nuScenes benchmark. The results are reported in Tab. 1. Our QTrack outperforms all current SOTA methods for the camera-based trackers by a large margin. For both validation and test sets, all reported metrics (e.g., AMOTA, AMOTP, RECALL, IDS, etc.) achieve best performance. Specially, AMOTA result of QTrack first achieves 0.511, which significantly reduces the performance gap between the pure camera and LiDAR-based trackers.
Compare with other post-processing trackers. Tab. 2 illustrates that QTrack outperforms the naive Kalman filter based method and its advanced variant from SimpleTrack (Pang, Li, and Wang 2021) by employing identical 3D detector and backbone settings. Moreover, our method only needs simple operations (i.e., Matrix multiplication and addition) for tracking procedure, while Kalman filter based ones need relatively complex operation like matrix transpose and the complex process for adjusting hyper-parameters. The overall tracking framework is significantly efficient and will not trigger a serious latency, which is fatal in a real perception scenario (Yang et al. 2022a, b).
| Backbone | MF | CLS | Q. | AMOTA | AMOTP | MOTA | IDS |
|---|---|---|---|---|---|---|---|
| ResNet-50 | ✗ | 29.1 | 1.314 | 26.7 | 1488 | ||
| ✓ | 30.7 | 1.394 | 28.3 | 1748 | |||
| ✓ | ✓ | 31.3 | 1.390 | 28.5 | 1559 | ||
| ✓ | 32.5 | 1.276 | 30.0 | 903 | |||
| ✓ | 34.1 | 1.348 | 30.5 | 1141 | |||
| ✓ | ✓ | 34.7 | 1.347 | 30.9 | 944 | ||
| ResNet-101 | ✗ | 29.1 | 1.314 | 26.7 | 1488 | ||
| ✓ | 31.2 | 1.389 | 28.4 | 1622 | |||
| ✓ | ✓ | 31.8 | 1.386 | 29.1 | 1638 | ||
| ✓ | 32.3 | 1.282 | 30.9 | 1100 | |||
| ✓ | 33.2 | 1.352 | 30.3 | 1053 | |||
| ✓ | ✓ | 33.9 | 1.349 | 30.9 | 1100 | ||
| VoVNet-99 | ✗ | 38.8 | 1.220 | 35.3 | 1670 | ||
| ✓ | 40.4 | 1.266 | 36.9 | 1575 | |||
| ✓ | ✓ | 40.8 | 1.259 | 37.0 | 1527 | ||
| ✓ | 41.7 | 1.177 | 37.3 | 914 | |||
| ✓ | 42.2 | 1.236 | 38.1 | 1125 | |||
| ✓ | ✓ | 42.6 | 1.228 | 38.3 | 1076 |
| MF | VQ | LQ | AMOTA | AMOTP | MOTA | IDS |
|---|---|---|---|---|---|---|
| ✗ | 40.4 | 1.266 | 36.9 | 1575 | ||
| ✓ | 40.1 | 1.269 | 36.6 | 1680 | ||
| ✓ | 40.5 | 1.264 | 37.3 | 1445 | ||
| ✓ | ✓ | 40.8 | 1.259 | 37.0 | 1527 | |
| ✓ | 42.2 | 1.236 | 38.1 | 1125 | ||
| ✓ | 41.9 | 1.239 | 38.0 | 999 | ||
| ✓ | 42.2 | 1.235 | 38.2 | 1023 | ||
| ✓ | ✓ | 42.6 | 1.228 | 38.3 | 1076 |
4.4 Ablation Study
In this subsection, we verify the effectiveness of the proposed strategies separately through ablation studies. All the experiments are conducted on the nuScenes val set.
Analysis of the components of QTrack. In this part, we verify the effectiveness of various components in QTrack through an ablation study. As shown in Tab. 3, the first row of the table shows baseline performance for tracking when using BEVDepth detections followed by a simple velocity association step (CV method). We can observe that the two gates of QOA can both develop the tracking performance in the all settings (ResNet-50, ResNet-101 or VoVNet-99, single-frame or multi-frame), which means that the filter for the low-quality association results is necessary. Furthermore, we can observe that the metric of IDS increases when applying the first gate by classification confidence score. This phenomenon shows that only considering confidence score inevitably introduces low-quality bounding boxes, which causes bad association cases. Therefore, the second gate, quality score, can provide a fine-grained reference to achieve a better association trade-off.
Analysis of the location and velocity quality for tracking. In this part, we conduct an in-depth analysis on the location and velocity quality score for the association process. As mentioned before, location and velocity quality scores are obtained by the quality branch. Then they are both regarded as the reference clues to filter the low classification confidence association results in QOA. We verify the performance of only using one of them as the second gate of QOA, and the results are reported in Tab. 4. As shown, only using one of the location and velocity quality scores does not contribute to the tracking performance, which confirms our analysis that the location and velocity quality is not aligned and we should take both of them into consideration.
| Extra Branch | mAP | NDS | CV | SimpleTrack |
|---|---|---|---|---|
| None | 0.3579 | 0.4826 | 0.326 | 0.337 |
| Appearance | 0.3522 | 0.4798 | 0.315 | 0.328 |
| Relative Drop | -0.57% | -0.38% | -1.1% | -0.9% |
| Quality | 0.3585 | 0.4831 | 0.325 | 0.338 |
| Relative Drop | +0.06% | +0.05% | -0.1% | +0.1% |
Influence on base 3D detector. As shown in Tab. 5, it proves that adding quality prediction branch does not affect the performance of base 3D detector. This is an extremely important property since post-processing trackers normally rely on the super performance of detector. Going one step further, we report the tracking performance by employing existing CV and SimpleTrack scheme. It reveals that tracking performance will not be affected by our quality branch, which agree with our designing purpose of Sec. 1. Then, we explore to append a appearance branch for extracting instance wised appearance embedding, which implement is the same as (Zhang et al. 2021). The results show that slight performance degradation (nearly 0.5%) is triggered on detection task, but it significantly damages the performance of tracking task by nearly 1.0%. It reflects that our method is more effective and efficient.
4.5 Discussion and Future Work
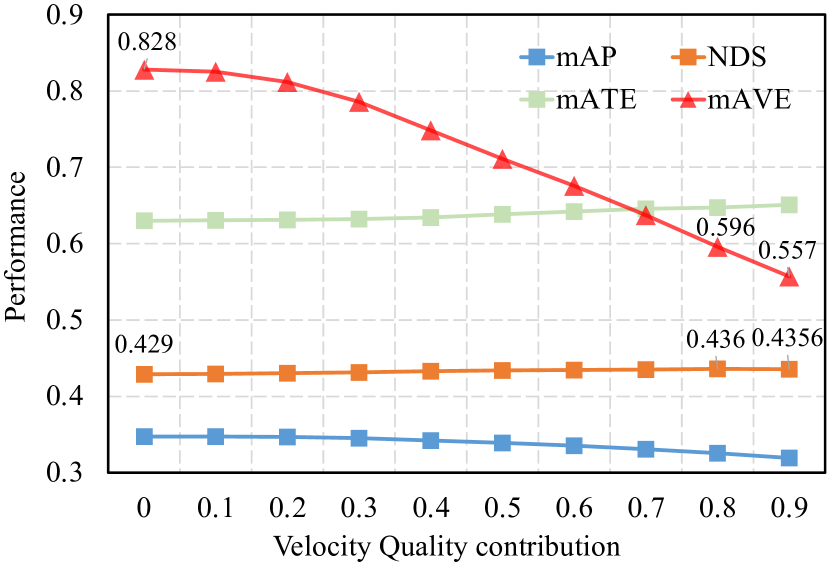
Inspired by (Jiang et al. 2018; Wu, Li, and Wang 2020; Yang et al. 2022d), we explore to incorporate velocity quality with classification score as , which is adopted to act as threshold metric in NMS procedure. Technically, we formulate in Eq. 6, in which is a hyper-parameter to control the contribution of .
| (6) |
As shown in Fig. 4, we plot the four performance metrics of detection task by controlling . It reflects that as contribution of becomes bigger, mAVE drops dramatically. However, it also brings about inevitable performance degradation for mAP and mATE metrics. NDS, as a comprehensive metric, becomes better and then gets worse as changes larger, which is actually a trade-off between location error and velocity error. This phenomenon agrees with our viewpoint in Sec. 1, i.e., the quality of these two prediction tasks are not align. Combining the performance of detection and tracking tasks with respect to above imbalance issue, it exposes a challenge: how to design a method to simultaneously predict location (or 3D box) and velocity well? This challenge can help further boost performance of 3D detection task or other downstream tasks like 3D MOT.
5 Conclusion
In this paper, we analyze the imbalance prediction quality distribution of location and velocity. It motivates us to propose a Quality-aware Object Association (QOA) method to alleviate the imbalance issue for 3D multi-object tracking (3D MOT). To this end, we introduce Normalized Gaussian Quality (NGQ) metric to measure the predicted quality of location and velocity, and structure an effective module for quality learning. Afterwards, we further present QTrack, an “tracking by detection” framework for 3D MOT in multi-view camera scene, which incorporats with QOA to perform tracking procedure. The extensive experiments demonstrate the efficacy and robustness of our method. Finally, we release a challenge to inspire more research to focus on the imbalance between localization and velocity qualities for both 3D detection and tracking tasks.
References
- Bernardin, Elbs, and Stiefelhagen (2006) Bernardin, K.; Elbs, A.; and Stiefelhagen, R. 2006. Multiple object tracking performance metrics and evaluation in a smart room environment. In Sixth IEEE International Workshop on Visual Surveillance, in conjunction with ECCV, volume 90. Citeseer.
- Caesar et al. (2020) Caesar, H.; Bankiti, V.; Lang, A. H.; Vora, S.; Liong, V. E.; Xu, Q.; Krishnan, A.; Pan, Y.; Baldan, G.; and Beijbom, O. 2020. nuscenes: A multimodal dataset for autonomous driving. In Proceedings of the IEEE/CVF conference on computer vision and pattern recognition, 11621–11631.
- Chaabane et al. (2021) Chaabane, M.; Zhang, P.; Beveridge, J. R.; and O’Hara, S. 2021. Deft: Detection embeddings for tracking. arXiv preprint arXiv:2102.02267.
- Chen et al. (2022) Chen, S.; Wang, X.; Cheng, T.; Zhang, Q.; Huang, C.; and Liu, W. 2022. Polar parametrization for vision-based surround-view 3d detection. arXiv preprint arXiv:2206.10965.
- Han et al. (2022) Han, S.; Huang, P.; Wang, H.; Yu, E.; Liu, D.; and Pan, X. 2022. Mat: Motion-aware multi-object tracking. Neurocomputing, 476: 75–86.
- He et al. (2016) He, K.; Zhang, X.; Ren, S.; and Sun, J. 2016. Deep residual learning for image recognition. In Proceedings of the IEEE conference on computer vision and pattern recognition, 770–778.
- Hu et al. (2022) Hu, H.-N.; Yang, Y.-H.; Fischer, T.; Darrell, T.; Yu, F.; and Sun, M. 2022. Monocular quasi-dense 3d object tracking. IEEE Transactions on Pattern Analysis and Machine Intelligence.
- Huang et al. (2021) Huang, J.; Huang, G.; Zhu, Z.; and Du, D. 2021. Bevdet: High-performance multi-camera 3d object detection in bird-eye-view. arXiv preprint arXiv:2112.11790.
- Huang et al. (2019) Huang, Z.; Huang, L.; Gong, Y.; Huang, C.; and Wang, X. 2019. Mask scoring r-cnn. In Proceedings of the IEEE/CVF conference on computer vision and pattern recognition, 6409–6418.
- Jiang et al. (2018) Jiang, B.; Luo, R.; Mao, J.; Xiao, T.; and Jiang, Y. 2018. Acquisition of localization confidence for accurate object detection. In Proceedings of the European conference on computer vision (ECCV), 784–799.
- Kalman (1960) Kalman, R. E. 1960. A new approach to linear filtering and prediction problems. Transactions of the ASME–Journal of Basic Engineering 82(Series D), 35–45.
- Lang et al. (2019) Lang, A. H.; Vora, S.; Caesar, H.; Zhou, L.; Yang, J.; and Beijbom, O. 2019. Pointpillars: Fast encoders for object detection from point clouds. In Proceedings of the IEEE/CVF conference on computer vision and pattern recognition, 12697–12705.
- Li and Jin (2022) Li, P.; and Jin, J. 2022. Time3D: End-to-End Joint Monocular 3D Object Detection and Tracking for Autonomous Driving. In Proceedings of the IEEE/CVF Conference on Computer Vision and Pattern Recognition, 3885–3894.
- Li et al. (2022a) Li, Y.; Ge, Z.; Yu, G.; Yang, J.; Wang, Z.; Shi, Y.; Sun, J.; and Li, Z. 2022a. BEVDepth: Acquisition of Reliable Depth for Multi-view 3D Object Detection. arXiv preprint arXiv:2206.10092.
- Li et al. (2022b) Li, Z.; Qu, Z.; Zhou, Y.; Liu, J.; Wang, H.; and Jiang, L. 2022b. Diversity Matters: Fully Exploiting Depth Clues for Reliable Monocular 3D Object Detection. In Proceedings of the IEEE/CVF Conference on Computer Vision and Pattern Recognition, 2791–2800.
- Li et al. (2022c) Li, Z.; Wang, W.; Li, H.; Xie, E.; Sima, C.; Lu, T.; Yu, Q.; and Dai, J. 2022c. BEVFormer: Learning Bird’s-Eye-View Representation from Multi-Camera Images via Spatiotemporal Transformers. arXiv preprint arXiv:2203.17270.
- Liu et al. (2022) Liu, Y.; Wang, T.; Zhang, X.; and Sun, J. 2022. Petr: Position embedding transformation for multi-view 3d object detection. arXiv preprint arXiv:2203.05625.
- Marinello, Proesmans, and Van Gool (2022) Marinello, N.; Proesmans, M.; and Van Gool, L. 2022. TripletTrack: 3D Object Tracking Using Triplet Embeddings and LSTM. In Proceedings of the IEEE/CVF Conference on Computer Vision and Pattern Recognition, 4500–4510.
- Pang, Li, and Wang (2021) Pang, Z.; Li, Z.; and Wang, N. 2021. Simpletrack: Understanding and rethinking 3d multi-object tracking. arXiv preprint arXiv:2111.09621.
- Park et al. (2021) Park, D.; Ambrus, R.; Guizilini, V.; Li, J.; and Gaidon, A. 2021. Is pseudo-lidar needed for monocular 3d object detection? In Proceedings of the IEEE/CVF International Conference on Computer Vision, 3142–3152.
- Shi et al. (2020) Shi, S.; Guo, C.; Jiang, L.; Wang, Z.; Shi, J.; Wang, X.; and Li, H. 2020. Pv-rcnn: Point-voxel feature set abstraction for 3d object detection. In Proceedings of the IEEE/CVF Conference on Computer Vision and Pattern Recognition, 10529–10538.
- Shi, Wang, and Li (2019) Shi, S.; Wang, X.; and Li, H. 2019. Pointrcnn: 3d object proposal generation and detection from point cloud. In Proceedings of the IEEE/CVF conference on computer vision and pattern recognition, 770–779.
- Shi et al. (2022) Shi, Y.; Shen, J.; Sun, Y.; Wang, Y.; Li, J.; Sun, S.; Jiang, K.; and Yang, D. 2022. SRCN3D: Sparse R-CNN 3D Surround-View Camera Object Detection and Tracking for Autonomous Driving. arXiv preprint arXiv:2206.14451.
- Tian et al. (2019) Tian, Z.; Shen, C.; Chen, H.; and He, T. 2019. Fcos: Fully convolutional one-stage object detection. In Proceedings of the IEEE/CVF international conference on computer vision, 9627–9636.
- Vaswani et al. (2017) Vaswani, A.; Shazeer, N.; Parmar, N.; Uszkoreit, J.; Jones, L.; Gomez, A. N.; Kaiser, Ł.; and Polosukhin, I. 2017. Attention is all you need. Advances in neural information processing systems, 30.
- Wang et al. (2021) Wang, T.; Zhu, X.; Pang, J.; and Lin, D. 2021. Fcos3d: Fully convolutional one-stage monocular 3d object detection. In Proceedings of the IEEE/CVF International Conference on Computer Vision, 913–922.
- Wang et al. (2022) Wang, Y.; Guizilini, V. C.; Zhang, T.; Wang, Y.; Zhao, H.; and Solomon, J. 2022. Detr3d: 3d object detection from multi-view images via 3d-to-2d queries. In Conference on Robot Learning, 180–191. PMLR.
- Weng et al. (2020a) Weng, X.; Wang, J.; Held, D.; and Kitani, K. 2020a. 3d multi-object tracking: A baseline and new evaluation metrics. In 2020 IEEE/RSJ International Conference on Intelligent Robots and Systems (IROS), 10359–10366. IEEE.
- Weng et al. (2020b) Weng, X.; Wang, Y.; Man, Y.; and Kitani, K. M. 2020b. Gnn3dmot: Graph neural network for 3d multi-object tracking with 2d-3d multi-feature learning. In Proceedings of the IEEE/CVF Conference on Computer Vision and Pattern Recognition, 6499–6508.
- Wu, Li, and Wang (2020) Wu, S.; Li, X.; and Wang, X. 2020. IoU-aware single-stage object detector for accurate localization. Image and Vision Computing, 97: 103911.
- Yan, Mao, and Li (2018) Yan, Y.; Mao, Y.; and Li, B. 2018. Second: Sparsely embedded convolutional detection. Sensors, 18(10): 3337.
- Yang et al. (2022a) Yang, J.; Liu, S.; Li, Z.; Li, X.; and Sun, J. 2022a. Real-time Object Detection for Streaming Perception. In Proceedings of the IEEE/CVF Conference on Computer Vision and Pattern Recognition, 5385–5395.
- Yang et al. (2022b) Yang, J.; Liu, S.; Li, Z.; Li, X.; and Sun, J. 2022b. StreamYOLO: Real-time Object Detection for Streaming Perception. arXiv preprint arXiv:2207.10433.
- Yang et al. (2022c) Yang, J.; Song, L.; Liu, S.; Li, Z.; Li, X.; Sun, H.; Sun, J.; and Zheng, N. 2022c. DBQ-SSD: Dynamic Ball Query for Efficient 3D Object Detection. arXiv preprint arXiv:2207.10909.
- Yang et al. (2022d) Yang, J.; Wu, S.; Gou, L.; Yu, H.; Lin, C.; Wang, J.; Wang, P.; Li, M.; and Li, X. 2022d. SCD: A stacked carton dataset for detection and segmentation. Sensors, 22(10): 3617.
- Yin, Zhou, and Krahenbuhl (2021) Yin, T.; Zhou, X.; and Krahenbuhl, P. 2021. Center-based 3d object detection and tracking. In Proceedings of the IEEE/CVF conference on computer vision and pattern recognition, 11784–11793.
- Yu, Li, and Han (2022) Yu, E.; Li, Z.; and Han, S. 2022. Towards Discriminative Representation: Multi-view Trajectory Contrastive Learning for Online Multi-object Tracking. In Proceedings of the IEEE/CVF Conference on Computer Vision and Pattern Recognition, 8834–8843.
- Yu et al. (2022) Yu, E.; Li, Z.; Han, S.; and Wang, H. 2022. Relationtrack: Relation-aware multiple object tracking with decoupled representation. IEEE Transactions on Multimedia.
- Zhang et al. (2022a) Zhang, T.; Chen, X.; Wang, Y.; Wang, Y.; and Zhao, H. 2022a. MUTR3D: A Multi-camera Tracking Framework via 3D-to-2D Queries. In Proceedings of the IEEE/CVF Conference on Computer Vision and Pattern Recognition, 4537–4546.
- Zhang et al. (2022b) Zhang, Y.; Sun, P.; Jiang, Y.; Yu, D.; Weng, F.; Yuan, Z.; Luo, P.; Liu, W.; and Wang, X. 2022b. ByteTrack: Multi-Object Tracking by Associating Every Detection Box. In Proceedings of the European Conference on Computer Vision (ECCV).
- Zhang et al. (2021) Zhang, Y.; Wang, C.; Wang, X.; Zeng, W.; and Liu, W. 2021. Fairmot: On the fairness of detection and re-identification in multiple object tracking. International Journal of Computer Vision, 129(11): 3069–3087.
- Zhou, Koltun, and Krähenbühl (2020) Zhou, X.; Koltun, V.; and Krähenbühl, P. 2020. Tracking objects as points. In European Conference on Computer Vision, 474–490. Springer.
- Zhu et al. (2019) Zhu, B.; Jiang, Z.; Zhou, X.; Li, Z.; and Yu, G. 2019. Class-balanced grouping and sampling for point cloud 3d object detection. arXiv preprint arXiv:1908.09492.