Doc-GCN: Heterogeneous Graph Convolutional Networks for Document Layout Analysis
Abstract
Recognizing the layout of unstructured digital documents is crucial when parsing the documents into the structured, machine-readable format for downstream applications. Recent studies in Document Layout Analysis usually rely on visual cues to understand documents while ignoring other information, such as contextual information or the relationships between document layout components, which are vital to boost better layout analysis performance. Our Doc-GCN presents an effective way to harmonize and integrate heterogeneous aspects for Document Layout Analysis. We construct different graphs to capture the four main features aspects of document layout components, including syntactic, semantic, density, and appearance features. Then, we apply graph convolutional networks to enhance each aspect of features and apply the node-level pooling for integration. Finally, we concatenate features of all aspects and feed them into the 2-layer MLPs for document layout component classification. Our Doc-GCN achieves state-of-the-art results on three widely used DLA datasets: PubLayNet, FUNSD, and DocBank. The code will be released at https://github.com/adlnlp/doc_gcn
1 Introduction
Digital documents (incl. Scanned Document Images and PDF files) are popular and convenient for storing written textual information, so almost 2.5 trillion documents worldwide are available in the digital format Zhong et al. (2019). However, it is challenging to automatically recognize the layout and components of these unstructured digital documents and extract meaningful information using this format. For example, the financial office would require the scanned document image after their client signed. It is then crucial to recognize and extract the form component, such as the form title, person name, and the date the document is signed. This task is widely called Document Layout Analysis (DLA). The DLA task aims at understanding the documents from either 1) the physical analysis by detecting the document structure and the boundaries of each layout region or 2) the logical analysis by categorizing the detected layout components (segments) into the predefined document element classes, such as Title, Date, Author, and Figure (Binmakhashen and Mahmoud, 2019). In this research, we focus on the logical DLA task to classify the different layout components of PDF documents by understanding the relationships between components. Traditional deep learning-based DLA approaches mainly focus on processing visual features of layout components (Soto and Yoo, 2019; Augusto Borges Oliveira and Palhares Viana, 2017; Li et al., 2020a) using CNN-based models. Some recent studies started to use texts to solve the problem with the support of semantic information for each layout component (Li et al., 2020b; Xu et al., 2020). However, applying visual and textual features is not enough to analyze the characteristics and relations of document layout components in order to classify them. In this paper, we try to fill this gap by defining and proposing: 1) Layout Components Characteristic Representation and 2) Relation Representation between components.
The first question would be ‘What would be the best aspects to represent the characteristics of different document layout components?’. The text density/sparsity in each document component is a valuable feature. For example, a paragraph is more dense and usually contains more texts than a table. Moreover, syntactic information can be a key characteristic. It is obvious that a title mainly consists of noun phrases only, whereas a paragraph contains more sentences with the noun and verb phrases. Hence, in this research, apart from the common visual features and semantic text features used by previous works, we propose the four major aspects, including text density, components appearance, syntactic and semantic information of textual contents, of each component in order to let the model conduct more comprehensive learning of the Documents properties. Another question would be ‘How to represent the relation among document layout components?’ Most DLA studies did not apply multiple aspects of features. Even if applied (Soto and Yoo, 2019; Xu et al., 2020), those features are integrated via simple concatenations and do not consider the influences of relationships between layout components on the classification performances. The characteristics of each component/segment are not enough to analyze the whole document layout and its corresponding components. Assume a ‘text’ component is detected based on its characteristics, but it is more accurate to classify it as the ‘figure caption’ if it is right above or below a figure. Thus, capturing and encoding the relationships between layout components is crucial for better layout analysis.
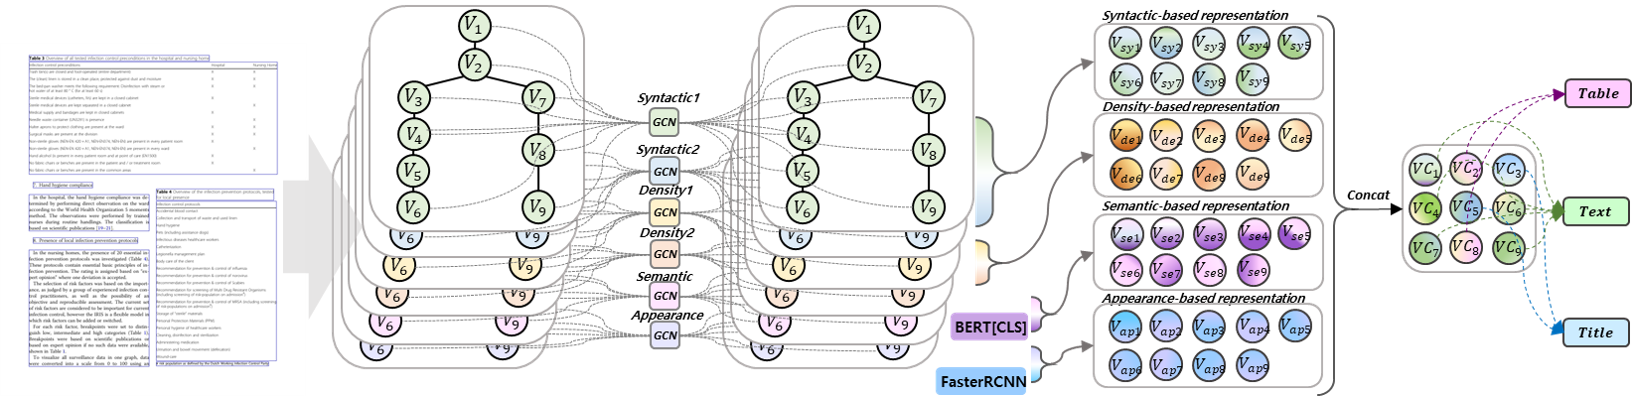
In this paper, we propose a novel Heterogeneous Graph Convolutional Network (GCN)-based DLA model, Doc-GCN, on a document page level, taking the document layout component (segment) as nodes in the graph and encoding the relative positional and structural relations between layout components. We first construct six different graphs, each encoding one aspect of features among the layout components’ syntactic, semantic, text density, and visual features. The syntactic and density aspects have two graph variants based on the different node embedding initialization methods. We use the GCN to update the node embedding by learning from its intimate neighbors, and the node-level pooling is then applied to integrate the graph variants. We concatenate the updated features of each aspect, getting the final layout component representation for the final classification of layout component types.
In summary, the contributions of our work are as follows:
-
•
To the best of our knowledge, this is the first attempt to apply heterogeneous aspects of Document Layout Analysis.
-
•
Doc-GCN is the first to propose using multi-aspect Graph Convolutional Networks for harmonizing the characteristics and relationships among document layout components (segments).
-
•
Doc-GCN achieved the state-of-the-art performance on three widely used DLA datasets, PubLayNet, FUNSD, and DocBank.
2 Related Work
2.1 Document Layout Analysis
In the 1990s, rule-based methods Klink and Kieninger (2001); Fisher et al. (1990); Niyogi and Srihari (1986) were widely used for the DLA tasks until the rise of deep learning. Zhong et al. (2019) used Faster RCNN Ren et al. (2015) and Mask RCNN He et al. (2017) as the basic deep learning models for DLA task. Recent works have extensions. Soto and Yoo (2019) added the size of the proposed Region of Interest (ROI) and normalized page number as the additional contextual information to the pooled feature vectors for both classification and regression network of Faster RCNN. Augusto Borges Oliveira and Palhares Viana (2017) proposed the 1-D CNN with the parallel operation of horizontal and vertical projection. Li et al. (2020a) proposed a model based on the Feature Pyramid Networks (FPN) object detector to solve the cross-domain document layout classifications.
Some DLA works integrated not only visual features but also textual features. Xu et al. (2020) proposed a pretrained model that integrated each token’s positional and text embeddings with the corresponding image embeddings. Xu et al. (2021) then applied additional pretraining tasks to enhance the multi-modality interactions further and used a spatial-aware attention mechanism to capture the relative positional relationship between different layout components. Gu et al. (2021) proposed the pretraining framework with a cross-attention transformer to boost the more substantial alignment between visual and textual features for each document element region. Li et al. (2020b) proposed a new dataset on the token-level where each token is annotated into a layout element class and experimented with this dataset with pretrained language models: BERT Devlin et al. (2019) and RoBERTa Liu et al. (2019) by inputting the sequence of token embeddings with the corresponding bounding boxes. Zhang et al. (2021) used a relation module upon the multimodal representations integrated from vision and semantic features to detect the relations between different components.
However, understanding the vision and semantic aspects of individual objects/regions is not enough to analyze the document layout and components. It is critical to consider the influences of relationships between document layout components. This is very similar to the trend that we can see in the most visual-language tasks Long et al. (2022a). For example, the table caption should be around the table, and each component should be semantically related. Besides, it is also important to provide the better interpretation of the DLA prediction semantically, which has been considered as lot of NLP tasks Luo et al. (2021).
2.2 Graph Convolutional Networks
Graph Convolutional Networks (GCN) Kipf and Welling (2016) is a type of Graph Neural Network which applies convolution over graph structures, and it has been applied to many Natural Language Processing (NLP) tasks. For example, TextGCN Yao et al. (2019) and MEGCN Wang et al. (2022a) focus on the text classification by representing words and documents as graph nodes, and TensorGCN Liu et al. (2020b) captures their relations in different aspects, including semantic, syntactic, and sequential aspects. D-GCN Chen et al. (2020) performs sentiment analysis jointly with aspect extraction for graph-based modeling. Hier-GCN Cai et al. (2020) proposes a hierarchical GCN to model the inner- and inter-relations among multiple aspect categories and sentiments. InducT-GCN Wang et al. (2022b) enables the inductive GCN learning model, which improves the performance and reduces the time complexicity.
Such graph-based approach is also widely applied to multimodal tasks, especially for visual question answering Huang et al. (2020); Luo et al. (2020), text-to-image generation Johnson et al. (2018); Han et al. (2020), and text-image matching Liu et al. (2020a); Long et al. (2022b). It receives lots of attention in converting multiple modalities and aspects into structured graphs and enhancing joint learning. Some document-based analysis works, such as document dating Vashishth et al. (2018), apply the GCN-based document dating approach by jointly exploiting the document’s syntactic and temporal graph structures. Wang et al. (2022c) also uses two-stage GCN classifiers for line splitting and clustering for paragraph recognition in documents. In this work, we apply GCN to the DLA task by joint-learning different aspects of document layouts and capturing the relationship between layout components.
3 Doc-GCN
We propose a graph-based network Doc-GCN to encode and integrate the different aspects of document layout components. For each PDF page with document layout components, we construct six different graphs: , , , , and , capturing the features of all the document layout components in the page from four aspects: density, appearance, syntactic and semantic. Each graph consists of a set of nodes , a set of edges , and an adjacency matrix . We regard each layout component of the page as a node in a graph. We segment each layout component by its bounding box. Different node embedding initialization and edge connection methods are applied for different graphs to match the characteristics of different feature aspects and capture different node relationships. The Graph Convolution Network (GCN) is then trained to update the node embeddings by learning from the neighbors.
3.1 Preliminaries
GCN Kipf and Welling (2016) is a convolutional neural network that operates directly on a graph to update the node embeddings by learning from the neighbors of each node. Given an initial node embedding matrix consisting of node features of size , GCN will conduct the propagation through layers based on the rule in Equation 1.
| (1) |
The node embedding matrix will be updated from to after every GCN layer, where indicates the layer number. represents the normalized symmetric adjacency matrix where and is the identity matrix for self-connection inclusion. is the diagonal node degree matrix with and is the trainable weight matrix associated with the -th layer. denotes the activation function that can be different for different GCN layers.
3.2 Graphs Construction
3.2.1 Density-aspect Graph111Details of density and appearance graph construction procedure can be found in Appendix A.1
Text density can be a valuable characteristic in distinguishing different document layout components. For example, a paragraph usually contains more compact texts than a table with text in a sparser distribution. We construct two density-aspect graphs and to encode the text density features of each layout component based on the text density ratio and the absolute character numbers respectively.
We calculate the text density ratio for each layout component as the division between the number of character-level tokens it contains and the area size of its bounding box as in Equation 5:
| (2) |
Given a bounding box of a layout component with the top left coordinates and the bottom right coordinates , the area size is calculated as . We use the positional encoding approach (Vaswani et al., 2017) to project the density ratio and the absolute character numbers of each layout component into a higher dimension to get the initialized node embedding for each density graph. The initial node embeddings of all layout components in the document page form the initial node embedding matrices of and . As per Equation 3, denotes the value of density ratio or the absolute character numbers of each node, and is the th dimension of . The value at th dimension would change along with the odevity of for any offset .
| (3) |
We connect each node with its closest two neighbors with the smallest gap distance between their corresponding boxes. The edge weight is set to be the inverse distance value to emphasize the positional relationship between closer nodes. For a node with bounding box (), we calculate its vertical distance values with other bounding box () that is vertically under it by or for bounding box that is vertically above it. This yields a set of distance values , we connect the node with other two nodes that have the two smallest values . For a two-column PDF page, in addition to the set of , we also calculate the horizontal distance value between and a horizontally aligned bounding box with coordinates that has the smallest vertical gap distance. We then connect the node with the other two nodes with the smallest distance values among the set of and .
3.2.2 Appearance-aspect Graph
To learn and encode the appearance properties, such as the color and font size, of layout components in a PDF page, we use a pretrained Faster-RCNN model to extract the appearance feature based on the bounding box of layout component as the initial embedding for each node in . We apply the same method of the edge connection and edge value setup as that for the density-aspect graphs in Section 3.2.1.
3.2.3 Syntactic-aspect Graph333Details of syntactic and semantic graph generation can be found in Appendix A.2
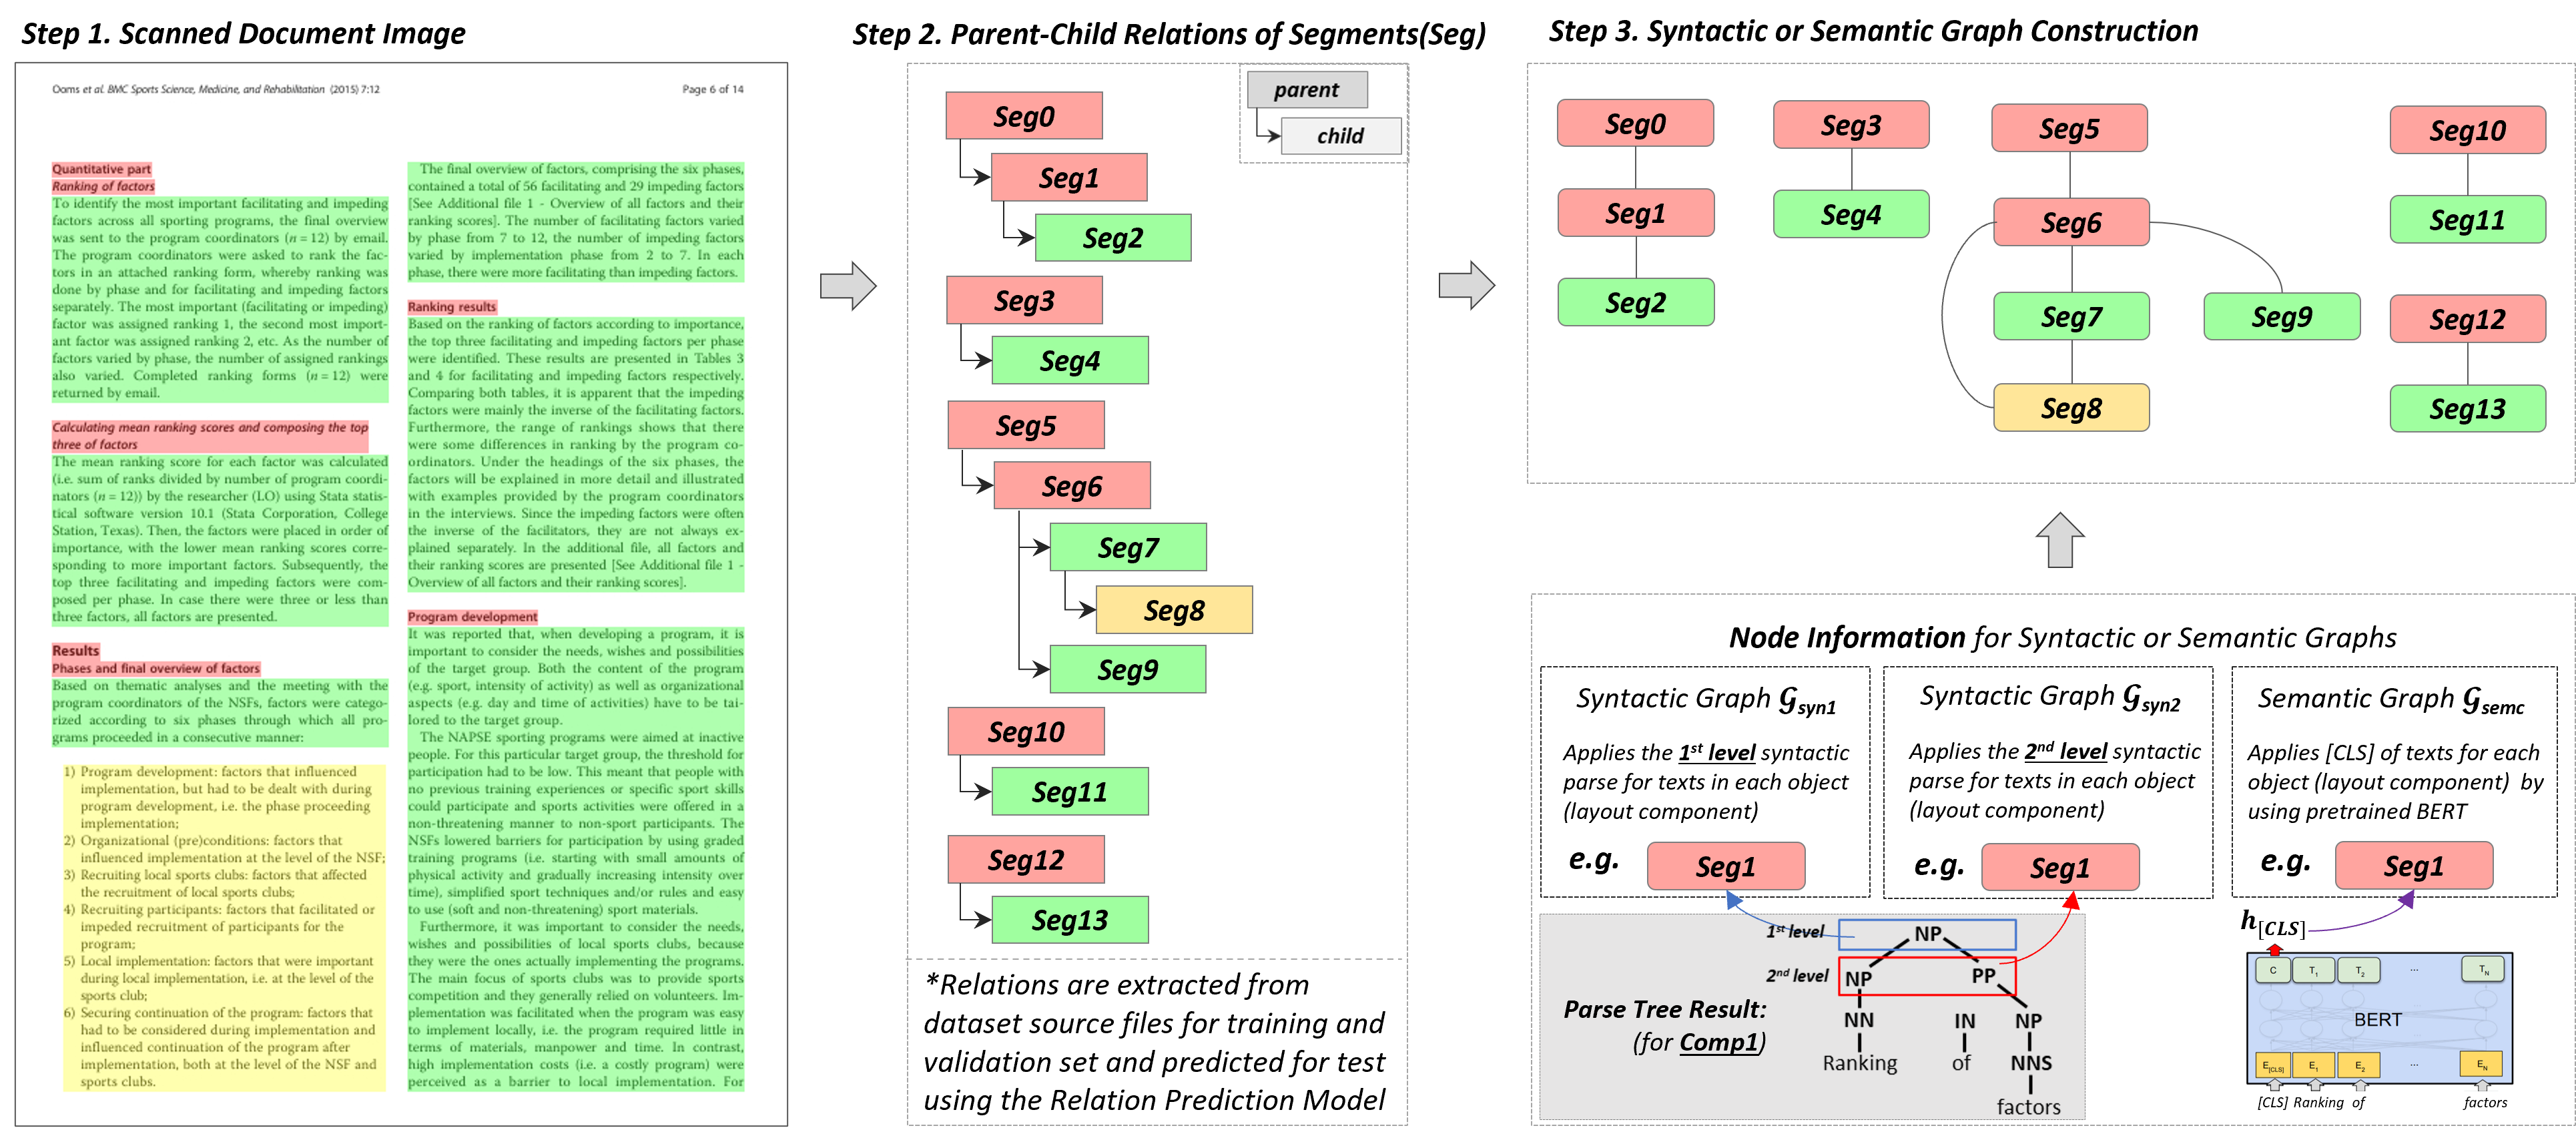
To comprehensively encode the syntactic features, we use the constituency parser (Kitaev and Klein, 2018) to extract both the first-level and second-level syntactic parse of the texts in each layout component and construct two variants of the syntactic-aspect graphs: and respectively. The first-level parse for each layout component contains only one syntactic symbol, while the second-level parse could be a sequence of different syntactic symbols. For example, for an article title ‘Vitrification preserves chromatin integrity, bioenergy potential and oxidative parameters in mouse embryos’, the first-level parse is (S) and the second-level parse is a sequence of (NP, VP). We use the same positional encoding as in Equation 3 to project a 768-dim vector for each syntactic symbol based on their unique indexes, resulting in a sequence of syntactic embeddings for the sequence of parse for each layout component. We then feed this syntactic embedding sequence to a single-layer Bi-LSTM, and extract the last hidden state as the initialized node embedding for . Since there is only one syntactic symbol for the texts in each layout component for the first-level parse, we pad the single symbol embedding to the sequence of length for Bi-LSTM input, and get the initialized node embeddings for . For both and , we connect every two nodes in the graph and set binary edge value based on the existence of a parent-child relationship between every two layout components.
For the training and validation, we use the parent-child relations extracted from the document source files provided in the datasets. We apply the OCR detection to the cropped image of each document layout component. Based on the detected OCR tokens and texts in document source files, we use fuzzy string matching and a reading order assigning method proposed by Ding et al. (2022) to map each layout component with the corresponding element in the XML/ LaTeX source files for PubLayNet/DocBank and identify the parent-child relations based on the hierarchical structure embodied in these source files. We then train a transformer-based relation prediction model on the training and validation set utilizing those extracted parent-child relations and predict the parent-child relations for the test set 555Details of the parent-child relation extraction and transformer-based relation prediction model are provided in Appendix A.2 and Appendix A.3.
3.2.4 Semantic-aspect Graph
We use the pretrained BERT model (Devlin et al., 2019) to encode the semantic features of each layout component to construct and extract the hidden state of the special token , , as the initial node embedding of . We apply the same method for the edge connection and edge value setup as for the syntactic-aspect graphs in Section 3.2.3.
3.3 Graph Embedding Learning
After the graph construction, we apply the GCN learning on each graph to update the node representations that preserve the four aspects of the layout components’ properties by learning and integrating information from the neighbor nodes. For each graph {} where denotes the individual PDF page of the dataset, there is an associated initial node embedding matrix , where as defined in Section 3.2.
We feed these initialized node embedding matrices to GCN and update the weight matrices by optimizing the category prediction of each component node following the propagation rules as in Equation 1. After the training, we again feed each graph into the trained GCN and extract the hidden layer node representations out, resulting in an updated node embedding matrix for each graph , where denotes the number of components in this PDF page and is the dimension of each updated node embedding.
3.4 Multi-aspect Classification
To synthesize the six graphs to four graphs with each representing one aspect of the layout components, we apply a node-level max pooling over the updated node embedding matrix of the graph variants for each type of the graphs, yielding the new node embedding matrix of each aspect , where .
| (4) |
Specifically, as per Equation 4, for syntactic-aspect and density-aspect graphs, we conduct the max pooling over the learned node representations () and (). For semantic-aspect and appearance-aspect graphs that consists of only one graph variant, we apply the node-level max pooling over the learned node embedding matrix and respectively with the initial node embedding matrix and that contains the fine-tuned , where and are projected into a -dimensional features via fully connected layer first. We then concatenate each of the ultimate aspects features and feed it to the 2-layer MLPs for the final classification of each document layout component in each PDF page. Our classifier is optimized based on the standard .
4 Evaluation Setup
4.1 Datasets
We conducted our experiments on three publicly available document layout analysis datasets: PubLayNet (Zhong et al., 2019), FUNSD (Jaume et al., 2019) and DocBank (Li et al., 2020b) to evaluate our model applicability. We adopted the same train/val/test split as the original dataset.666The ratio of official data split can be found in each dataset description (train/val/test)
PubLayNet annotates five different categories of layout components: Text, Title, List, Table and Figure, for the 358,353 PDF document images in total (94%/3%/3%) collected from the PubMed.
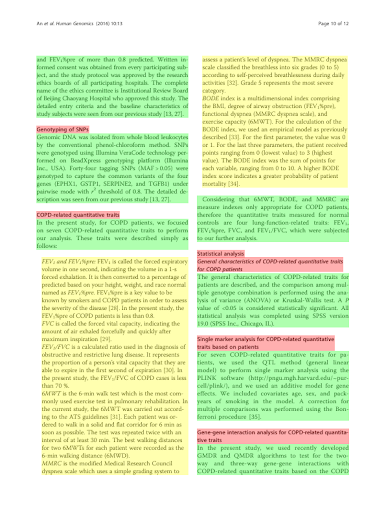
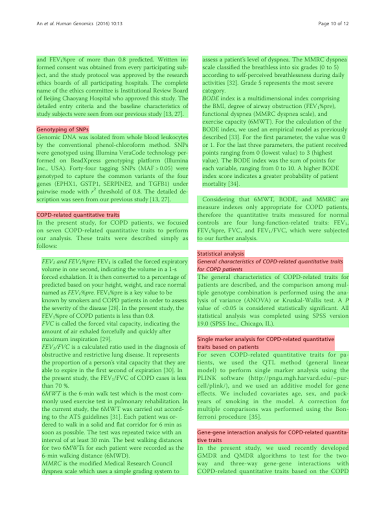
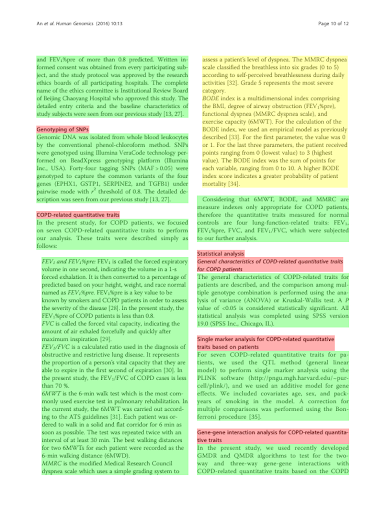
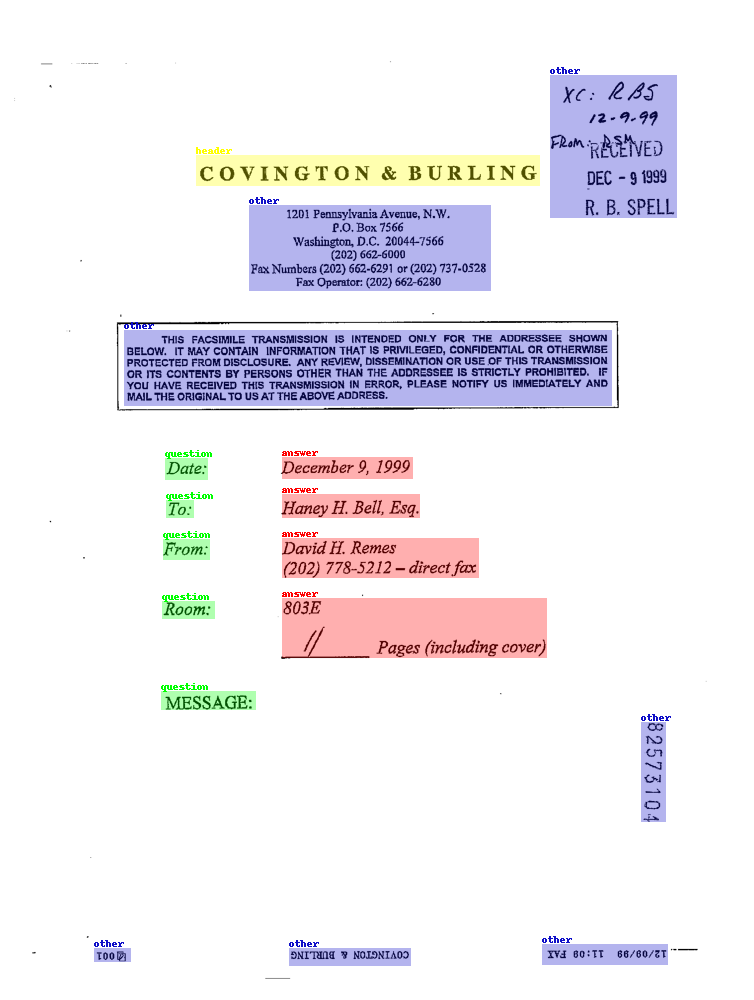
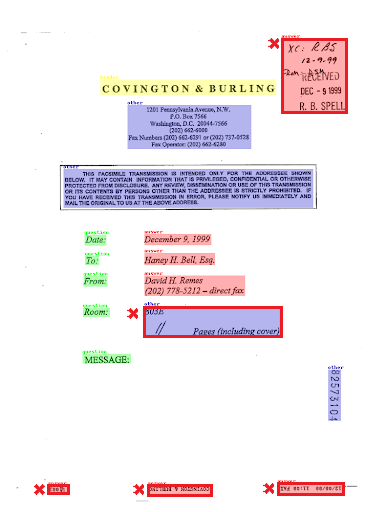
FUNSD is a much smaller dataset extracted from the RVL-CDIP dataset Harley et al. (2015) and contains 199 scanned PDF pages (75%/0/25%) of survey forms with only 4 different types of layout components: Header, Question, Answer and Other.
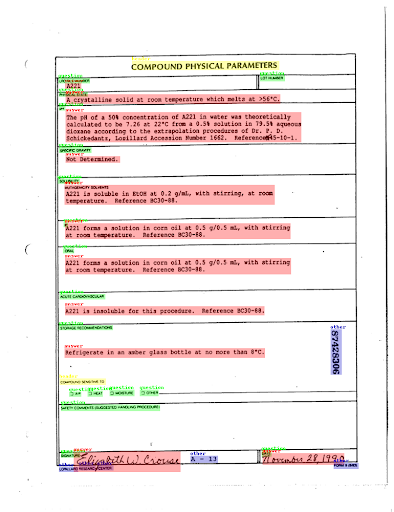
DocBank has more sophisticated annotations for layout components than PubLayNet. It contains 500K PDF Document pages in total (80%/10%/10%)777DocBank only provides the data split ratio and the entire dataset. We split the entire dataset using the same split ratio. with 13 different categories: Abstract, Author, Caption, Date, Equation, Figure, Footer, List, Paragraph, Reference, Section, Table and Title. The PDF files of DocBank are collected from arXiv.com with their LaTeX source.
Both PubLayNet and FUNSD include document page images, so it requires OCR888We applied Google Vision API to PubLayNet dataset, and directly used OCR result from FUNSD dataset in order to extract the texts for each layout component. We consider those two datasets as Image-based DLA. However, DocBank datasets contain PDF files with text source, which contains the text for each document, so we consider this as PDF file-based DLA. We test our Doc-GCN model with both Image-based and PDF-based DLA datasets.
4.2 Baselines
We compare our model with four widely-used Document Layout Analysis baselines.
Faster-RCNN (Ren et al., 2015) is an object detection model that unifies the region proposal network and the Fast R-CNN to extract the visual features from the proposed object regions for image object classification. For the FUNSD and DocBank, we fine-tuned the Faster-RCNN pretrained on the ImageNet with our training set and evaluated the test results. For the PubLayNet, we directly apply their Pretrained Faster-RCNN 999PubLayNet Faster-RCNN: https://github.com/ibm-aur-nlp/PubLayNet/.
BERT Devlin et al. (2019) is a language model which regards the DLA task as a text classification task by predicting the category of each layout component based on their sequence of text contents.
RoBERTa (Liu et al., 2019) has the same structure as BERT but is pretrained longer on the larger corpus that contains longer sequences. RoBERTa also applies a more dynamic masking pattern for masked language model tasks for pre-training.
LayoutLM (Xu et al., 2020) is a pretrained model that uses the BERT architecture to jointly learn visual aspects (position) and textual features of document layouts.
# % Faster-RCNN BERT-base RoBERTa-base LayoutLM-base Ours (Doc-GCN) Text 91024 72.87 96.82 97.74 97.90 97.94 99.18 Title 19343 15.48 92.57 96.23 96.21 96.44 98.11 List 4913 3.93 49.51 76.73 79.08 76.21 88.11 Table 5018 4.02 95.49 91.61 91.30 91.30 98.16 Figure 4619 3.70 96.87 77.10 76.01 75.17 98.71 Overall 124917 100 96.96 95.96 96.08 96.03 98.63
# % Faster-RCNN BERT-base RoBERTa-base LayoutLM-base Ours (Doc-GCN) Question 1077 46.18 74.40 87.23 87.02 87.08 89.32 Answer 821 35.21 69.26 82.44 84.11 81.72 88.81 Header 122 5.23 50.57 38.89 45.98 44.90 61.96 Other 312 13.38 65.12 57.33 56.20 56.19 72.76 Overall 2332 100 65.12 79.02 81.69 78.85 85.49
# % Faster-RCNN BERT-base RoBERTa-base LayoutLM-base Ours (Doc-GCN) Abstract 420 0.70 0 70.04 60.61 58.27 78.69 Author 484 0.80 0 72.56 82.01 69.07 79.46 Caption 1840 3.05 4.44 77.33 76.48 74.78 87.38 Date 87 0.14 0 67.76 88.74 85.35 91.02 Equation 11846 19.66 81.80 85.92 86.08 86.00 90.06 Figure 1650 2.74 68.74 100 100 100 99.97 Footer 529 0.88 0 69.08 68.67 65.56 84.48 List 958 1.59 0 54.72 55.01 50.43 65.79 Paragraph 35496 58.92 83.69 89.44 89.69 89.05 96.50 Reference 1237 2.05 0 88.51 88.30 89.61 88.83 Section 4891 8.12 78.52 84.04 84.79 83.90 95.93 Table 525 0.87 0 49.29 51.79 49.17 59.06 Title 286 0.47 0 51.49 68.58 55.53 84.85 Overall 60249 100 71.02 86.65 86.97 86.16 91.83
PubLayNet FUNSD DocBank Syn Sem Dens Appr Precision Recall F1 Precision Recall F1 Precision Recall F1 O X X X 67.81 72.92 63.45 54.80 49.36 39.68 40.95 46.01 42.40 X O X X 96.70 96.37 96.48 81.68 82.33 81.84 88.68 88.54 88.61 X X O X 50.65 71.17 59.18 45.91 48.93 43.52 34.71 58.90 43.68 X X X O 96.53 95.95 96.15 70.82 70.88 70.63 87.18 85.91 86.27 X O X O 98.42 98.36 98.38 84.45 84.99 84.41 91.80 91.79 91.66 X O O O 98.49 98.45 98.46 84.55 84.31 84.42 91.95 91.94 91.74 O O X O 98.61 98.58 98.59 84.85 84.99 84.85 92.00 91.77 91.68 O O O O 98.64 98.65 98.63 85.54 85.55 85.49 92.07 91.94 91.83
4.3 Implementation Details
For node features of Semantic graph and Appearance graph, we extract encoding () from pre-trained . The Faster-RCNN with ResNet-101 pre-trained on ImageNet is used to extract the visual features () to initialize the node embedding of the appearance graph. We set for the sequence padding in syntactic graph construction. All the graphs are trained on 2-layer GCNs for 10 epochs with Adam optimizer using a learning rate of for Semantic and Syntactic Graph and a learning rate of 0.001 for the other two graphs. We use as the activation function for the first GCN layer, from which we extract our learned node representations. For final classification, we train the multi-aspect classifier with Adam optimizer using the learning rate of , dropout of 0.1 and as activation function. We trained the model using Intel(R) Xeon(R) CPU @ 2.00GHz and NVIDIA Tesla K80 24GB, which took around 15 hours, 72 hours and 8 mins101010With more aspects covered, Doc-GCN training is still slightly smaller than other baselines recorded in each paper for training PubLayNet, DocBank and FUNSD respectively. The number of trainable parameters is 126,401,796.
5 Results
5.1 Performance Comparison
We compared the performance of our proposed Doc-GCN with the baseline models on the test set of PubLayNet, FUNSD, and DocBank. The breakdown F1 scores on each layout component of the three datasets are provided in Table 1, 2 and 3 respectively.
We can see from the overall F1 scores that Doc-GCN outperforms all the baseline models on all datasets. It achieves a 98.63% F1 score in PubLayNet, which is 1.67% higher than the pre-trained Faster-RCNN. The performances of Faster-RCNN on FUNSD and DocBank are also much less competitive than models utilizing semantic features, which indicates the critical role of semantic information in the DLA task. Compared to BERT and RoBERTa, which only uses the semantic features, the F1 scores of our model are 2.55%, 3.8%, 4.86% higher than RoBERTa and 2.67%, 6.47%, 5.18% higher than BERT on PubLayNet, FUNSD and DocBank respectively. Especially for FUNSD, where there are only 144 training PDF pages, our model still achieves around 85%. Such results also prove the effectiveness of our multiple aspects of document layout component features for low-resource DLA datasets. Though LayoutLM also utilizes dual-aspect, visual aspect (position), and textual features, our Doc-GCN produces better overall F1 scores on all datasets. The superior performance of Doc-GCN demonstrates the effectiveness of the multiple aspects we applied. It indicates the positive contribution of graph representations and the joint GCN learning for integrating multiple features in the DLA task.
Furthermore, Doc-GCN shows significant performance improvement for some important layout component detection for each domain. It produce a better result in all components in PubLayNet, including the Title, Table, Figure, and the List that contains the structural text information, as is demonstrated in Table 1. Similar patterns can be also observed in Table 2 for FUNSD, especially with those important components of the forms: Header (section title - e.g. the aim of the form) and Answer (value - e.g. the content filled by the form user). For DocBank in Table 3, it shows that Doc-GCN works well with the essential components of scientific academic publication, including Abstract, Date, Section, Title. Those components are generally extracted for understanding the content of documents.
5.2 Comparison of Aspect Variants
To inspect the effectiveness of each aspect feature captured by Doc-GCN, we further compare its test performances by applying different combinations of aspect features. As seen in Table 4, using only semantic or appearance features already resulted in around 96% and 88% in F1 scores on PubLayNet and DocBank, respectively. For FUNSD, using only appearance features results in 70.63% in the F1 score, and using only semantic features is around 10% higher. The combination of semantic and appearance features improves the F1 scores to 98.38%, 84.41%, and 91.66% for PubLayNet, FUNSD, and DocBank, respectively. The semantic and appearance features seem to dominate the model’s performance in the DLA task, but the syntactic and density features also positively contribute to the performance. By adding syntactic features to the semantic and appearance features, the F1 scores on PubLayNet and FUNSD improve to 98.59% and 84.85%, respectively. Further, adding density features results in the best performances of 98.63% and 85.49%, respectively. For DocBank, adding density features improves the F1 score from 91.66% to 91.74% and finally reaches the best performance of 91.83% after further including the syntactic features. Though the density features and syntactic features contribute differently in the cases of different datasets, it is evident that the utilization of both density features and syntactic features is effective for performance improvement in the DLA task. Such results also indicate that our proposed aspects and their representations are practical for a more comprehensive representation of the characteristics of document layout components.
PubLayNet FUNSD DocBank Bert-L 97.06 80.86 86.42 RoBERTa-L 96.15 79.47 86.67 LayoutLM-L 96.94 78.90 83.21 Doc-GCN-L 98.22 85.40 90.07
PubLayNet FUNSD DocBank Min Pooling 98.67 82.77 90.27 Avg Pooling 97.90 82.04 89.04 Max Pooling 98.63 85.49 91.83
5.3 Impact of Pretrained Model Variants
To evaluate the effects of base and large pretrained models, we also tested the performances of large BERT, RoBERTa and LayoutLM over three datasets. For a fair comparison, we deployed Doc-GCN Large, shown as Doc-GCN-L in Table 7, which uses the same graph construction and representations as the original Doc-GCN except that the large pretrained BERT is used for generating the semantic-aspect graph features.
The result shows that large models have similar performances as base models. Nevertheless, our Doc-GCN-L still outperforms BERT-L, RoBERTa-L and LayoutLM-L on all three datasets: PubLayNet, FUNSD, and DocBank.
5.4 Impact of Pooling Variants
We applied the node-level pooling to integrate the node features over the two graph variants as the final features for each aspect representation. We compared Minimum, Average, and Max Pooling and used the method with the best results. From Table 6, we can see that for FUNSD and DocBank, Max Pooling resulted in the best performances. Especially for the FUNSD dataset, Max Pooling achieved almost 3% higher in F1 score compared to the results of using Minimum Pooling and Average Pooling. For PubLayNet, Minimum Pooling results in the best performance but is only 0.03% higher than Max Pooling. Hence, we used Max Pooling as the ultimate pooling method in our Doc-GCN.
5.5 Case Study111111More qualitative analysis for each of the three datasets can be found in Appendix B, and the superiority of understanding multiple aspects will be highlighted there.
We visualized the sample results for the top 3 models on a document page of PubLayNet in Figure 2. We can see that both RoBERTa and Faster-RCNN have wrongly recognized a Text into List, whereas our Doc-GCN has accurately recognized all components. This case further proves that simply considering the semantic or visual information is hard to distinguish the List and Text, indicating the importance of capturing the structural relationships between layout components for better performance.
6 Conclusion131313Appendix: https://github.com/adlnlp/doc_gcn/tree/main/appendix
We successfully handled the importance of the DLA task, Document Component/Segment Classification. It focused on extracting important information (i.e., Title, Author, Date, Form Answer) from the digital documents, including Scanned Document Images and PDF files. We propose a heterogeneous graph-based DLA model, Doc-GCN, which integrates text density, appearance, and syntactic and semantic properties of the Document layout components to generate comprehensive representations of documents. The graph structure also enables the model to capture and learn the relationships between the layout components when making predictions. Our model outperforms all baselines on three publicly available DLA datasets. We strongly hope that Doc-GCN will motivate and provide insights into the future integration of different modalities and aspects for the logical document layout analysis task.
References
- Augusto Borges Oliveira and Palhares Viana (2017) Dario Augusto Borges Oliveira and Matheus Palhares Viana. 2017. Fast cnn-based document layout analysis. In Proceedings of the IEEE International Conference on Computer Vision Workshops, pages 1173–1180.
- Binmakhashen and Mahmoud (2019) Galal M Binmakhashen and Sabri A Mahmoud. 2019. Document layout analysis: a comprehensive survey. ACM Computing Surveys (CSUR), 52(6):1–36.
- Cai et al. (2020) Hongjie Cai, Yaofeng Tu, Xiangsheng Zhou, Jianfei Yu, and Rui Xia. 2020. Aspect-category based sentiment analysis with hierarchical graph convolutional network. In Proceedings of the 28th International Conference on Computational Linguistics, pages 833–843.
- Chen et al. (2020) Guimin Chen, Yuanhe Tian, and Yan Song. 2020. Joint aspect extraction and sentiment analysis with directional graph convolutional networks. In Proceedings of the 28th International Conference on Computational Linguistics, pages 272–279.
- Devlin et al. (2019) Jacob Devlin, Ming-Wei Chang, Kenton Lee, and Kristina Toutanova. 2019. Bert: Pre-training of deep bidirectional transformers for language understanding. In Proceedings of the 2019 Conference of the North American Chapter of the Association for Computational Linguistics: Human Language Technologies, Volume 1 (Long and Short Papers), pages 4171–4186.
- Ding et al. (2022) Yihao Ding, Zhe Huang, Runlin Wang, YanHang Zhang, Xianru Chen, Yuzhong Ma, Hyunsuk Chung, and Soyeon Caren Han. 2022. V-doc: Visual questions answers with documents. In Proceedings of the IEEE/CVF Conference on Computer Vision and Pattern Recognition, pages 21492–21498.
- Fisher et al. (1990) James L Fisher, Stuart C Hinds, and Donald P D’Amato. 1990. A rule-based system for document image segmentation. In [1990] Proceedings. 10th International Conference on Pattern Recognition, volume 1, pages 567–572. IEEE.
- Gu et al. (2021) Jiuxiang Gu, Jason Kuen, Vlad Morariu, Handong Zhao, Rajiv Jain, Nikolaos Barmpalios, Ani Nenkova, and Tong Sun. 2021. Unidoc: Unified pretraining framework for document understanding. Advances in Neural Information Processing Systems, 34.
- Han et al. (2020) Caren Han, Siqu Long, Siwen Luo, Kunze Wang, and Josiah Poon. 2020. VICTR: Visual information captured text representation for text-to-vision multimodal tasks. In Proceedings of the 28th International Conference on Computational Linguistics, pages 3107–3117.
- Harley et al. (2015) Adam W Harley, Alex Ufkes, and Konstantinos G Derpanis. 2015. Evaluation of deep convolutional nets for document image classification and retrieval. In 2015 13th International Conference on Document Analysis and Recognition (ICDAR), pages 991–995. IEEE.
- He et al. (2017) Kaiming He, Georgia Gkioxari, Piotr Dollár, and Ross Girshick. 2017. Mask r-cnn. In Proceedings of the IEEE international conference on computer vision, pages 2961–2969.
- Huang et al. (2020) Qingbao Huang, Jielong Wei, Yi Cai, Changmeng Zheng, Junying Chen, Ho-fung Leung, and Qing Li. 2020. Aligned dual channel graph convolutional network for visual question answering. In Proceedings of the 58th Annual Meeting of the Association for Computational Linguistics, pages 7166–7176.
- Jaume et al. (2019) Guillaume Jaume, Hazim Kemal Ekenel, and Jean-Philippe Thiran. 2019. Funsd: A dataset for form understanding in noisy scanned documents. In 2019 International Conference on Document Analysis and Recognition Workshops (ICDARW), volume 2, pages 1–6. IEEE.
- Johnson et al. (2018) Justin Johnson, Agrim Gupta, and Li Fei-Fei. 2018. Image generation from scene graphs. In Proceedings of the IEEE conference on computer vision and pattern recognition, pages 1219–1228.
- Kipf and Welling (2016) Thomas N Kipf and Max Welling. 2016. Semi-supervised classification with graph convolutional networks. ICLR.
- Kitaev and Klein (2018) Nikita Kitaev and Dan Klein. 2018. Constituency parsing with a self-attentive encoder. In Proceedings of the 56th Annual Meeting of the Association for Computational Linguistics (Volume 1: Long Papers), pages 2676–2686.
- Klink and Kieninger (2001) Stefan Klink and Thomas Kieninger. 2001. Rule-based document structure understanding with a fuzzy combination of layout and textual features. International Journal on Document Analysis and Recognition, 4(1):18–26.
- Li et al. (2020a) Kai Li, Curtis Wigington, Chris Tensmeyer, Handong Zhao, Nikolaos Barmpalios, Vlad I Morariu, Varun Manjunatha, Tong Sun, and Yun Fu. 2020a. Cross-domain document object detection: Benchmark suite and method. In Proceedings of the IEEE/CVF Conference on Computer Vision and Pattern Recognition, pages 12915–12924.
- Li et al. (2020b) Minghao Li, Yiheng Xu, Lei Cui, Shaohan Huang, Furu Wei, Zhoujun Li, and Ming Zhou. 2020b. Docbank: A benchmark dataset for document layout analysis. In Proceedings of the 28th International Conference on Computational Linguistics, pages 949–960.
- Liu et al. (2020a) Chunxiao Liu, Zhendong Mao, Tianzhu Zhang, Hongtao Xie, Bin Wang, and Yongdong Zhang. 2020a. Graph structured network for image-text matching. In Proceedings of the IEEE/CVF Conference on Computer Vision and Pattern Recognition, pages 10921–10930.
- Liu et al. (2020b) Xien Liu, Xinxin You, Xiao Zhang, Ji Wu, and Ping Lv. 2020b. Tensor graph convolutional networks for text classification. In Proceedings of the AAAI Conference on Artificial Intelligence, volume 34, pages 8409–8416.
- Liu et al. (2019) Yinhan Liu, Myle Ott, Naman Goyal, Jingfei Du, Mandar Joshi, Danqi Chen, Omer Levy, Mike Lewis, Luke Zettlemoyer, and Veselin Stoyanov. 2019. Roberta: A robustly optimized bert pretraining approach. arXiv preprint arXiv:1907.11692.
- Long et al. (2022a) Siqu Long, Feiqi Cao, Soyeon Caren Han, and Haiqin Yang. 2022a. Vision-and-language pretrained models: A survey. In Proceedings of the Thirty-First International Joint Conference on Artificial Intelligence, IJCAI-22, pages 5530–5537. International Joint Conferences on Artificial Intelligence Organization. Survey Track.
- Long et al. (2022b) Siqu Long, Soyeon Caren Han, Xiaojun Wan, and Josiah Poon. 2022b. Gradual: Graph-based dual-modal representation for image-text matching. In Proceedings of the IEEE/CVF Winter Conference on Applications of Computer Vision, pages 3459–3468.
- Luo et al. (2020) Siwen Luo, Soyeon Caren Han, Kaiyuan Sun, and Josiah Poon. 2020. Rexup: I reason, i extract, i update with structured compositional reasoning for visual question answering. In International Conference on Neural Information Processing, pages 520–532. Springer.
- Luo et al. (2021) Siwen Luo, Hamish Ivison, Caren Han, and Josiah Poon. 2021. Local interpretations for explainable natural language processing: A survey. arXiv preprint arXiv:2103.11072.
- Niyogi and Srihari (1986) Debashish Niyogi and Sargur N Srihari. 1986. A rule-based system for document understanding. In Proceedings of the Fifth AAAI National Conference on Artificial Intelligence, pages 789–793.
- Ren et al. (2015) Shaoqing Ren, Kaiming He, Ross Girshick, and Jian Sun. 2015. Faster r-cnn: towards real-time object detection with region proposal networks. In Proceedings of the 28th International Conference on Neural Information Processing Systems-Volume 1, pages 91–99.
- Soto and Yoo (2019) Carlos Soto and Shinjae Yoo. 2019. Visual detection with context for document layout analysis. In Proceedings of the 2019 Conference on Empirical Methods in Natural Language Processing and the 9th International Joint Conference on Natural Language Processing (EMNLP-IJCNLP), pages 3455–3461.
- Vashishth et al. (2018) Shikhar Vashishth, Shib Sankar Dasgupta, Swayambhu Nath Ray, and Partha Talukdar. 2018. Dating documents using graph convolution networks. In Proceedings of the 56th Annual Meeting of the Association for Computational Linguistics (Volume 1: Long Papers), pages 1605–1615.
- Vaswani et al. (2017) Ashish Vaswani, Noam Shazeer, Niki Parmar, Jakob Uszkoreit, Llion Jones, Aidan N Gomez, Łukasz Kaiser, and Illia Polosukhin. 2017. Attention is all you need. In Proceedings of the 31st International Conference on Neural Information Processing Systems, pages 6000–6010.
- Wang et al. (2022a) Kunze Wang, Caren Han, Siqu Long, and Josiah Poon. 2022a. Me-gcn: Multi-dimensional edge-embedded graph convolutional networks for semi-supervised text classification. In ICLR 2022 Workshop on Deep Learning on Graphs for Natural Language Processing.
- Wang et al. (2022b) Kunze Wang, Soyeon Caren Han, and Josiah Poon. 2022b. Induct-gcn: Inductive graph convolutional networks for text classification. In 26TH International Conference on Pattern Recognition (ICPR).
- Wang et al. (2022c) Renshen Wang, Yasuhisa Fujii, and Ashok C Popat. 2022c. Post-ocr paragraph recognition by graph convolutional networks. In Proceedings of the IEEE/CVF Winter Conference on Applications of Computer Vision, pages 493–502.
- Xu et al. (2021) Yang Xu, Yiheng Xu, Tengchao Lv, Lei Cui, Furu Wei, Guoxin Wang, Yijuan Lu, Dinei Florencio, Cha Zhang, Wanxiang Che, Min Zhang, and Lidong Zhou. 2021. LayoutLMv2: Multi-modal pre-training for visually-rich document understanding. In Proceedings of the 59th Annual Meeting of the Association for Computational Linguistics and the 11th International Joint Conference on Natural Language Processing (Volume 1: Long Papers), pages 2579–2591, Online. Association for Computational Linguistics.
- Xu et al. (2020) Yiheng Xu, Minghao Li, Lei Cui, Shaohan Huang, Furu Wei, and Ming Zhou. 2020. Layoutlm: Pre-training of text and layout for document image understanding. In Proceedings of the 26th ACM SIGKDD International Conference on Knowledge Discovery & Data Mining, pages 1192–1200.
- Yao et al. (2019) Liang Yao, Chengsheng Mao, and Yuan Luo. 2019. Graph convolutional networks for text classification. In Proceedings of the AAAI conference on artificial intelligence, volume 33, pages 7370–7377.
- Zhang et al. (2021) Peng Zhang, Can Li, Liang Qiao, Zhanzhan Cheng, Shiliang Pu, Yi Niu, and Fei Wu. 2021. Vsr: A unified framework for document layout analysis combining vision, semantics and relations. In Document Analysis and Recognition – ICDAR 2021, pages 115–130, Cham. Springer International Publishing.
- Zhong et al. (2019) Xu Zhong, Jianbin Tang, and Antonio Jimeno Yepes. 2019. Publaynet: largest dataset ever for document layout analysis. In 2019 International Conference on Document Analysis and Recognition (ICDAR), pages 1015–1022. IEEE.
Appendix A Graph Construction Procedure
The proposed Doc-GCN contains graphs covering four different aspects of properties of PDF pages, including syntactic, semantic, density, and appearance/visual information, to harmonize and integrate heterogeneous aspects for Document Layout Analysis. In this section, we would like to describe the graph construction procedure for each aspect graph. The syntactic and semantic graphs share the same graph structure, while the density and appearance graphs use the other graph structures.
A.1 Density-aspect and Appearance-aspect Graph construction
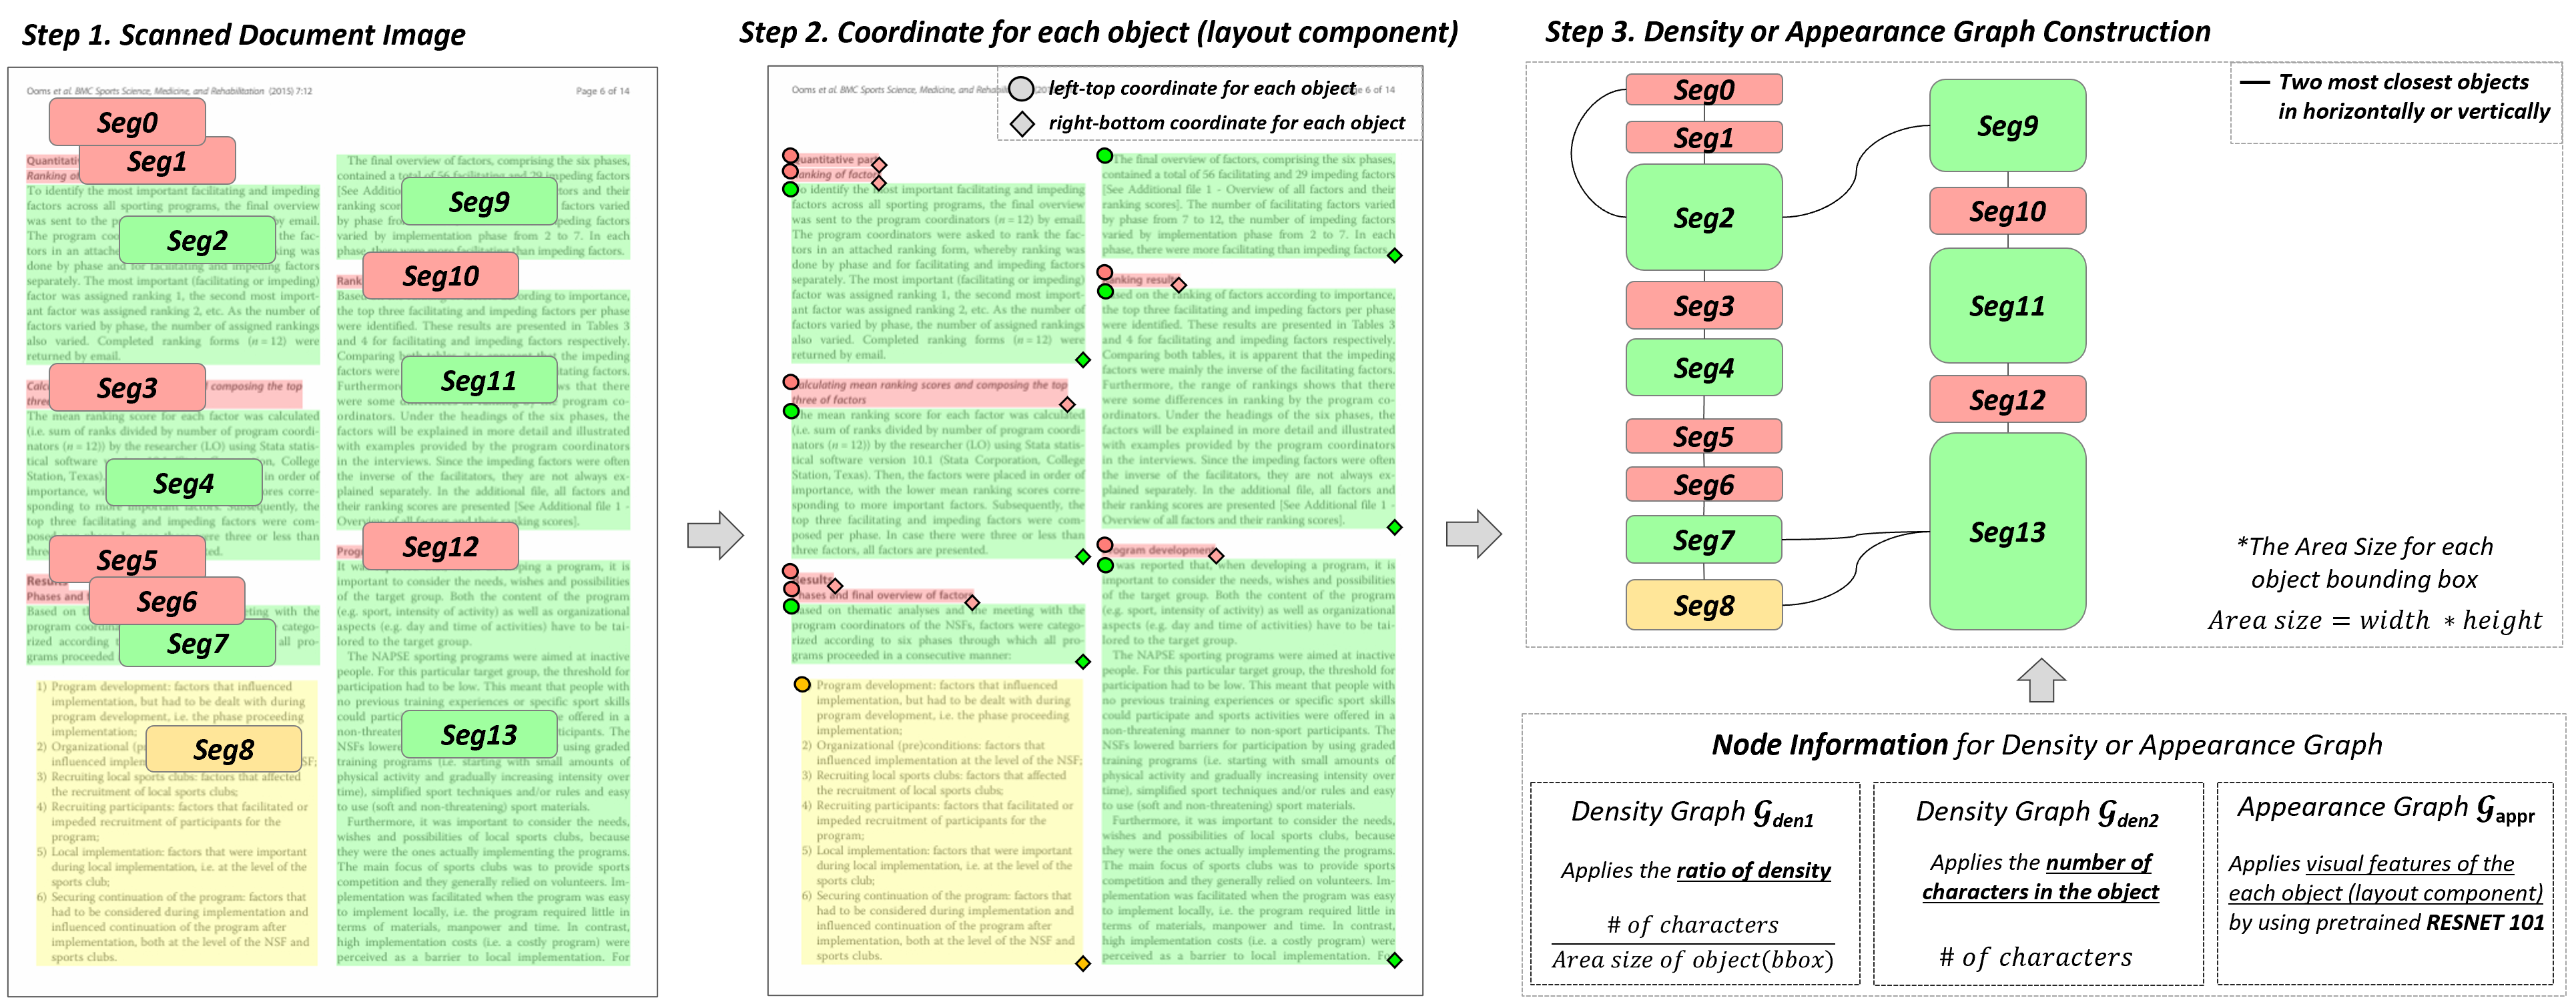
The graph construction scenarios for both density-aspect and appearance-aspect graphs can be found in Figure 3. We demonstrate the detailed steps as follows:
-
1.
As is illustrated in step 1, given a scanned document page, we identify each document layout component as a segment based on the bounding box provided in the datasets.
-
2.
In step 2, the bounding box information for each segment is defined by the left-top and right-bottom coordinates.
-
3.
To construct the Density-aspect/Appearance-aspect graphs in step 3, we treat each segment as a graph node and connect each segment node with its two closest neighbors based on the gap between their bounding boxes. These two closest neighbors could be both vertically and horizontally located (if a two-column page is applied). We initialize the node values as the ratio of density following the Equation 5.
(5) node values are initialized as the total number of characters in each segment.
For appearance graph, , the node values are initialized by the visual features of each segment. Such visual features are extracted from the pretrained ResNet-101.
A.2 Syntactic-aspect and Semantic-aspect Graph Construction
The graph construction scenarios for both syntactic-aspect and semantic-aspect graphs can be found in Figure 4(a). We demonstrate the detailed steps as follows:
-
1.
As is illustrated by step 1, given a scanned document page, we identify each document layout component as a segment based on the bounding box provided in the dataset.
-
2.
In step 2, we represent the hierarchical parent-child relations between segments. For the training and validation set, we use the parent-child relations that are directly derived from the source files provided in the datasets: we first apply OCR detection to each segment in step 1. Based on the detected OCR text tokens, we then use fuzzy string matching to map each segment with the corresponding element in the XML/ LaTeX source files for PubLayNet/DocBank and identify the parent-child relations based on the hierarchical structure embodied in these source files; FUNSD provides the parent-child relations directly in the annotation files. We then train a transformer-based relation prediction model on the (training + validation) set utilizing those extracted parent-child relations and predict the parent-child relations for the test set. The details of the transformer-based relation prediction model are provided in Section A.3.
-
3.
To construct the Syntactic and Semantic graph, as is demonstrated in step 3, we treat each segment as a node of the graph. We then connect the parent-child relations nodes (derived from step 2) and set the edge value as 1. Regarding the node representation, we use the first-level and second-level syntactic parsing results as the node information for the Syntactic Graph and respectively before the node encoding. For the Semantic Graph , we pass the OCR tokens within each segment node to the pretrained BERT and extract the as the initialized node embedding.
A.3 Relation Prediction Model
As described in Section A.2, we apply a relation prediction model to predict the parent-child relations between segments when constructing both syntactic-aspect and semantic-aspect graphs for data in the test set.
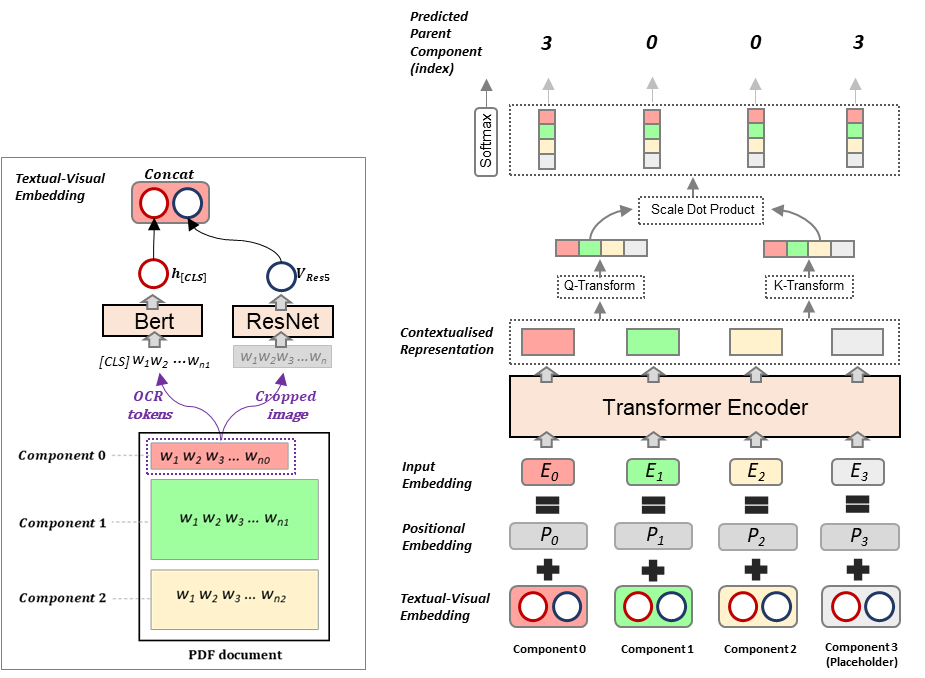
Given a PDF page with multiple segments, we first encode each segment’s textual and visual features, as illustrated on the left side in Figure 4(b). On the one hand, we feed the OCR token sequence (derived from step 2 in Section A.2) of the segment into the pretrained BERT model and adopt the generated representation of the token as the textual embedding . On the other hand, the cropped image of each segment (based on the bounding box) is fed into the pretrained ResNet-101 model, from which the output feature of Res5 layer is used as the visual embedding . We then concatenate the textual embedding and visual embedding as the textual-visual embedding for each segment.
PubLayNet FUNSD DocBank Bert-L 97.06 80.86 86.42 RoBERTa-L 96.15 79.47 86.67 LayoutLM-L 96.94 78.90 83.21 Doc-GCN-L 98.22 85.40 90.07
The relation prediction model is shown on the right side in Figure 4(b). We represent the sequence of segments in a PDF page using their textual-visual embedding and sum it up with the positional embedding as the input embedding, which is then passed to a single-layer transformer encoder to derive the contextualized representation for the segments. We then apply two linear transformations, Q-Transform and K-Transform, to generate the and representation. An attention score matrix is generated from the softmax-normalized dot-product results of the two representations, based on which the parent segment is selected from the segments in the input sequence. To handle those segments without parents, we append a fake segment at the end of the input sequence initialized with all zeros as a place holder, which is treated as the target parent for the non-parent segment.
Appendix B Additional Case Studies
We provided one additional quality result on the document of PubLayNet (Figure 5), FUNSD (Figure 6,7) and DocBank (Figure 8,9),respectively. As shown in Figure 5, both RoBERTa-base and Faster-RCNN incorrectly recognize the List into Text, whereas our Doc-GCN successfully recognize all segments for Publaynet Dataset.
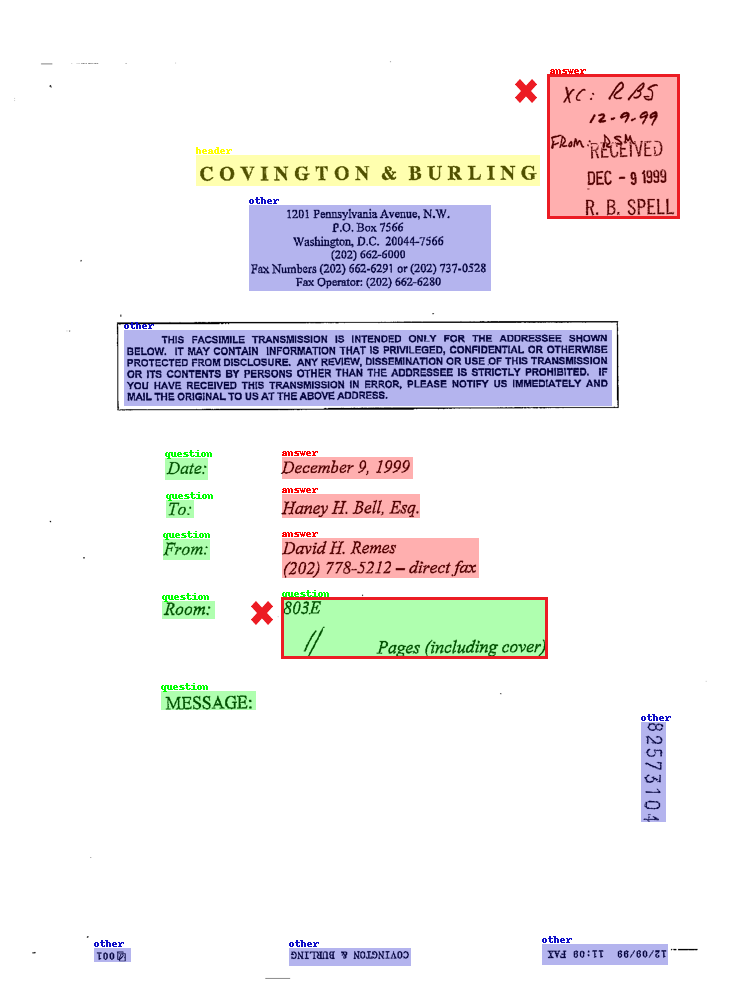
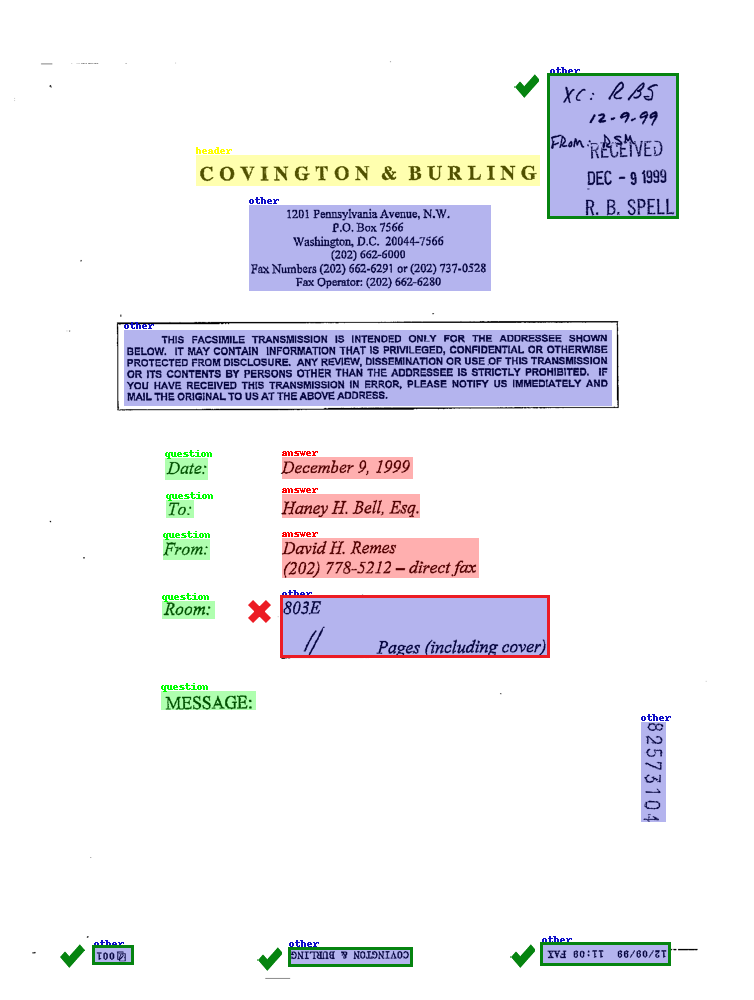
As shown in Figure 6, Doc-GCN also shows its remarkable performance by correctly recognising the top-right component highlighted by the green tick in Figure 6(d) while the other two baseline models wrongly classified this component into Answer. Additionally, ours detected Other components such as page number, company name, and date time correctly. This is another highlight of the great potential of our multi-modal aspects, even with the small-sized of the training dataset. Similar trend also can be found in Figure 7.
Figure 8, a dataset with the scientific academic papers, shows that Doc-GCN produced all components correctly. However, BERT could not detect Date (published date) and Abstract, which are the most important components of the publication. RoBERTa also incorrectly recognised the Date (published date) and Author. Thus it is clear to see that our Doc-GCN consistently works well in detecting paragraphs and equations. As well as, in Figure 9, only our Doc-GCN can get the exactly same results as the ground truth.