New Active Galactic Nuclei Detected by the ART-XC and eROSITA Telescopes Onboard the SRG Observatory during an All-Sky X-ray Survey–LABEL:lastpage
New Active Galactic Nuclei Detected by the ART-XC and eROSITA Telescopes Onboard the SRG Observatory during an All-Sky X-ray Survey
Abstract
We present the results of our identification of 17 X-ray sources detected in the 4–12 keV energy range by the Mikhail Pavlinsky ART-XC telescope during the first year of the SRG all-sky survey. Three of them have been discovered by the ART-XC telescopes, while the remaining ones have already been known previously as X-ray sources, but their nature has remained unknown. We took optical spectra for nine sources located in the northern sky () with the 1.6-m AZT-33IK telescope at the Sayan Observatory (the Institute of Solar–Terrestrial Physics, the Siberian Branch of the Russian Academy of Sciences) and the 1.5-m Russian–Turkish telescope at the TBITAK National Observatory. For the remaining objects we have analyzed the archival optical spectra taken during the 6dF survey. All of the investigated objects have turned out to be Seyfert galaxies (eight of type 1, seven of type 2, and two of intermediate type 1.8) at redshifts up to . Based on data from the eROSITA and ART-XC telescopes onboard the SRG observatory, we have obtained X-ray spectra in the energy range 0.2–20 keV for eight sources. A significant intrinsic absorption ( cm-2) has been detected in three of them, with two of them being probably strongly absorbed ( cm-2). This paper is a continuation of the series of publications on the optical identification of active galactic nuclei detected by the ART-XC telescope.
keywords:
active galactic nuclei, sky surveys, optical observations, redshifts, X-ray observations1 Introduction
The Spectrum–Roentgen–Gamma (SRG) orbital observatory (Sunyaev et al., 2021) has conducted an all-sky X-ray survey since December 12, 2019. A total of eight surveys, each with a duration of six months, are planned to be conducted. There are two telescopes with grazing-incidence X-ray optics onboard the SRG observatory: eROSITA (Predehl et al., 2021) and Mikhail Pavlinsky ART-XC (Pavlinsky et al., 2021) operating in the 0.2–8 and 4–30 keV energy bands, respectively.
The second SRG sky survey was completed on December 15, 2020. The first catalog of sources detected in the 4–12 keV energy band by the ART-XC telescope was produced from the sum of the two surveys (Pavlinsky et al., 2022). This catalog was correlated with: (1) the catalogs of sources detected in previous X-ray sky surveys, (2) the preliminary catalog of sources detected on the half of the celestial sphere 111Russian scientists are responsible for processing the eROSITA data in this part of the sky. in the soft X-ray energy band during the first three SRG/eROSITA all-sky surveys, and (3) the catalogs of astrophysical objects in other wavelength ranges. As a result, a list of objects discovered by the ART-XC telescope and previously known X-ray sources confirmed with the ART-XC telescope, whose nature remained unknown or poorly studied, was compiled. Most of these objects were also detected by the eROSITA telescope onboard the SRG observatory. Spectroscopic observations are carried out at ground-based optical telescopes to establish the nature of these objects.
In this paper we present the results of our identification of nine sources from the first ART-XC catalog of sources using observations with the 1.6-m AZT-33IK telescope at the Sayan Observatory (the Institute of Solar–Terrestrial Physics, the Siberian Branch of the Russian Academy of Sciences) and the 1.5-m Russian–Turkish telescope (RTT-150) at the TBITAK National Observatory. These objects, located in the northern sky, have turned out to be active galactic nuclei (AGNs). We also present the results of our identification of eight ART-XC sources in the southern sky based on the available archival data from the spectroscopic 6dF survey, which have also turned out to be AGNs. In addition, we constructed broadband (0.2–20~keV) X-ray spectra for eight northern objects (with coordinates in the range ) from the eROSITA and ART-XC data during the first three half-year sky surveys. Using these spectra, we have managed to reveal a significant intrinsic absorption in several objects. This paper continues the series of publications on the identification of new AGNs and cataclysmic variables from the SRG/ART-XC allsky survey begun in Zaznobin et al. (2021, 2022) The presented luminosity estimates are based on the model of a flat Universe with parameters and .
| eROSITA coordinates | Optical coordinates | ||||||||
|---|---|---|---|---|---|---|---|---|---|
| No. | ART-XC source | Discovered by | |||||||
| 1 | SRGA J | Swift | |||||||
| 2 | SRGA J | ROSAT | |||||||
| 3 | SRGA J | SRG | |||||||
| 4 | SRGA J | ROSAT | |||||||
| 5 | SRGA J | ROSAT | |||||||
| 6 | SRGA J | SRG | |||||||
| 7 | SRGA J | ROSAT | |||||||
| 8 | SRGA J | ROSAT | |||||||
| 9 | SRGA J | Swift | |||||||
Column1: the ordinal sourcenumber inthe sample beingstudied. Column2: the source name in the ART-XC catalog (the coordinates of the X-ray sources used in the names are given for epoch J2000.0). Columns 3 and 4: the coordinates of the source from the eROSITA data. Columns 5 and 6: the coordinates of the putative optical counterpart. Column 7: the distance between the positions of the ART-XC source and the optical counterpart. Column 8: the distance between the positions of the eROSITA source and the optical counterpart. Column 9: the X-ray flux in the 4–12 keV energy band based on data from the first two ART-XC sky surveys (Pavlinsky et al., 2022), in units of erg s-1 cm-2. Column 10: the X-ray observatory that detected the source for the first time. The eROSITA coordinates are not given for SRGA J due to its insufficiently significant detection by the eROSITA telescope and for SRGA J due to its location on the half of the sky , on which German scientists are responsible for processing the eROSITA data.
| Optical coordinates | ||||||
|---|---|---|---|---|---|---|
| No. | ART-XC source | Discovered by | ||||
| 10 | SRGA J | SRG | ||||
| 11 | SRGA J | XMM-Newton | ||||
| 12 | SRGA J | ROSAT | ||||
| 13 | SRGA J | XMM-Newton | ||||
| 14 | SRGA J | ROSAT | ||||
| 15 | SRGA J | ROSAT | ||||
| 16 | SRGA J | ROSAT | ||||
| 17 | SRGA J | ROSAT | ||||
The contents of the columns are analogous to those in Table 1. The sources are located on the half of the sky and, therefore, no information on the eROSITA data is given.
THE SAMPLE OF OBJECTS
The sample of 17 objects being studied was selected from the catalog of X-ray sources detected by the ART-XC telescope during the first year of its all- sky survey (December 12, 2019–December 15, 2020) (Pavlinsky et al., 2022). We considered only point sources from this catalog. According to the catalog production criterion, all such sources were detected at a significance level of no less than 4.82 standard deviations in the 4–12 keV energy band. Based on the ART-XC data, we measured the positions of the sources in the sky with an accuracy better than 30 arcsec. For eight sources from this sample located in the sky region there are also SRG/eROSITA data at our disposal, which allowed broadband X-ray spectra for these objects to be constructed from the set of eROSITA and ART-XC data. The eROSITA data for the remaining nine sources belong to the German SRG/eROSITA consortium and are not considered here.
For nine of the 17 X-ray sources located in the northern sky () we took optical spectra. For the remaining eight sources located in the southern sky we analyzed the available archival data from the spectroscopic 6dF survey of galaxies (Jones et al., 2004). For all objects Tables 1 and 2 give: the coordinates of the source from the ART-XC and eROSITA data (if available), the coordinates of the putative optical counterpart, the distance between the positions of the X-ray source and the optical counterpart, and the X-ray flux in the 4–12 keV energy band.
2 X-RAY OBSERVATIONS
At present, all of the sources from the sample have been observed during the first three SRG all-sky surveys. Using the combined eROSITA and ART-XC data from these surveys, we constructed the spectra of eight sample sources located in the sky region in the energy range from 0.2 to 20 keV. The variability of the objects was not investigated.
The ART-XC X-ray spectra were obtained with the ARTPRODUCTS v0.9 software (Pavlinsky et al., 2021) using the calibration files of version 20200401. The data from all seven ART-XC modules were combined. The spectra of the sources were extracted in a region of radius 120\arcsec in three energy bands: 4–8, 8–12, and 12–20 keV.
The eROSITA data were processed with the calibration and data processing system created and maintained at the Space Research Institute of the Russian Academy of Sciences that was constructed using the elements of the eSASS (eROSITA Science Analysis Software System) package and the software developed by the science group on the X-ray catalog of the Russian eROSITA consortium. We extracted the source spectra in a circle of radius and the background spectra in a ring with the inner radius and the outer radius around the source. If other sources fell into the background region, then they were excluded with the radius . The spectra were extracted from the data of all seven ART-XC modules in the energy range 0.2–-9.0 keV. When fitting the spectra, the data were binned in such a way that there were at least three counts in each energy channel.
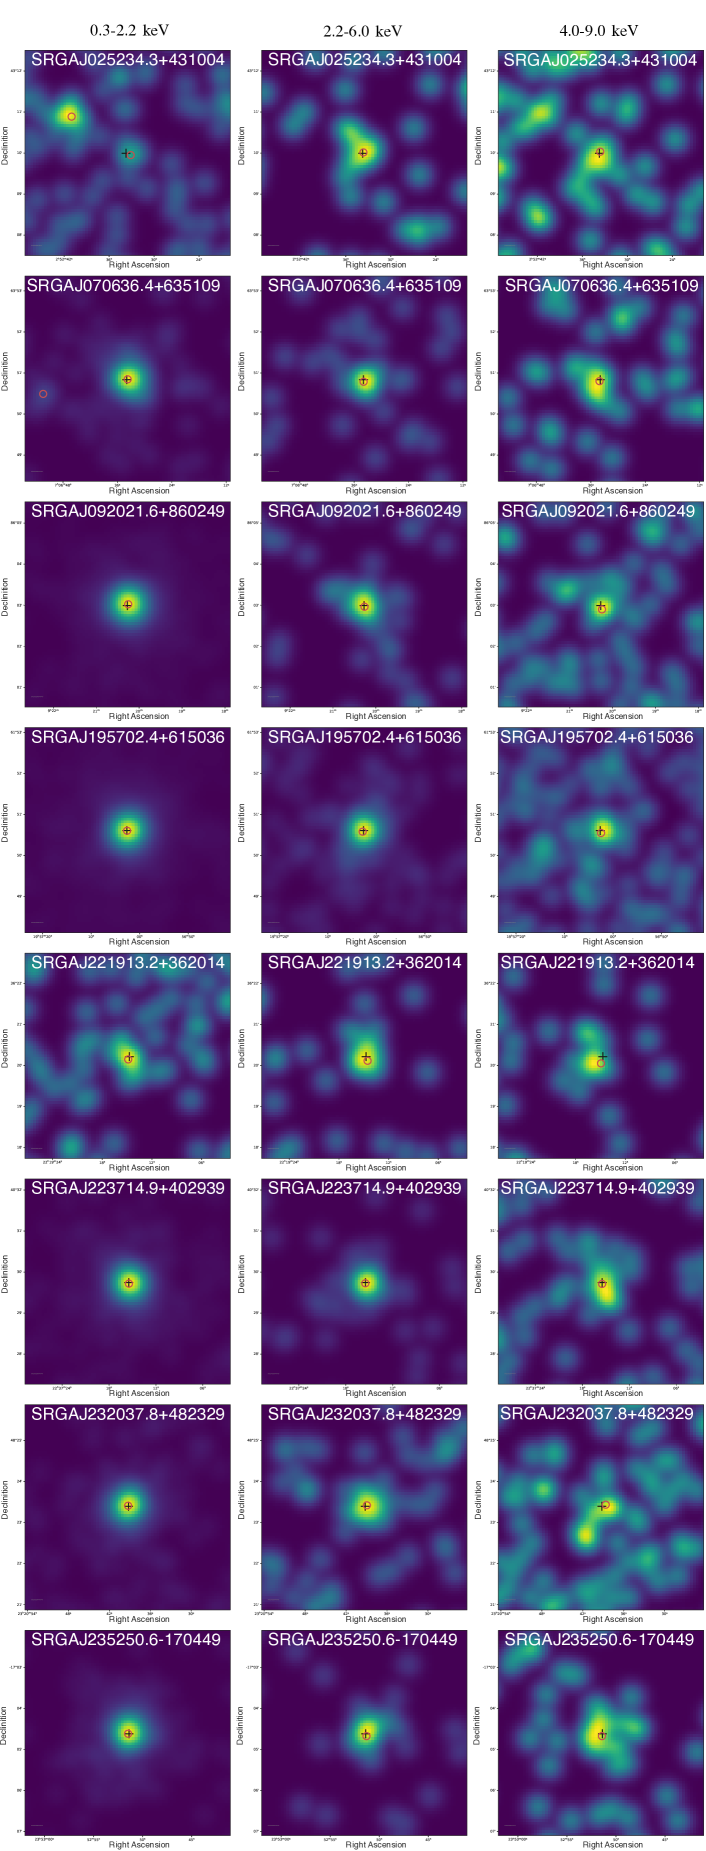
Among the 17 sources from the ART-XC catalog selected for our studies, eight are located on the half of the sky on which the Russian eROSITA consortium is responsible for processing the eROSITA data. All of the sources are detected by the eROSITA telescope in both soft (0.3–2.2 keV) and hard (4–9 keV) energy bands, except for SRGA J025234.3+431004 that is reliably () detected only at energies keV. The eROSITA images of all eight sources in the 0.3–2.2, 2.2–6.0, and 4.0–9.0 keV energy bands are presented in Fig. 1.
Our spectral analysis was performed jointly using the ART-XC and eROSITA data. The spectra were fitted in the energy range 0.2–20 keV with the XSPEC v12.11.0n222https://heasarc.gsfc.nasa.gov/xanadu/xspec/ software (Arnaud, 1996). The W-statistic, a modified C-statistic (Cash, 1979), in which the Poisson background around the source is taken into account was used for model fitting.
A preliminary version of the response matrix, which was prepared based on the observations of the Crab Nebula and its pulsar, was used in our spectral analysis of the ART-XC data. To investigate the relative calibration of the ART-XC and eROSITA telescopes, we chose comparatively bright sources from our sample and fitted simultaneously their spectra by power laws with absorptions. At the same time, a cross-calibration constant was added. It was fixed at unity for eROSITA and assumed to be the same for all sources for ART-XC. We obtained a value of for this constant and the corresponding 90% confidence interval (–). Since the value of the cross-calibration constant is compatible with unity, we concluded that its introduction is not required. Note that the work to refine the ART-XC response matrix continues, and a value of the cross-calibration constant different from unity may be required in analyzing the data of succeeding releases.
The X-ray radiation from AGNs can experience absorption in the gas–dust torus around the supermassive black hole (SMBH) and in the interstellar medium of the host galaxy. One of the goals of our study was to estimate the gas column density inside the objects being investigated. To describe the X-ray spectra, we used the standard (for AGN research) model of a power-law continuum with a low- energy cutoff as a result of photoabsorption in the Galaxy and the object itself. At energies below 2 keV an excess of X-ray emission (soft excess), whose nature is debated (see, e.g., Boissay et al. (2016)), is often observed in the X-ray spectra of AGNs. Given the comparatively small number of photons in the spectra being studied here, we used a simple phenomenological model of blackbody radiation with a fixed temperature keV to describe the soft component in the spectrum. Thus, we used two models in XSPEC:
where is the absorption in the Galaxy from HI4PI data (HI4PI Collaboration et al., 2016), zphabs is the absorption at the redshift of a given AGN (measured from the object’s optical spectrum), is the convolution model that normalizes the power-law component in flux in the 4–12 keV energy band (the absorption-corrected flux is determined in this way).
To compare the qualities of the fits between these two models, we used the Akaike information criterion (Akaike, 1974) , where is the number of free model parameters and cstat is the value of the likelihood function -2log (Cash, 1979). If AIC decreased by 5 or more when adding the blackbody component (this corresponds to the fact that the realization probability of the first model is no more than 8% of the realization probability of the second one), then preference was given to the two-component model.
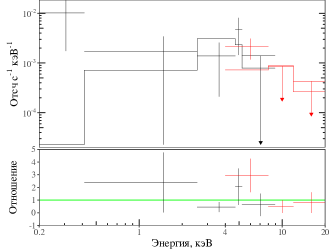
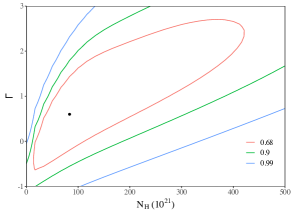
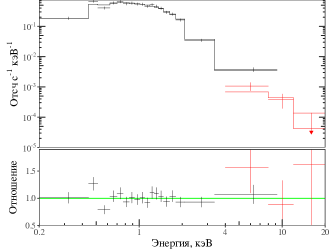
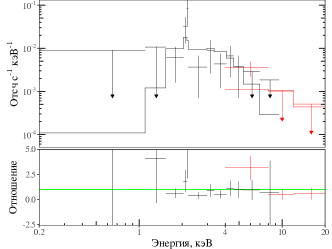
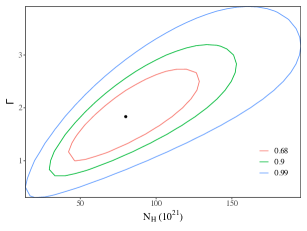
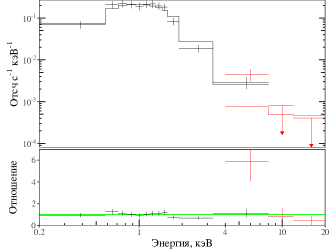
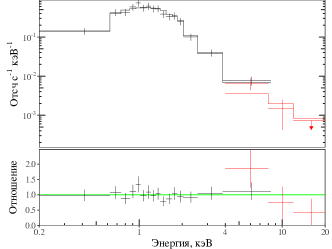
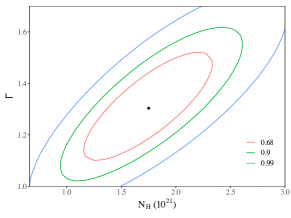
The spectral fitting results are presented in Table 3. The 90% confidence intervals of the parameters are given. The X-ray spectra themselves are presented below in the subsections devoted to the individual sources (Figs. 2–10). Some of the eROSITA spectra were rebinned for better visual perception. For three sources (SRGA J025234.3+431004, SRGA J221913.2+362014, SRGA J235250.6-170449), in which our spectral analysis revealed an intrinsic absorption, we also show the two-dimensional regions of spectral slopes and absorption column densities.
When analyzing Figs. 2–10, it can be noticed that the observed flux in the first ART-XC energy channel in the spectra for seven of the eight sources exceeds the value predicted by the model. In some cases, this excess is considerable and statistically significant. Part of the observed discrepancy between the ART-XC data and the model is probably associated with the Eddington bias, which stems from the fact that the sources have a low significance in the ART-XC data and are near the detection threshold. The drawbacks of the current ART-XC calibration, which will be removed in succeeding data releases, can also contribute noticeably to the observed discrepancy. In the context of interpreting the results of our joint spectral analysis of the eROSITA and ART-XC data presented here, it should be emphasized that the integral response of the ART-XC telescope in the 4–20 keV energy band was calibrated based on the Crab observations reasonably well and reproduces its flux with an accuracy , which allows these data to be used to analyze the broadband spectra. We should also take into account the fact that for most of the sources the spectral parameters are largely determined by the eROSITA data with a higher statistical significance.
| PHA(ZPHA CFLUX PL) | |||||||
| source | , | Cstat (dof) | AIC | ||||
| SRGA J | () | ||||||
| SRGA J | () | ||||||
| SRGA J | () | ||||||
| SRGA J | () | ||||||
| SRGA J | () | ||||||
| SRGA J | () | ||||||
| SRGA J | () | ||||||
| SRGA J | () | ||||||
| PHA(ZPHA CFLUX PL + BB) | |||||||
| SRGAJ070636.4+635109 | () | ||||||
| SRGAJ223714.9+402939 | () | ||||||
and are the gas column densities in the Milky Way Galaxy and the object, respectively, in units of cm-2; is the absorption-corrected flux in the 4–12 keV energy band created by the power-law component, in units of erg s-1 cm-2; is the normalization of the blackbody component.
3 OPTICAL OBSERVATIONS
| ART-XC source | Date | Grism | Slit | Exposure time, s | Telescope |
|---|---|---|---|---|---|
| SRGA J | 2021-09-29 | VPHG600G | AZT-33IK | ||
| SRGA J | 2021-11-05 | G15 | RTT-150 | ||
| SRGA J | 2021-05-13 | VPHG600G | AZT-33IK | ||
| SRGA J | 2021-10-31 | VPHG600G | AZT-33IK | ||
| SRGA J | 2021-05-12 | G15 | RTT-150 | ||
| SRGA J | 2021-10-31 | VPHG600G | AZT-33IK | ||
| 2021-10-31 | VPHG600R | AZT-33IK | |||
| SRGA J | 2021-05-13 | VPHG600G | AZT-33IK | ||
| SRGA J | 2021-11-05 | G15 | RTT-150 | ||
| SRGA J | 2021-09-11 | VPHG600G | AZT-33IK |
Our spectroscopy for the northern-sky () objects was performed at the RTT-150 telescope using the TFOSC333http://hea.iki.rssi.ru/rtt150/en/index.php?page=tfosc spectrograph and at the AZT-33IK telescope using the low- and medium-resolution ADAM spectrograph (Afanasiev et al., 2016; Burenin et al., 2016)(see the log of observations in Table 4). We used long slits of width 2\arcsec and 3\arcsec at the ADAM spectrograph and of 2\arcsecat the TFOSC spectrograph. The slit center was brought into coincidence with the central region of the observed galaxy. After each exposure, the object’s position was shifted along the slit by 10–15 in a random direction upward or down- ward using a photoguide. The optical observations were performed at a seeing better than 2.5\arcsec.
Transmitting diffraction grating no. 15 with the spectral range 3700–8700 Å providing a spectral resolution of 12 Åwas used at the TFOSC spectrograph as a dispersive element. This grating allows bright Balmer lines to be obtained in the spectral images for galaxies up to . The spectrograph slit position angle is 90. Before and after obtaining the series of spectroscopic images for each object, we obtained the images of a lamp with a continuum spectrum and the line spectrum of a Fe–Ar lamp.
We used volume phase holographic gratings (VPHG), 600 lines per millimeter, to take the spectra at the ADAM spectrograph. As a dispersive element we used VPHG600G for the spectral range 3650–7250 Å with a resolution of 8.6 Å for a 2\arcsecslit and 12.9 Å for a 3\arcsec slit and VPHG600R for the spectral range 6460–10 050 Å with a resolution of 18.3 Å for a 3\arcsecslit. When using VPHG600R, we set the OS11 filter, which removes the second interference order from the image. A thick e2v CCD30-11 array produced by the deep depletion technology is installed at the spectrograph. This allows the spectral images to be obtained at a wavelength of 10 000Å without interference on the thin CCD substrate. All our observations were performed with zero slit position angle. After each series of spectroscopic images for each object, we obtained the calibration images of a lamp with a continuum spectrum and the line spectrum of a He–Ne–Ar lamp.
On each observing night we took the spectra of spectrophotometric standards from the ESO444https://www.eso.org/sci/observing/tools/standards list for all the sets of diffraction gratings and slits being used. The spectrophotometric standards were chosen so that they were approximately at the same elevation with the optical source observed by us. The data reduction was performed using the IRAF5 software and our own software. The flux calibration was performed by standard IRAF555http://iraf.noao.edu/ procedures from the onedspec package.
4 RESULTS OF OBSERVATIONS
Here we discuss the results of our observations of the northern-sky objects. The emission lines were fitted by a Gaussian to determine such parameters as the line center, full width at half maximum , flux, and equivalent width . The spectral continuum was fitted by a polynomial whose order depended on the spectral shape. The FWHM of the Balmer lines was corrected for the spectral resolution of the instrument: ,where was determined for each dispersive element and each slit as the FWHM of the lines in the calibration lamp spectrum. The FWHMs of the narrow lines are consistent with the instrumental broadening and, therefore, the values of are not given for them in Tables 5–13.
Standard criteria (Osterbrock, 1981; Véron-Cetty et al., 2001) were used to classify the Seyfert galaxies. The measurement errors of the emission line parameters are given at the 68% confidence level.
The confidence level of the redshift was determined as the error of the mean of the narrow-line redshifts.
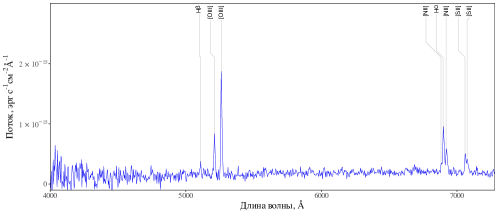
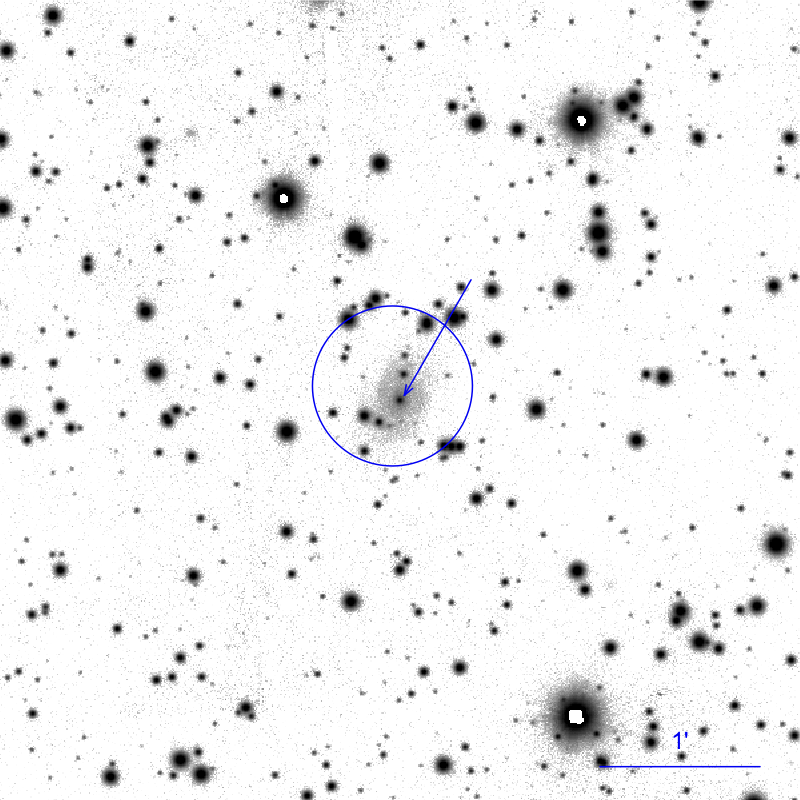
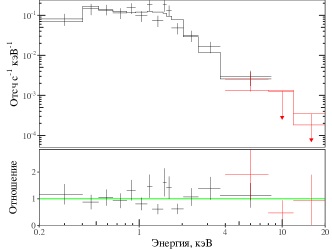
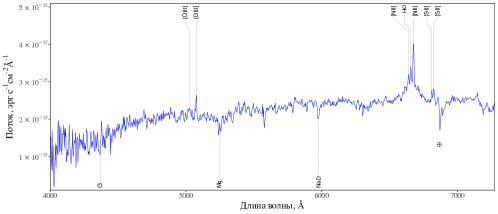
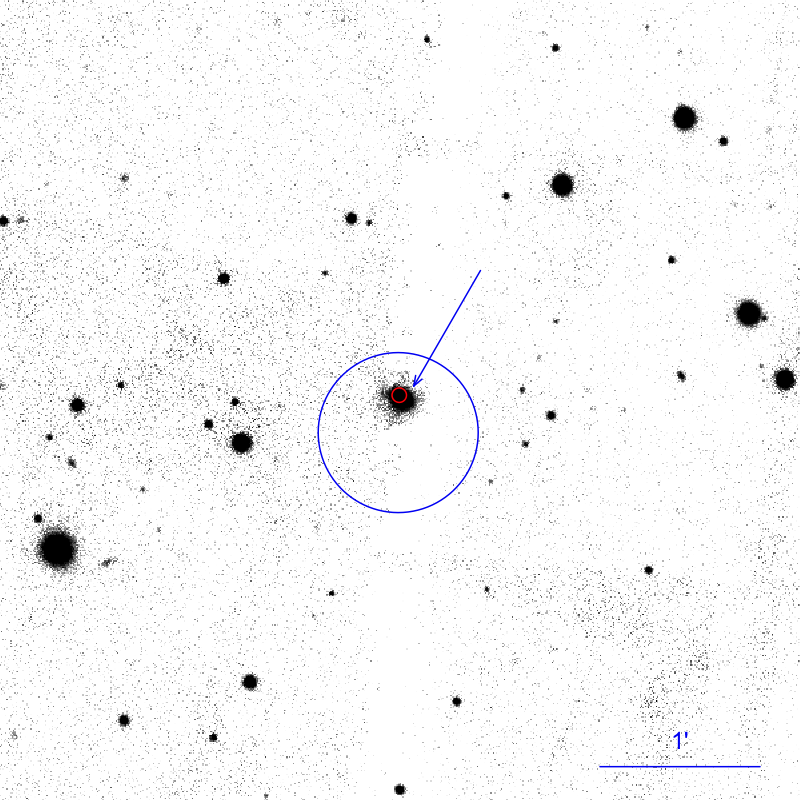
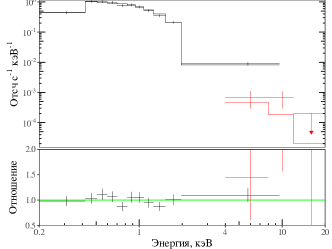
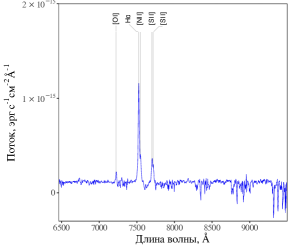
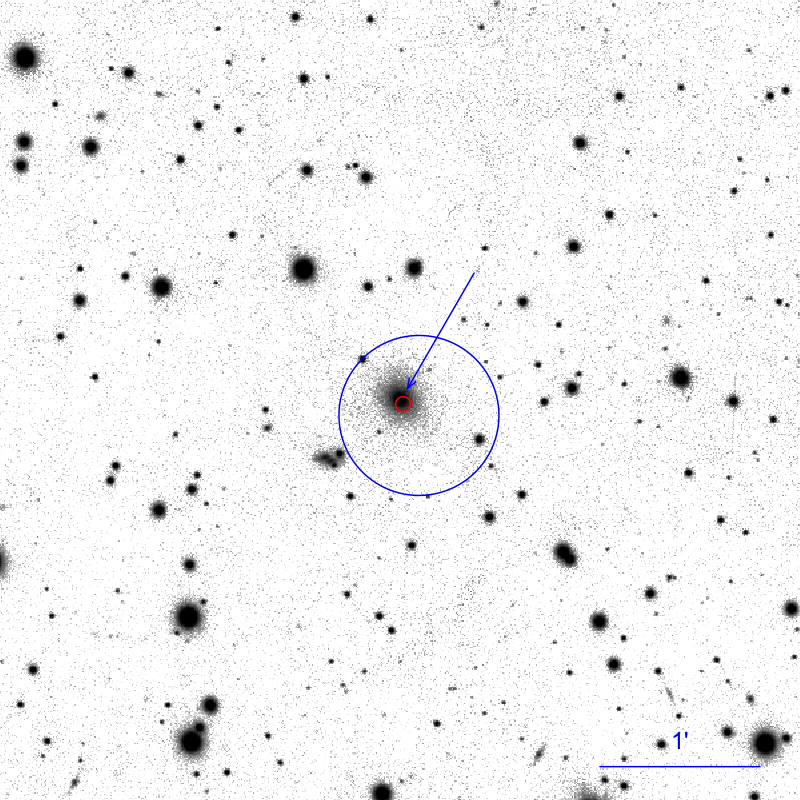
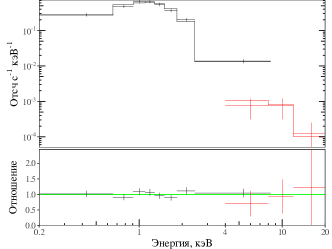
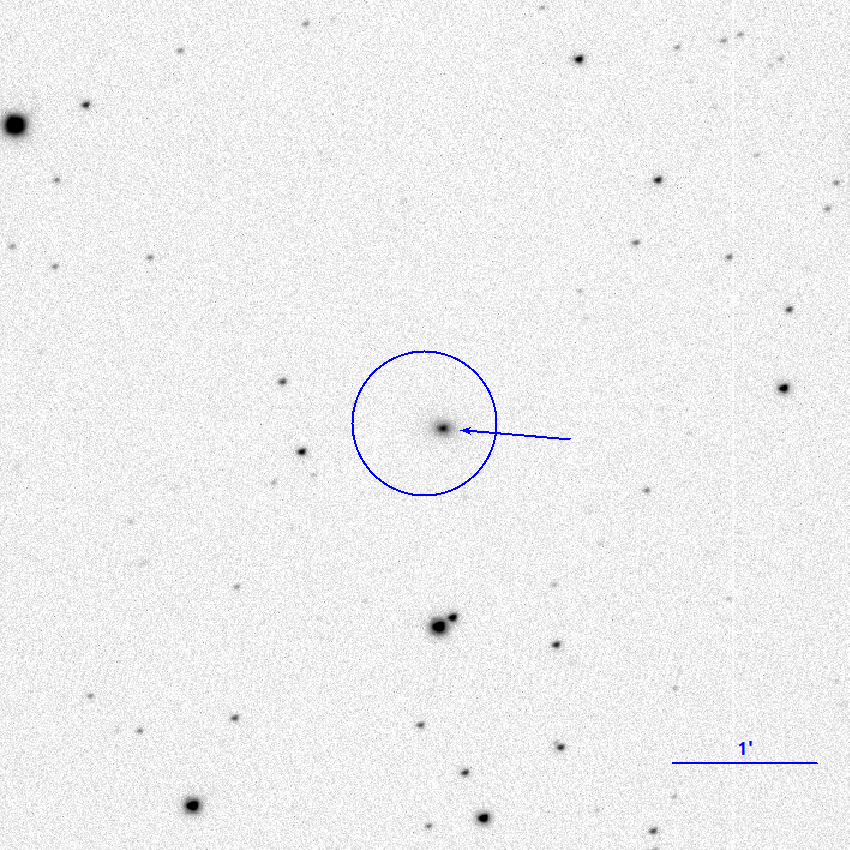
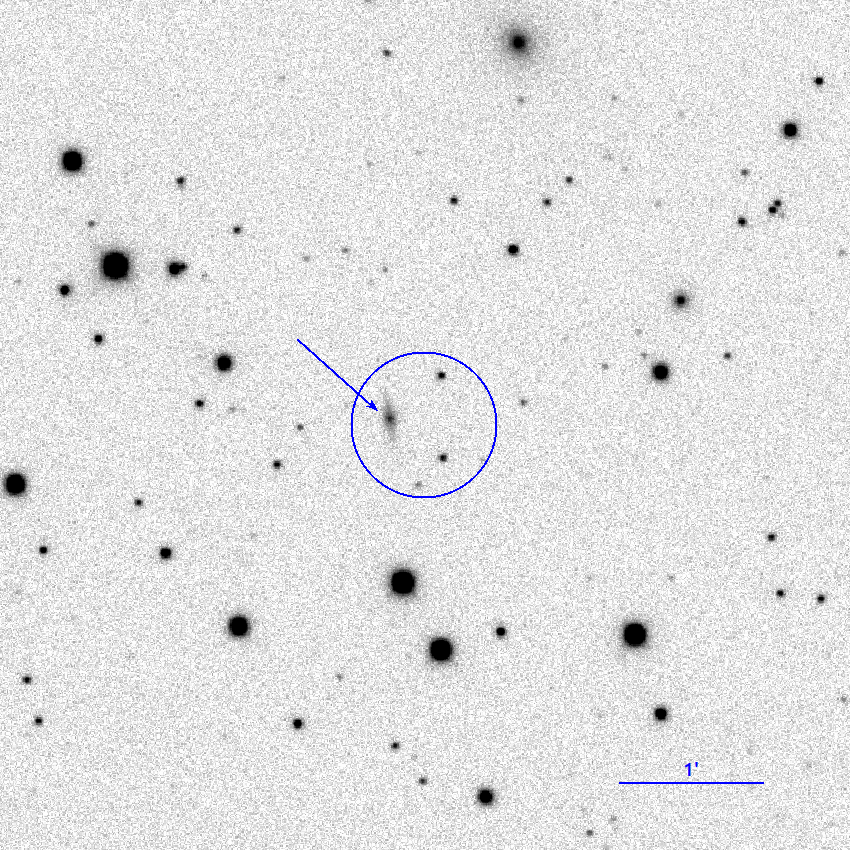
4.1 SRGA J025234.3+431004
This source was discovered in the Swift/BAT hard X-ray sky survey (PBC J0252.3+4309 = SWIFT J0252.3+4312) (Cusumano et al., 2010; Oh et al., 2018). There is the edge-on galaxy LEDA 90641 with the infrared color that points to the probable presence of an active galactic nucleus in the ART-XC position error circle. According to the SIMBAD astronomical database, the galaxy’s redshift is .
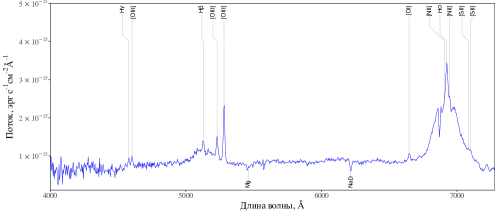
The galaxy’s spectrum (Fig. 2, Table 5) exhibits narrow H, 4959, 5007, 6548, H, 6584, and sulfur doublet lines, from which the redshift can be refined: . By its position on the BPT diagram (lg([OIII]H and lg([NII]H), the object can be attributed to Seyfert galaxies, while the absence of broad line components implies that this is Sy2.
| Line | Wavelength, Å | Flux, erg s-1 cm-2 | Eq. width, Å | , km/s |
|---|---|---|---|---|
| H | 5109 | |||
| [OIII]4959 | 5212 | |||
| [OIII]5007 | 5262 | |||
| [NII]6548 | 6884 | |||
| H | 6900 | |||
| [NII]6584 | 6923 | |||
| [SII]6718 | 7061 | |||
| [SII]6732 | 7075 |
SRGA J
{floatrow}
 {floatrow}
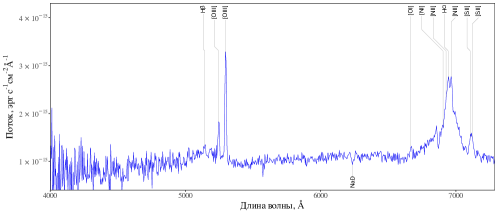
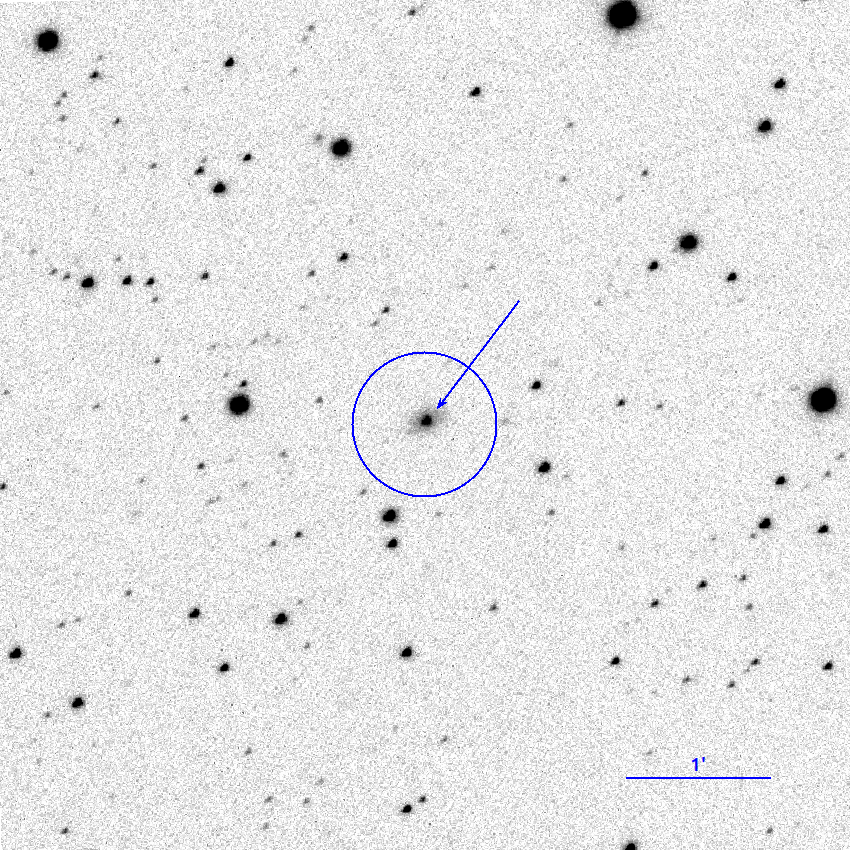
4.2 SRGA J062627.2+072734
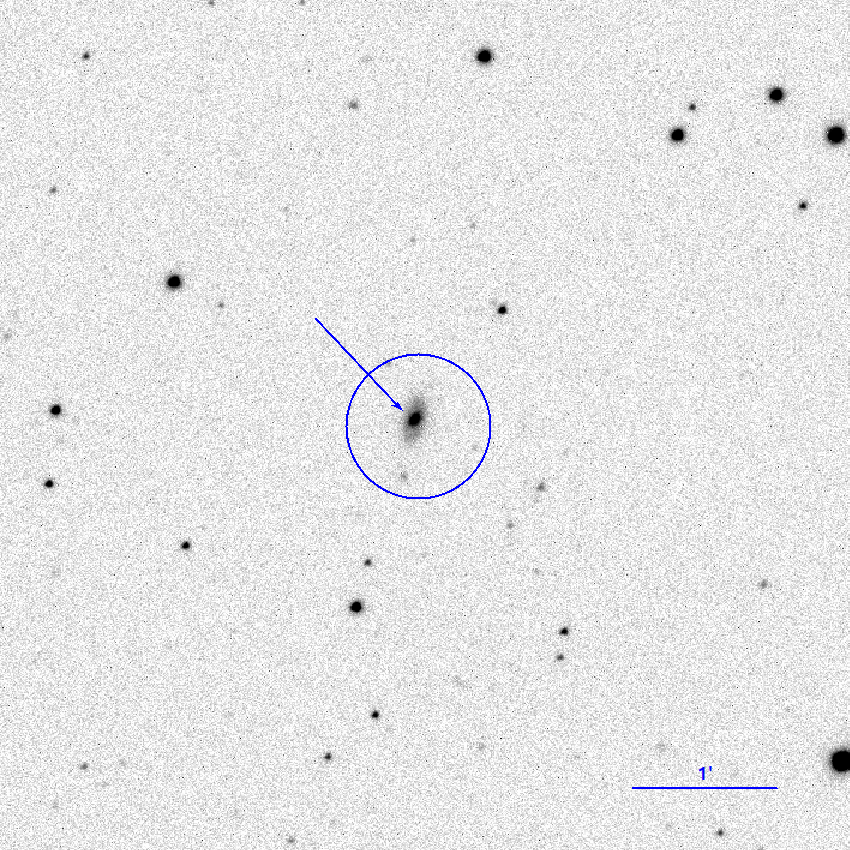
This source was discovered during the ROSAT all-sky survey (2RXS J062625.8+072733). It is also present in the catalog of sources of the Swift/BAT hard X-ray survey (SWIFT J0626.6+0729) (Oh et al., 2018). The object is on the half of the sky , on which we have no eROSITA data at our disposal. There is the galaxy LEDA 136513 (Fig. 3) with an infrared color typical for AGNs () in the ART-XT position error circle.
The galaxy’s optical spectrum (Fig. 3, Table 6) exhibits the H and H emission lines with intense broad components as well as narrow forbidden [OIII]4959, [OIII]5007, [NII]6548, [NII]6584, and sulfur doublet lines. The redshift is determined from these lines: . The ratios lg([OIII]H and lg([NII]H measured for the narrow H and H components are typical for AGNs, while the presence of broad H and H components with fluxes higher than those in the narrow components by an order of magnitude allows this object to be attributed to Seyfert 1 galaxies (Sy1).
| Line | Wavelength, Å | Flux, erg s-1 cm-2 | Eq. width, Å | , km/s |
|---|---|---|---|---|
| H, narrow | 5077 | |||
| H, broad | 5077 | |||
| [OIII]4959 | 5173 | |||
| [OIII]5007 | 5224 | |||
| [NII]6548 | 6826 | |||
| H, broad | 6841 | |||
| H, narrow | 6841 | |||
| [NII]6584 | 6859 | |||
| [SII]6718 | 7002 | |||
| [SII]6732 | 7017 |
SRGA J
{floatrow}
 {floatrow}
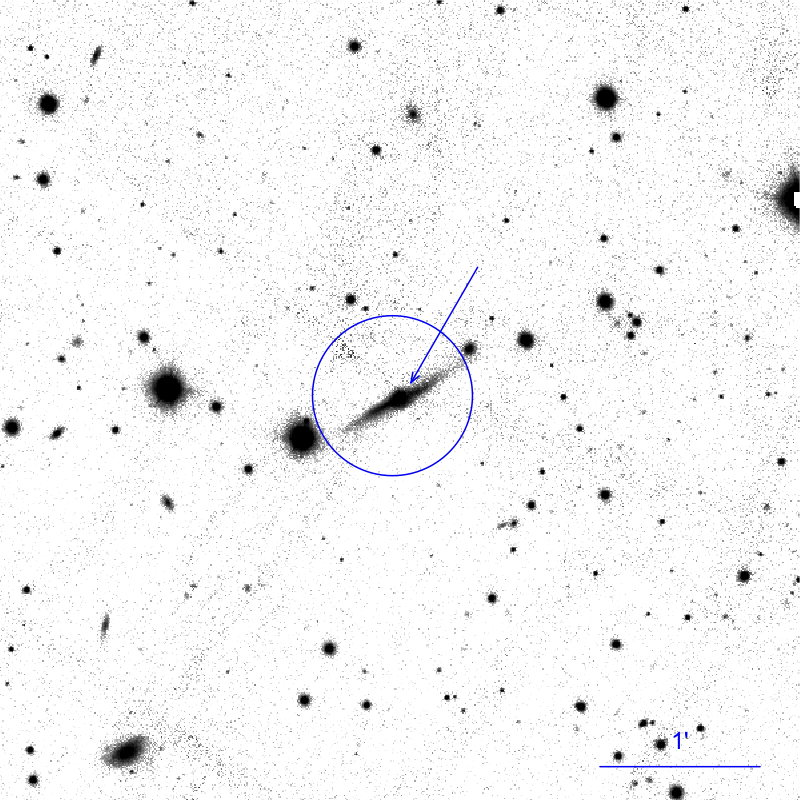
4.3 SRGA J070636.4+635109
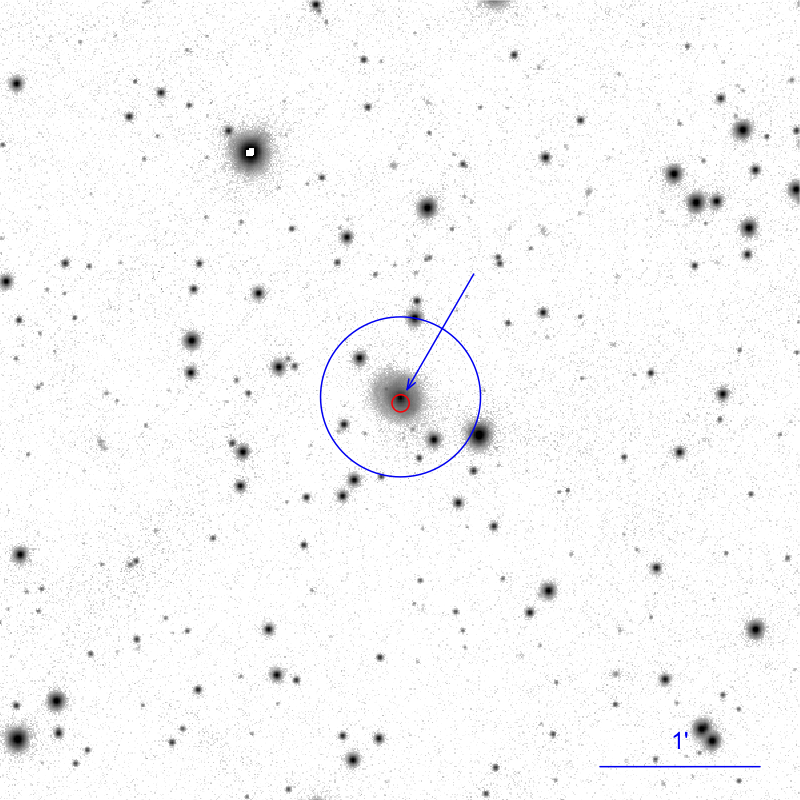
This X-ray source was discovered by the ART-XC telescope onboard the SRG observatory during the first year of its all-sky survey (Pavlinsky et al., 2022). It was also detected by the INTEGRAL gamma-ray observatory during a long-term hard X-ray all-sky survey (for a review, see Krivonos et al. (2021)) on the maps of the galaxy M81 (Mereminskiy et al., in preparation) with a flux of erg s-1 cm-2 in the 17–60 keV energy band. There is the galaxy UGC 3660 at (according to SIMBAD) in the ART-XC position error circle refined based on the eROSITA data (Fig. 4) with which the radio source NVSS J070632+635101 (Condon et al., 1998) can also be associated.
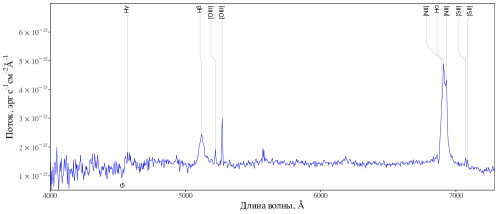
The galaxy’s spectrum (Fig. 4, Table 7) exhibits narrow [OIII]4959, [OIII]5007, [NII]6548, H, [NII]6584, and sulfur doublet emission lines; a broad H component is seen. At the same time, the H line is not detected. The spectrum also exhibits the G, MgI, and NaD absorption lines of the Fraunhofer series. The object’s redshift measured from the lines is .
By its position on the BPT diagram (lg([OIII]H, lg([NII]H), the object can be attributed to Seyfert or LINER galaxies. However, the presence of a broad H component and the absence of H allow the object to be classified as a Seyfert 1.8 galaxy (Sy1.8).
| Line | Wavelength, Å | Flux, erg s-1 cm-2 | Eq. width, Å | , km/s |
|---|---|---|---|---|
| H | 4930 | |||
| [OIII]4959 | 5027 | |||
| [OIII]5007 | 5076 | |||
| [NII]6548 | 6640 | |||
| H | 6657 | |||
| H, broad | 6657 | |||
| [NII]6584 | 6676 | |||
| [SII]6718 | 6811 | |||
| [SII]6732 | 6826 |
SRGA J
{floatrow}
 {floatrow}
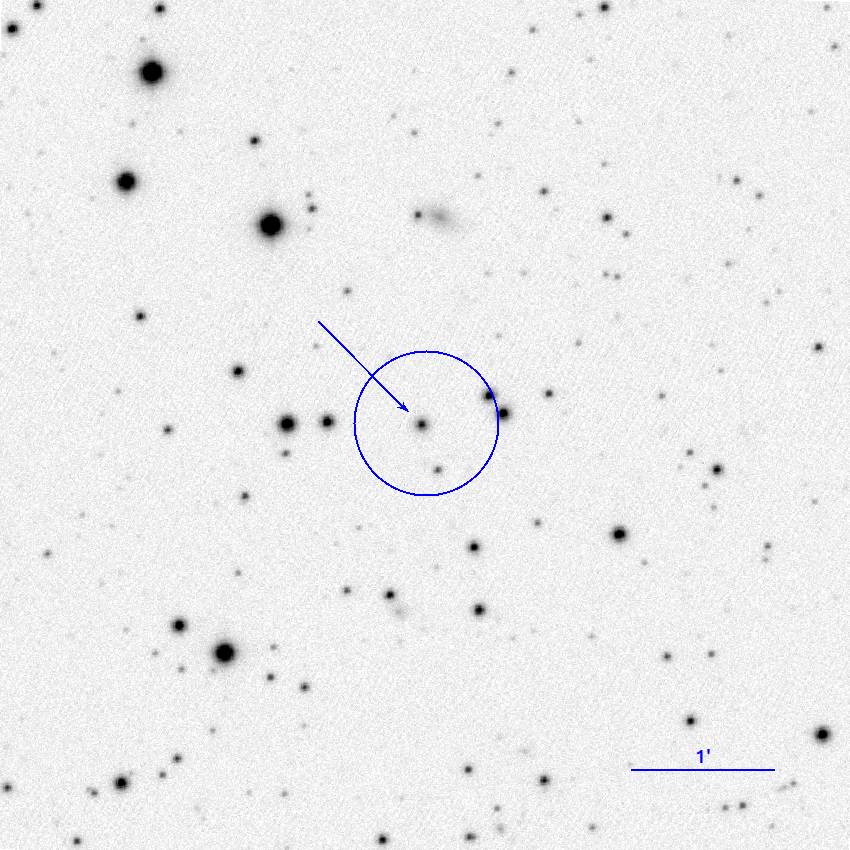
4.4 SRGA J092021.6+860249
This source was discovered during the ROSAT all-sky survey (2RXS J092015.8+860253). There is the galaxy LEDA 2790304 with an infrared color typical for AGNs () in the eROSITA position error circle (Fig. 5). The radio source NVSS J is also associated with it.
The optical spectrum (Fig. 5, Table 8) exhibits the Balmer H, H, and H emission lines with broad components, narrow forbidden [OIII]4959, [OIII]5007, [NII]6584, [SII]6718, [SII]6732 lines, and the G absorption line. The measured redshift of the object is . The narrow-line flux ratios lg([OIII]H and lg([NII]H are typical for AGNs, while the presence of broad H, H and H components allows the object to be classified as Sy1.
| Line | Wavelength, Å | Flux, erg s-1 cm-2 | Eq. width, Å | , km/s |
|---|---|---|---|---|
| H, narrow | 4581 | |||
| H, broad | 4581 | |||
| H, narrow | 5121 | |||
| H, broad | 5121 | |||
| [OIII]4959 | 5222 | |||
| [OIII]5007 | 5272 | |||
| [NII]6548 | 6894 | |||
| H, narrow | 6910 | |||
| H, broad | 6910 | |||
| [NII]6584 | 6931 | |||
| [SII]6718 | 7072 | |||
| [SII]6732 | 7086 |
SRGA J
{floatrow}
 {floatrow}
4.5 SRGAJ195702.4+615036
This source was discovered during the ROSAT all-sky survey (2RXS J195702.4+615038). There is the galaxy LEDA 2625686 with an infrared color typical for AGNs () in the eROSITA position error circle (Fig. 6).
The galaxy’s spectrum (Fig. 6, Table 9) exhibits the H and H emission lines with broad com- ponents, the forbidden [OIII]4959, [OIII]5007, [OI]6300, [SII]6718, [SII]6732 lines, and the Fraunhofer MgI absorption line. The measured redshift of the object is . The narrow-line flux ratios lg([OIII]H and lg([NII]H point to the presence of an active galactic nucleus. The flux in the broad H and H components exceeds considerably the flux in the narrow ones, which allows the object to be classified as Sy1.
| Line | Wavelength, Å | Flux, erg s-1 cm-2 | Eq. width, Å | , km/s |
|---|---|---|---|---|
| H, narrow | 5146 | |||
| H, broad | 5146 | |||
| [OIII]4959 | 5249 | |||
| [OIII]5007 | 5299 | |||
| [OI]6300 | 6671 | |||
| [NII]6548 | 6935 | |||
| H, narrow | 6950 | |||
| H, broad | 6950 | |||
| [NII]6584 | 6970 | |||
| [SII]6718 | 7111 | |||
| [SII]6732 | 7126 |
SRGA J
{floatrow}
 {floatrow}
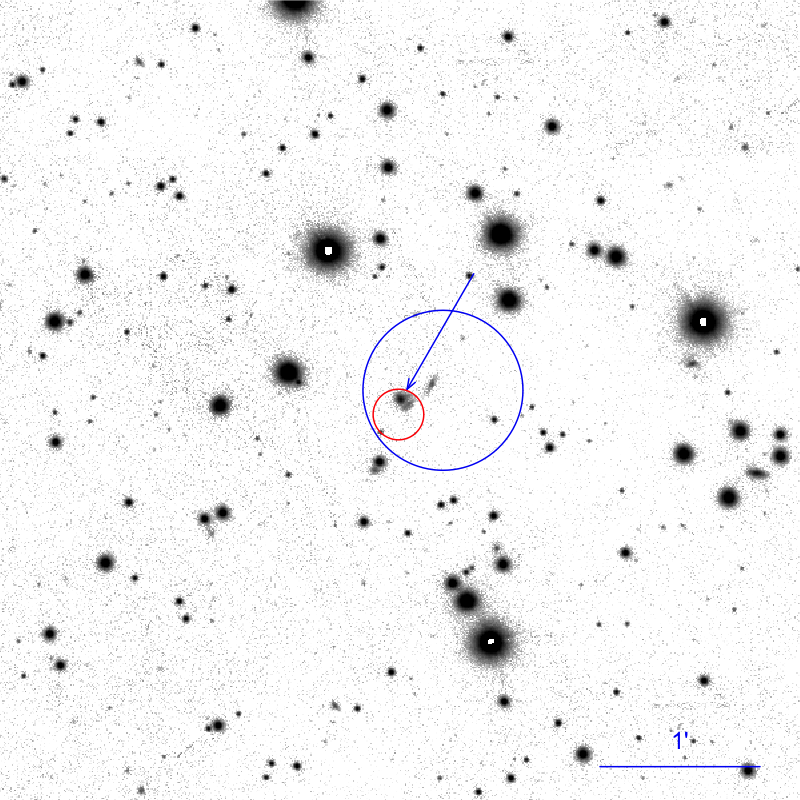
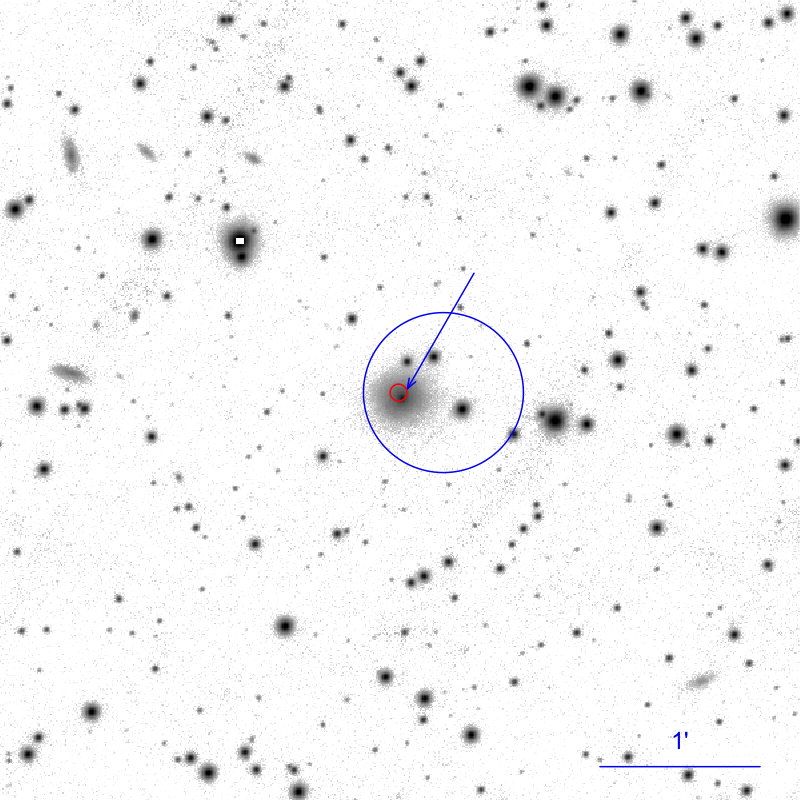
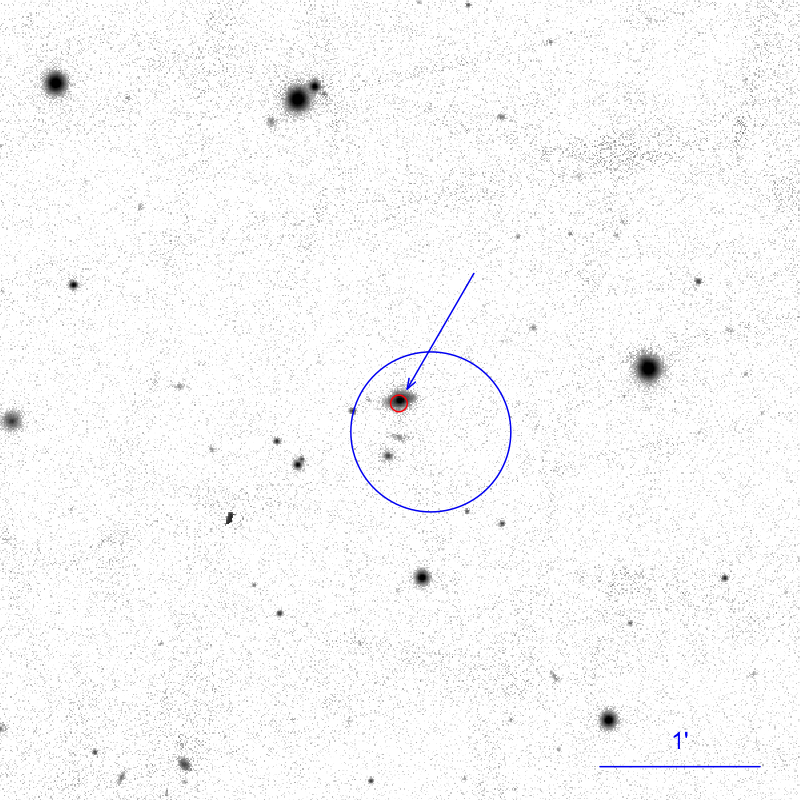
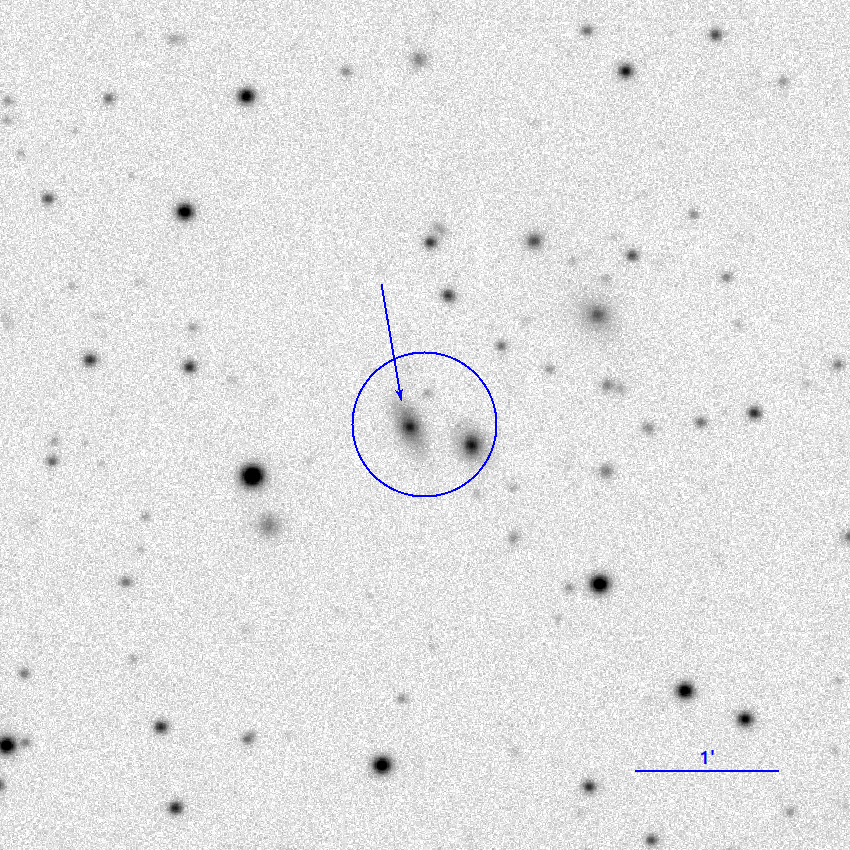
4.6 SRGA J221913.2+362014
This X-ray source was discovered by the ART-XC telescope onboard the SRGobservatory during the first year of its all-sky survey (Pavlinsky et al., 2022). There is the optical–infrared–radio source NVSS J = WISEA J with an infrared color typical for AGNs () in the ART-XC position error circle refined based on the eROSITA data (Fig. 4).
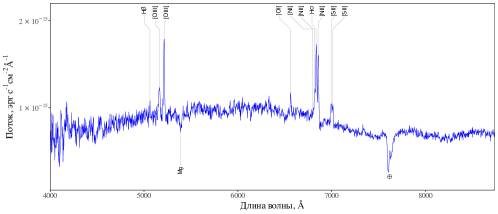
The optical spectrum (Fig. 7, Table 10) exhibits many forbidden neutral and ionized oxygen, sulfur, neon emission lines and narrow Balmer H, H, and H emission lines. The measured redshift is . By its position on the BPT diagram (lg([OIII]H and lg([NII]H), the object can be attributed to Seyfert galaxies, while the absence of broad Balmer line components implies that this is Sy2.
| Line | Wavelength, Å | Flux, erg s-1 cm-2 | Eq. width, Å | , km/s |
|---|---|---|---|---|
| H | 5572 | |||
| [OIII]4959 | 5686 | |||
| [OIII]5007 | 5741 | |||
| [OI]6300 | 7225 | |||
| [NII]6548 | 7505 | |||
| H | 7526 | |||
| [NII]6584 | 7550 | |||
| [SII]6718 | 7702 | |||
| [SII]6732 | 7722 |
SRGA J
{floatrow}
 {floatrow}
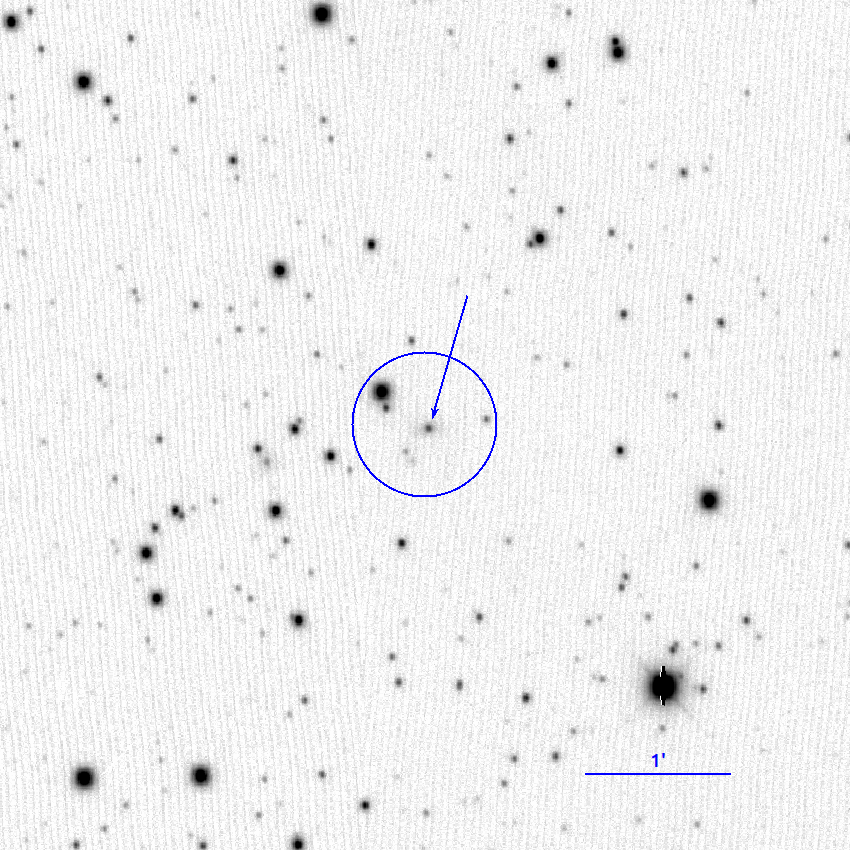
4.7 SRGA J223714.9+402939
This source was discovered during pointed ROSAT observations (1WGA J2237.2+4029) (White et al., 2000). There is the galaxy LEDA 5060459 with an infrared color typical for AGNs () in the eROSITA position error circle (Fig. 8). According to SIMBAD, the galaxy’s redshift is .
The optical spectrum (Fig. 8, Table 11) exhibits forbidden oxygen and sulfur emission lines as well as the H and H emission lines with broad components. The refined redshift of the object is . By its position on the BPT diagram (lg([OIII]H and lg([NII]H), the object can be attributed to Seyfert galaxies, while the presence of broad H and H components, the flux in which is much greater than that in the narrow ones, allows the object to be classified as Sy1.
| Line | Wavelength, Å | Flux, erg s-1 cm-2 | Eq. width, Å | , km/s |
|---|---|---|---|---|
| H, narrow | 5144 | |||
| H, broad | 5144 | |||
| [OIII]4959 | 5247 | |||
| [OIII]5007 | 5298 | |||
| [OI]6300 | 6668 | |||
| [NII]6548 | 6929 | |||
| H, narrow | 6945 | |||
| H, broad | 6945 | |||
| [NII]6584 | 6967 | |||
| [SII]6718 | 7109 | |||
| [SII]6732 | 7124 |
* The value of the parameter was fixed when fitting the line.
SRGA J
{floatrow}
 {floatrow}
4.8 SRGA J232037.8+482329
This source was discovered during the ROSAT all-sky survey (2RXS J232039.7+482317). There is the galaxy LEDA 2316409 at (according to SIMBAD) in the eROSITA position error circle, with which the radio source NVSS J is associated.
The galaxy’s spectrum (Fig. 9, Table 12) exhibits forbidden oxygen and sulfur lines, narrow H and H emission lines, and the Fraunhofer MgI absorption line. The refined redshift of the galaxy is . By its position on the BPT diagram (lg([OIII]H and lg([NII]H) and the absence of broad H and H components, the object can be classified as Sy2.
| Line | Wavelength, Å | Flux, erg s-1 cm-2 | Eq. width, Å | , km/s |
|---|---|---|---|---|
| H | 5062 | |||
| [OIII]4959 | 5164 | |||
| [OIII]5007 | 5213 | |||
| [OI]6300 | 6563 | |||
| [NII]6548 | 6819 | |||
| H | 6836 | |||
| [NII]6584 | 6857 | |||
| [SII]6718 | 6997 | |||
| [SII]6732 | 7012 |
SRGA J
{floatrow}
 {floatrow}
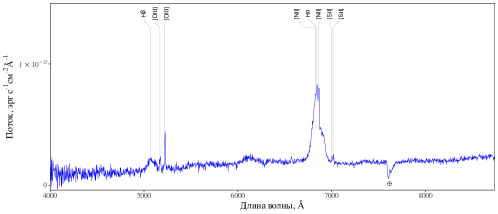
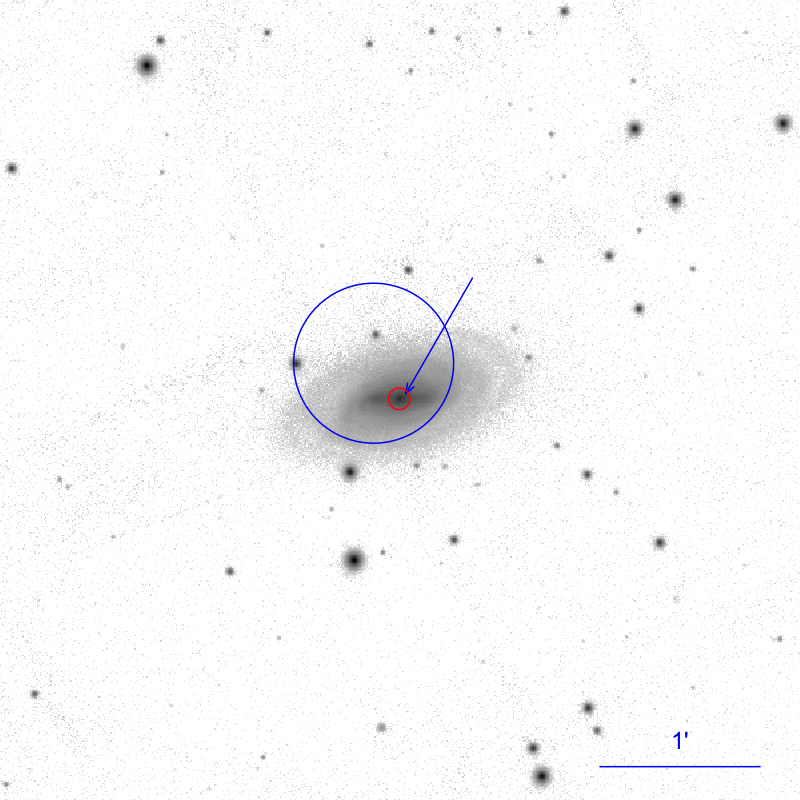
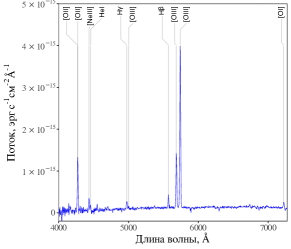
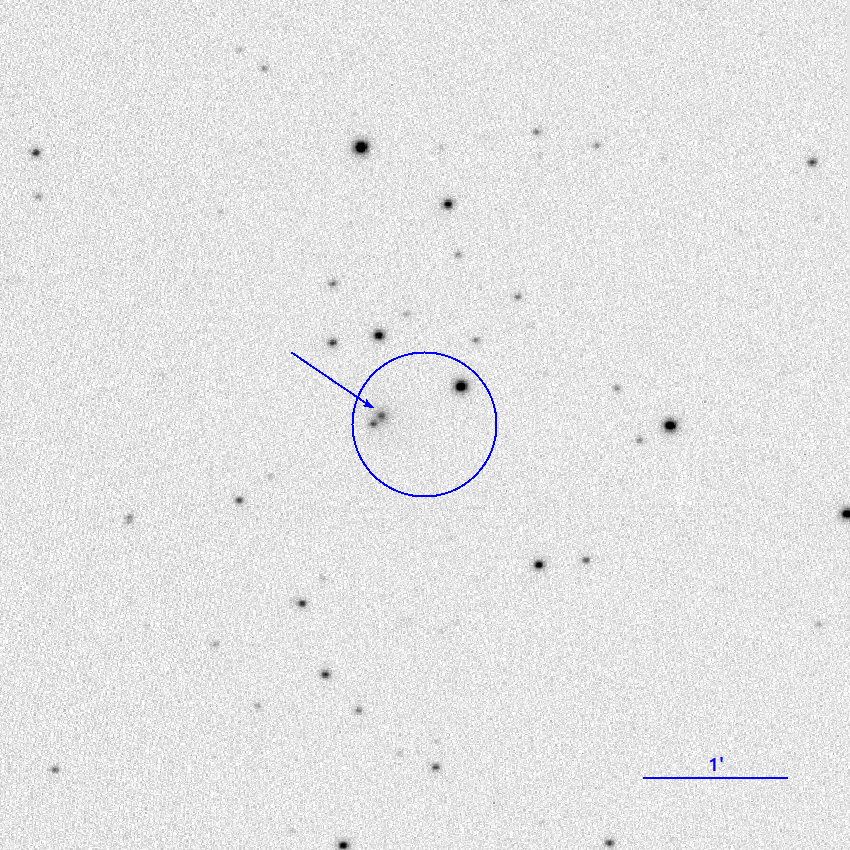
4.9 SRGA J235250.6-170449
This source was discovered in the Swift/BAT hard X-ray sky survey (Oh et al., 2018). There is the galaxy 2MASS J in the eROSITA position error circle (Fig. 10), whose infrared color () suggests the presence of an AGN.
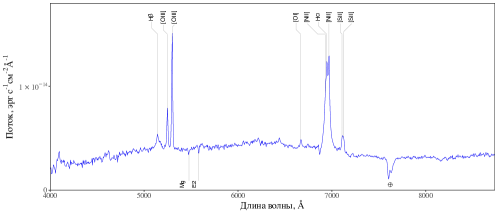
The galaxy’s spectrum (Fig. 10, Table 13) exhibits many forbidden oxygen, sulfur, nitrogen emission lines and the Balmer H, H, and H emission lines, the first two of which have intense broad components; the Fraunhofer MgI and NaD absorption lines are also seen. The measured red-shift of the object is . Although the object cannot be unambiguously attributed to Seyfert galaxies by its position on the BPT diagram (lg([OIII]H and lg([NII]H), the presence of intense broad components in the H and H emission lines allows it to be classified as Sy1.
| Line | Wavelength, Å | Flux, erg s-1 cm-2 | Eq. width, Å | , km/s |
|---|---|---|---|---|
| H, narrow | 5129 | |||
| H, broad | 5129 | |||
| [OIII]4959 | 5231 | |||
| [OIII]5007 | 5282 | |||
| [OI]6302 | 6648 | |||
| [NII]6548 | 6909 | |||
| H, narrow | 6925 | |||
| H, broad | 6925 | |||
| [NII]6584 | 6946 | |||
| [SII]6718 | 7089 | |||
| [SII]6732 | 7105 |
SRGA J
{floatrow}
 {floatrow}
4.10 Southern-Sky Objects
The eight ART-XC southern-sky () objects are identified with galaxies (Fig. 11), for which there are the spectra taken during the 6dF survey (Jones et al., 2004, 2009). One of these X-ray sources (SRGA J030838.1-552041) associated with the galaxy LEDA 410289 was discovered by the ART-XC telescope onboard the SRGobservatory (Pavlinsky et al., 2022), two (SRGAJ052959.8–340157 = XMMSL2 J052958.9–340159 = LEDA 668116 and SRGAJ060241.1–595152 = XMMSL2 J060241.6– 595149 = LEDA 178859) were detected for the first time during the XMM-Newton slew survey XMM-SSC 2018, and the remaining five (SRGAJ055053.7-621457 = 2RXS J055054.2-621454 = LEDA 178653, SRGAJ061322.9-290027 = 2RXS J061324.1-290029 = LEDA 734640, SRGAJ063324.9-561424 = 2RXS J063326.4-561427 = LEDA 148903, SRGAJ064421.5-662620 = 2RXS J064422.7-662623 = 2MASS J06442187-6626199, SRGAJ072823.5-440823 = 2RXS J072822.3-440821 = 2MASS J07282338–4408241) were discovered during the ROSAT all-sky survey (Boller et al., 2016). All of the listed galaxies are characterized by an infrared color typical for Seyfert galaxies ( from 0.5 to 1.0).
SRGAJ030838.1-552041 SRGAJ052959.8-340157 SRGAJ055053.7-621457
 SRGAJ060241.1-595152 SRGAJ061322.9-290027 SRGAJ063324.9-561424
 SRGAJ064421.5-662620 SRGAJ072823.5-440823
The 6dF survey was conducted at the UKST 1.2-m Schmidt telescope using a multi-fiber spectrograph with a field of view equipped with two low-resolution () gratings with overlapping spectral ranges. The range – Åwas completely covered. The spectra taken during the survey were not flux-calibrated and are presented666http://www-wfau.roe.ac.uk/6dFGS/ in counts, which does not allow the absolute fluxes in emission lines to be measured. However, these data can be used to estimate the line equivalent widths and the ratios of the fluxes in the pairs of closely spaced lines (H, [OIII]) and ([NII], H), which are used to classify the AGNs by the BPT diagram.
Tables 14, 15 and 16 present the emission-line characteristics for the objects from our sample determined based on the 6dF spectra. The errors are given at the 68% confidence level. The line FWHMs were corrected for the instrumental broadening of 5.75 Å. The redshifts of the objects were taken from the 6dF catalog (Jones et al., 2009).
| Line | Eq. width, Å | , km/s |
|---|---|---|
| SRGA J | ||
| H | ||
| [OIII]4959 | ||
| [OIII]5007 | ||
| [NII]6548 | ||
| H | ||
| [NII]6584 | ||
| [SII]6717 | ||
| [SII]6730 | ||
| SRGA J | ||
| [OII]3727 | ||
| H | ||
| [OIII]4959 | ||
| [OIII]5007 | ||
| [NII]6548 | ||
| H, narrow | ||
| H, broad | ||
| [NII]6584 | ||
| SRGA J | ||
| H, broad | ||
| H, broad | ||
| H, narrow | - | |
| H, broad | ||
| [OIII]4959 | ||
| [OIII]5007 | ||
| H, narrow | ||
| H, broad | ||
| [NII]6584 | ||
| SRGA J | ||
| H | ||
| [OIII]4959 | ||
| [OIII]5007 | ||
| H | ||
| [NII]6584 | ||
| Line | Eq. width, Å | , km/s |
|---|---|---|
| SRGA J | ||
| H | ||
| [OIII]4959 | ||
| [OIII]5007 | ||
| [OI]6300 | ||
| [NII]6548 | ||
| H | ||
| [NII]6584 | ||
| [SII]6717 | ||
| [SII]6730 | ||
| SRGA J | ||
| [OIII]4959 | ||
| [OIII]5007 | ||
| [NII]6548 | ||
| H | ||
| [NII]6584 | ||
| SRGA J | ||
| H | ||
| [OII]3727 | ||
| H, narrow | ||
| H, broad | ||
| [OIII]4959 | ||
| [OIII]5007 | ||
| H, narrow | ||
| H, broad | ||
| [NII]6584 | ||
| SRGA J | ||
| H, broad | ||
| H, narrow | - | |
| H, broad | ||
| [OIII]4959 | ||
| [OIII]5007 | ||
| H, narrow | ||
| H, broad | ||
| [NII]6584 | ||
| Object | lg([OIII]H | lg([NII]H |
|---|---|---|
| SRGA J | ||
| SRGA J | ||
| SRGA J | ||
| SRGA J | ||
| SRGA J | ||
| SRGA J | ||
| SRGA J | ||
| SRGA J |
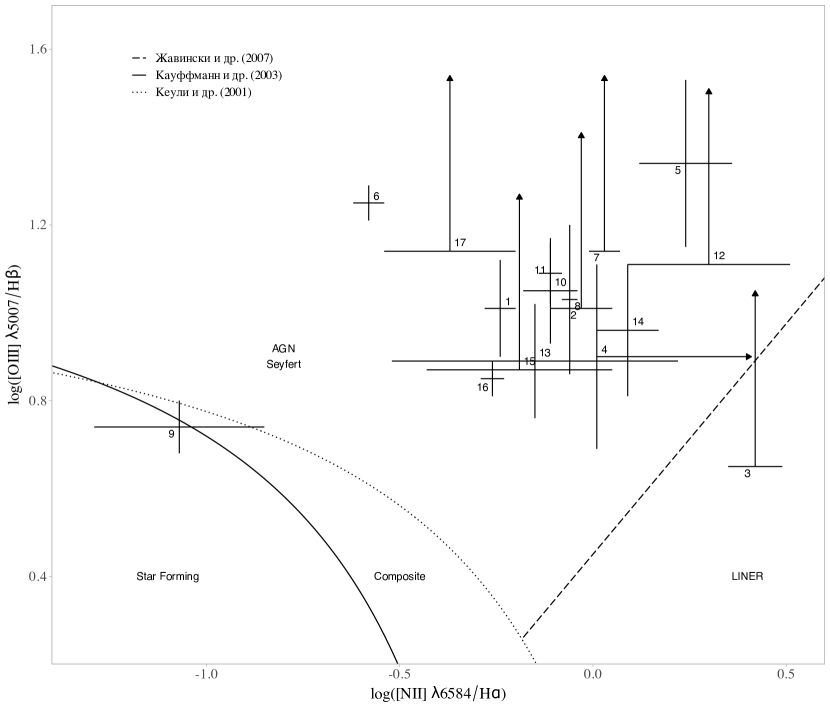
5 PROPERTIES OF THE DETECTED AGNs
Tables 17 and 18 present basic properties of the AGNs that we managed to identify in this paper: the redshift, the optical type, and the X-ray luminosity in the 4–12 keV energy band.
We found the X-ray luminosity based on the 4–12 keV flux (see Tables 1 and 2) from the catalog of X-ray sources (Pavlinsky et al., 2022) in the first year of the SRG/ART-XC survey and the photometric distance to the object calculated from its redshift. The presented values of disregard the -corrections and were not corrected for absorption on the line of sight.
All of the objects being discussed turned out to be nearby Seyfert galaxies with luminosities – erg/s and fall into the region of Seyfert galaxies on the standard BPT diagram (Fig. 12) of [OIII]5007/H and [NII]6584/H flux ratios. Although the sources SRGA J and SRGA J are at the boundary of this region, the presence of broad Balmer line components in the spectra of these galaxies unambiguously suggests that these are Seyfert 1 galaxies.
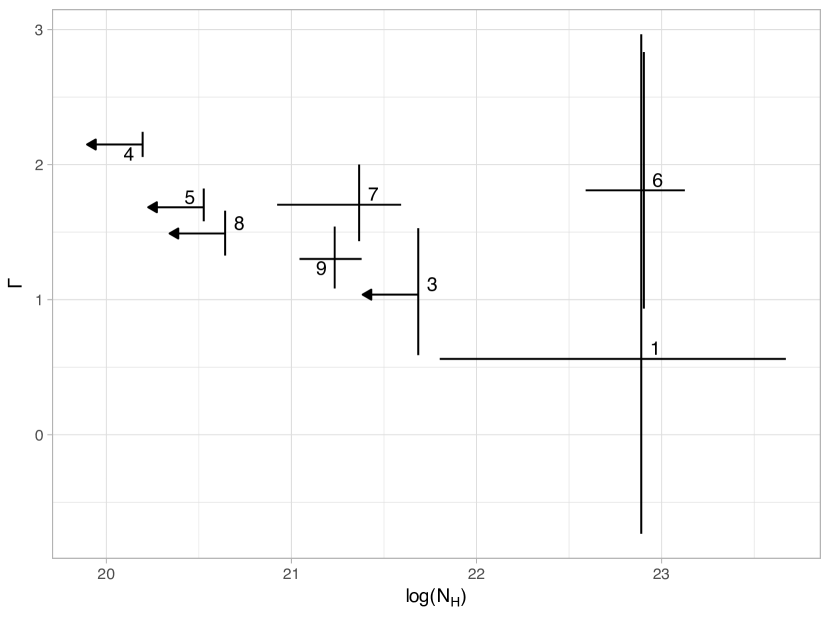
In Fig. 13 the slope of the power-law continuum is plotted against the intrinsic absorption column density for the eight objects from our sample for which the X-ray spectra from the ART-XC and eROSITA data were analyzed. Most of the derived slopes agree within the error limits with –2, which is typical for AGNs.
| Object | Optical type | 1 | |
|---|---|---|---|
| SRGA J | Sy2 | ||
| SRGA J | Sy1 | ||
| SRGA J | Sy1.8 | ||
| SRGA J | Sy1 | ||
| SRGA J | Sy1 | ||
| SRGA J | Sy2 | ||
| SRGA J | Sy1 | ||
| SRGA J | Sy2 | ||
| SRGA J | Sy1 |
1 The luminosity in the observed 4–12 keV energy band in units of erg/s uncorrected for absorption. The error corresponds to the 68% confidence interval.
| Object | Optical type | 2 | |
|---|---|---|---|
| SRGA J | Sy2 | 0.07791 | |
| SRGA J | Sy1.8 | 0.07900 | |
| SRGA J | Sy1 | 0.05875 | |
| SRGA J | Sy2 | 0.10051 | |
| SRGA J | Sy2 | 0.07051 | |
| SRGA J | Sy2 | 0.04784 | |
| SRGA J | Sy1 | 0.07843 | |
| SRGA J | Sy1 | 0.08171 |
1 The values were taken from the catalog of redshifts of the 6dF survey. 2 The luminosity in the observed 4–12 keV energy band in units of erg/s uncorrected for absorption. The error corresponds to the 68% confidence interval, without the error in .
6 CONCLUSIONS
Using the observations carried out at the AZT-33IK and RTT-150 telescopes and the archival spectroscopic data from the 6dF survey, we managed to identify 17 new AGNs among the X-ray sources detected during the first year of the SRG/ART-XC all-sky survey. All of them turned out to be nearby Seyfert galaxies (eight Sy1, two Sy1.8, and seven Sy2) at redshifts from to .
For eight objects located on the half of the sky , we constructed broadband (0.2–20 keV) X-ray spectra based on data from the ART-XC and eROSITA telescopes onboard the SRGobservatory. An intrinsic absorption was revealed in the spectra of three of these objects, with two of them (the Seyfert 2 galaxies SRGA J025234.3+431004 and SRGA J221913.2+362014) being strongly absorbed ( cm-2) and the third one (Sy1 SRGA J235250.6-70449) being characterized by a relatively weak absorption ( cm-2). Note H that the strongly absorbed source SRGA J025234.3+ 431004 is associated with an edge-on galaxy (LEDA 90641). Therefore, absorption can arise in this case not only in the gas–dust torus around the supermassive black hole, but also in the interstellar medium of the galaxy.
The SRGall-sky survey continues. It is expected that by the end of the four-year-long survey the ART-XC telescope will detect 5000 sources in the 4–12 keV energy band, mostly AGNs at low redshifts (Pavlinsky et al., 2022), including many previously unknown ones. As was demonstrated in this paper and the previous paper from this series (Zaznobin et al., 2021), the problem of identifying new AGNs from the SRG/ART-XC survey can be efficiently solved with 1.5-m optical telescopes.
Acknowledgements
This work was supported by RSF grant no. 19-12-00396. We thank TÜBITAK, the Space Research Institute of the Russian Academy of Sciences, the Kazan Federal University, and the Academy of Sciences of Tatarstan for supporting the observations at the Russian–Turkish 1.5-m telescope (RTT-150). The measurements with the AZT-33IK telescope were supported by the Ministry of Education and Science of the Russian Federation and were obtained using the equipment of the Angara sharing center777http://ckp-rf.ru/ckp/3056/. In this study we used observational data from the ART-XC and eROSITA telescopes onboard the SRGobservatory. The SRG observatory was built by Roskos- mos in the interests of the Russian Academy of Sciences represented by its Space Research Institute (IKI) within the framework of the Russian Federal Space Program, with the participation of the Deutsche Zentrum für Luft- und Raumfahrt (DLR). The SRG spacecraft was designed, built, launched, and is operated by the Lavochkin Association and its subcontractors. The science data are downlinked via the Deep Space Network Antennae in Bear Lakes, Ussuriysk, and Baykonur, funded by Roskosmos. The eROSITA X-ray telescope was built by a consortium of German Institutes led by MPE, and supported by DLR. The eROSITA data used in this work were processed using the eSASS software developed by the German eROSITA consortium and the proprietary data reduction and analysis software developed by the Russian eROSITA Consortium.
References
- Abazajian et al. (2009) Abazajian K. N., et al., 2009, The Astrophysical Journal Supplement Series, 182, 543
- Afanasiev et al. (2016) Afanasiev V. L., Dodonov S. N., Amirkhanyan V. R., Moiseev A. V., 2016, Astrophysical Bulletin, 71, 479
- Akaike (1974) Akaike H., 1974, IEEE Transactions on Automatic Control, 19, 716
- Arnaud (1996) Arnaud K. A., 1996, in Jacoby G. H., Barnes J., eds, Astronomical Society of the Pacific Conference Series Vol. 101, Astronomical Data Analysis Software and Systems V. p. 17
- Baldwin et al. (1981) Baldwin J. A., Phillips M. M., Terlevich R., 1981, Publications of the Astronomical Society of the Pacific, 93, 5
- Boissay et al. (2016) Boissay R., Ricci C., Paltani S., 2016, Astronomy & Astrophysics, 588, A70
- Boller et al. (2016) Boller T., Freyberg M. J., Trümper J., Haberl F., Voges W., Nandra K., 2016, Astronomy & Astrophysics, 588, A103
- Burenin et al. (2016) Burenin R. A., et al., 2016, Astronomy Letters, 42, 295
- Cash (1979) Cash W., 1979, The Astrophysical Journal, 228, 939
- Condon et al. (1998) Condon J. J., Cotton W. D., Greisen E. W., Yin Q. F., Perley R. A., Taylor G. B., Broderick J. J., 1998, The Astronomical Journal, 115, 1693
- Cusumano et al. (2010) Cusumano G., et al., 2010, Astronomy & Astrophysics, 524, A64
- HI4PI Collaboration et al. (2016) HI4PI Collaboration et al., 2016, Astronomy & Astrophysics, 594, A116
- Jones et al. (2004) Jones D. H., et al., 2004, Monthly Notices of the Royal Astronomical Society, 355, 747
- Jones et al. (2009) Jones D. H., et al., 2009, Monthly Notices of the Royal Astronomical Society, 399, 683
- Kauffmann et al. (2003) Kauffmann G., et al., 2003, Monthly Notices of the Royal Astronomical Society, 346, 1055
- Keller et al. (2007) Keller S. C., et al., 2007, Publications of the Astronomical Society of Australia, 24, 1
- Kewley et al. (2001) Kewley L. J., Dopita M. A., Sutherland R. S., Heisler C. A., Trevena J., 2001, The Astrophysical Journal, 556, 121
- Krivonos et al. (2021) Krivonos R. A., et al., 2021, New Astronomy Reviews, 92, 101612
- Oh et al. (2018) Oh K., et al., 2018, The Astrophysical Journal Supplement Series, 235, 4
- Osterbrock (1981) Osterbrock D. E., 1981, The Astrophysical Journal, 249, 462
- Pavlinsky et al. (2021) Pavlinsky M., et al., 2021, Astronomy & Astrophysics, 650, A42
- Pavlinsky et al. (2022) Pavlinsky M., et al., 2022, Astronomy & Astrophysics, 661, A38
- Predehl et al. (2021) Predehl P., et al., 2021, Astronomy & Astrophysics, 647, A1
- Schawinski et al. (2007) Schawinski K., Thomas D., Sarzi M., Maraston C., Kaviraj S., Joo S.-J., Yi S. K., Silk J., 2007, Monthly Notices of the Royal Astronomical Society, 382, 1415
- Sunyaev et al. (2021) Sunyaev R., et al., 2021, Astronomy & Astrophysics, 656, A132
- Véron-Cetty et al. (2001) Véron-Cetty M.-P., Véron P., Gonçalves A. C., 2001, Astronomy & Astrophysics, 372, 730
- White et al. (2000) White N. E., Giommi P., Angelini L., 2000, VizieR Online Data Catalog, p. IX/31
- XMM-SSC (2018) XMM-SSC 2018, VizieR Online Data Catalog, p. IX/53
- Zaznobin et al. (2021) Zaznobin I. A., et al., 2021, Astronomy Letters, 47, 71
- Zaznobin et al. (2022) Zaznobin I., et al., 2022, Astronomy & Astrophysics, 661, A39