Stratified Distribution of Organic Molecules at the Planet-Formation Scale in the HH 212 Disk Atmosphere
Abstract
Formamide (NH2CHO) is considered an important prebiotic molecule because of its potential to form peptide bonds. It was recently detected in the atmosphere of the HH 212 protostellar disk on the Solar-System scale where planets will form. Here we have mapped it and its potential parent molecules HNCO and H2CO, along with other molecules CH3OH and CH3CHO, in the disk atmosphere, studying its formation mechanism. Interestingly, we find a stratified distribution of these molecules, with the outer emission radius increasing from 24 au for NH2CHO and HNCO, to 36 au for CH3CHO, to 40 au for CH3OH, and then to 48 au for H2CO. More importantly, we find that the increasing order of the outer emission radius of NH2CHO, CH3OH, and H2CO is consistent with the decreasing order of their binding energies, supporting that they are thermally desorbed from the ice mantle on dust grains. We also find that HNCO, which has much lower binding energy than NH2CHO, has almost the same spatial distribution, kinematics, and temperature as NH2CHO, and is thus more likely a daughter species of desorbed NH2CHO. On the other hand, we find that H2CO has a more extended spatial distribution with different kinematics from NH2CHO, thus questioning whether it can be the gas-phase parent molecule of NH2CHO.
1 Introduction
Formamide (NH2CHO) is an interstellar complex organic molecule (iCOM, referring to C-bearing species with six atoms or more) (Herbst & van Dishoeck, 2009; Ceccarelli et al., 2017) and a key precursor of more complex organic molecules, that can lead to the origin of life, because of its potential to form peptide bonds (Saladino et al., 2012; Kahane et al., 2013; López-Sepulcre et al., 2019). It has been detected in gas phase in hot corinos (Kahane et al., 2013; Coutens et al., 2016; Imai et a., 2016; López-Sepulcre et al., 2017; Bianchi et al., 2019; Hsu et al., 2022), which are the hot ( K) and compact ( au) regions immediately around low-mass (sun-like) protostars (Ceccarelli et al., 2007). The formamide origin is still under debate. In principle, formamide could be synthesized on the grain surfaces or in the gas phase. Two routes have been proposed in the first case: the hydrogenation of HNCO (Charnley & Rodgers, 2008) and the combination of the HCO and NH2 radicals, when they become mobile upon the warming of the dust by the protostar. However, the first route has been challenged by both experiments (Noble et al., 2015) and quantum chemical (QM) calculations (Song & Kästner, 2016). Later, the hydrogenation of HNCO is found to be feasible and followed by H abstraction of NH2CHO in a dual-cycle consisting of H addition and H abstraction (Haupa et al., 2019). The second route (i.e., the combination of HCO and NH2) has also been challenged by QM calculations (Rimola et al., 2018) and found possible, even though it can also form NH3 CO in competition with the formamide (Enrique-Romero et al., 2022). In the gas-phase formation theory, it has been proposed that formamide is formed by the gas-phase reaction of H2CO with NH2 (Kahane et al., 2013). This hypothesis was later challenged by Song & Kästner (2016). Nonetheless, QM computations (Vazart et al., 2016; Skouteris et al., 2017) coupled with astronomical observations in shocked regions (Codella et al., 2017) support this hypothesis. On the same vein, the observed deuterated isomers of formamide (including NH2CDO, cis- and trans-NHDCHO) (Coutens et al., 2016) fits well with the theoretical predictions of a gas-phase formation route (Skouteris et al., 2017). On the other hand, the observed high deuterium fractionation of 2% for the three different forms of formamide (NH2CDO, cis- and trans-NHDCHO) could also be consistent with the formation in ice mantles on dust grains.
The hot corino in the HH 212 protostellar system (Codella et al., 2016) in Orion at a distance of 400 pc is particularly interesting because recent observations have spatially resolved it and found it to be an atmosphere of a Solar-System scale protostellar disk around a protostar (Lee et al., 2017b). This disk atmosphere is rich in iCOMs (Lee et al., 2017b; Codella et al., 2018; Lee et al., 2019), including formamide. More importantly, these iCOMs have a relative abundance similar to that of other hot corinos (Cazaux et al., 2003; Imai et a., 2016; López-Sepulcre et al., 2017; Bianchi et al., 2019; Manigand et al., 2020), and even comets (Biver et al., 2015). Therefore, the study of formamide in protostellar disks is key to investigate the emergence of prebiotic chemistry in nascent planetary bodies. In this paper we will study the origin and formation pathways of formamide in this protostellar disk.
Previously, the HH 212 disk was mapped at a wavelength 0.85 mm (Lee et al., 2017b) covering one NH2CHO line. Here we map it at a longer wavelength 1.33 mm, with spectral windows set up to cover more NH2CHO lines in order to derive the physical properties of NH2CHO. This set up also covers the lines of HNCO and H2CO, which have not been reported before, in order to investigate the formation pathways of NH2CHO. At longer wavelength, since the continuum emission of the disk is optically thinner, we can also map the molecular line emission in the disk atmosphere closer to the midplane and the central source. Moreover, the deuterated species and 13C isotopologue of H2CO are also detected, allowing us to constrain the origin and correct the optical depth of H2CO, respectively. In addition, CH3OH and CH3CHO are also detected, allowing us to further constrain the formation mechanism of NH2CHO. More importantly, with the recently updated binding energies of these molecules, we can investigate the formation mechanism of these molecules and the chemical relationship among them.
2 Observations
The HH 212 protostellar disk was observed with Atacama Large Millimeter/submillimeter Array (ALMA) in Band 6 centered at a frequency of 226 GHz (or 1.33 mm) in Cycle 5. Project ID was 2017.1.00712.S. Two observations were executed. One was executed on 2017 October 04 in C43-9 configuration with 46 antennas for 18 mins on source with a baseline length of 41.4 m to 15 km to achieve an angular resolution of . The other was executed on 2017 December 31 in C43-6 configuration with 46 antennas for 9 mins on source with a baseline length of 15.1 m to 2.5 km to recover a size scale up to , which is 4 times the disk size. The correlator was set up to have 4 spectral windows (centered at 232.005, 234.005, 217.765, and 219.705 GHz) , each with a bandwidth of 1.875 GHz and 1920 channels, and thus a spectral resolution of 0.976 MHz per channel, corresponding to 1.3 km s-1 per channel. The primary beam was , much larger than the disk size.
The data were calibrated with the CASA package version 5.1.1, with quasar J0423-0120 (a flux of 0.93 Jy) as a passband and flux calibrator, and quasar J0541-0211 (a flux of 0.096 Jy) as a gain calibrator. Line-free channels were combined to generate a visibility for the continuum centered at 226 GHz. We used a robust factor of 1.0 for the visibility weighting to generate the continuum map with a synthesized beam of at a position angle of 79∘. The noise level is 20 Jy beam-1 or 1.4 K. The channel maps of the molecular lines were generated after continuum subtraction. Using a visibility weighting of 0.5, the synthesized beam has a size of at a position angle of 49∘. The noise levels are 0.9 mJy beam-1 (or 10 K) in the channel maps. The velocities in the channel maps are LSR velocities.
3 Results
The detected lines of NH2CHO (16 lines), HNCO (7 lines), H2CO (2 lines) as well as its doubly deuterated species D2CO (2 lines) and 13C isotopologue H213CO (1 line), CH3OH (12 lines), and CH3CHO (7 lines) are listed in Table Stratified Distribution of Organic Molecules at the Planet-Formation Scale in the HH 212 Disk Atmosphere. They have upper level energy K, but with K for CH3CHO, H2CO as well as its deuterated species and isotopologue. In order to increase the sensitivity for better detections, we divided them into 2 ranges of upper level energies: K and , and then stacked them to produce the mean channel maps, and then the total line intensity maps, and the position-velocity (PV) diagrams.
3.1 Stratified Distribution of Molecules
Figure 1 shows the total line intensity maps (red contours) of these molecules on top of the continuum map of the disk at 1.33 mm, in order to pin point the location of these molecules in the disk and the chemical relationship among them. As shown in Figure 1c, the disk is nearly edge-on, with an equatorial dark lane tracing the cooler midplane sandwiched by two brighter features (outlined by the 4th and 5th contour levels) on the top and bottom tracing the warmer surfaces, as seen before in continuum at a shorter wavelength of 0.85 mm (Lee et al., 2017a).
As can be seen, the emission structure of a given molecule is similar in different ranges, suggesting that it is more dominated by the distribution of the molecule than the upper energy level. After stacking the lines, we achieved a better sensitivity in NH2CHO than that in the previous observations obtained at higher resolution (Lee et al., 2017b), and detected NH2CHO not only in the lower disk atmosphere, but also in the upper disk atmosphere. More importantly, we can better pinpoint its emission and found it to be in the inner disk where the disk is warmer. It is brighter in the lower disk atmosphere, with two emission peaks clearly seen in the map with K (see Figure 1b). HNCO is detected with the spatial distribution and radial extent consistent with NH2CHO. Looking back at the previous results of other iCOMs detected at higher frequency of 346 GHz (Lee et al., 2019), we find that t-HCOOH was also detected with the spatial distribution and radial extent consistent with NH2CHO (see Figure 1f adopted from Lee et al., 2019). Notice that the radial distribution of molecular gas detected at higher frequency can also be compared with that here at lower frequency, because the optical depth of the underlying continuum of the dusty disk mainly affects the vertical distribution (i.e., height) of molecular gas in the atmosphere (see Section 4.1). On the other hand, H2CO is only detected with K, and its emission extends further out in radial direction beyond the centrifugal barrier (CB) (Figure 1g). The emission is also detected at a larger distance from the disk miplane and extends away from the disk atmosphere, overlapping with the base of the SO disk wind (Lee et al., 2021a) and thus tracing the wind from the disk. Its deuterated species D2CO is detected mainly in the disk atmosphere, also at a larger distance from the midplane and a larger radius from the central protostar than NH2CHO. On the other hand, the emission of the 13C isotopologue H213CO is very faint and mainly detected in the disk atmospheres. CH3OH is detected in the atmosphere extending out to the CB, as found before (Lee et al., 2017b, 2019). The emission also extends away from the disk midplane, suggesting that part of it also traces the wind from the disk. As for CH3CHO, the emission is mainly detected in the disk atmosphere and extends radially toward the CB. In summary, NH2CHO, HNCO, D2CO, H213CO and CH3CHO trace mainly the disk atmosphere, while H2CO and CH3OH trace not only the disk atmosphere, but also the disk wind.
We can also measure the vertical height of these molecules (using lines with K) along the jet axis in the lower atmosphere where the emission is brighter, and find it to be 15, 19, 20, 24, and 26 au, respectively for NH2CHO, HNCO, CH3CHO, CH3OH, and H2CO. We will discuss the vertical height later with the outer radius of these molecules measured from the PV diagrams.
3.2 Kinematics
The spatio-kinematic relationship among these molecules can be studied with the PV diagrams cut across the upper and lower disk atmospheres, as shown in Figure 2. Here we use the emission with K, where all molecules are detected. In addition, this emission is expected to trace the lowest temperature and thus the outermost radius at which the molecules start to appear. Previously, the disk was found to be rotating roughly with a Keplerian rotation due a central mass of 0.25 (including the masses of the central protostar and the disk) (Codella et al., 2014; Lee et al., 2017b). Therefore, the associated Keplerian rotation curves (blue curves) are plotted here for comparison.
The emissions of these molecules trace the disk atmosphere within the CB and are thus enclosed by the Keplerian rotation curves. In the upper disk atmosphere, their emissions form roughly linear PV structures (as marked by the magenta lines), indicating that they arise from rings rotating at certain velocities. For edge-on rotating rings, the radial velocity observed along the line of sight is proportional to the position offset from the center, forming the linear PV structures. Interestingly, the PV structures of HNCO and t-HCOOH are aligned with those of NH2CHO, and the PV structures of D2CO are roughly aligned with those of CH3OH. Except for these similarities, different molecules have different velocity gradients connecting to different locations of the Keplerian curves, indicating that they arise from rings at different disk radii. From the location of their PV structure on the Keplerian curve, we find that the disk radius of these molecules increases from 24 au for NH2CHO/HNCO/t-HCOOH, to 36 au for CH3CHO, to 40 au for CH3OH/D2CO, and then to 48 au for H2CO. This trend is the same as the increasing order of the vertical height measured earlier for these molecules, indicating that the height increases with increasing radius, as expected for a flared disk in hydrostatic equilibrium. Plotting the velocity gradients in the upper disk atmosphere onto the lower disk atmosphere, we find that the emission detected in the upper disk atmosphere is actually only from the outer radius where their emission start to appear, and the emission also extends radially inward to where NH2CHO is detected. Since the nearside of the disk is tilted slightly downward to the south, the emission in the upper disk atmosphere further in is lost due to the absorption against the bright and optically thick continuum emission of the disk surface (see Figure 9b in Lee et al. 2019). Note that for NH2CHO/HNCO/t-HCOOH, there seems to be a small velocity shift of 0.5 km s-1 between the upper and lower disk atmosphere. This velocity shift could suggest an infall (or accretion) velocity of 0.25 km s-1, which is 8% of the rotation velocity at 24 au. However, observations at higher spectral and spatial resolution are needed to verify this possibility.
3.3 Physical Properties in the Disk Atmosphere
In order to understand the nature and spatial origin of the detected methanol, we analyzed the observed methanol lines (Table Stratified Distribution of Organic Molecules at the Planet-Formation Scale in the HH 212 Disk Atmosphere) via a non-LTE Large Velocity Gradient (LVG) approach, using the code grelvg, initially developed by Ceccarelli et al. (2003). We used the collisional coefficients of methanol with para-H2, computed by Rabli & Flower (2010) between 10 and 200 K for the J15 levels and provided by the BASECOL database (Dubernet et al., 2012, 2013). We assumed an A-/E- CH3OH ratio equal to 1. To compute the line escape probability as a function of the line optical depth we adopted the semi-infinite slab geometry (Scoville & Solomon, 1974) and a linewidth equal to 4 km s-1, following the observations.
We ran several grids of models to sample the surface in the parameter space. Specifically, we varied the methanol column density N(A-CH3OH) and N(E-CH3OH) simultaneously from to cm-2 (with a step of a factor of 2), the H2 density from to cm-3 (with a step of a factor of 2) and the gas temperature T from 50 to 120 K (with a step of 5 K). We then fit the measured the velocity-integrated line intensities ( with being the brightness temperature) by comparing them with those predicted by the model, leaving N(A-CH3OH) and N(E-CH3OH), , and as free parameters. Given the limitation on the J level (15), we used only seven of the twelve detected methanol lines with K for the LVG fitting. We considered the line intensities at the emission peak (marked by a blue circle in Figure 1j) in the lower disk atmosphere, as listed in Table Stratified Distribution of Organic Molecules at the Planet-Formation Scale in the HH 212 Disk Atmosphere .
The results of the fit are shown in Figure 3. The best fit gives the following values, where the errors are estimated considering the 1 confidence level and the uncertainties of 40% in our measurements: N(CH3OH)N(A-CH3OH)N(E-CH3OH) cm-2; cm-3, which should be the lower limit because it is in the LTE regime at this density; and K. The lines are predicted to be all optically thick with the lowest line opacity for the line at 234.699 GHz and the highest for the line at 218.440 GHz, and =3–10 for the other lines. We also derived the excitation temperature and column density from rotation diagram using the remaining five transition lines with K (see Figure 3c), assuming optically thin emission and LTE (Goldsmith & Langer, 1999). In particular, we fit the data with a linear equation, and then derived the temperature from the negative reciprocal of the slope and the column density from the y-intercept. We found that K and N(CH3OH) cm-2. Taking the mean values from the two methods, we have K and N(CH3OH) cm-2. Notice that previous LTE estimation of excitation temperature of CH3OH and CH2DOH together from rotation diagram was pretty uncertain, with a value of 16585 K (Lee et al., 2017b), due to a large scatter of the data points. More importantly, the excitation temperature was also overestimated because almost all the lines had Eu 200 K and were thus likely optically thick.
For less abundant molecules detected with a broad range of , such as NH2CHO and HNCO, the mean excitation temperature and column density of the molecular lines in the disk atmosphere can be roughly estimated from rotation diagram assuming optically thin emission and LTE (Goldsmith & Langer, 1999). We used the brighter emission in the lower disk atmosphere. Table Stratified Distribution of Organic Molecules at the Planet-Formation Scale in the HH 212 Disk Atmosphere lists the integrated line intensities averaged over a rectangular region (with a size of 68 au 20 au) that covers most of the emission in the lower atmosphere, measured with a cutoff of 2. Figure 4 shows the resulting rotation diagrams for NH2CHO and HNCO. The blended lines of NH2CHO are excluded from the diagram. The HNCO line at the lowest (marked with an open square) seems to be optically thick with an intensity much lower than the line next down the axis, and is thus excluded from the fitting. For NH2CHO and HNCO, we fit the data points to obtain the temperature and column density. It is interesting to note that NH2CHO and HNCO have roughly the same excitation temperature of K, although with a large uncertainty. On the other hand, since H2CO, D2CO, and CH3CHO are only detected with a narrow range of K and their emission can be optically thick there, we can not derive their excitation temperature from the rotation diagram. In addition, H2CO and D2CO are only detected with two lines. Also, H213CO is only detected with one line. Since D2CO has roughly the same radial extent as CH3OH, it is assumed to have an excitation temperature of 92 K, the same as that found for CH3OH. Since H2CO has a slightly larger radius than CH3OH, it and its 13C isotopologue H213CO are assumed to have an excitation of 60 K. CH3CHO has a smaller radial extent than CH3OH and is thus assumed to have an excitation temperature of 100 K.
The resulting excitation temperature and column density are listed in Table Stratified Distribution of Organic Molecules at the Planet-Formation Scale in the HH 212 Disk Atmosphere. In addition, the abundance of these molecules are also estimated by dividing the column density of the molecules by the mean H2 column density derived from a dusty disk model (Lee et al., 2021b) in the same region, which is found to be 1.08 cm-2. This disk model was constructed before to reproduce the continuum emission of the disk at 850 m (Lee et al., 2021b) and it can also roughly reproduce the continuum emission of the disk observed here at 1.33 mm (Lin et al., 2021). Since H2CO and D2CO lines are each detected with two lines that are likely optically thick, their lines at higher Eu are used to derive the lower limit of their column density. Indeed, the H2CO column density can be better derived from the H213CO line assuming [12C]/[13C] ratio of 50, as estimated in the Orion Complex (Kahane et al., 2018). As can be seen from Table Stratified Distribution of Organic Molecules at the Planet-Formation Scale in the HH 212 Disk Atmosphere, the H2CO column density derived this way is 3 times that derived from the H2CO lines. Thus, the deuteration of H2CO, i.e., the abundance ratio [D2CO]/[H2CO], is 0.053. As for CH3CHO, we fixed its temperature to 100 K by fixing the negative reciprocal of the slope in the linear equation and then derived its column density from the y-intercept of the linear fit to the rotation diagram, as shown in Figure 4c.
4 Discussion
4.1 Lack of Molecular Emission in Disk Midplane
As discussed in Lee et al. (2017b, 2019), the lack of molecular emission in the disk midplane can be due to an exponential attenuation by the high optical depth of dust continuum. Figure 5a shows the optical depth of the dust continuum at 1.33 mm derived from the dusty disk model that reproduced the thermal emission of the disk (Lee et al., 2021b). As can be seen, the optical depth is 3 toward the midplane within the CB, where no molecular emission is detected, supporting this possibility. The faint NH2CHO and CH3OH emission detected in the midplane likely comes from the upper and lower disk atmospheres due to the beam convolution. However, the H2CO emission in the midplane near the CB (see Figure 1g) should be real detection because the optical depth of the dust continuum decreases to smaller than 3 at the edge.
4.2 Distribution of Molecules and Binding Energy
As discussed earlier, a stratification is seen in the distribution of molecules in the disk atmosphere, with the outer disk radius decreasing from H2CO, to CH3OH, to CH3CHO, and then to NH2CHO/HNCO/HCOOH, as shown in Figure 5b together with the temperature structure of the dusty disk model (Lee et al., 2021b). Similar stratification of H2CO, CH3CHO, and NH2CHO has been seen toward the bow shock region B1 in the young protostellar system L1157 (Codella et al., 2017). That shock region is divided into 3 shock subregions, with shock 1 in the bow wing, shock 3 in the bow tip, and shock 2 in between. The authors interpreted that shock 1 is the youngest shock while shock 3 is the oldest. They found that the observed decrease in abundance ratio [CH3CHO]/[NH2CHO] from shock 3 to shock 2 and to shock 1 can be modeled if both NH2CHO and CH3CHO are formed in gas phase.
Here in the HH 212 disk, since the temperature of the atmosphere is expected to increase inward toward the center as the disk (Figure 5b), the stratification in the distribution of these molecules could be related to their binding energy (BE) (and thus sublimation temperature). Table Stratified Distribution of Organic Molecules at the Planet-Formation Scale in the HH 212 Disk Atmosphere lists the recently computed BE for these molecules. For consistent comparison, we adopt the values obtained from similar methods on amorphous solid water ice (Ferrero et al., 2020, 2022). Since HNCO was not included in those studies, we adopt its value from Song & Kästner (2016). Notice that different methods can result in different BE, e.g., HCOOH was found to have a BE value of less than 5000 K on pure ice (Kruczkiewicz et al., 2021), significantly lower than that adopted here. As can be seen, the increasing order of the observed outer radius of NH2CHO/t-HCOOH, CH3OH, and H2CO is consistent with the decreasing order of their BE, indicating that these molecules are thermally desorbed from the ice mantle on dust grains. Notice that this does not necessarily mean that these molecules are formed in the ice mantle, because the density in the disk is so high that even if the molecules are formed in the gas phase they freeze-out quickly and are, therefore, only detected in regions where the dust temperature is larger than the sublimation temperature. As for HNCO and CH3CHO, their outer radii do not fit in to those of H2CO, CH3OH, and NH2CHO based on their BE and they can form in gas phase from other species. On the other hand, HNCO and HCOOH may come from the decomposition of the desorbed organic salts (NHOCN- and NHHCOO-), which have similar BE to that of NH2CHO (Kruczkiewicz et al., 2021; Ligterink et al., 2018). Further work is needed to check this possibility.
Previously at (60 au) resolution, Codella et al. (2018) detected deuterated water around the disk. Although the deuterated water was found to have an outer radius of 60 au, its kinematics was found to be consistent with that of the centrifugal barrier at 44 au. More importantly, since water has a BE similar to that of H2CO (see Table Stratified Distribution of Organic Molecules at the Planet-Formation Scale in the HH 212 Disk Atmosphere), it is likely that water, like H2CO, is also desorbed from the ice mantle on the dust grains. Thus the water snowline can be located around or slightly outside the centrifugal barrier.
4.3 Centrifugal Barrier and H2CO and CH3OH
The high deuteration of H2CO (with [D2CO]/[H2CO] 0.053) and methanol (with [CH2DOH]/[CH3OH] 0.12) (Lee et al., 2019) supports that both are originally formed in ice. These ratios of [D2CO]/[H2CO] and [CH2DOH]/[CH3OH] are consistent with those found in prestellar cores to Class I sources (Mercimek et al., 2022, references therein). It is possible that H2CO is formed by hydrogenation to CO frozen in the ice mantle on dust grains and then CH3OH is formed from it with the addition of two H atoms (Charnley, 2004). The derived kinetic temperature of CH3OH agrees with the sublimation temperature, also supporting that the methanol is thermally desorbed into gas phase. H2CO and CH3OH are detected with the outer radius near the CB where an accretion shock is expected as the envelope material flows onto the disk (Lee et al., 2017b), suggesting that they are desorbed into gas phase due to the heat produced by the shock interaction. It is possible that they were already formed in the ice mantle on dust grains in the collapsing envelope stage and then brought in to the disk (Herbst & van Dishoeck, 2009; Caselli & Ceccarelli, 2012). H2CO has a lower sublimation temperature than CH3OH, and thus can be desorbed into gas phase further out beyond the CB. Interestingly, both H2CO and CH3OH also extend vertically away from the disk surface, and thus can also trace the disk wind as SO (Tabone et al., 2017; Lee et al., 2018, 2021a). In addition, since H2CO has an outer radius outside the centrifugal barrier, it may also trace the wind from the innermost envelope transitioning to the disk, carrying away angular momentum from there.
4.4 Formamide, HNCO, and H2CO
HNCO not only has similar spatial distribution and kinematics, but also has a similar excitation temperature to NH2CHO, though with a large uncertainty. In addition, the abundance ratio of HNCO to NH2CHO agrees well with the nearly linear abundance correlation found before across several orders of magnitude in molecular abundance (López-Sepulcre et al., 2019). All these suggest a chemical link between the two molecules. However, as discussed earlier based on the BE sequence, HNCO itself is likely formed in gas phase but not desorbed from ice mantle, unless the BE of HNCO is significantly underestimated. In particular, although HNCO has a much lower BE than NH2CHO, it is detected only in the inner and warmer disk where NH2CHO is detected, but not detected in the outer part of the disk where the temperature is lower. Thus, our result implies that HNCO, instead of being parent molecule, is likely a daughter molecule of NH2CHO and formed in gas phase. One possible reaction is NH2CHO H HNCO (Haupa et al., 2019). It is also possible that HNCO is formed by destructive gas-phase ion-molecule interactions with amides (also larger amides than NH2CHO) (Garrod et al., 2008; Tideswell et al., 2010).
It has also been proposed that formamide can be formed from formaldehyde (H2CO) in warm gas through the reaction H2CO NH2 NH2CHO H (Kahane et al., 2013; Vazart et al., 2016; Codella et al., 2017; Skouteris et al., 2017). However, we find that H2CO has a more extended distribution with different kinematics from formamide, and is thus unclear if it can be the parent molecule in gas phase. Unfortunately, we have no information on the other reactant, NH2. Very likely it is the product of sublimated NH3 (Codella et al., 2017), whose binding energy (see Table Stratified Distribution of Organic Molecules at the Planet-Formation Scale in the HH 212 Disk Atmosphere) is larger than that of H2CO, which may explain why formamide is not present where H2CO is. In conclusion, based on the current observations, it is not possible to constrain the formation route of formamide in the disk atmosphere of HH 212. Nonetheless, our work has added precious information about the formation route of formamide in disk atmosphere, complementing those in different environments, e.g., the L1157 shock (Codella et al., 2017).
References
- Bianchi et al. (2019) Bianchi, E., Codella, C., Ceccarelli, C., et al. 2019, MNRAS, 483, 1850
- Biver et al. (2015) Biver, N., Bockelée-Morvan, D., Moreno, R., et al. 2015, Science Advances, 1, 1500863
- Caselli & Ceccarelli (2012) Caselli, P. & Ceccarelli, C. 2012, A&A Rev., 20, 56.
- Cazaux et al. (2003) Cazaux, S., Tielens, A. G. G. M., Ceccarelli, C., et al. 2003, ApJ, 593, L51.
- Ceccarelli et al. (2003) Ceccarelli, C., Maret, S., Tielens, A. G. G. M., et al. 2003, A&A, 410, 587.
- Ceccarelli et al. (2007) Ceccarelli, C., Caselli, P., Herbst, E., et al. 2007, Protostars and Planets V, 47
- Ceccarelli et al. (2017) Ceccarelli, C., Caselli, P., Fontani, F., et al. 2017, ApJ, 850, 176.
- Charnley (2004) Charnley, S. B. 2004, Advances in Space Research, 33, 23
- Charnley & Rodgers (2008) Charnley, S. B., & Rodgers, S. D. 2008, Space Science Reviews, 138, 59
- Codella et al. (2014) Codella, C., Cabrit, S., Gueth, F., et al. 2014, A&A, 568, L5.
- Codella et al. (2016) Codella, C., Ceccarelli, C., Cabrit, S., et al. 2016, A&A, 586, L3
- Codella et al. (2017) Codella, C., Ceccarelli, C., Caselli, P., et al. 2017, A&A, 605, L3.
- Codella et al. (2018) Codella, C., Bianchi, E., Tabone, B., et al. 2018, A&A, 617, A10
- Coutens et al. (2016) Coutens, A., Jørgensen, J. K., van der Wiel, M. H. D., et al. 2016, A&A, 590, L6.
- Dubernet et al. (2013) Dubernet, M.-L., Alexander, M. H., Ba, Y. A., et al. 2013, A&A, 553, A50.
- Dubernet et al. (2012) Dubernet, M.-L., Nenadovic, L., & Doronin, N. 2012, Astronomical Data Analysis Software and Systems XXI, 461, 335
- Enrique-Romero et al. (2022) Enrique-Romero, J., Rimola, A., Ceccarelli, C., et al. 2022, ApJS, 259, 39.
- Ferrero et al. (2020) Ferrero, S., Zamirri, L., Ceccarelli, C., et al. 2020, ApJ, 904, 11.
- Ferrero et al. (2022) Ferrero, S., Grieco, F., Ibrahim Mohamed, A-S., Dulieu, F., Rimola, A., Ceccarelli, C., Nervi, C., Minissale, M., Ugliengo, P., 2̇022 MNRAS submitted
- Garrod et al. (2008) Garrod, R. T., Widicus Weaver, S. L., & Herbst, E. 2008, ApJ, 682, 283. doi:10.1086/588035
- Goldsmith & Langer (1999) Goldsmith, P. F., & Langer, W. D. 1999, ApJ, 517, 209
- Haupa et al. (2019) Haupa, K. A., Tarczay, G., & Lee, Y.-P., J. Am. Chem. Soc. 2019, 141, 11614-11620.
- Herbst & van Dishoeck (2009) Herbst, E., & van Dishoeck, E. F. 2009, ARA&A, 47, 427
- Hsu et al. (2022) Hsu, S.-Y., Liu, S.-Y., Liu, T., et al. 2022, ApJ, 927, 218.
- Imai et a. (2016) Imai, M., Sakai, N., Oya, Y., et al. 2016, ApJ, 830, L37
- Jørgensen et al. (2016) Jørgensen, J. K., van der Wiel, M. H. D., Coutens, A., et al. 2016, A&A, 595, A117.
- Kahane et al. (2013) Kahane, C., Ceccarelli, C., Faure, A., et al. 2013, ApJ, 763, L38.
- Kahane et al. (2018) Kahane, C., Jaber Al-Edhari, A., Ceccarelli, C., et al. 2018, ApJ, 852, 130
- Kruczkiewicz et al. (2021) Kruczkiewicz, F., Vitorino, J., Congiu, E., et al. 2021, A&A, 652, A29. doi:10.1051/0004-6361/202140579
- Lee et al. (2014) Lee, C.-F., Hirano, N., Zhang, Q., et al. 2014, ApJ, 786, 114
- Lee et al. (2017b) Lee, C.-F., Li, Z.-Y., Ho, P. T. P., et al. 2017c, ApJ, 843, 27
- Lee et al. (2017a) Lee, C.-F., Li, Z.-Y., Ho, P. T. P., et al. 2017b, Science Advances, 3, e1602935
- Lee et al. (2018) Lee, C.-F., Li, Z.-Y., Codella, C., et al. 2018, ApJ, 856, 14
- Lee et al. (2019) Lee, C.-F., Codella, C., Li, Z.-Y., et al. 2019, ApJ, 876, 63
- Lee et al. (2021a) Lee, C.-F., Tabone, B., Cabrit, S., et al. 2021a, ApJ, 907, L41.
- Lee et al. (2021b) Lee, C.-F., Li, Z.-Y., Yang, H., et al. 2021b, ApJ, 910, 75.
- Leurini et al. (2016) Leurini, S., Menten, K. M., & Walmsley, C. M. 2016, A&A, 592, A31.
- Ligterink et al. (2018) Ligterink, N. F. W., Terwisscha van Scheltinga, J., Taquet, V., et al. 2018, MNRAS, 480, 3628. doi:10.1093/mnras/sty2066
- Lin et al. (2021) Lin, Z.-Y. D., Lee, C.-F., Li, Z.-Y., et al. 2021, MNRAS, 501, 1316.
- López-Sepulcre et al. (2019) López-Sepulcre, A., Balucani, N., Ceccarelli, C., et al. 2019, ACS Earth and Space Chemistry, 3, 2122.
- López-Sepulcre et al. (2017) López-Sepulcre, A., Sakai, N., Neri, R., et al. 2017, A&A, 606, A121
- Manigand et al. (2020) Manigand, S., Jørgensen, J. K., Calcutt, H., et al. 2020, A&A, 635, A48.
- Mercimek et al. (2022) Mercimek, S., Codella, C., Podio, L., et al. 2022, A&A, 659, A67.
- Noble et al. (2015) Noble, J. A., Theule, P., Congiu, E., et al. 2015, A&A, 576, A91.
- Rabli & Flower (2010) Rabli, D. & Flower, D. R. 2010, MNRAS, 406, 95.
- Rimola et al. (2018) Rimola, A., Skouteris, D., Balucani, N., et al. 2018, ACS Earth and Space Chemistry, 2, 720.
- Saladino et al. (2012) Saladino, R., Crestini, C., Pino, S., et al. 2012, Physics of Life Reviews, 9, 84.
- Scoville & Solomon (1974) Scoville, N. Z. & Solomon, P. M. 1974, ApJ, 187, L67.
- Skouteris et al. (2017) Skouteris, D., Vazart, F., Ceccarelli, C., et al. 2017, MNRAS, 468, L1.
- Song & Kästner (2016) Song, L. & Kästner, J. 2016, Physical Chemistry Chemical Physics (Incorporating Faraday Transactions), 18, 29278.
- Tabone et al. (2017) Tabone, B., Cabrit, S., Bianchi, E., et al. 2017, A&A, 607, L6.
- Tideswell et al. (2010) Tideswell, D. M., Fuller, G. A., Millar, T. J., et al. 2010, A&A, 510, A85. doi:10.1051/0004-6361/200810820
- Vazart et al. (2016) Vazart, F., Calderini, D., Puzzarini,C., Skouteris, D., & Barone, V., 2016, J. Chem. Theory Comput., 12, 5385-5397.
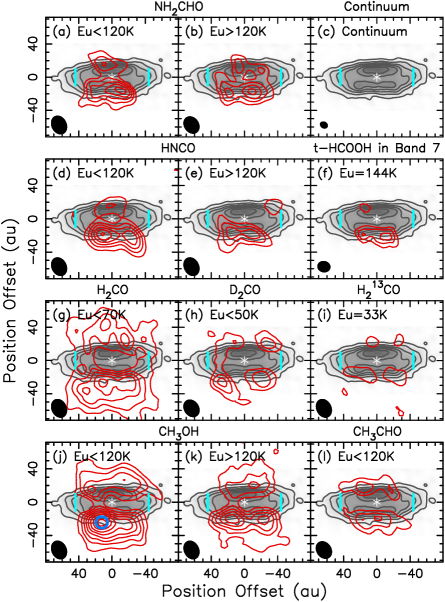
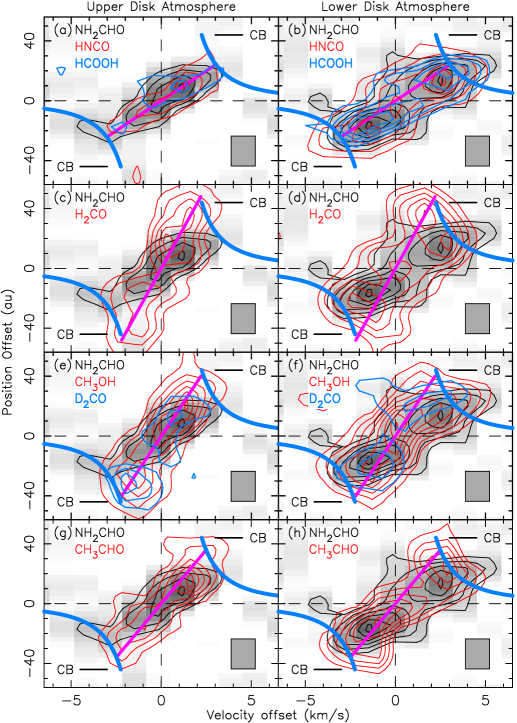
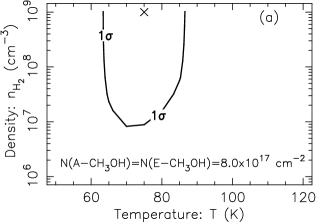


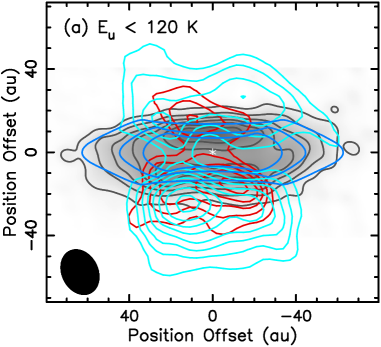
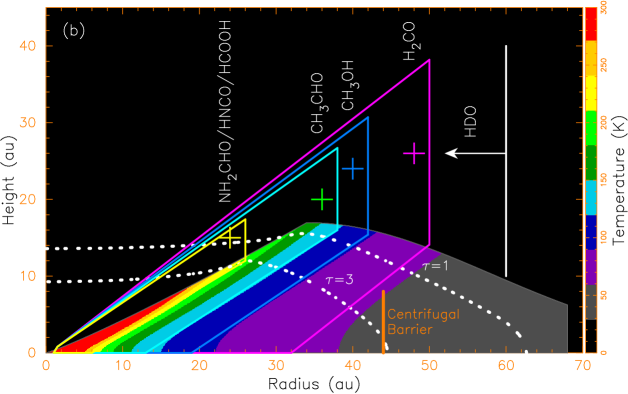
Table 1. Line Properties from Splatalogue
Transition
Frequency
log()
Remarks
QNs
(MHz)
(s-1)
(K)
(K km s-1)
NH2CHO 10( 1, 9)- 9( 1, 8)
218459.21
-3.126
60.812
21
119
CDMS
NH2CHO 11( 2,10)-10( 2, 9)
232273.64
-3.054
78.949
23
120
CDMS
NH2CHO 11( 8, 3)-10( 8, 2)
233488.88
-3.360
257.724
23
29m
CDMS
NH2CHO 11( 8, 4)-10( 8, 3)
233488.88
-3.360
257.724
23
29m
CDMS
NH2CHO 11( 7, 4)-10( 7, 3)
233498.06
-3.258
213.124
23
42
CDMS
NH2CHO 11( 7, 5)-10( 7, 4)
233498.06
-3.258
213.124
23
42
CDMS
NH2CHO 11( 6, 6)-10( 6, 5)
233527.79
-3.186
174.449
23
38
CDMS
NH2CHO 11( 6, 5)-10( 6, 4)
233527.79
-3.186
174.449
23
38
CDMS
NH2CHO 11( 5, 7)-10( 5, 6)
233594.50
-3.133
141.714
23
56m
CDMS
NH2CHO 11( 5, 6)-10( 5, 5)
233594.50
-3.133
141.714
23
56m
CDMS
NH2CHO 11( 4, 8)-10( 4, 7)
233734.72
-3.093
114.932
23
91
CDMS
NH2CHO 11( 4, 7)-10( 4, 6)
233745.61
-3.093
114.933
23
132
CDMS
NH2CHO 11( 3, 9)-10( 3, 8)
233896.57
-3.064
94.110
23
91
CDMS
NH2CHO 11( 3, 8)-10( 3, 7)
234315.49
-3.062
94.158
23
96
CDMS
HNCO 10( 1,10)-9( 1, 9)
218981.00
-3.847
101.078
21
212
CDMS
HNCO 10( 3, 8)-9( 3, 7)
219656.76
-3.920
432.959
21
41m
CDMS
HNCO 10( 3, 7)-9( 3, 6)
219656.77
-3.920
432.959
21
41m
CDMS
HNCO 10( 2, 9)-9( 2, 8)
219733.85
-3.871
228.284
21
101
CDMS
HNCO 10( 2, 8)-9( 2, 7)
219737.19
-3.871
228.285
21
121
CDMS
HNCO 10( 0,10)-9( 0, 9)
219798.27
-3.832
58.019
21
192b
CDMS
HNCO 10( 1, 9)-9( 1, 8)
220584.75
-3.837
101.502
21
198
CDMS
H2CO 3( 0, 3)- 2( 0, 2)
218222.19
-3.550
20.956
7
266b
CDMS
H2CO 3( 2, 2)- 2( 2, 1)
218475.63
-3.803
68.093
7
230
CDMS
D2CO 4(0,4) - 3(0,3)
231410.23
-3.45914
27.88284
18
67b
CDMS
D2CO 4(2,3) - 3(2,2)
233650.44
-3.57046
49.62595
18
104
CDMS
HCO 3( 1, 2)- 2( 1, 1)
219908.52
-3.59109
32.93810
21
120
CDMS
CH3OH 5( 1) - 4( 2) E1 vt=0
216945.52
-4.915
55.871
11
347b
JPL
CH3OH 6( 1) - - 7( 2) - vt=1
217299.20
-4.367
373.924
13
155
JPL
CH3OH 20( 1) -20( 0) E1 vt=0
217886.50
-4.471
508.375
41
89
JPL
CH3OH 4( 2) - 3( 1) E1 vt=0
218440.06
-4.329
45.459
9
263b
JPL
CH3OH 8( 0) - 7( 1) E1 vt=0
220078.56
-4.599
96.613
17
347b
JPL
CH3OH 10(-5) -11(-4) E2 vt=0
220401.31
-4.951
251.643
21
256
JPL
CH3OH 10( 2) - - 9( 3) - vt=0
231281.11
-4.736
165.347
21
240b
JPL
CH3OH 10( 2) + - 9( 3) + vt=0
232418.52
-4.729
165.401
21
295b
JPL
CH3OH 18( 3) + -17( 4) + vt=0
232783.44
-4.664
446.531
37
214
JPL
CH3OH 18( 3) - -17( 4) - vt=0
233795.66
-4.658
446.580
37
230
JPL
CH3OH 4( 2) - - 5( 1) - vt=0
234683.37
-4.734
60.923
9
285b
JPL
CH3OH 5(-4) - 6(-3) E2 vt=0
234698.51
-5.197
122.720
11
195b
JPL
CH3CHO 12( 4, 8)-11( 4, 7) E, vt=0
231484.37
-3.409
108.289
50
29
JPL
CH3CHO 12( 4, 9)-11( 4, 8) E, vt=0
231506.29
-3.409
108.251
50
111
JPL
CH3CHO 12( 3,10)-11( 3, 9) E, vt=0
231748.71
-3.388
92.510
50
65
JPL
CH3CHO 12( 3, 9)-11( 3, 8) E, vt=0
231847.57
-3.387
92.610
50
46
JPL
CH3CHO 12( 3, 9)-11( 3, 8) A, vt=0
231968.38
-3.383
92.624
50
116
JPL
CH3CHO 12( 2,10)-11( 2, 9) E, vt=0
234795.45
-3.352
81.864
50
54
JPL
CH3CHO 12( 2,10)-11( 2, 9) A, vt=0
234825.87
-3.351
81.842
50
50
JPL
: Integrated line intensities (see text for the definition) measured from the lower disk atmosphere.
Except for CH3OH which used the values at the emission peak position,
they are the mean values averaging over a rectangular region (with a size of
covering most of the emission) centered at
the lower atmosphere. In this column, the line intensities commented with “m” are the mean values
obtained by averaging over 2 or more lines with similar and log for better
measurements. : likely optically thick and thus ignored in the fitting of the rotation diagram
and calculation of column density.
The line intensities here are assumed to have an uncertainty of 40%.
Table 2. Column Densities and Abundances in the Lower Disk Atmosphere
Species
Excitation Temperature
Column Density
Abundance†
(K)
(cm-2)
CH3OHa
cm-2
NH2CHOb
()
()
HNCOb
()
()
H2COc
()
()
H2COd
()
()
H213CO
()
()
D2CO
()
()
CH3CHO
()
()
: Mean temperature and column density derived from non-LTE LVG calculation and rotation diagram.
: Temperature and column density derived from rotation diagram.
: Column density derived from H2CO line.
: Column density derived from H213CO line, assuming [12C]/[13C] ratio of 50.
: Temperature assumed to be 60 K.
: Mean temperature assumed to be the same as CH3OH.
: Temperature assumed to be 100 K.
: Abundance derived by dividing the column densities of the molecules by
the H2 column density in the disk atmosphere, which is 1.08 cm-2 (see text).
Table 3. Binding Energy (BE) and Sublimation Temperature (T)
in Amorphous Solid Water Ice
Species
Binding Energy
T
Outer Radius
References
(K)
(K)
(au)
CH3CHO
2809-6038(4423)
48-102(75)
36
Ferrero+2022
H2CO
3071-6194(4632)
52-104(78)
48
Ferrero+2020
HNCO
2400-8400(4800)
41-140(81)
24
Song & Kastner 2016
CH3OH
3770-8618(6194)
64-144(104)
40
Ferrero+2020
HCOOH
5382-10559(7970)
91-176(133)
24
Ferrero+2020
NH2CHO
5793-10960(8376)
97-183(140)
24
Ferrero+2020
NH3
4314-7549(5931)
73-126(100)
–
Ferrero+2020
H2O
3605-6111(4858)
61-103(82)
60a
Ferrero+2020
: The outer radius is given by that of HDO mapped at 60 au resolution (Codella et al., 2018).
The numbers in the parenthesis are the mean values, except for HNCO, for
which it is a value for maximum sublimation.
The sublimation temperature (T) is calculated for an age of
106 yr, appropriate for a young protoplanetary disk.
Adopting a shorter time of 105 yr, appropriate for a
Class 0/I protostellar system, would increase the sublimation temperature by
a few degrees.
Note that the computed BE values, notably those of acetaldehyde and ammonia,
may be slightly at odds with the published experimental ones, which depend
on the structure of the ices as well as the distribution of the species
population on the ices. For this reason, we chose to stick to the BEs
computed by the same authors, Ferrero et al.,
(with the exception of HNCO because these authors did not
compute it), to make the comparison possibly more reliable.