A First Look at Dataset Bias in License Plate Recognition
Abstract
Public datasets have played a key role in advancing the state of the art in License Plate Recognition (LPR). Although dataset bias has been recognized as a severe problem in the computer vision community, it has been largely overlooked in the LPR literature. LPR models are usually trained and evaluated separately on each dataset. In this scenario, they have often proven robust in the dataset they were trained in but showed limited performance in unseen ones. Therefore, this work investigates the dataset bias problem in the LPR context. We performed experiments on eight datasets, four collected in Brazil and four in mainland China, and observed that each dataset has a unique, identifiable “signature” since a lightweight classification model predicts the source dataset of a license plate (LP) image with more than 95% accuracy. In our discussion, we draw attention to the fact that most LPR models are probably exploiting such signatures to improve the results achieved in each dataset at the cost of losing generalization capability. These results emphasize the importance of evaluating LPR models in cross-dataset setups, as they provide a better indication of generalization (hence real-world performance) than within-dataset ones.
I Introduction
Is it possible to predict the dataset from which a license plate (LP) image is coming? Initially, one may think that this task is fairly trivial since – in principle – images from distinct datasets are collected in different regions, with different hardware, for different purposes, etc. On second thought, one may realize that it depends on the datasets we are comparing.
Suppose there are two datasets, one composed exclusively of images of American LPs and the other of images of European LPs. In that case, it should indeed be relatively straightforward to distinguish which dataset each LP image belongs to due to the many characteristics LPs from the same region/layout share in common, e.g., the aspect ratio, colors, symbols, the position of the characters, the number of characters, among others (this is well illustrated in [1]). Nevertheless, beyond the LP layout, are there unique signatures (bias) in each dataset that would enable identifying the source of an LP image?
The presence of unique signatures in public datasets was first revealed by Torralba et al. [2]. They investigated the then-popular object recognition datasets (PASCAL’07, ImageNet, among others) using the Name That Dataset! experiment in which a Support Vector Machine (SVM) classifier was trained to distinguish images from 12 datasets. If dataset bias did not exist, no classifier would be able to perform this task at levels considerably different from chance. However, their classifier reached an accuracy of %, which is significantly better than chance ( = %). This result becomes even more surprising when taking into account that those datasets were created with the expressed goal of being as varied and rich as possible, aiming to sample the visual world “in the wild” [2].
Dataset bias has been consistently recognized as a severe problem in the computer vision community [3, 4, 5, 6], as models are inadvertently learning idiosyncrasies of each dataset along with knowledge fundamental to the task under study. Nevertheless, to the best of our knowledge, it has remained largely unnoticed in the License Plate Recognition (LPR) literature.


Considering the above discussion, in this work we revisit the experiments conducted by Torralba et al. [2], adapting them to the LPR context (see Fig. 1, where we recreate the Name That Dataset! game [2] with Brazilian LPs 222 To maintain consistency with previous work [11, 10, 12], we refer to “Brazilian” as the layout used in Brazil before the adoption of the Mercosur layout.). Our experiments, performed on public datasets acquired in Brazil and mainland China, demonstrate that a lightweight Convolutional Neural Network (CNN) can identify the source dataset of an LP image with more than % accuracy, which is much higher than expected from chance or human perceptual similarity judgments. Intriguingly, our experiments also show no signs of saturation as more training data is added, i.e., the classification accuracy could be even higher if there were more training data.
The severity of the dataset bias problem in LPR boils down to the following. LPR datasets are usually very unbalanced in terms of character classes due to LP assignment policies [13, 14]. In a dataset collected in Brazil, for instance, one letter may appear much more frequently than others according to the state in which most vehicles were registered [15, 10] (e.g., the SSIG-SegPlate dataset [8] has instances of the letter ‘O’ but only instances of the letter ‘Q’). The same is true for vehicles registered in different cities within a province in mainland China [14, 16]. Considering that LPR models are generally trained and evaluated on images from the same dataset (see Section II), such bias can skew the predictions towards the prominent character classes, resulting in poor generalization performance in the real world [17, 18, 7].
The aim of this paper is two-fold. First, to situate the dataset bias problem in the LPR context and thus raise awareness in the community regarding the possible impacts of such bias as this issue is not getting the attention it deserves. Second, to discuss some subtle ways bias may have crept into the chosen datasets to outline directions for future research.
II Related Work
Automatic License Plate Recognition (ALPR) systems exploit image processing and pattern recognition techniques to find and recognize LPs in images or videos [19, 16]. Some practical applications for an ALPR system are automatic toll collection, road traffic monitoring, traffic law enforcement, and vehicle access control in restricted areas [20, 21].
Deep learning-based ALPR systems typically include two stages: License Plate Detection (LPD) and LPR [15, 22]. The former refers to locating the LP regions in the input image, while the latter refers to recognizing the characters on each LP. Recent works have focused on the LPR stage [23, 24, 14], as general-purpose object detectors have achieved impressive results in the LPD stage for some years now [25, 10].
The standard method of evaluating an LPR method’s performance is to use multiple publicly available datasets, such as SSIG-SegPlate [8] and CCPD [22], which are split into disjoint training and test sets. Such an assessment is typically done independently for each dataset [10, 21, 26]. As models based on deep learning can take significant time to be trained, some authors have adopted a slightly different protocol where the proposed networks are trained once on the union of the training images from the chosen datasets and evaluated individually on the respective test sets [27, 7, 19]. Although the images for training and testing belong to disjoint subsets, these protocols do not make it clear whether the evaluated models have good generalization ability, i.e., whether they perform well on images from other scenarios/datasets, mainly due to domain divergence and data selection bias [2, 3].
In fact, a recent work [7] showed that there are significant drops in LPR performance for most datasets when training and testing well-known Optical Character Recognition (OCR) models (e.g., CRNN and Facebook’s Rosetta) in a leave-one-dataset-out (LODO) experimental setup. One might think that such disappointing results were caused by the fact that existing datasets for LPR are heavily biased towards specific regional identifiers [13, 14]. Nevertheless, the authors explored several data augmentation techniques to avoid overfitting, including one based on character permutation [15] that is known to successfully mitigate the impacts of such bias on the learning of LPR models [28, 1, 29]. Thus, we soon hypothesized that there are other strong biases crept into LPR datasets. This analysis is precisely what motivated our work.
III Experiments
This section describes the experiments performed in this work. We first list the datasets explored in our assessments, explaining why they were chosen and not others. We also detail how the LP images from each dataset were selected and divided into training, validation and test subsets. Then, we describe the CNN model employed for the dataset classification task (Name That Dataset!) and provide implementation details. Finally, we report the results achieved.
III-A Datasets
Our experiments were carried out on images from eight public ALPR datasets introduced over the last decade: RodoSol-ALPR [7], SSIG-SegPlate [8], UFOP [9], UFPR-ALPR [10], a reduced version of CCPD [22], ChineseLP [30], PKU [31], and PlatesMania-CN [1]. The images of the first four datasets were acquired in three states of Brazil, while the images of the last four datasets were collected in various provinces of mainland China. We cropped the LP regions from the original images (taken in urban environments) for our experiments.
In this work, we chose to experiment with LPs from Brazil and mainland China because there are many ALPR systems designed primarily for LPs from one of those regions [11, 10, 17, 32]. Considering the objectives of our study, we also filter which LP images from each dataset to use in our experiments: (i) regarding the datasets collected in Brazil, we explore only LPs that have a single row of characters and gray as the background color; and (ii) for the datasets acquired in mainland China, we explore only LPs that have a single row of characters and blue as the background color. This protocol was adopted because the four datasets collected in each region have LPs with these characteristics. In contrast, only some have LPs with other characteristics (e.g., the UFOP and SSIG-SegPlate datasets do not have any two-row LPs, and the ChineseLP and PlatesMania-CN datasets do not have any yellow LPs). See Table I for an overview of the datasets used in our experiments. We labeled the color of each LP in every dataset to make this selection. These annotations are publicly available333 https://raysonlaroca.github.io/supp/sibgrapi2022/annotations.zip.
| Dataset | Year | LP Images | State / Province-City |
| UFOP [9] | Minas Gerais (BR) | ||
| ChineseLP [30] | Various (CN) | ||
| SSIG-SegPlate [8] | Minas Gerais (BR) | ||
| PKU [31] | Anhui-Tongling (CN) | ||
| UFPR-ALPR [10] | Paraná (BR) | ||
| CCPD [22] | Anhui-Hefei (CN) | ||
| PlatesMania-CN [1] | Various (CN) | ||
| RodoSol-ALPR [7] | Espírito Santo (BR) | ||
| ∗ The CCPD dataset was introduced in 2018 and last updated in 2020. | |||
| † Following [24], we used a reduced version of CCPD in our experiments. | |||
For reproducibility, it is essential to make clear how we divided the selected images from each of the datasets to train, validate and test the classification model (detailed in Section III-B). The CCPD, RodoSol-ALPR, SSIG-SegPlate and UFPR-ALPR datasets were split according to the protocols defined by the respective authors (i.e., the authors specified which images belong to which subsets), while the other datasets, which do not have well-defined evaluation protocols, were randomly split into % images for training; % images for validation; and % images for testing, following the split protocol adopted in the SSIG-SegPlate and UFPR-ALPR datasets444 The training, validation, and test splits are available at https://raysonlaroca.github.io/supp/sibgrapi2022/splits.zip. As the CCPD dataset has many more images than the others (more than K), we followed [24] and performed our experiments using a reduced version with K images.
Three points should be noted. First, for all datasets, we were careful not to have images of the same LP in different subsets (otherwise, different images of an LP could appear in both the training and test sets, for example). Second, as the chosen datasets have different numbers of test images, we randomly sample a set of test set images from different datasets to predict which dataset each image belongs to (for each region, is constrained by the smallest number of images in the test sets). This experiment is repeated times with different splits and we report the average results. Similar protocols were adopted in [2, 33, 3]. Third, we used Albumentations [34], a well-known library for image augmentation, to balance the number of training images from different datasets, thus avoiding overfitting. Transformations applied to generate new images include, but are not limited to, random noise, random JPEG compression, random shadows, and random perturbations of hue, saturation and brightness.
Hereinafter, “Brazilian LPs” refer to gray single-row LPs from vehicles registered in Brazil (prior to the adoption of the Mercosur layout), and “Chinese LPs” refer to blue single-row LPs from vehicles registered in mainland China. While some examples of Brazilian LPs can be seen in Fig. 1, some Chinese LPs from the chosen datasets are shown in Fig. 2.


One may have noticed that all LP images we showed (both in Fig. 1 and Fig. 2) are quite horizontal, tightly bounded, and “easy” to read. This is because we rectified all LP images to eliminate biases such as repetitive tilt angles caused by specific camera positions in images from distinct datasets. This procedure (i.e., LP rectification) has been performed quite frequently in the literature, as it makes the recognition methods considerably more robust to distortions caused by oblique views [21, 19, 16]. To perform the rectification, we labeled the position (, ) of the four corners of each LP in the eight datasets that do not contain such labels (only the CCPD and RodoSol-ALPR datasets have corner annotations for all LPs). These annotations are also publicly available33footnotemark: 3.
III-B Classification Model
For the dataset classification task (Name That Dataset!), we designed a lightweight CNN architecture called DC-NET. It is inspired by the CDCC-NET model [35] and is relatively similar to the model used for this same task in [36].
DC-NET’s architecture is shown in Table II. As can be seen, the model is relatively shallow, with three convolutional layers containing // filters, each followed by a max-pooling layer with a kernel and stride . Batch normalization, followed by a Rectified Linear Unit (ReLU), is added after each convolutional layer. We evaluated several changes to this architecture, such as using depthwise separable convolutional layers, convolutional layers with stride = (removing the max-pooling layers), and different input sizes and numbers of filters. However, better results were not obtained (we conducted these experiments in the validation set).
| # | Layer | Filters | Size / Stride | Input | Output |
|---|---|---|---|---|---|
| conv | |||||
| max | |||||
| conv | |||||
| max | |||||
| conv | |||||
| max | |||||
| flatten | |||||
| # | Layer | Units | Input | Output | |
| dense | |||||
| dense |
The DC-NET model was implemented using Keras. We used the Adam optimizer, initial learning rate = - (with ReduceLROnPlateau’s patience = and factor = -), batch size = , max epochs = , and patience = (the number of epochs with no improvement after which training is stopped).
All experiments were performed on a computer with an AMD Ryzen Threadripper X GHz CPU, GB of RAM, and an NVIDIA Quadro RTX GPU ( GB). In this setup, DC-NET runs at FPS (using batch size = ).
III-C Results
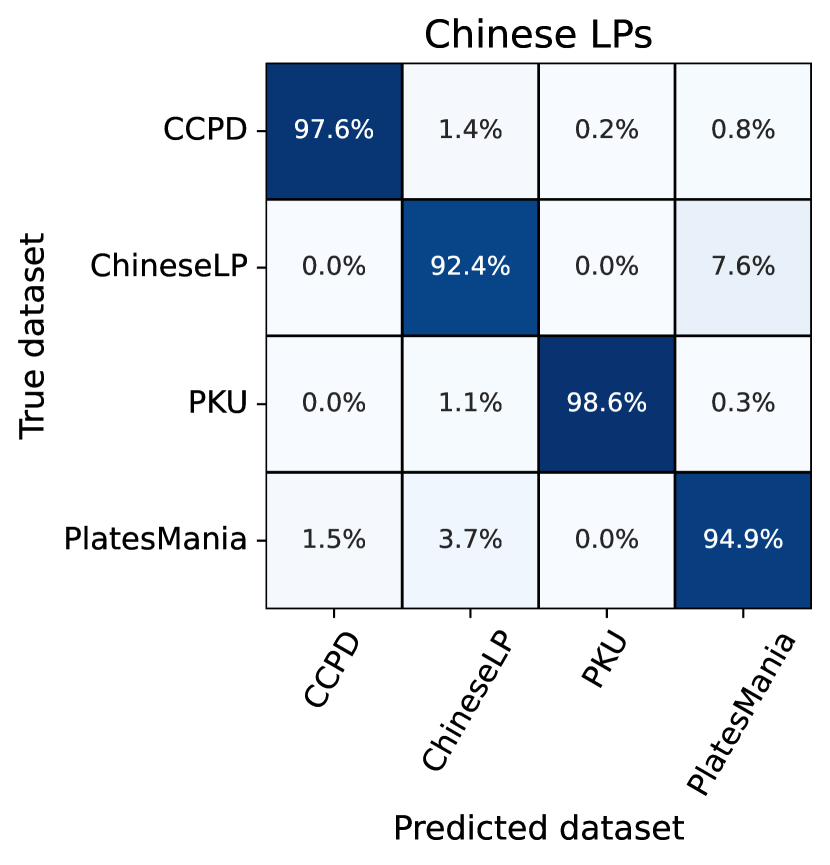
In this subsection, we report the results obtained by DC-NET in the dataset classification task (Name That Dataset!). Fig. 3 shows the confusion matrices for Brazilian (left) and Chinese (right) LPs. There is a clearly pronounced diagonal in both matrices, indicating that each dataset does have a unique, identifiable “signature”; it is worth noting that only about % accuracy would be expected if the classifier was operating at chance levels, as would happen if the LP images from each dataset were fully unbiased samples. The overall accuracy was % for Brazilian LPs and % for Chinese LPs.

The results show that the DC-NET model is more successful in classifying LP images from the datasets acquired with static cameras (RodoSol-ALPR, SSIG-SegPlate, UFOP, and PKU) than LP images from the datasets captured by handheld (CCPD, ChineseLP, and PlatesMania-CN) or moving cameras (UFPR-ALPR). We believe this is because images collected by static cameras have many characteristics in common, not just the background. These similarities are probably present to some extent in the LP regions, explaining the greater accuracy reached by the network in such images. To illustrate, in Fig. 4, we show two pairs of the most similar images – in terms of Mean Squared Error (MSE) – from distinct subsets from each of the RodoSol-ALPR and UFPR-ALPR datasets (the datasets where the highest and worst accuracy were achieved, respectively). Observe that factors common in images taken by static cameras, such as similar position and distance of the vehicles to the camera, may cause the LPs from different images to be quite resembling (note that this is not always the case; it may seem so because we focused on the most similar pairs of images from these datasets for this analysis).
It is intuitive to suppose that the network may simply have learned the most frequent regional characters in each dataset (e.g., most LPs in the CCPD dataset have ‘皖’ as the first character). However, this does not hold since DC-NET correctly classified more than % of the LP images from both datasets collected in the Brazilian state of Minas Gerais (SSIG-SegPlate and UFOP) and from both datasets acquired in the Anhui province in mainland China (CCPD and PKU).
By carefully analyzing the confusion matrices in Fig. 3, we noticed that almost all incorrect predictions on Chinese LPs were between the ChineseLP and PlatesMania-CN datasets. We consider this occurred because both datasets have images collected from the internet (the other six datasets do not contain any images from the internet). Specifically, all images from the PlatesMania-CN datasets were downloaded from the internet [1], while % of the ChineseLP’s images were taken from the internet [30]. It makes perfect sense that the bias is less pronounced when the images come from multiple sources. The classifier still managing to achieve high accuracy rates in both datasets is due to selection bias [2, 36, 5], which arises because authors building a dataset select images with specific purposes in mind, thus reducing the variability of the data (in many cases without even realizing it). Furthermore, these datasets have images with different quality levels, as they were introduced years apart and the capture devices evolved considerably in the time between them being collected.


An interesting point Torralba et al. [2] highlighted was that by using more training data, the classification accuracy could be increased with no immediate signs of saturation. Intrigued by such results, we trained the DC-NET model three more times for each LP layout: using %, % and % of the training data (randomly selected). As shown in Fig. 5, the same behavior is observed in our experiments, i.e., the accuracy consistently improves as the size of the training set increases.


Another interesting finding is that the classifier predicts the source dataset correctly with a significantly higher confidence value than when it predicts incorrectly. The mean confidence values for correctly classified Brazilian and Chinese LPs were % and %, respectively, while the mean confidence values for incorrectly classified Brazilian and Chinese LPs were % and %, respectively. Fig. 6 shows the Receiver Operating Characteristic (ROC) curves for Brazilian (left) and Chinese (right) LPs.


IV Discussion
Considering that the DC-NET model – which is relatively shallow – can predict the source dataset of an LP image with accuracy above %, we conjecture that most LPR models – which are considerably deeper – are actually learning and exploiting such signatures to improve the results achieved in seen datasets at the cost of losing generalization capability. The intuition behind this conjecture is as follows: consider the SSIG-SegPlate dataset [8] as an example, it has many LPs with the letter ‘O’ as the first character but no LP with the letter ‘Q’ in that position. Hence, an LPR model capable of identifying that a given LP image belongs to this dataset may predict the letter ‘O’ as the first character even if the character looks more like ‘Q’ than ‘O’ due to noise or other factors. However, the relatively high recognition rates achieved in the SSIG-SegPlate dataset would likely not be reached in unseen datasets.
While we are unaware of previous attempts to Name That Dataset! in the LPR context, our findings echo the concerns recently raised by Laroca et al. [7]. They evaluated the cross-dataset generalization of well-known OCR models applied to LPR on nine datasets. As mentioned in Section II, they observed significant drops in performance for most datasets when training and testing the models in a LODO fashion (i.e., one dataset is selected as the test set, and the remaining datasets are used for training). Interestingly, the authors drew attention to the fact that the errors under the LODO protocol did not occur in challenging cases and thus were probably caused by differences in the training and test images.
We believe that the main cause of dataset bias is related to the cameras used to collect the images in each dataset. Taking the results achieved in Brazilian LPs as an example, the lowest accuracy (i.e., less pronounced bias) was reported for the UFPR-ALPR dataset, which was captured by three non-static cameras of different price ranges. In contrast, the other datasets have images acquired by a single static camera (SSIG-SegPlate and UFOP) or by multiple static cameras of the same model (RodoSol-ALPR). In the same direction, another probable cause of bias relates to how the images were stored in different datasets. For example, the CCPD dataset contains highly compressed images [7, 19] while most other datasets do not. DC-NET probably exploited the detection of artifacts in the highly compressed LP images for better classification.
Some works have related dataset bias to image backgrounds [36, 37]. For example, a classifier may be classifying images of the class “boat” without focusing on the boat itself but rather on the water below or the shore in the distance [2]. Although we are convinced that we have eliminated such bias by performing our experiments on rectified LP images, it is worth noting that the corner annotations provided along with the CCPD dataset [22] are not as accurate as those we made or those from the RodoSol-ALPR dataset [7]. The DC-NET model may have exploited these subtle distinctions as well.
It is worth noting that while these conclusions have been reached for the particular classifier used in our experiments, similar trends are expected to hold for similar models [36].
We consider two initial ways to mitigate the dataset bias problem in LPR. The first is leveraging deep learning-based methods’ high capability to visualize and understand how bias has crept into the chosen datasets. One technique that immediately comes to mind is Grad-CAM [38], which uses the gradients of any target class flowing into the final convolutional layer to produce a coarse localization map highlighting the important regions in the image for predicting the class.
The other way is to embrace the “wildness” of the internet to collect a large-scale dataset for LPR. However, as shown in Section III and in [2], downloading images from the internet alone does not guarantee a bias-free sampling, as keyword-based searches return only particular types of images; users of a specific website prefer images with certain characteristics, among other factors. Thus, such a dataset should be obtained from multiple sources on the internet (e.g., multiple search engines and websites from various countries).
V Conclusions and Future Work
In this work, we situate the dataset bias problem [2, 3] in the LPR context. We performed experiments on LP images from eight publicly available datasets; four were collected in Brazil and four in mainland China. The results showed that each dataset does have a unique, identifiable signature.
Specifically, our Name That Dataset! experiments showed that the source dataset of an LP image could be predicted with more than % accuracy (chance is = %). Intriguingly, we observed no evidence of saturation as more training data was added. We believe there is no theoretical reason for such results other than the strong biases in the actual datasets.
Considering our findings, we hope this work will encourage evaluating LPR models in cross-dataset setups, as they provide a better indication of generalization (hence real-world performance) than within-dataset ones.
How to best leverage the high capability of deep learning-based methods to mitigate the dataset bias problem in LPR is open for research in future work. As the first step in this direction, we plan to exploit visualization methods, such as Grad-CAM [38], to produce visually explainable heatmaps to give us clues into why such a lightweight classifier performs so well at distinguishing between LP images from different datasets.
ACKNOWLEDGMENTS
This work was partly supported by the Coordination for the Improvement of Higher Education Personnel (CAPES) (Programa de Cooperação Acadêmica em Segurança Pública e Ciências Forenses # 88881.516265/2020-01), and partly by the National Council for Scientific and Technological Development (CNPq) (# 308879/2020-1). We gratefully acknowledge the support of NVIDIA Corporation with the donation of the Quadro RTX GPU used for this research.
References
- [1] R. Laroca et al., “An efficient and layout-independent automatic license plate recognition system based on the YOLO detector,” IET Intelligent Transport Systems, vol. 15, no. 4, pp. 483–503, 2021.
- [2] A. Torralba and A. A. Efros, “Unbiased look at dataset bias,” in IEEE/CVF Conference on Computer Vision and Pattern Recognition (CVPR), pp. 1521–1528, June 2011.
- [3] T. Tommasi et al., “A deeper look at dataset bias,” in Domain Adaptation in Computer Vision Applications, pp. 37–55. Springer, 2017.
- [4] A. Ashraf, S. S. Khan, N. Bhagwat, and B. Taati, “Learning to unlearn: Building immunity to dataset bias in medical imaging studies,” in Machine Learning for Health Workshop at NeurIPS, pp. 1–5, 2018.
- [5] C. Wachinger et al., “Detect and correct bias in multi-site neuroimaging datasets,” Medical Image Analysis, vol. 67, p. 101879, 2021.
- [6] N. Jaipuria et al., “deepPIC: Deep perceptual image clustering for identifying bias in vision datasets,” in IEEE/CVF Conference on Computer Vision and Pattern Recognition Workshops, pp. 4793–4802, June 2022.
- [7] R. Laroca et al., “On the cross-dataset generalization in license plate recognition,” in International Conference on Computer Vision Theory and Applications (VISAPP), pp. 166–178, Feb 2022.
- [8] G. R. Gonçalves, S. P. G. da Silva, D. Menotti, and W. R. Schwartz, “Benchmark for license plate character segmentation,” Journal of Electronic Imaging, vol. 25, no. 5, p. 053034, 2016.
- [9] P. R. Mendes Júnior et al., “Towards an automatic vehicle access control system: License plate location,” in IEEE International Conference on Systems, Man, and Cybernetics, pp. 2916–2921, Oct 2011.
- [10] R. Laroca et al., “A robust real-time automatic license plate recognition based on the YOLO detector,” in International Joint Conference on Neural Networks (IJCNN), pp. 1–10, July 2018.
- [11] S. M. Silva and C. R. Jung, “Real-time Brazilian license plate detection and recognition using deep convolutional neural networks,” in Conference on Graphics, Patterns and Images (SIBGRAPI), pp. 55–62, 2017.
- [12] I. O. Oliveira et al., “Vehicle-Rear: A new dataset to explore feature fusion for vehicle identification using convolutional neural networks,” IEEE Access, vol. 9, pp. 101 065–101 077, 2021.
- [13] C. Anagnostopoulos et al., “A license plate-recognition algorithm for intelligent transportation system applications,” IEEE Transactions on Intelligent Transportation Systems, vol. 7, no. 3, pp. 377–392, 2006.
- [14] L. Zhang et al., “A robust attentional framework for license plate recognition in the wild,” IEEE Transactions on Intelligent Transportation Systems, vol. 22, no. 11, pp. 6967–6976, 2021.
- [15] G. R. Gonçalves et al., “Real-time automatic license plate recognition through deep multi-task networks,” in Conference on Graphics, Patterns and Images (SIBGRAPI), pp. 110–117, Oct 2018.
- [16] Y. Wang et al., “Rethinking and designing a high-performing automatic license plate recognition approach,” IEEE Transactions on Intelligent Transportation Systems, vol. 23, no. 7, pp. 8868–8880, 2022.
- [17] Y. Yang, D. Li, and Z. Duan, “Chinese vehicle license plate recognition using kernel-based extreme learning machine with deep convolutional features,” IET Intelligent Transport Systems, vol. 12, pp. 213–219, 2018.
- [18] S. Zhang et al., “Robust license plate recognition with shared adversarial training network,” IEEE Access, vol. 8, pp. 697–705, 2020.
- [19] S. M. Silva and C. R. Jung, “A flexible approach for automatic license plate recognition in unconstrained scenarios,” IEEE Transactions on Intelligent Transportation Systems, vol. 23, no. 6, pp. 5693–5703, 2022.
- [20] S. Du et al., “Automatic license plate recognition (ALPR): A state-of-the-art review,” IEEE Transactions on Circuits and Systems for Video Technology, vol. 23, no. 2, pp. 311–325, 2013.
- [21] W. Weihong and T. Jiaoyang, “Research on license plate recognition algorithms based on deep learning in complex environment,” IEEE Access, vol. 8, pp. 91 661–91 675, 2020.
- [22] Z. Xu et al., “Towards end-to-end license plate detection and recognition: A large dataset and baseline,” in European Conference on Computer Vision (ECCV), pp. 261–277, 2018.
- [23] L. F. Zeni and C. Jung, “Weakly supervised character detection for license plate recognition,” in Conference on Graphics, Patterns and Images (SIBGRAPI), pp. 218–225, 2020.
- [24] Q. Liu et al., “Fast recognition for multidirectional and multi-type license plates with 2D spatial attention,” in International Conference on Document Analysis and Recognition (ICDAR), pp. 125–139, 2021.
- [25] G. S. Hsu, A. Ambikapathi, S. L. Chung, and C. P. Su, “Robust license plate detection in the wild,” in IEEE International Conference on Advanced Video and Signal Based Surveillance, pp. 1–6, Aug 2017.
- [26] Y. Zhang, Z. Wang, and J. Zhuang, “Efficient license plate recognition via holistic position attention,” in AAAI Conference on Artificial Intelligence, pp. 3438–3446, May 2021.
- [27] Z. Selmi, M. B. Halima, U. Pal, and M. A. Alimi, “DELP-DAR system for license plate detection and recognition,” Pattern Recognition Letters, vol. 129, pp. 213–223, 2020.
- [28] G. R. Gonçalves et al., “Multi-task learning for low-resolution license plate recognition,” in Iberoamerican Congress on Pattern Recognition (CIARP), pp. 251–261, Oct 2019.
- [29] J. Shashirangana, H. Padmasiri, D. Meedeniya, C. Perera, and S. Kadry, “License plate recognition using neural architecture search for edge devices,” International Journal of Intelligent Systems, pp. 1–38, 2021.
- [30] W. Zhou, H. Li, Y. Lu, and Q. Tian, “Principal visual word discovery for automatic license plate detection,” IEEE Transactions on Image Processing, vol. 21, no. 9, pp. 4269–4279, Sept 2012.
- [31] Y. Yuan, W. Zou, Y. Zhao, X. Wang, X. Hu, and N. Komodakis, “A robust and efficient approach to license plate detection,” IEEE Transactions on Image Processing, vol. 26, no. 3, pp. 1102–1114, 2017.
- [32] Y. Gong et al., “Unified Chinese license plate detection and recognition with high efficiency,” Journal of Visual Communication and Image Representation, vol. 86, p. 103541, 2022.
- [33] A. Khosla, T. Zhou, T. Malisiewicz, A. A. Efros, and A. Torralba, “Undoing the damage of dataset bias,” in European Conference on Computer Vision (ECCV), pp. 158–171, Oct 2012.
- [34] A. Buslaev et al., “Albumentations: Fast and flexible image augmentations,” Information, vol. 11, no. 2, p. 125, 2020.
- [35] R. Laroca et al., “Towards image-based automatic meter reading in unconstrained scenarios: A robust and efficient approach,” IEEE Access, vol. 9, pp. 67 569–67 584, 2021.
- [36] N. McLaughlin, J. M. Del Rincon, and P. Miller, “Data-augmentation for reducing dataset bias in person re-identification,” in IEEE International Conf. on Advanced Video and Signal Based Surveillance, pp. 1–6, 2015.
- [37] M. Tian et al., “Eliminating background-bias for robust person re-identification,” in IEEE/CVF Conference on Computer Vision and Pattern Recognition (CVPR), pp. 5794–5803, 2018.
- [38] R. R. Selvaraju et al., “Grad-CAM: Visual explanations from deep networks via gradient-based localization,” in IEEE International Conference on Computer Vision (ICCV), pp. 618–626, 2017.