ECU Identification using Neural Network Classification and Hyperparameter Tuning
Abstract
Intrusion detection for Controller Area Network (CAN) protocol requires modern methods in order to compete with other electrical architectures. Fingerprint Intrusion Detection Systems (IDS) provide a promising new approach to solve this problem. By characterizing network traffic from known ECUs, hazardous messages can be discriminated. In this article, a modified version of Fingerprint IDS is employed utilizing both step response and spectral characterization of network traffic via neural network training. With the addition of feature set reduction and hyperparameter tuning, this method accomplishes a 99.4% detection rate of trusted ECU traffic.
Index Terms:
IDS, electronic control unit, controller area network, machine learning (ML), artificial neural network (ANN), automotive electronics (AE).I Introduction
Automotive electrical systems consist of several physically isolated ECUs that control various functions and operations of a vehicle, e.g., engine control, traction control. Common in-vehicle communication bus networks include CAN, Local Interconnect Network (LIN), and FlexRay [1]. CAN is the most commonly used bus system in automotive networks, and it has proven to be a reliable architecture for the exponential growth of vehicle electrical systems.
As in-vehicle electrical architectures evolve in both complexity and capability, so does their potential for cybersecurity attacks and intrusion. CAN, unlike more modern architectures, e.g., automotive Ethernet, does not have the inherent capability to handle these new threats to security and safety [2]. However, due to its ongoing success and broad institutional knowledge manufacturers will continue to use CAN as the backbone of in-vehicle architecture for the foreseeable future.
In order to maintain CAN’s relevancy in the face of newer and more secure electrical architectures, it’s security capabilities must be enhanced by novel methods for intrusion detection and mitigation. This becomes even more pressing with the onset of advanced connected-vehicle features such as vehicle sensor networks, autonomous control, and mobile connectivity. In addition, various interactions and interdependencies between several cyber-physical components or ECUs may cause eavesdropping, spoofing or Denial of service (DoS) attacks, hence compromising the system[3]. There are also growing concerns of increased remote intrusion with the proliferation of mobile network integration into modern vehicles [4].
CAN, a vehicle network communication standard using CSMA/CD [5], allows network messages to be broadcast to every ECU on the network on an open bus architecture. This topology is beneficial for ease of information access across the network, allowing an arbitrary ECU to extract all the information they need from other ECUs while maintaining low wiring cost and design complexity [6]. Unfortunately, this also means that intrusive actors with physical access to the vehicle can spoof ECU messages easily.
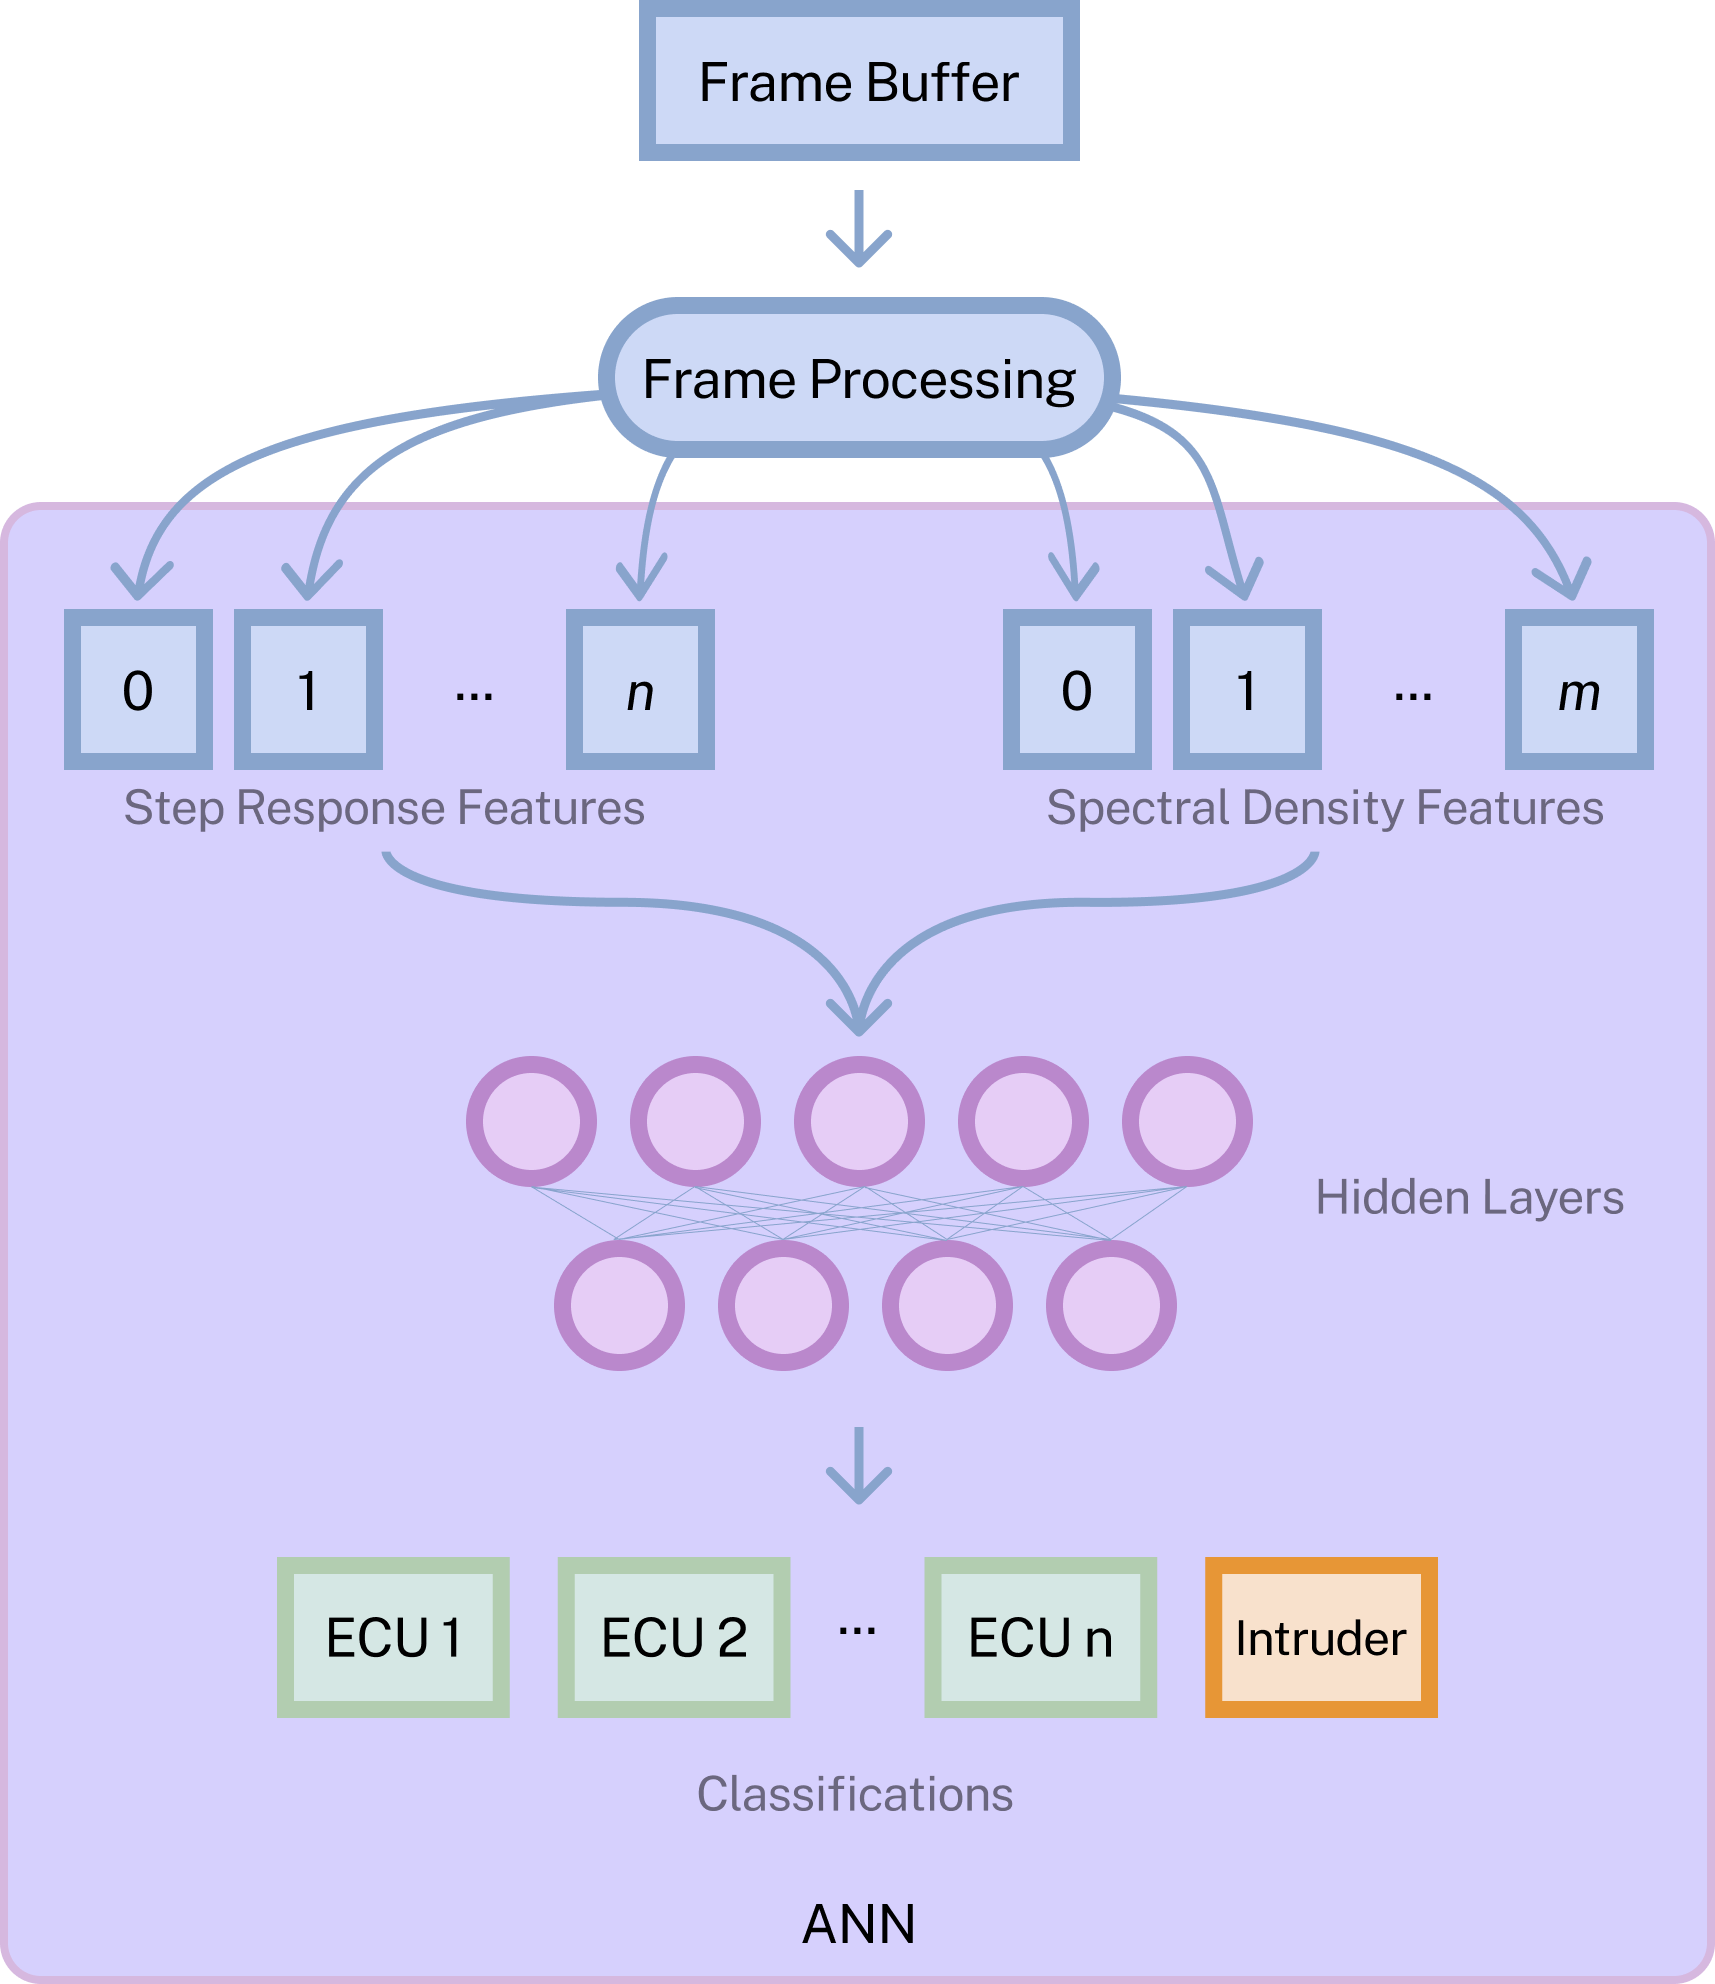
One solution to this problem is by uniquely identifying known ECU messages, and recognizing when unknown ECU messages are present on the network. This can be accomplished in a number of ways, but it is important that the technique used for ECU identification creates enough contrast and uncorrelated behavior with other ECUs so that messages on the network can be classified accurately and with little confusion. Once known and trusted ECUs have been successfully identified and integrated into a detection model, fingerprinting can be employed to detect and isolate unknown ECU signatures, as illustrated in Fig 1.

One such method, proposed by [7], shows a promising way of fingerprinting network messages. Transient and step-response features are extracted from sampled ECU communications. This feature set is then used to train an ANN to learn which messages are sent by a given ECU, and then identify whether future messages belong to trusted ECUs or adversarial ECUs.
In the proposed work, we investigate further improvements of this method by increasing the feature space used to train the ANN. In addition to signal transient and steady-state characteristics, spectral analysis characteristics are included to further bolster the classification accuracy. In addition, a feature space reduction is performed to optimize performance and remove features that provide neutral or negative influence during the classification of messages.
With this new work we hope to replicate the previous results of [7] and improve upon accuracy with our proposed modifications.
II Message Detection Methods
There are two main categories of classification that are discussed in the current literature on ECU authentication and identification: (i) message authentication code (MAC) [8], and (ii) IDS [9].
MAC-based methods achieve security by encrypting the message payloads of a CAN packet prior to transmission. This family of authentication protocols can lead to high transmission costs, and part cost to each ECU on the network [10, 11, 12, 13, 14].
Alternatively, IDS relies on the uniqueness of each ECU’s electrical operation and message transmission channel to create unique profiles from messages transmitted by the ECU. This requires a supervisory monitoring ECU or additional compute on a centralized ECU, but the data rate requirements of IDS are much lower than that of MAC, meaning that network bandwidth is not affected by the authentication system. Additionally, there are four sub-classes of IDS that span the current literature:
Parameter Monitoring IDS involves using periodic frequency [15] and time-of-flight (TOF) (remote frame) characteristics [16] of messages to establish a baseline of behavior. Later, new messages are measured against the expected message parameters in order to identify suspicious or fraudulent messages.
Information Theory IDS relies upon an ordered messaging schedule in which a specific sequence of messages is established. If the sequence is violated, this indicates the presence of an attack. This can prove to be a fairly effective technique as the authors in [17] collected 6.673 million CAN packets for different vehicles, and the experimental results show that CAN messages have low entropy of an average of 11.915 bits.
ML IDS approaches rely upon consistent and regularly observed characteristics for each node in the network. In general, regression and clustering algorithms are trained on signals or observed behaviors from each node separately in order to uniquely identify the node. Then, an advisory system with these known signatures confirm that messages propagating in the network are indeed coming from the authorized nodes. ML-based methods are effective for detecting network attacks on nearly every level of communication, i.e., from physical to application layer. [18] Examples of these methods include Long Short Term Memory (LSTM) [19], Ternary Content Addressable Memory (TCAM) [20], and CAN Frame Deep Learning [21].
Fingerprint IDS involves measuring physical characteristics of message packets sent from other ECUs on the network. There are many characteristics that can be extracted from signals and messages observed on the CAN bus, and therefore it is a method that can be implemented in many different ways.
Previous works have employed different techniques, e.g., clock-based intrusion detection (CIDS) [22], time and frequency domain features [23]. However, the latter method is the primary focus of this paper, which works on optimizing physical signal feature extraction and selection for categorization of CAN traffic.
III A Practical Intrusion Detection Module
A practical realization of an IDS consists of a microcontroller with a frame buffer that isolates several recessive-dominant transitions during an ECU’s communication frame. This should allow the data processing algorithm to isolate at least one single-bit pulse for each ECU, for every period of CAN traffic. The frame buffer could then be processed to classify the origin of the message.
Additionally, the microcontroller could be designed to perform reinforcement learning of the neural network in order to adjust to changing physical conditions of the ECU and harness wiring over time, as well as for addressing the dynamic behavior of intruders. A cheaper alternative could utilize other compute resources in the vehicle for network training, and using the IDS microcontroller to hold the neural network in memory.
In this paper, we will discuss a static / off-line data processing method to produce the desired classification of network messages.
IV Dataset Preparation
The dataset used in this paper originates from the one used in [7], which includes CAN-High (CANH) protocol data from 7 ECUs. Each ECU is recorded 30 times on average, with roughly 600 samples per record at 20 kHz baud rate. The records provided show a regular clock pulse from CANH dominant bit (logic 1) to recessive bit (logic 0), with an 86% duty-cycle of the dominant bit. CANH has two logical voltage levels, 3.5V for the dominant bit and 2.5V for the recessive bit [24]. Analyzing the CANH signal using a variety of fingerprinting feature sets allowed us to create ML classifiers of varying accuracy.
One key part of conditioning our static data required employing Out-Of-Bound Pulse protection. This is a pre-processing step used to isolate clean pulses that in turn produce a better result in algorithm performance.
For a peak index vector and peak times ) sec., we check to see if any period between peaks is less than the expected signal interval . is the sampling frequency. For those indices that do not meet our desired criteria, we remove them leaving only the desired peak index vector and desired peak time vector s.t.
V Feature Selection and Extraction
In the previous work [7], the feature set used for classification of specific channels relied upon step response signal characteristics. We repeated this analysis (Method 1 or M1) and used it as our baseline for performance.
In addition to step response characteristics, we chose to also include features generated from Spectral Analysis of the sampled signal pulses. Each pulse can be evaluated through the use of the Discrete Fourier Transform (DFT). With this frequency spectrum representation of our signal we also extracted other unique features that could provide improved performance to our neural network model.
V-A Rising and Falling Edge Detection
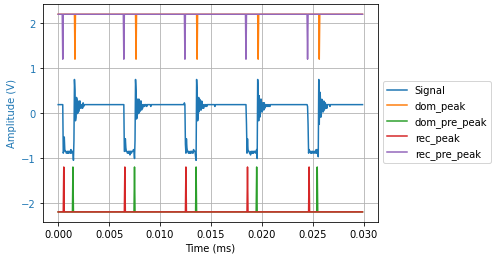
An important tool for the analysis of step response characteristics is rising edge detection. For our purposes, we utilized a moving average filter with a window size of 6 samples, adjusted the sample values by a threshold value, and then used zero-crossing detection to determine the time and indices of each peak.
In practice, after removing DC bias from the signal, we found that V provided accurate peak index output for our dataset.
Similarly, we also are interested in the falling edge of each pulse to measure other features from a signal. A similar process is applied, but in addition we also dynamically paired leading and falling edges to isolate dominant and recessive pulses. Fig. 3 illustrates both processes on a multiple pulse measurement.
V-B Peak Time (Tp)
We calculated peak time by utilizing the paired rising and falling edge indices, as well as the sampling time of the signal:
V-C Steady-State Value (SSV)
Measurement of the SSV required a moving average filter window size approximately equal to the shorter bit pulse length, followed by threshold detection. In this case, the window size was equivalent to the recessive bit pulse duration of roughly 20 samples.
V-D Steady-State Error (SSE)
In order to calculate the SSE, we chose the closest ideal voltage using the SSV of the current pulse ( 2.5V if , 3.5V if ) and found the difference.
V-E Percent Overshoot (%OS)
Percent overshoot measures the amount of overshoot on the rising edge of a pulse above and is defined as,
V-F Settling Time (Ts)
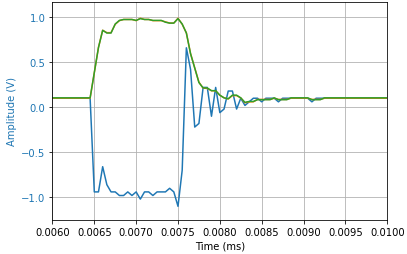
Calculating settling time required using threshold detection on a smoothed signal envelope, an example is shown in Fig. 4. A 5% detection threshold was used to avoid poor measurement consistency caused by aliasing and noise in the signal.
V-G Rise Time (Tr)
Rise Time is the amount of time for the rising edge of a pulse to reach . Determining this value is similar to the process for finding settling time, using as the threshold value on the rising edge of each pulse.
V-H Delay Time (Td)
Delay Time is the amount of time for the rising edge of a pulse to reach . Determining this value is similar to the process for finding settling time, using as the threshold value.
V-I Power Spectral Density (PSD or SD)
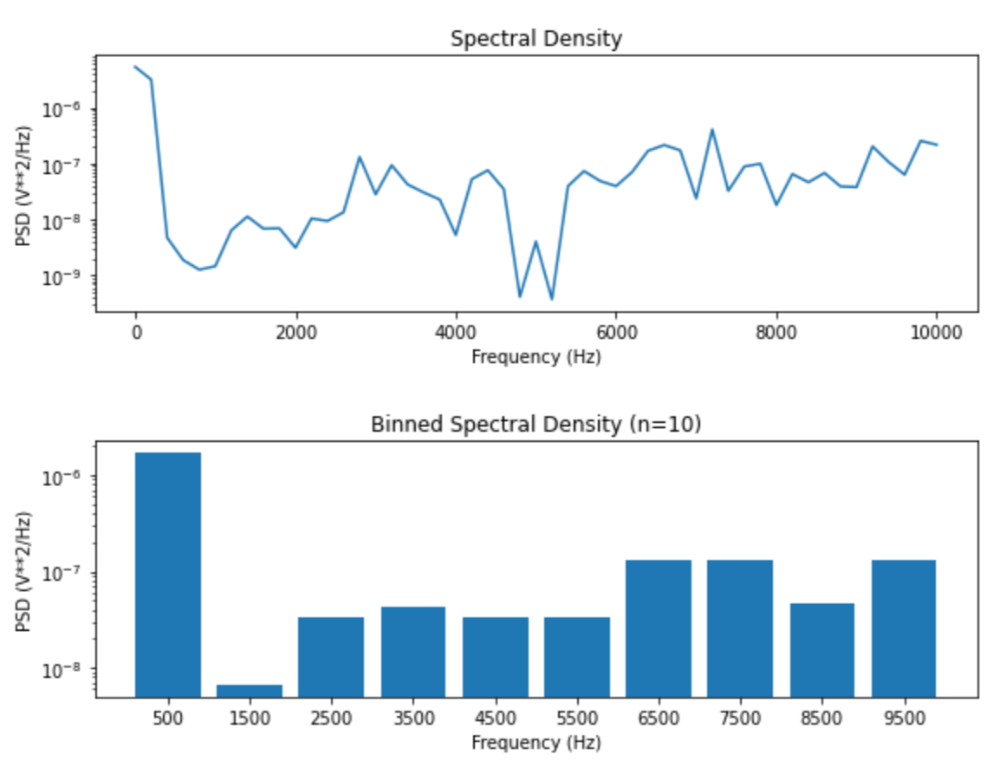
The method for frequency spectrum transformation of the signal data used in this work utilizes Welch’s method [25] to perform an efficient FFT of a sequential input vector (samples series data in our case). This algorithm is available in the scikitlearn library.
We could have utilized every value of the PSD magnitude vector ( 200 values) in our ML model training, however this could have lead to a high computational cost. Instead, we chose to adopt frequency binning as a means of capturing the spectral shape of the pulse’s frequency domain information, as shown in Fig 5.
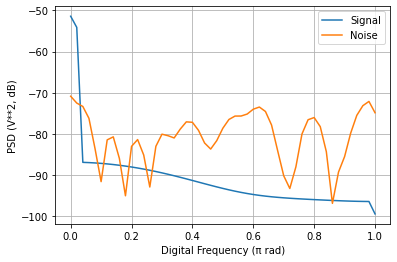
V-J Signal-To-Noise Ratio (SNR)
SNR measures the ratio between the power of the ideal pulse signal (step function) and the power of the signal noise (measured signal minus the ideal step function). It is shown in Fig. 6.
V-K Mean Frequency (MNF)
Mean frequency can be calculated directly from the PSD and frequency vector data produced by the FFT algorithm [26] as,
V-L Median Frequency (MDF)
Median frequency is the frequency at which energy is split equivalently in the PSD of the pulse [26]. The PSD is normalized, cumulatively summed, offset by 50% of the signal energy, and an abs value is applied. Median frequency is found by locating the frequency at which a minima occurs in this resulting vector.
V-M Feature Extraction
All the acquisition functions detailed above were processed for each signal recording. The resultant database was then parsed for pertinent feature data and copied to a data dictionary, in addition to file metadata (CAN Id, Channel Length (m), Channel Medium, ECU Record Id, and Filepath). Once a record was created for each file, the data dictionary was used to produce the feature subsets that are fed to our ANN.
VI ML Methodology
The dataset was split into a training (70%) and test set (30%) for each run. In early development static random number generation seeds were utilized. This helped to maintain a consistent understanding of performance across different subsets of features. After generalized performance was understood, the training and datasets were completely randomized, run to run, in order to remove any training bias and overfitting that could influence performance results.
For all feature sets in this work, we trained a multi-layer perceptron neural network model (MLP Classifier from scikit-learn) to predict classifications for the ECUs in our testing set. This model utilizes the Adam solver [27].
For initial training, the hyperparameter values were chosen to be quite large in order to allow the solver to converge to a maximal solution. Early training typically used approximately 1000 hidden layers and 3000 epochs.
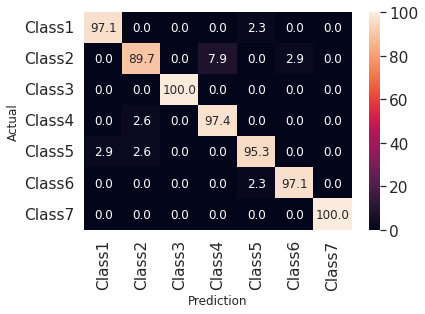
After the model was trained, the remaining test records were used to measure performance of the model. A confusion matrix was constructed with the actual values of the test set, and the predicted values of the model.
VII Feature Tuning
Two methods are evaluated initially using the feature extraction data,
-
1.
Step Response Features (M1) [7]
-
2.
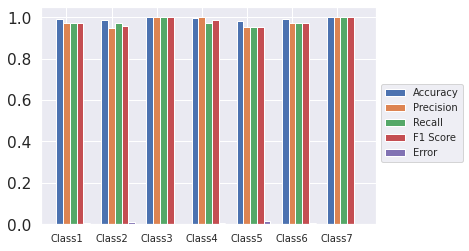
Step Response + Spectral Analysis Features (M2)
Figs. 7 and 8 show sample results for M2. M1 produced an average ECU classification accuracy of 96.85%, and M2 produced an average accuracy of 98.28% in the initial trials.
With M1 performance as a baseline, we looked to improve accuracy by fine tuning the feature set. Neural network training was performed for each individual feature. We then ranked the features by accuracy to identify the best performers (Fig 9).

We then added features one by one to successive neural networks until we observed diminishing returns in accuracy (Fig 10).
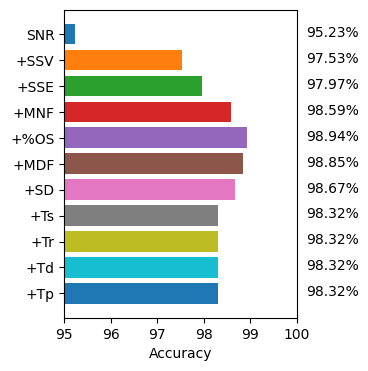
The final feature set includes only , , , , and . Overall, we were able to exclude features that did not provide significant value to the overall performance of the neural network model, hence reducing computational cost in the training of the model.
VIII Hyperparameter Tuning
Although in earlier testing we picked large values for our neural network hyperparameters (maximum epochs of 3000, maximum hidden layers of 1000) we wished to see if there were points of diminishing returns for both.
We found that epoch performance converged at around 500 iterations. Hidden layer performance was variable and could reach optimality from 100-1000 layers. These points/ranges were chosen as the default hyperparameter values and adjusted to maximize accuracy performance for each feature set.
IX Results
With our final feature sets chosen, we ran 20 randomized trials using the MLP Classifier, with a hyperparameter optimization of 275 hidden layers and 500 epochs for both M1 and M2. For M1, this led to an average accuracy of 97.17% (M1opt). A similar optimization was performed with the M2 feature set, resulting in higher performance with a 99.4% average accuracy (M2opt).
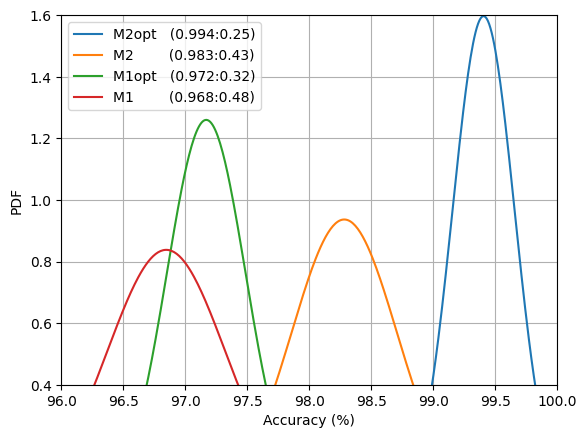
X Conclusion
This paper adds new features to Fingerprint-based IDS and optimizes feature selection through a single pass of feature reduction. New features include signal characteristics from the domain of spectral analysis, in particular, PSD, SNR, mean frequency, and median frequency. The feature reduction pass performs a quasi-heuristic search of feature combinations in order to maximize the ratio of performance to computation. Another quasi-heuristic search process is used to optimize hyperparameter values for the multi-layer perceptron neural network. We compare all of the primary methods of this paper in Fig. 11. The accumulated channel detection accuracy of the best performing method is 99.4%.
References
- [1] C. F. Caruntu, V. Varga, and O. Pauca, “Truetime-based analysis of the communication networks used in vehicle control structures,” in 2020 21th International Carpathian Control Conference (ICCC), 2020, pp. 1–6.
- [2] M. Bozdal, M. Samie, and I. Jennions, “A survey on can bus protocol: Attacks, challenges, and potential solutions,” in 2018 International Conference on Computing, Electronics Communications Engineering (iCCECE), 2018, pp. 201–205.
- [3] M. Girdhar, J. Hong, H. Lee, and T.-j. Song, “Hidden markov models based anomaly correlations for the cyber-physical security of ev charging stations,” IEEE Transactions on Smart Grid, pp. 1–1, 2021.
- [4] “Upstream Security Global Automotive Cybersecurity Report,” http://bit.ly/2oTQtB0, 2019.
- [5] W. Xiaofan, P. Chong, and w. y. Leong, “Performance comparison of csma/cd, csma/ca, csma/ri, csma/pri and csma/pr with beb,” Proceedings of the 2010 5th IEEE Conference on Industrial Electronics and Applications, ICIEA 2010, 06 2010.
- [6] S. Guo, “The application of can-bus technology in the vehicle,” in 2011 International Conference on Mechatronic Science, Electric Engineering and Computer (MEC), 2011, pp. 755–758.
- [7] A. Hafeez, K. Topolovec, and A. Selim, “Ecu fingerprinting through parametric signal modeling and artificial neural networks for in-vehicle security against spoofing attacks,” 2019 15th International Computer Engineering Conference, pp. 29–38, 2019.
- [8] A. Hafeez, K. Topolovec, and S. Awad, “Ecu fingerprinting through parametric signal modeling and artificial neural networks for in-vehicle security against spoofing attacks,” in 2019 15th International Computer Engineering Conference (ICENCO), 2019, pp. 29–38.
- [9] M. D. Hossain, H. Inoue, H. Ochiai, D. Fall, and Y. Kadobayashi, “Lstm-based intrusion detection system for in-vehicle can bus communications,” IEEE Access, vol. 8, pp. 185 489–185 502, 2020.
- [10] B. Gierlichs and A. Y. Poschmann, Cryptographic Hardware and Embedded Systems–CHES 2016. Springer, 2016.
- [11] A. Hazem and H. Fahmy, “Lcap-a lightweight can authentication protocol for securing in-vehicle networks,” in 10th escar Conf. Embedded Security in Cars, Berlin, Germany, vol. 6, 2012.
- [12] T. P. Doan and S. Ganesan, “Can crypto fpga chip to secure data transmitted through can fd bus using aes-128 and sha-1 algorithms with a symmetric key,” SAE Technical Paper, Tech. Rep., 2017.
- [13] H. Ueda, R. Kurachi, H. Takada, T. Mizutani, M. Inoue, and S. Horihata, “Security authentication system for in-vehicle network,” SEI Technical Review, vol. 81, pp. 5–9, 2015.
- [14] T. Sugashima, D. K. Oka, and C. Vuillaume, “Approaches for secure and efficient in-vehicle key management,” SAE International Journal of Passenger Cars-Electronic and Electrical Systems, vol. 9, no. 2016-01-0070, pp. 100–106, 2016.
- [15] A. Taylor, N. Japkowicz, and S. Leblanc, “Frequency-based anomaly detection for the automotive can bus,” in World Congress on Industrial Control Systems Security (WCICSS). IEEE, 2015, pp. 45–49.
- [16] H. Lee, S. Jeong, and H. Kim, “Otids: A novel intrusion detection system for in-vehicle network by using remote frame,” in 15th Annual Conf. on Privacy, Security and Trust (PST). IEEE, 2017, pp. 57–5709.
- [17] E. Wang, W. Xu, S. Sastry, S. Liu, and K. Zeng, “Hardware module-based message authentication in intra-vehicle networks,” in ACM/IEEE 8th Int. Conf. on Cyber-Physical Systems (ICCPS). IEEE, 2017, pp. 207–216.
- [18] W. Wu, R. Li, G. Xie, J. An, Y. Bai, J. Zhou, and K. Li, “A survey of intrusion detection for in-vehicle networks,” IEEE Trans. on Intelligent Transportation Systems, 2019.
- [19] A. Taylor, S. Leblanc, and N. Japkowicz, “Anomaly detection in automobile control network data with long short-term memory networks,” in IEEE Int. Conf. on Data Science and Advanced Analytics (DSAA). IEEE, 2016, pp. 130–139.
- [20] M. Markovitz and A. Wool, “Field classification, modeling and anomaly detection in unknown can bus networks,” Vehicular Communications, vol. 9, pp. 43–52, 2017.
- [21] M. Kang and J. Kang, “Intrusion detection system using deep neural network for in-vehicle network security,” PloS one, vol. 11, no. 6, p. e0155781, 2016.
- [22] K.-T. Cho and K. G. Shin, “Fingerprinting electronic control units for vehicle intrusion detection.” in USENIX Security Symposium, 2016, pp. 911–927.
- [23] O. Avatefipour, A. Hafeez, M. Tayyab, and H. Malik, “Linking received packet to the transmitter through physical-fingerprinting of controller area network,” in 2017 IEEE Workshop on Information Forensics and Security (WIFS). IEEE, 2017, pp. 1–6.
- [24] A. Hafeez, J. Mohan, M. Girdhar, and S. S. Awad, “Machine learning based ecu detection for automotive security,” in 2021 17th International Computer Engineering Conference (ICENCO), 2021, pp. 73–81.
- [25] P. Welch, “The use of fast fourier transform for the estimation of power spectra: A method based on time averaging over short, modified periodograms,” IEEE Transactions on Audio and Electroacoustics, vol. 15, no. 2, pp. 70–73, 1967.
- [26] A. Phinyomark, S. Thongpanja, H. Hu, P. Phukpattaranont, and C. Limsakul. The usefulness of mean and median frequencies in electromyography analysis. Accessed: 2021-08-12. [Online]. Available: https://www.intechopen.com/chapters/40123
- [27] D. P. Kingma and J. Ba, “Adam: A method for stochastic optimization,” 2017.