GOALS-JWST: Unveiling Dusty Compact Sources in the Merging Galaxy IIZw096
Abstract
We have used the Mid-InfraRed Instrument (MIRI) on the James Webb Space Telescope (JWST) to obtain the first spatially resolved, mid-infrared (mid-IR) images of IIZw096 (catalog ), a merging luminous infrared galaxy (LIRG) at . Previous observations with the Spitzer Space Telescope suggested that the vast majority of the total IR luminosity () of the system originated from a small region outside of the two merging nuclei. New observations with JWST/MIRI now allow an accurate measurement of the location and luminosity density of the source that is responsible for the bulk of the IR emission. We estimate that of the IR bolometric luminosity, or , arises from a source no larger than 175 pc in radius, suggesting a luminosity density of at least . In addition, we detect 11 other star forming sources, five of which were previously unknown. The MIRI F1500W/F560W colors of most of these sources, including the source responsible for the bulk of the far-IR emission, are much redder than the nuclei of local LIRGs. These observations reveal the power of JWST to disentangle the complex regions at the hearts of merging, dusty galaxies.
1 Introduction
IIZw096 (catalog ) (CGCG448-020 (catalog ), IRAS20550+1656 (catalog )) is a merging, luminous infrared galaxy (LIRG) at with an infrared (IR) luminosity of , one of the more than 200 LIRGs in the Great Observatories All-sky LIRGs Survey (GOALS; Armus et al., 2009). Previous imaging with the Spitzer Space Telescope revealed that the majority (up to ) of the infrared luminosity of the entire system comes from a region outside of the merging nuclei (Inami et al., 2010), making it an even more extreme case than the well known Antennae Galaxies (Mirabel et al., 1998; Brandl et al., 2009).
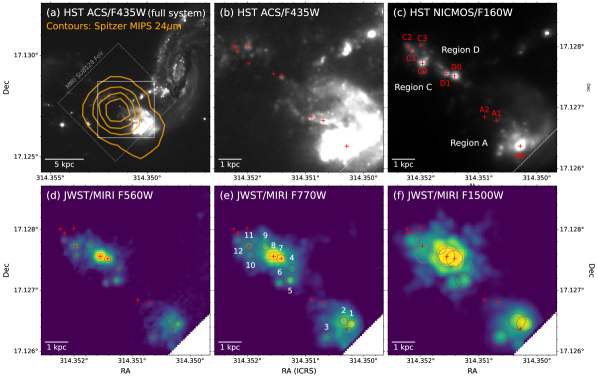
The system consists of regions A, C, and D (Figure 1c) along with a merging spiral galaxy to the northwest (Goldader et al., 1997). Regions C and D are not detected or have extremely low signal-to-noise ratio (SNR) at ultraviolet and optical wavelengths with the Hubble Space Telescope (HST), but only at near-IR and longer wavelengths (Inami et al., 2010; Barcos-Muñoz et al., 2017; Wu et al., 2022; Song et al., 2022). Although the Spitzer/MIPS 24m image suggested that a single compact source in region D dominates the emission, the large beam size made it impossible to resolve the exact location of the immense far-IR emission. The superior sensitivity and resolving power of the James Webb Space Telescope (JWST) lets us pinpoint the source that is responsible for the intense IR emission and study its complex environment on sub-kpc scales in the mid-IR for the first time.
Here, we present high-spatial resolution mid-IR imaging of IIZw096 (catalog ) taken with the JWST Mid-InfraRed Instrument (MIRI; Rieke et al., 2015; Bouchet et al., 2015). Throughout this paper, we adopt a cosmology with , and . The redshift of IIZw096 (catalog ) () corresponds to a luminosity distance of 160Mpc and a projected physical scale of 725.
2 Observations and Data Reduction
The JWST observations were performed under the Directors Discretionary Time Early Release Science (ERS) program 1328 (co-PIs: Armus, L. and Evans, A. S.). Images of IIZw096 (catalog ) were obtained on July 2, 2022 with a MIRI subarray (SUB128) using the F560W (m), F770W (7.7m) and F1500W (15m) filters. The pointing was centered at 314.35167∘,17.12769∘ (J2000), where the prominent mid-IR emission was identified with Spitzer. The observations were dithered and exposure times set to avoid saturation (46, 48, and 48 seconds, respectively). The data were reduced with the standard JWST calibration pipeline (data processing software ver.2022_2a, calibration software ver.1.5.3; Gordon et al., 2015; Bushouse et al., 2022) and up-to-date reference files from the Calibration References Data System. The images in this work, including HST, are aligned to the Gaia Data Release 3 catalog (Gaia Collaboration et al., 2016, 2021).
3 Results
The improvement in the spatial resolution of JWST compared to Spitzer resolves the mid-IR emission into individual clumps down to scales of pc, enabling measurements of mid-IR color and surface density to study the nature of IIZw096 (catalog ).
3.1 Mid-IR Clumps in the Disturbed Region
Individual sources are identified with the DAOFIND algorithm (Stetson, 1987) in the F770W SUB128 subarray image, which have the highest SNR, using the Python photutils package (Bradley et al., 2021). The detection threshold is . The sources detected in the F770W image are used as priors for photometry in all three bands (Figure 1). We assign identification (ID) numbers for the detected sources in ascending order of R.A. For a subset of sources shown in Wu et al. (2022), we also refer to their source names (Figure 1c). The same 12 clumps are detected in the F560W image, while in the F1500W image, four of them (IDs 4, 9, 10, 11/C0) lie on the structure of the point spread function (PSF) of the brightest source (ID 8/D1), making confident detections and flux measurements difficult. Thus, we only report their upper limits.
| ID | RA | Dec | F560W | F770W | F1500W |
|---|---|---|---|---|---|
| degree | degree | mJy | mJy | mJy | |
| 1 | 314.350210 | 17.126449 | |||
| 2 | 314.350342 | 17.126498 | |||
| 3 | 314.350638 | 17.126226 | |||
| 4 | 314.351233 | 17.127361 | |||
| 5 | 314.351263 | 17.127169 | |||
| 6 | 314.351444 | 17.127124 | |||
| 7/D0 | 314.351423 | 17.127521 | |||
| 8/D1 | 314.351552 | 17.127566 | |||
| 9 | 314.351688 | 17.127728 | |||
| 10 | 314.351945 | 17.127588 | |||
| 11/C0 | 314.351972 | 17.127732 | |||
| 12 | 314.352156 | 17.127821 | |||
| Total |
As shown in Figure 1, the most prominent mid-IR source is ID 8 (source D1), lying northeast of ID 7 (source D0). Although ID 8 is fainter than ID 7 in the HST/NICMOS 1.6m image, its emission exceeds ID 7 at 5.6m and 7.7m by a factor of three. At 15m, the ID 8-to-ID 7 flux ratio increases to about five. Although ID 7 was previously speculated to be associated with the bulk of the total IR emission due to its prominence at 1.6m (Inami et al., 2010), the majority of the mid-IR emission in fact originates from ID 8.
There are five bright mid-IR clumps (IDs 1, 4, 5, 6, and 12) that are either not detected or have extremely low SNR in the HST 1.6m image. ID 1 is in the less dusty region A to the southwest. The three sources, IDs 4, 5, and 6, are south of ID 7. The remaining one, ID 12, is located northeast of ID 8. Interestingly, these new mid-IR selected sources are not concentrated in the dustiest region, but spread throughout the perturbed region.
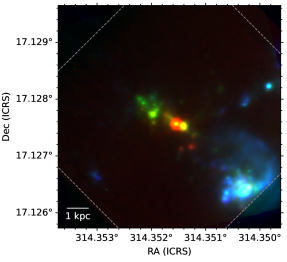
Additional structure is evident in the MIRI image, outside of the main power source in the IIZw096 (catalog ) system (Figure 2). Region A, which accounts for most of the optical emission, hosts a number of clumps in the MIRI data. Around region C, the emission peaks at 1.6m but fades towards the mid-IR.
3.2 Mid-IR Colors of the Clumps
Aperture photometry was employed to measure the flux of the detected clumps, except for IDs 7 and 8 due to their relative proximity (see below). The aperture radii used for F560W, F770W, and F1500W are , , and , respectively, with aperture corrections of 0.65, 0.65, and 0.50 111The aperture correction values are from the PSF encircled energy at https://jwst-docs.stsci.edu/jwst-mid-infrared-instrument/miri-performance/miri-point-spread-functions. Aperture photometry in the F1500W image was performed after subtracting ID 8, due to its prominent PSF pattern (note that the PSF has not been subtracted in Figure 1f). The source subtraction was performed using a PSF generated by WebbPSF (Perrin et al., 2012, 2014) 222https://www.stsci.edu/jwst/science-planning/proposal-planning-toolbox/psf-simulation-tool. To account for the extremely red color of ID 8, a power-law spectrum with a spectral slope of 3, resembling the mid-IR color of IIZw096 (catalog ), was used to generate the PSF. This provides a more accurate flux measurement of the sources around ID 8.
To extract the fluxes of IDs 7 and 8, a simultaneous two-dimensional Gaussian fit was performed in the F560W and F770W images. In the F1500W image, the flux of ID 8, which dominates the emission, was also extracted via a simultaneous two-dimensional Gaussian fit. However, we did not adopt the flux of ID 7 from this fit because this source lies on the Airy ring of ID 8. Instead, the flux of ID 7 was derived from a single Gaussian fit333We adopted Gaussian fits for IDs 7 and 8 to use a consistent method across the filter bands. to the image after subtraction of ID 8 to minimize contamination from the PSF.
The local background was measured using a 3-clipped median of various annuli. They have a minimum inner radius the half-width half-maximum (HWHM) of the PSF and a maximum radius that is (for F560W and F770W) and (F1500W) the PSF HWHM in steps of around each source. During this process, the other detected sources were masked out to avoid background over-estimation. Each of the measured background levels was separately subtracted from the measured flux, providing a distribution of fluxes for each source. The median value of this distribution is reported as the final flux density in Table 1. The 16th and 84th percentiles were adopted as the flux uncertainties.
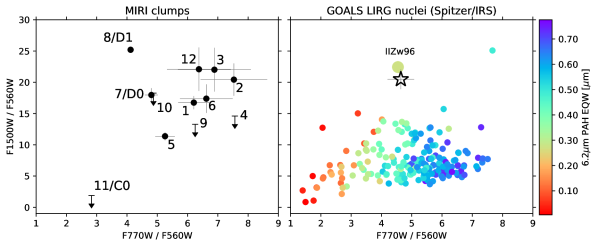
Based on the measured fluxes in all three MIRI bands, we show the F1500W/F560WF770W/F560W color-color diagram in Figure 3. These colors are a sensitive measure of the mid-IR continuum slope, and the F770W/F560W color is also sensitive to emission of polycyclic aromatic hydrocarbon (PAH) at 7.7m. The individual clumps detected in the MIRI SUB128 images are shown in the left panel. We also present the same diagram for local LIRG nuclei using Spitzer/IRS low-resolution spectra taken with the Short-Low (SL; m) and Long-Low (LL; m) spectroscopy (Stierwalt et al., 2013, 2014). We generated synthetic photometry from the spectra using the MIRI filter curves and the Python synphot package (STScI Development Team, 2018). The SL and LL slits fully cover regions C and D. The LL slit also covers region A. As expected from the IRS spectra (Inami et al., 2010; Stierwalt et al., 2013), the F1500W/F560W color from the synthetic photometry of the dust-obscured region in IIZw096 (catalog ) is an outlier with a much redder color than the rest of the local LIRGs. With JWST/MIRI, we are now able to decompose the emission into individual clumps to study the distribution of their mid-IR colors.
The summed flux of all the clumps in color space agrees well with the color measured with the much larger beam of Spitzer/IRS (Figure 3 right). All MIRI-detected clumps show redder colors () than most of the local LIRG nuclei, except for ID 5, which has F1500W/F560W. ID 8 (D1) is the reddest, while ID 7 (D0) has a comparable F1500W/F560W color to the other clumps. The newly detected source ID 12 is the second reddest, along with IDs 2 and 3 having excess emission at 15m and 7.7m compared to most of the other sources.
The F770W/F560W colors of the clumps are spread over a range of . As expected since they dominate the mid-IR flux, the F770W/F560W colors of the two brightest sources, IDs 7 and 8, agree well with the color of IIZw096 (catalog ) derived from the synthetic photometry on the IRS spectrum. The remaining sources, except for IDs 5, 10 and 11 are redder with . These red sources have F770W/F560W colors consistent with strong PAH emission. The bluer sources suggest weaker PAH emission or an excess of hot dust. The F770W/F560W colors of IDs 7 and 8 are comparable to sources with 6.2m PAH equivalent widths (EQWs) of about half that seen in pure starburst nuclei (Figure 3 right), which is consistent with the direct measurement in the IRS spectrum (6.2m PAH EQWm; Inami et al., 2010) and may indicate an excess of very hot dust.
3.3 Infrared Luminosity Surface Density
To estimate the luminosity density of each clump in the MIRI image, we first use the measured flux to estimate . Assuming that the 15m flux correlates with , we compute the fractional contribution of each clump to the total 15m flux. The flux of the diffuse emission is measured with an aperture of radius centered on the F1500W image with the total flux of all the clumps being subtracted. The resulting flux density of the diffuse emission is 190mJy 444In F560W and F770W, diffuse emission fluxes measured with the same method are 18mJy and 90mJy, respectively.. Finally, the estimated in the obscured region (; Inami et al., 2010) is scaled by these fractions to calculate the of each component. The resulting for ID 8 (D1) is , corresponding to a SFR of (assuming a Kroupa initial mass function; Kennicutt, 1998; Kroupa, 2001; Madau & Dickinson, 2014). This rises to or a SFR of if we assume that the diffuse emission at 15m does not contribute to at all, because this ascribes more of the to ID 8.
As an alternative, we derive a bolometric correction factor from the ensemble of GOALS nuclei to estimate of each clump. This factor is calculated using the 29 GOALS nuclei with similar colors to the clumps in IIZw096 (catalog ), F1500W/F560W and F770W/F560W shown in Figure 3 (right). From this we obtain a median bolometric correction factor (/) of . This yields for ID 8 (D1). This is consistent with the estimate above, where the total in the dust-embedded region is split up based on the 15m flux fraction of each clump.
We can also estimate based on the known correlation between the 8m luminosity () and (; Elbaz et al., 2011). However, for this correlation was obtained using the Spitzer 8m band, which has a wider bandwidth than JWST/F770W (2.9m and 2.2m, respectively). Assuming that the bandwidth ratio can be used to correct for the difference, we obtain for ID 8. This 8m-based is slightly lower than, but consistent with the 15m-based . Because the longer IR wavelength better traces the IR bolometric luminosity, we adopt the 15m-based hereafter.
Because ID 8 (D1) is unresolved, the MIRI PSF size at 15m limits its radius to pc. Thus, a lower limit on the surface density () is . This corresponds to a SFR surface density of if powered by star formation.
4 Discussion
Our JWST imaging has revealed the complexity of the dustiest region of the merging galaxy, IIZw096 (catalog ). The three main components in the perturbed region show a wide variety of optical-infrared colors and morphologies, with a mix of bright, unresolved clumps and diffuse emission. This suggests a range in properties, such as extinction, SFR, age, and dust temperature in this ongoing merger.
Although ID 7 (D0) is the brightest source at 1.6m, the JWST mid-IR data demonstrate that ID 8 (D1) generates the bulk of the total IR emission in IIZw096 (catalog ). The location of ID 8 also coincides with two OH megamasers (Migenes et al., 2011; Wu et al., 2022) 555IIZw096 (catalog ) also hosts an megamaser (Wiggins et al., 2016; Kuo et al., 2018), but its exact location is unknown.. Megamasers are often found in merging (U)LIRGs, in close proximity to the nuclei (e.g., Roberts et al., 2021), marking regions of extremely high gas density and strong far-IR radiation.
The emission we have targeted with JWST is clearly responsible for the bulk of the luminosity in IIZw096 (catalog ) and it arises from outside of the prominent two merging galaxies, one of which is the spiral galaxy to the northwest that lies outside of the MIRI SUB128 FoV (Figure 1a). However, it is possible that ID 8 is a third nucleus in this system. Given the observed mid-IR morphology, region ACD could be a single disrupted galaxy or it could be two galaxies with source A0 being one nucleus and ID 8 (D1) being the other. The diffuse, extended emission around ID 8 would then be the remnants of the third galaxy’s disk. The estimated stellar mass of ID 8 is and there is a similarly large mass of gas in this region (Inami et al., 2010; Wu et al., 2022). These estimates might indicate ID 8 is a partially stripped third nucleus. Although the current MIRI SUB128 images do not provide evidence for either the two- or three-body merger scenario, our upcoming JWST observations (ERS program 1328) may elucidate this question. The deeper MIRI and NIRCam full-array imaging may detect a more pronounced disk-like morphology around ID 8. A detection of a rotation curve around ID 8 by the planned spectroscopic observations could suggest that ID 8 is a third nucleus.
ID 8 (D1) generates of the total IR emission of the IIZw096 (catalog ) system, corresponding to an surface density of . This is the characteristic surface brightness of starbursts, but comparable to super star clusters (Meurer et al., 1997) including some in the Antennae Galaxies (Brandl et al., 2009). The surface density limit of ID 8 is also consistent with the ULIRG nuclei studied at 12.5m with Keck (Soifer et al., 2000, 2001). In addition, the 33GHz continuum imaging ( resolution) taken with the Very Large Array shows that the peak emission is located at ID 8 (Song et al., 2022). These authors estimated a SFR surface density of , corresponding to an surface density of , which agrees with the value derived from the mid-IR. Given the surface density limit from the mid-IR and the column density of obtained via the molecular gas mass (within an aperture of ; Wu et al., 2022), ID 8 appears to be below the Eddington limit if its size is pc. (e.g., Pereira-Santaella et al., 2021; Barcos-Muñoz et al., 2015).
The clumps in the disturbed region, including ID 8 (D1), are much redder in F1500W/F560W than local LIRG nuclei. Based on the 9.7m silicate optical depth () derived from Spitzer/IRS spectroscopy, the -band extinction is estimated to be mag (Inami et al., 2010). The unusually red colors of IIZw096 (catalog ) could be due to an extremely young, highly obscured starburst or AGN, triggered by the recent merger. The other LIRG with a very red F1500W/F560W color, IRAS22491-1808, is also an on-going merger with bright clumps of star formation (Surace, 1998; Surace et al., 1998).
The F770W/F560W color traces the 7.7m PAH emission and is also a good proxy for the 6.2m PAH EQW (Figure 3 right). Using the 6.2m PAH EQW as a diagnostic of starbursts and AGN (e.g., Brandl et al., 2006; Armus et al., 2007; Petric et al., 2011), the clumps with F770W/F560W are consistent with pure star formation. However, the color of ID 8 (D1) is in the range where an AGN cannot be excluded. Although analysis of X-ray spectra of IIZw096 (catalog ) obtained with Chandra, XMM-Newton, and NuSTAR also favor star formation, the non-detection of ID 8 by NuSTAR does not rule out a Compton-thick AGN if the column density exceeds (Iwasawa et al., 2011; Ricci et al., 2021). In fact, the estimated column density of ID 8 is (Wu et al., 2022). The evidence may be consistent with the presence of a Compton-thick AGN but it is equally consistent with a starburst, and neither is conclusive. Our upcoming mid-IR and near-IR spectroscopic data (ERS program 1328) are expected to shed additional light on the underlying energy source of this heavily obscured source, perhaps through detection of one or more coronal emission lines.
5 Conclusions
The JWST/MIRI imaging demonstrates uncharted aspects of the dust emission from the extremely luminous, merging galaxy IIZw096 (catalog ). The high spatial resolution and high sensitivity mid-IR imaging of this work yields the following findings:
-
•
For the first time, we have spatially resolved the mid-IR emission of the merger-induced heavily dust-obscured region of IIZw096 (catalog ). We identify the source (ID 8/D1) that is responsible for the bulk of the mid-IR emission, accounting for % of the total IR emission of the system.
-
•
In total, 12 clumps are detected in the F770W (and F560W) image, five of which are newly identified and were not detected or had low SNR detections at 1.6m with HST/NICMOS. Most of the clumps have similar F1500W/F560W colors, ranging from to 25. These colors are about twice as red as local LIRG nuclei, but agree with the colors derived from synthetic photometry on Spitzer spectra of this system. Among LIRG nuclei, the F770W/F560W colors roughly correlate with the 6.2m PAH EQW, and therefore the clumps have colors indicative of 6.2m PAH EQWs from m to m, slightly lower than but including pure star formation.
-
•
The estimated of ID 8 (D1) is , which corresponds to a SFR of if it is star-forming. As the source is unresolved, we estimate its surface density to be or a SFR surface density of . Such high surface densities put source D1 in a range comparable to young super star clusters and ULIRG nuclei.
The JWST mid-IR imaging described in this Letter has revealed a hidden aspect of IIZw096 (catalog ), and has opened a door towards identifying heavily dust-obscured sources which cannot be found at shorter wavelengths. Future planned spectroscopic observations of IIZw096 (catalog ) will provide additional information on the nature of the dust, ionized gas, and warm molecular gas in and around the disturbed region of this luminous merging galaxy.
References
- Armus et al. (2007) Armus, L., Charmandaris, V., Bernard-Salas, J., et al. 2007, The Astrophysical Journal, 656, 148, doi: 10.1086/510107
- Armus et al. (2009) Armus, L., Mazzarella, J. M., Evans, A. S., et al. 2009, Publications of the Astronomical Society of the Pacific, 121, 559, doi: 10.1086/600092
- Astropy Collaboration et al. (2013) Astropy Collaboration, Robitaille, T. P., Tollerud, E. J., et al. 2013, Astronomy and Astrophysics, 558, A33, doi: 10.1051/0004-6361/201322068
- Astropy Collaboration et al. (2018) Astropy Collaboration, Price-Whelan, A. M., Sipőcz, B. M., et al. 2018, The Astronomical Journal, 156, 123, doi: 10.3847/1538-3881/aabc4f
- Barcos-Muñoz et al. (2015) Barcos-Muñoz, L., Leroy, A. K., Evans, A. S., et al. 2015, The Astrophysical Journal, 799, 10, doi: 10.1088/0004-637X/799/1/10
- Barcos-Muñoz et al. (2017) —. 2017, The Astrophysical Journal, 843, 117, doi: 10.3847/1538-4357/aa789a
- Bouchet et al. (2015) Bouchet, P., García-Marín, M., Lagage, P. O., et al. 2015, Publications of the Astronomical Society of the Pacific, 127, 612, doi: 10.1086/682254
- Bradley et al. (2021) Bradley, L., Sipőcz, B., Robitaille, T., et al. 2021, Zenodo, doi: 10.5281/zenodo.4624996
- Brandl et al. (2006) Brandl, B. R., Bernard-Salas, J., Spoon, H. W. W., et al. 2006, The Astrophysical Journal, 653, 1129, doi: 10.1086/508849
- Brandl et al. (2009) Brandl, B. R., Snijders, L., den Brok, M., et al. 2009, The Astrophysical Journal, 699, 1982, doi: 10.1088/0004-637X/699/2/1982
- Bushouse et al. (2022) Bushouse, H., Eisenhamer, J., Dencheva, N., et al. 2022, Zenodo, doi: 10.5281/zenodo.6984366
- Elbaz et al. (2011) Elbaz, D., Dickinson, M., Hwang, H. S., et al. 2011, Astronomy and Astrophysics, 533, A119, doi: 10.1051/0004-6361/201117239
- Gaia Collaboration et al. (2016) Gaia Collaboration, Prusti, T., de Bruijne, J. H. J., et al. 2016, Astronomy and Astrophysics, 595, A1, doi: 10.1051/0004-6361/201629272
- Gaia Collaboration et al. (2021) Gaia Collaboration, Brown, A. G. A., Vallenari, A., et al. 2021, Astronomy and Astrophysics, 649, A1, doi: 10.1051/0004-6361/202039657
- Goldader et al. (1997) Goldader, J. D., Goldader, D. L., Joseph, R. D., Doyon, R., & Sanders, D. B. 1997, The Astronomical Journal, 113, 1569, doi: 10.1086/118374
- Gordon et al. (2015) Gordon, K. D., Chen, C. H., Anderson, R. E., et al. 2015, Publications of the Astronomical Society of the Pacific, 127, 696, doi: 10.1086/682260
- Inami et al. (2010) Inami, H., Armus, L., Surace, J. A., et al. 2010, The Astronomical Journal, 140, 63, doi: 10.1088/0004-6256/140/1/63
- Iwasawa et al. (2011) Iwasawa, K., Sanders, D. B., Teng, S. H., et al. 2011, Astronomy and Astrophysics, 529, A106, doi: 10.1051/0004-6361/201015264
- Kennicutt (1998) Kennicutt, Jr., R. C. 1998, The Astrophysical Journal, 498, 541, doi: 10.1086/305588
- Kroupa (2001) Kroupa, P. 2001, Monthly Notices of the Royal Astronomical Society, 322, 231, doi: 10.1046/j.1365-8711.2001.04022.x
- Kuo et al. (2018) Kuo, C. Y., Constantin, A., Braatz, J. A., et al. 2018, The Astrophysical Journal, 860, 169, doi: 10.3847/1538-4357/aac498
- Madau & Dickinson (2014) Madau, P., & Dickinson, M. 2014, Annual Review of Astronomy and Astrophysics, vol. 52, p.415-486, 52, 415, doi: 10.1146/annurev-astro-081811-125615
- Meurer et al. (1997) Meurer, G. R., Heckman, T. M., Lehnert, M. D., Leitherer, C., & Lowenthal, J. 1997, The Astronomical Journal, 114, 54, doi: 10.1086/118452
- Migenes et al. (2011) Migenes, V., Coziol, R., Cooprider, K., et al. 2011, Monthly Notices of the Royal Astronomical Society, 416, 1267, doi: 10.1111/j.1365-2966.2011.19124.x
- Mirabel et al. (1998) Mirabel, I. F., Vigroux, L., Charmandaris, V., et al. 1998, Astronomy and Astrophysics, 333, L1. https://ui.adsabs.harvard.edu/abs/1998A&A...333L...1M/abstract
- Pereira-Santaella et al. (2021) Pereira-Santaella, M., Colina, L., García-Burillo, S., et al. 2021, Astronomy & Astrophysics, Volume 651, id.A42, <NUMPAGES>28</NUMPAGES> pp., 651, A42, doi: 10.1051/0004-6361/202140955
- Perrin et al. (2014) Perrin, M. D., Sivaramakrishnan, A., Lajoie, C.-P., et al. 2014, Society of Photo-Optical Instrumentation Engineers (SPIE) Conference Series, 9143, 91433X, doi: 10.1117/12.2056689
- Perrin et al. (2012) Perrin, M. D., Soummer, R., Elliott, E. M., Lallo, M. D., & Sivaramakrishnan, A. 2012, Society of Photo-Optical Instrumentation Engineers (SPIE) Conference Series, 8442, 84423D, doi: 10.1117/12.925230
- Petric et al. (2011) Petric, A. O., Armus, L., Howell, J., et al. 2011, The Astrophysical Journal, 730, 28, doi: 10.1088/0004-637X/730/1/28
- Ricci et al. (2021) Ricci, C., Privon, G. C., Pfeifle, R. W., et al. 2021, Monthly Notices of the Royal Astronomical Society, 506, 5935, doi: 10.1093/mnras/stab2052
- Rieke et al. (2015) Rieke, G. H., Wright, G. S., Böker, T., et al. 2015, Publications of the Astronomical Society of the Pacific, 127, 584, doi: 10.1086/682252
- Roberts et al. (2021) Roberts, H., Darling, J., & Baker, A. J. 2021, The Astrophysical Journal, 911, 38, doi: 10.3847/1538-4357/abe944
- Soifer et al. (2000) Soifer, B. T., Neugebauer, G., Matthews, K., et al. 2000, The Astronomical Journal, 119, 509, doi: 10.1086/301233
- Soifer et al. (2001) —. 2001, The Astronomical Journal, 122, 1213, doi: 10.1086/322119
- Song et al. (2022) Song, Y., Linden, S. T., Evans, A. S., et al. 2022, The Astrophysical Journal. https://ui.adsabs.harvard.edu/abs/2022arXiv220904002S
- Stetson (1987) Stetson, P. B. 1987, Publications of the Astronomical Society of the Pacific, 99, 191, doi: 10.1086/131977
- Stierwalt et al. (2013) Stierwalt, S., Armus, L., Surace, J. A., et al. 2013, The Astrophysical Journal Supplement Series, 206, 1, doi: 10.1088/0067-0049/206/1/1
- Stierwalt et al. (2014) Stierwalt, S., Armus, L., Charmandaris, V., et al. 2014, The Astrophysical Journal, 790, 124, doi: 10.1088/0004-637X/790/2/124
- STScI Development Team (2018) STScI Development Team. 2018, Astrophysics Source Code Library, ascl:1811.001. https://ui.adsabs.harvard.edu/abs/2018ascl.soft11001S
- Surace (1998) Surace, J. A. 1998, PhD thesis, University of Hawaii, Manoa, Institute for Astronomy. https://ui.adsabs.harvard.edu/abs/1998PhDT.........1S
- Surace et al. (1998) Surace, J. A., Sanders, D. B., Vacca, W. D., Veilleux, S., & Mazzarella, J. M. 1998, The Astrophysical Journal, 492, 116, doi: 10.1086/305028
- Wiggins et al. (2016) Wiggins, B. K., Migenes, V., & Smidt, J. M. 2016, The Astrophysical Journal, 816, 55, doi: 10.3847/0004-637X/816/2/55
- Wu et al. (2022) Wu, H., Wu, Z., Sotnikova, Y., et al. 2022, Astronomy and Astrophysics, 661, A125, doi: 10.1051/0004-6361/202142854