Simple 4-segment thermal cycling pyroelectric measurement protocol for differentiating between ferroelectric and non-ferroelectric materials
Abstract
The rare-earth chromates (RECrO3) and manganites (REMnO3) where, RE = Eu, Y, Dy, Ho, Gd are constantly under scrutiny in search of room temperature magnetoelectric multiferroics. However, the artefacts and undesirable signal in some of the measurements pose a severe challenge in confirming the ferroelectric (FE) phase, especially in reference to pyroelectric current measurement technique. In this regard, we propose a simple modified approach to pyroelectric current measurement named as 4-segment thermal cycling protocol. This protocol assists in isolating the elusive, irreversible thermally stimulated current from the currents associated with spontaneous and reversible nature of the electric polarization in FE phase. In order to explain working principle of the protocol, we have compared simulated response of two hypothetical materials; an FE material free of space charges and a paraelectric material possessing only space charges. Further, we experimentally verify these new protocols in a single crystal of prototype ferroelectric material, Glycine Phosphite. This report primarily focuses on detailed investigation of ferroelectricity using the proposed protocol in two polycrystalline materials, HoCrO3 and DyFe0.5Mn0.5O3 where, the former has been reported to be multiferroic earlier. Our elaborative and careful approach to pyroelectric studies expound on the absence of reversible spontaneous electric polarization at temperature ranges tested in both, HoCrO3 and DyFe0.5Mn0.5O3.
I Introduction
There are materials in which ferroelectric (FE) and magnetic ordering coexist are called multiferroics [1, 2, 3, 4, 5, 6]. The theoretical predictions of magnetoelctric (ME) property in orthochromates, orthoferrites and manganite perovskite materials [7, 8, 9, 10] along with magnetic origin of strong ME multiferroicity in REMnO3 (RE = Tb, Dy, Gd) systems with spiral order [11, 12] paved a way to search for new room-temperature ME multiferroics. Later, plethora of other materials belonging to REMnO3, REFeO3, RECrO3, RE2B2O6 (RE = Rare-earth cation, B = 3d-magnetic cation) and spiral systems such as hexaferrites are under constant consideration for studies over last two decades [13, 14, 15, 16, 17, 18, 4, 11, 19, 2, 3].
A key aspect of experimental research in multiferroics is about confirming the presence of FE ordering or, in other words, spontaneous electric polarization () i.e. switchable by an electric field (). For instance, the coexistence of FE and magnetic phases were experimentally realized in YMnO3 system using optical second harmonic generation [5]. On the other hand, most of the electric transport experiments utilize the fact that the variation of temperature (), magnetic field () or (in case of ME multiferroics) alters volume bound charges (i.e. ). This change in bound charges () manifests itself in measurable compensation currents (), if electrodes on two opposite faces of the sample are shorted. The P-E loop tracer method records while scanning the external to high magnitudes. Under such fields in lossy materials, currents constituting free-carriers pose serious problems in the reliable estimation of . Therefore, another approach of tracking while scanning the is widely used [11, 2, 6], popularly known as pyroelectric current () measurement. It is mainly due to the ease of performing experiments in-house without using sophisticated setups such as Synchrotron sources [20]. Notably, an absence of external during the signal-measurements helps in avoiding possible spurious contributions due to free-carrier currents. This linear -ramp method or Byer-Roundy method [21], has been widely adopted in many studies [16, 18, 22, 23, 24, 25, 26, 27, 28, 29, 30, 31] in the past. In addition, laser assisted heating techniques are also an alternative for vs. measurements. Developments such as periodic temperature change (PTC) in the optical techniques [32, 33] are also widely utilized, apart from linear -ramp methods.
In a typical measurement, in order to achieve single electric domain, the sample is first poled with in the paraelectric (PE) phase and then cooled to the FE phase, after which the poling field is removed. As a precaution, hours-long waiting is done for depolarization of induced space charges. It is significant to highlight the importance of time-scales associated with this depolarization, often overlooked in experiments. The depolarization time-scales are generally high at low and consequently, the hours-long waiting time would not release all trapped space charges (as discussed in Appendix). Besides, as depolarization time-scales drop rapidly when increases, the depolarization current generated due to induced space charge polarization () interferes with the current due to depolarization of . These unwanted thermally stimulated currents () deceive us mainly in two ways; (1) A broad peak in during warming with linear ramp rate can be misinterpreted and assigned to FE-PE transition. (2) Pre-poling with the reversed direction of , results in reversing the sign of . Therefore, the above points can be precarious criteria for confirming FE. In this line of thought, some studies have proved the absence of multiferroicity in the material, despite the estimated polarization from measurements yielded non-zero values [34, 35, 36, 37].
The original Byer-Roundy method has been modified numerous times in the past. Notably, PTC methods that employed On/Off sequence of pulsed LASER [32] and the sinusoidal modulation of temperature using LASER beam [33] are popular optical methods. Even though, the PTC techniques with reference to measurements are well established optical methods, adapting it for measurements at high-magnetic fields inside low-temperature cryostats warrants some sophistication and hence are less popular in multiferroics community. Here, in this context, the PTC techniques that employ small temperature modulation using resistive heating can offer great flexibility. For instance, earlier reports [38, 39] showed that the two depolarization current contributions in , originated from both and , can be separated by employing a single low-frequency sinusoidal -modulation over a linear ramp. However, generation of such precise single-frequency modulation essential for the experiment could be challenging in some laboratory setups. To overcome difficulties mentioned in the above techniques, we propose here a simple modified protocol which is employable with resistive heating. We call this protocol a 4-segment thermal cycling protocol. The protocol exploits the fact that the signal is proportional to thermal ramp rate and employs thermal cycling comprised of discrete thermal ramp rates (as discussed in Section II.). However, it is qualitatively different from the PTC techniques. We have employed this protocol and simulated the response (induced ) in two hypothetical (ideal) systems; 1) Ideal FE material having no space-charges, and 2) PE material possessing only induced space charges. Further, we have extensively analyzed the existing theory of in a non-FE material revealing different mechanisms responsible for observing sizeable amounts of current in measurements. The proposed thermal cycling protocol was experimentally verified and shown in a prototype of standard FE material, Glycine Phosphite single crystal (discussed in Section IV.1). Additionally, the relevance of repetitive field cycling in ME current measurements was demonstrated in the case of ME multiferroic GdMnO3. Researchers had earlier reported the existence of multiferroicity in the perovskite material HoCrO3 [24, 40]. However, our preliminary investigations did not yield evidence of FE in the range of temperatures studied. Another family of materials of interest is the B-site disordered ABO3 systems, where renewed interest of multiferroicity in the family [41, 42] prompted us to choose the DyFe0.5Mn0.5O3 compound for a property-specific investigation. This study details the comparison of experimental data of both materials, HoCrO3 and DyFe0.5Mn0.5O3, and initial results of the application of the afore-mentioned 4-segment thermal cycling protocol for differentiating the spontaneous and induced charges. Further, it can help to interpret data realistically and identify ferroelectric materials unambiguously in future studies.
II Thermal cycling of depolarization currents: Spontaneous Electric Polarization vs. Induced Polarization
In this section, we discuss the 4-segment thermal cycling protocol assisting in identifying artifacts in measurements. We consider two individual materials with ideal behaviour undergoing a typical poling process: (1) FE material consisting of pure , and (2) non-FE material comprising only . For both these cases, we compare and discuss simulated depolarization currents resulting as a response to our 4-segment thermal cycling protocol.
II.1 Depolarization of spontaneous polarization
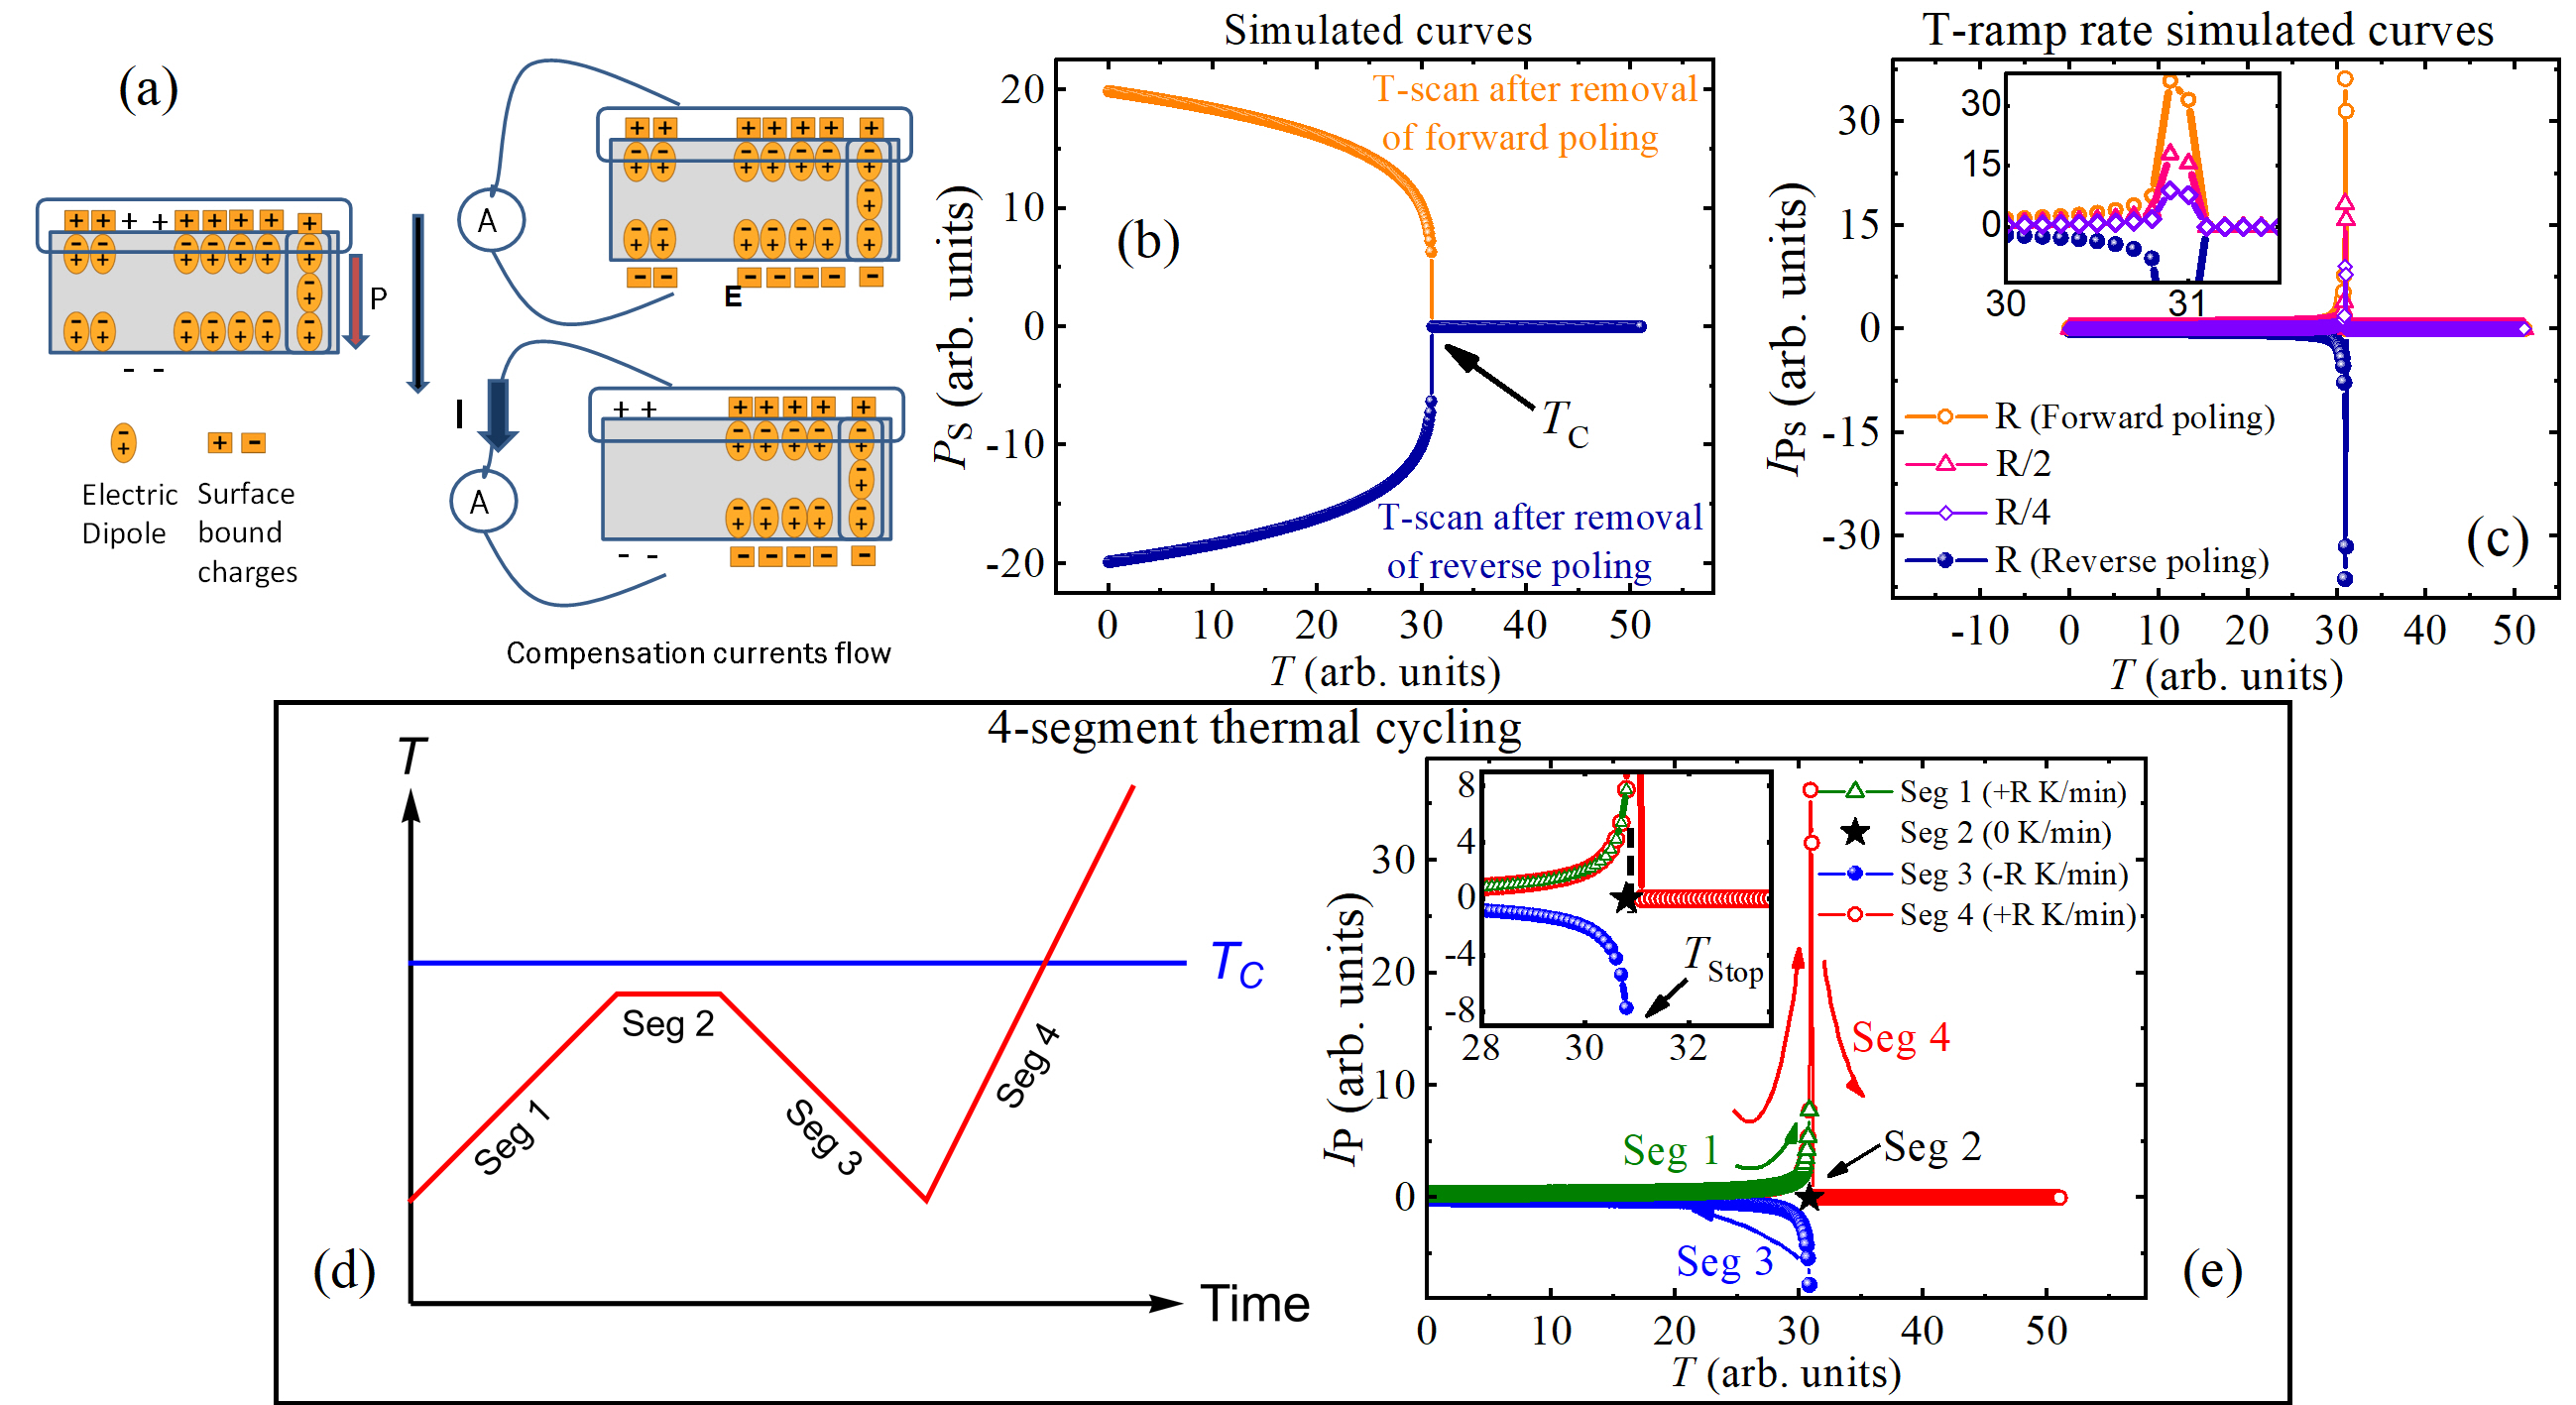
FE materials possess which is essentially switchable by . Typically, before measurements, the samples are poled much above and cooled down to well inside the FE phase to attain a single domain. Subsequently, the poling field is removed, and the sample is shorted (to discharge the ) before the experiments. Figure 1(a) shows that the generated is denoted by electric dipoles forming head-to-tail chains in the bulk of the material and localizing electrons in the electrode as surface-bound charges.
Notably, as the sample is warmed, thermal energy randomizes the dipole moments and the net decreases with (see Fig. 1(b)). Typically, the variation of with is reversible. Fig. 1(b) shows a typical variation of with across when the sample is pre-poled in forward or reverse direction.
As the sample is warmed, the polarization of the sample decreases with an accompanying decrease in dipoles per unit volume in the bulk and consequently, It releases few bound surface charges to both electrodes. If the electrodes are shorted by a conducting wire then, flows in the wire. The resulting flow is associated with the change in polarization. Thus, the induced pyroelectric (compensation) current is directly proportional to time rate of change of (see Eq. (1)) with the proportionality constant, termed pyroelectric coefficient, .
| (1) |
| (2) |
in Eq. (1) can be written as product of two partial derivatives as in Eq. (2). In this case, sign and magnitude of the induced pyroelectric current at a particular is determined by sign and magnitude of both and at that . Forward and reverse poling of the sample result in opposite signs of the and as a result, exhibit opposite signs in corresponding (see Fig. 1(b) and (c)). Figure 1(c) also shows that the magnitude of scales linearly with the ramp rate, . As the variation of with is reversible, values of both, and , are unique at a particular for a certain poling scenario. Therefore, the sign and magnitude of can be directly manipulated by the sign and magnitude of the thermal ramp rate, . The above relations and the knowledge that variation of with temperature is reversible help us formulate a 4-segment thermal cycling protocol;
Segment 1: , warming from an initial temperature () to the stopping temperature () where, .
Segment 2: , halting at the temperature for a certain time interval, .
Segment 3: , cooling from to .
Segment 4: , warming again from to the end temperature () where .
It is evident that in the Segment 1 and the Segment 3 will yield mirror-like symmetric inverted currents (see Fig. 1(d)). Segment 2 gives zero denoted by a black star symbol in Fig. 1(d). While, the Segment 4, over the temperature range, to , yields an identical as that of the Segment 1. Further, warming results in a peak at a higher before dropping to zero at (see Fig. 1(d)).
Above 4-segment thermal cycling protocol not only exploits spontaneous and switchable nature of the polarization in FE material but also, carefully tests for essential reversibility of . Further, there is a prospect of identifying the reversible component of spontaneous polarization (ferroelectricity) and corresponding pyroelectric current, from the non-reversible slow-decaying induced polarization and related , respectively, which is given in the following subsection.
II.2 Depolarization of induced polarization
In this section, we consider material that possesses only caused by the typical poling protocols. The theory of the resultant due to (which is different from the ) is dealt in detail in Appendix. Interestingly, as a function of can exhibit broad peak features. Hence, it is essential to distinguish the contributions from these non-pyroelectric origins such as from in experimental scenario.
When a non-FE material is poled with an electric field () at a temperature (), develops in the bulk of the material depending on the time interval of applied . Considering dipolar relaxation phenomena, the depolarization of is dependent on both time (), and in turn, the temperature ramp rate () (Refer in Appendix- Eq. (8), Eq. (9) and Fig. 6). Thus, it is evident that the functional behavior of the is naturally different from that of . When the poled sample cools to , the time constant associated with the depolarization of at assumes large values depending on the activation energy () of the mechanism. Waiting at for few hours after removing ensures that the non-pyroelectric current reduces to a low value at that , near to the detection limit of experimental measurements. Nonetheless, a cautious approach is advised when temperature is increased from to higher while recording this current. The time constant related to depolarizing of decreases exponentially, releasing more trapped charges while constituting a very broad peak of at higher temperatures (Refer to Fig. 6(b) in Appendix). These values of (or ) are simulated using Eq. (11) of Appendix.
It is noteworthy here that, the position of the broad peak of (as in Fig. 6(b)) shifts to higher as is increased, unlike the fixed peak-position of in case of a FE material (as in Fig. 1(c)). Hence, this comparison could be used as one of the criteria to assign the nature of the peak to the pyroelectric/non-pyroelectric contribution. However, the reversibility of the due to is also another essential factor for distinguishing the from . Thus, the 4-segment thermal cycling protocol (as mentioned in Section II A) can be utilized in this context of to verify the nature of a slow decay and irreversibility of .
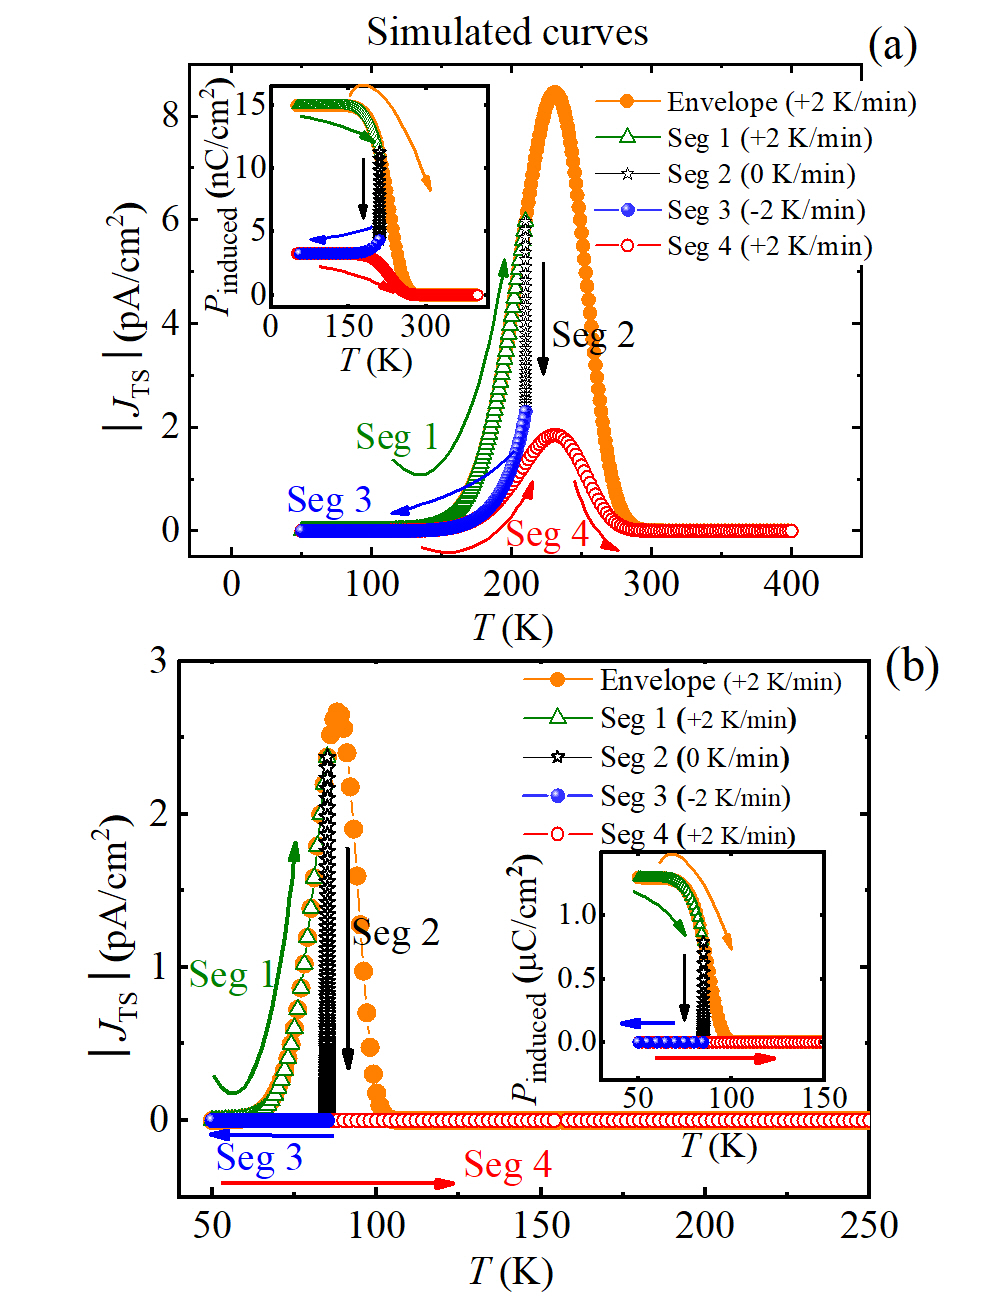
Further, we extend the simulations of to generate the 4-segment thermal cycling protocol curves with a poling process carried at = 400 K and the data are shown in Fig. 2. The inset of the Fig. 2 is vs. estimated from Eq. (9) of Appendix. For simplicity, we consider two possible scenarios of , defined by two pairs of and time constant () to generate depolarization of or , to mimick (1) a slower mechanism with = 0.176 eV and = 88 ms (Fig. 2(a)) and, (2) a relatively faster mechanism with = 0.189 eV and = 4 ns (Fig. 2(b)). The values chosen for and are relevant from the experimental context and discussed separately in Section IV.2. The values chosen (common for both mechanisms) for the 4-segment thermal cycling protocol are as follows: = 50 K, = 400 K, and = 2 K/min. Whereas, = 210 K (85 K) and = 30 min (60 min) is considered for slower (faster) mechanism, in Fig. 2(a) (Fig. 2(b)).
The envelope curves in Fig. 2 are the data from to without any halting at intermediate temperature. At first, we will consider the slower mechanism (Fig. 2(a)). At the end of Segment 2 (at ), there is still some non-zero left in the system (see inset of Fig. 2(a)), leaving behind some amount of at . Further, when in Segment 3, the continues to drop to even lower values. A non-zero value of is noticed at the beginning of Segment 4, which is smaller than the value available at the beginning of Segment 1 at (see inset of Fig. 2(a)). Thus, a smaller magnitude of peak in results while warming from to . However, the faster mechanism, has a different nature of due to a distinct choice of and (See Fig. 2(b)). Here, unlike the Segment 2 of the slower mechanism, the drops to zero while halting at , resulting in a complete depolarization of at the end of Segment 2 itself, as seen in the inset of Fig. 2(b). Consequently, the value of in Segment 3 and Segment 4 continues to be at zero. Ergo, the analysis and the comparison of two scenarios of dipolar relaxation with a distinct choice of and adapted in 4-segment thermal cycling protocol represents the depolarization of in two distinct cases. However, there are other mechanisms of generation that have not been under consideration here such as, injected charges in the vicinity of the electrode/material interface due to poling. But, the overall behavior of the response is the same as that in our study.
The most salient feature here is the comparison of simulated results of depolarization of and in the context of 4-segment thermal cycling protocol. The absence of mirror-like symmetry of Segment 1 and Segment 3 together with the reduced polarization values of Segment 4 (compared with Segment 1) explicitly relate to the slow decay and the irreversibility of . Our protocol, thus, rules out the contribution of any such irreversible contribution that may arise from release of or trapped charges at the vicinity of electrodes or due to thermally induced dipole relaxation mechanism. Other protocols of differentiating the from pose their own experimental challenges. For instance, the method of sinusoidal temperature modulation requires creation of an undistorted pure sine wave, which is challenging. In contrast, 4-segment thermal cycling protocol is expedient due to the ease of setting up a constant temperature ramp rate. In particular, we employ the 4-segment thermal cycling protocol successfully to test the behavior of and experimentally on standard prototype FE and multiferroic material along with other materials of interest, such as, HoCrO3 and DyFe0.5Mn0.5O3.
However, a cautious approach is advised while performing the 4-segment thermal cycling protocol: (1) Notably, the reversibility of the net (measured) requires a single-domain configuration. Hence, pre-poling of the sample is a prerequisite. (2) As the signal , reasonable thermal ramp-rates can help to maximize the signal () compared to the background noise. Nevertheless, smaller rates of cooling/heating are favorable to ensure temperature-uniformity across the samples. (3) It is advisable to avoid crossing of any phase-transition other than the ferroelectric phase transition at while performing the 4-segment thermal cycling protocol. For instance, a first-order transition can pose difficulties in maintaining the constant ramp-rate due to the latent heat associated with the transition.
III Sample details and experimental set-up
Glycine Phosphite (GPI) single crystal was grown using solution growth technique and a b-plate was used for pyroelectric studies. Similarly, a single crystal of ME multiferroic GdMnO3 was grown in-house with optical float-zone method [43]. Additionally, polycrystalline systems, HoCrO3 and DyFe0.5Mn0.5O3 were synthesized using spark plasma sintering technique (at 800∘C) [37] and conventional solid-state sintering (at 1150∘C), respectively. The measurements were performed on different pellets of these systems. Typically, silver paint electrodes were used on either side of the pellet to mimic the parallel plate capacitor geometry. In PE phase, a poling electric field was applied with the help of Keithley 2636 SMU (It is known that the poling procedure on polycrystalline materials can result in the net spontaneous polarization [44]). The low temperature measurements were carried at certain ramp rates in Advanced Research Systems, Inc. Closed Cycle Cryostat. The current were recorded using Keithley Electrometer 6514A.
IV Results and Discussion
IV.1 Ferroelectric Glycine Phosphite and Magnetoelectric Multiferroic GdMnO3
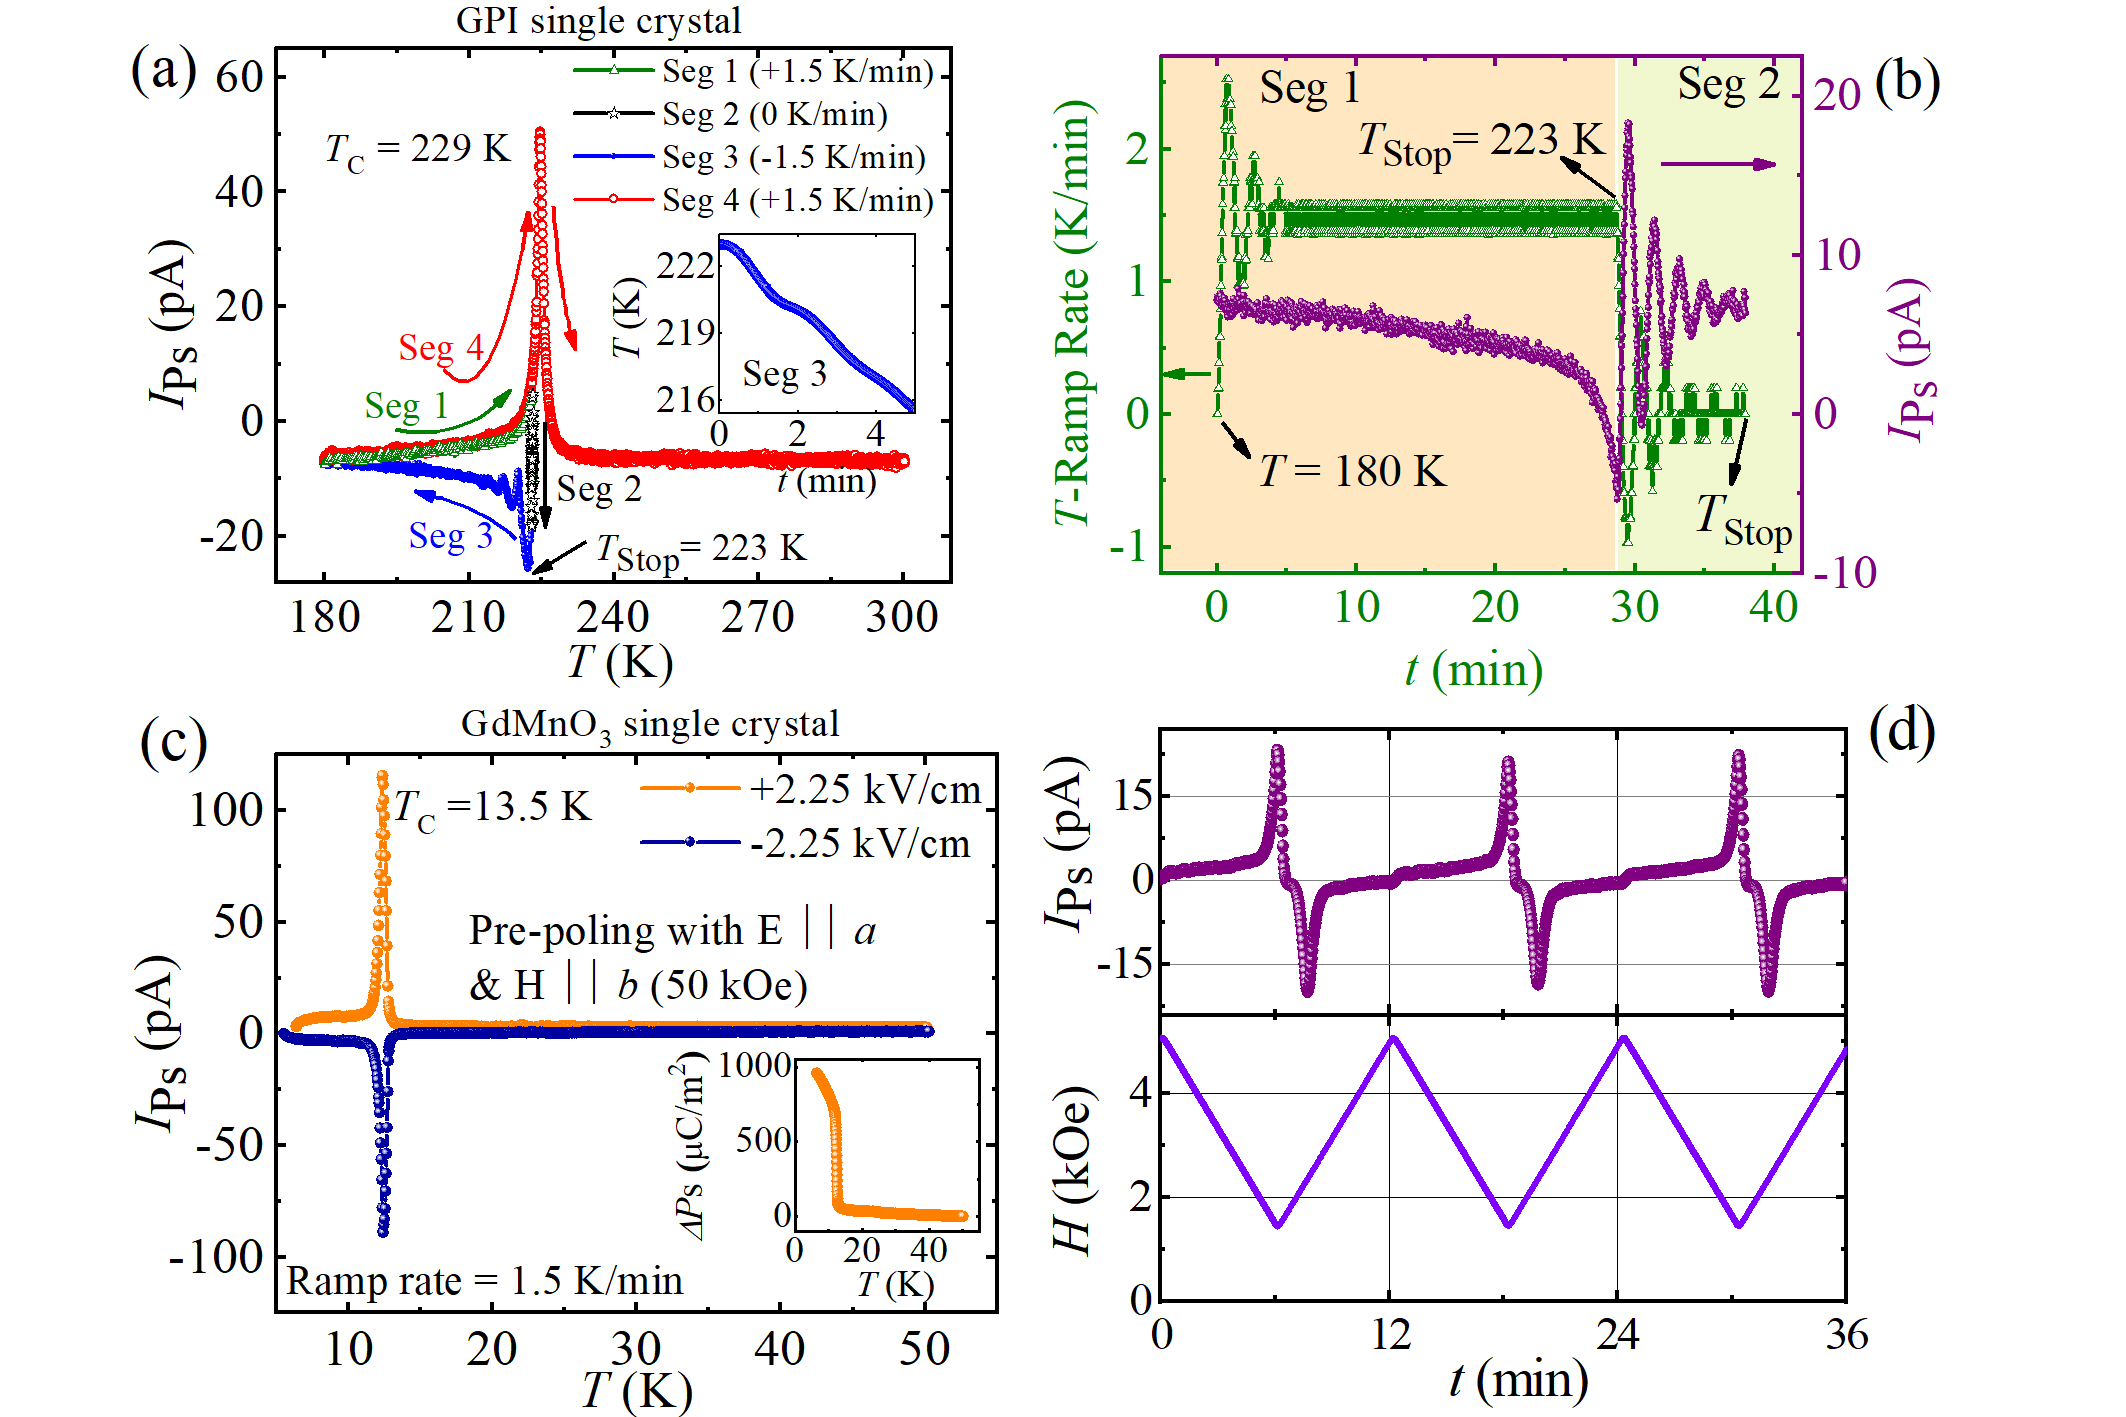
We start discussion with polarization in single crystals of two prototype materials; a FE material, GPI, and a ME multiferroic material, GdMnO3. GPI possesses monoclinic crystal structure. An anisotropy in the direction of b-axis in GPI aligns along the same axis. FE ordering sets in at about = 233 K, and a sharp peak appears in the dielectric constant data in the b-plate (not shown). The b-plate was poled with = 3.2 kV/cm at = 300 K and cooled down to = 180 K. We employed the 4-segment thermal cycling protocol, as described in Section II.1, with = 1.5 K, = 223 K, = 30 min and = 300 K, and measured in all four segments as shown in Fig. 3(a).
In segment 1, starts increasing rapidly as temperature approaches . Fig. 3(b) illustrates the time variation of and in segment 1 and Segment 2. At the beginning of Segment 1, is 0 K/min. After oscillating for a while, the value of stabilizes at the set value of 1.5 K/min. The choice of temperature controlling PID values resulted in this decaying oscillations around the set value of . Similar decaying oscillations are observed when the value of is set to zero at the beginning of the Segment 2. As (see Eq. (2)), the sign and the magnitude of depend on those of . Hence, we expect must oscillate with . At the start of the Segment 1, oscillates, but the signal is feeble and almost concealed by the background noise in the measurement. This is mainly due to the small values of near . On the other hand, we see the decaying oscillations clearly in at the start of Segment 2, which are in phase with as expected. As soon as truly decays to zero in Segment 2, falls to zero and, further, remains constant for the remaining duration of . A curve marked ‘Seg 2’ represents the entire Segment 2 in Fig. 3(a).
In Segment 3, only the sign of reversed while the magnitude remained unchanged during the cooling cycle with . As a consequence, a mirror-like symmetric curve is obtained as compared to Segment 1. Here again, a few decaying oscillations of are observed at the start of the Segment 3, before the magnitude of stabilizes (see inset in Fig. 3(a)). In poled single-domain samples, the characteristic mirror-like symmetric relation between the Segment 1 and the Segment 3 results from the reversible nature of net with . During the warming cycle, the values in Segment 4 coincide with those in Segment 1 before reaching . Later, it increases and shows a sharp peak before dropping to zero at . Reverse poling of the -plate results in the sign reversal (not shown). The measurements performed in GPI single crystal by following the 4-segment thermal cycling protocol (see Fig. 3(a)) are consistent with simulated data of FE material (see Fig. 1(d)).
Thus, using the 4-segment thermal cycling protocol, the two important features of FE namely, highly responsive nature of to changes in the sign and the magnitude of , and the reversible nature of the net with are confirmed.
In ME multifferroics, can be manipulated with and the corresponding ME currents can be distinguished from depolarizing currents originating from using magnetic-field-cycling similar to the 4-segment thermal cycling protocol. We discuss here a case of ME multiferroic GdMnO3, possessing orthorhombic crystal structure. It exhibits paramagnetic to incommensurate collinear antiferromagnetic (AFM) phase transition at 42 K and subsequent canted AFM phase transition near 23 K. On the application of (above 10 kOe) along the b-axis, the canted AFM phase transforms to cycloidal magnetic phase which is FE in nature.
We poled the GdMnO3 single crystal with = 2.25 kV/cm along the a-axis at = 60 K in presence of of 50 kOe along the b-axis. After cooling the sample to = 5 K, the electric field alone was removed. For both the cases of forward and reverse poling, the values were recorded under 50 kOe and = 1.5 K/min during the warming cycle as shown in the data plots in Fig. 3(c). A sharp peak of is visible at 13.5 K; its value falls to zero at about = 15 K at 50 kOe. for forward poling was estimated by integrating with time and shown in an inset of the Fig. 3(c). To analyze the response of and to changes in at 8 K, we cycled the field from 50 kOe to 1.5 kOe at a ramp rate of Oe/s (see Fig. 3(d)). It is evident that the curve inverts to a mirror-like symmetric curve with the reversal of the ramp rate. This indicates reversibility of the with . As the ramp rate reverses through zero, it dwells there for finite time during which the value becomes zero momentarily. In the ME multiferroic under investigation, the time scales involved in the change in with are small when compared with experimental time scale, under which practical assumption of holds good.
IV.2 Simple Perovskite HoCrO3 and B-site Disordered Perovskite DyFe0.5Mn0.5O3
We shall now focus to systems such as HoCrO3 (HCO), a material belonging to simple perovskite family of rare-earth chromates and DyFe0.5Mn0.5O3 (DFMO), member of B-site disordered perovskite family. Both the family of materials are constantly under scrutiny for FE and multiferroicity. In this regard, our study represents the charaterization of measurements on members of such families, HCO and DFMO using our 4-segment thermal cycling protocol as follows.
At first, we investigate the behavior of HCO wherein, the FE order was reported earlier [24], based on the standard measurement protocols using forward and reverse poling. FE order is perceived to set in at a higher temperature of 240 K which is different than the magnetic ordering temperature. We investigate the nature of the FE order (if present) in HCO using using our thermal cycling protocol.
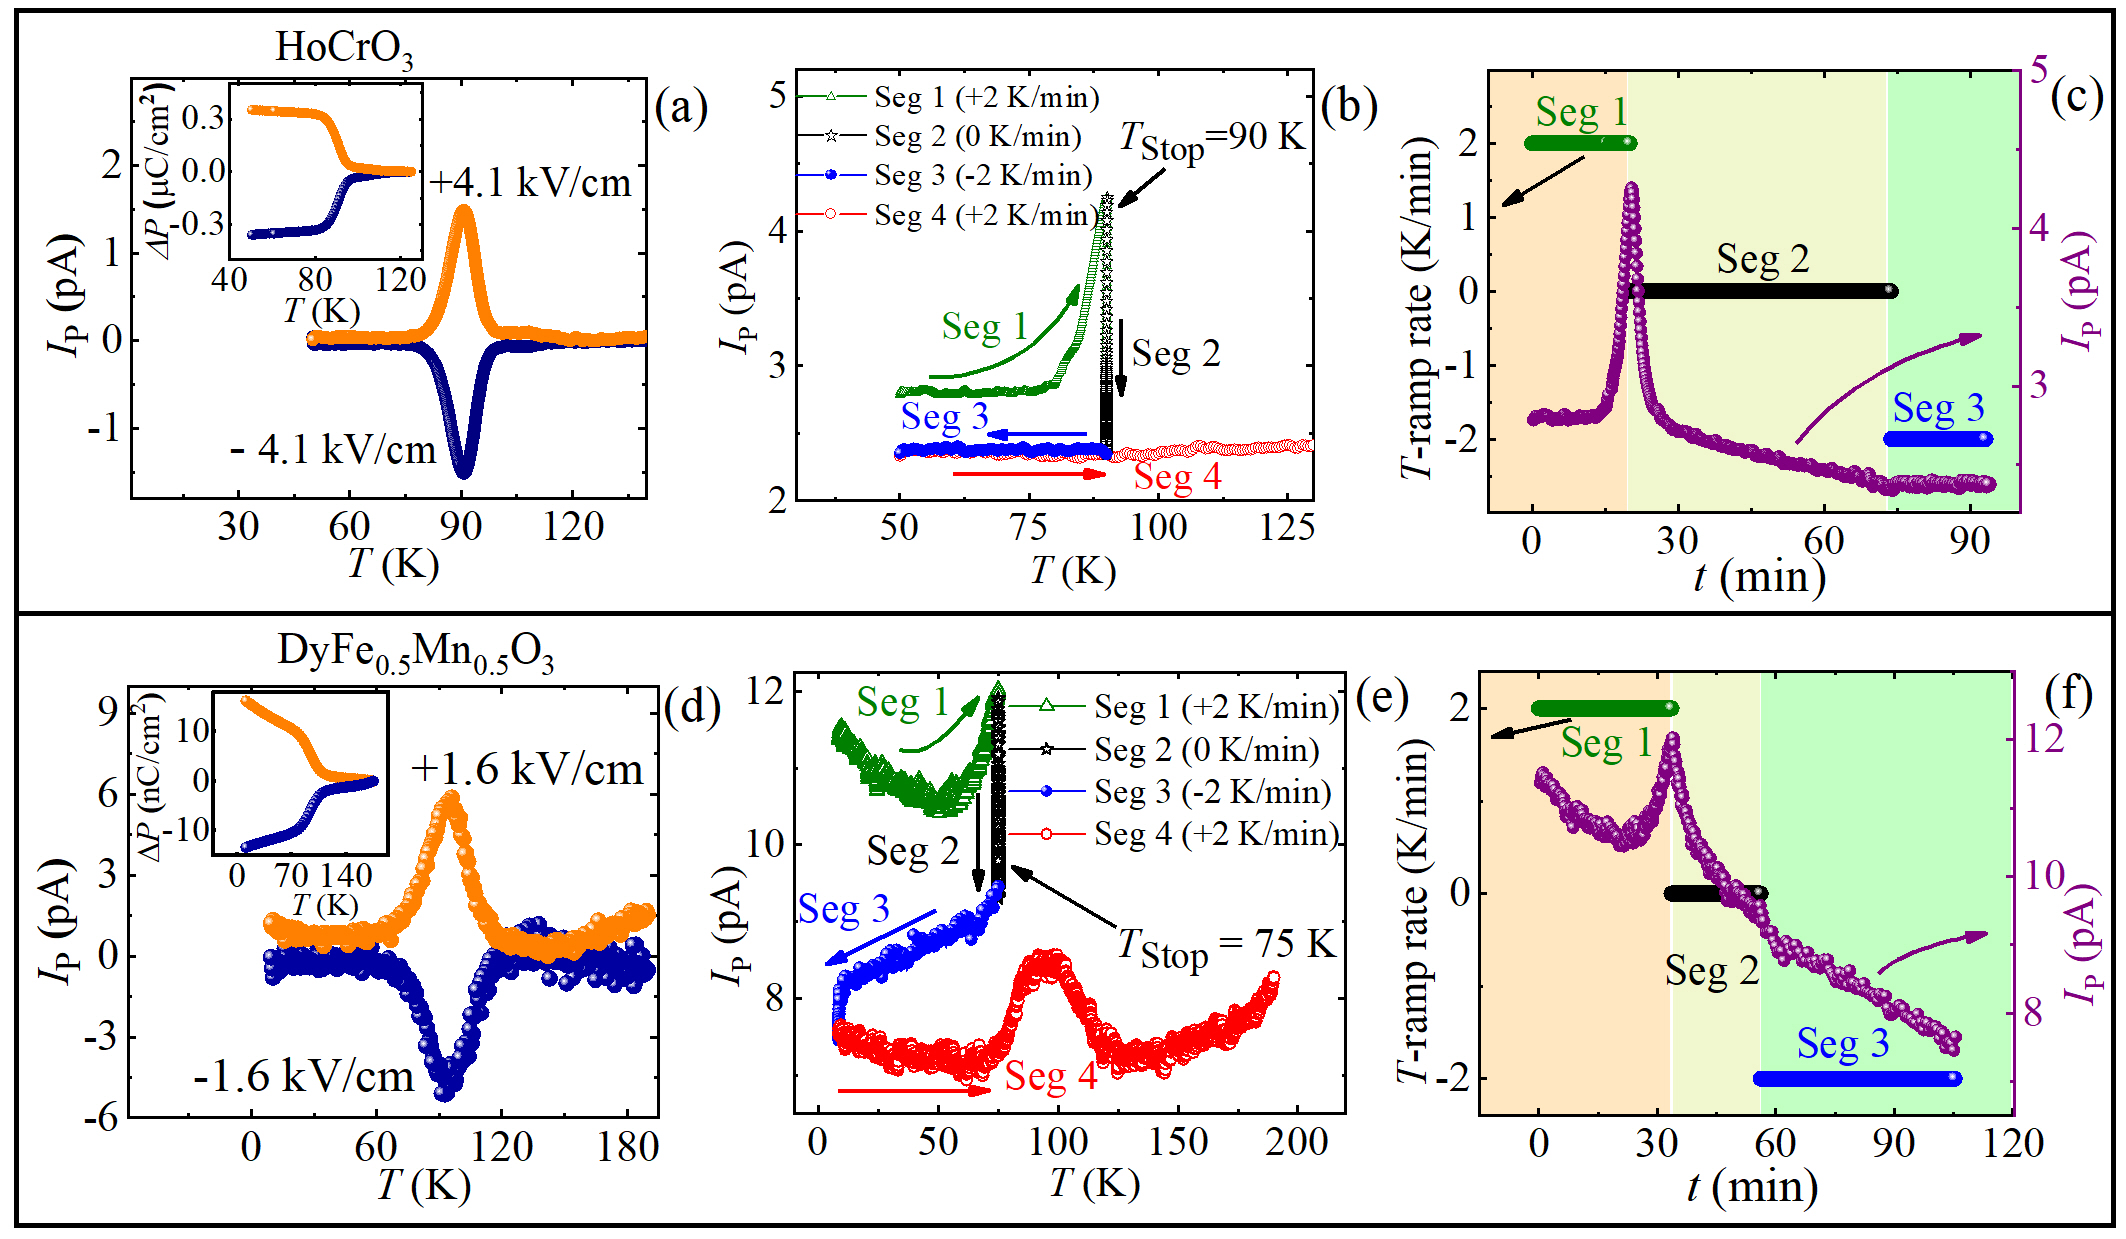
HCO is orthorhombic at room temperature and exhibits antiferromagnetic insulating behavior with Néel temperature, = 140 K [37]. We performed measurement on an HCO polycrystalline pellet of 8 mm diameter and 0.35 mm thickness. Poling was performed with of kV/cm at of 300 K and the sample was later cooled down to = 50 K. Standard measurements were initially carried out while warming the HCO pellet with forward and reverse poling protocols from to a of 300 K. Figure 4(a) shows the in the range of 50 K to 125 K (data for 125 K will be discussed later in this Section). The inset of Fig. 4(a) exhibits the plot of as a function of estimated by integrating the values in the above range of 50 K to 125 K over the time scale of the measurement. A relatively sharp peak in is observed at 91 K, and as expected, the switches its sign for the reverse poling scenario. This peak is highly reproducible and tested for different (not shown). Estimate of from in the range of 50 K to 125 K gives non-zero values of for 125 K. It may be noted that this temperature is different from the of HCO.
Further, to validate the estimated corresponding to the peak at 91 K, and to rule out extraneous effects related to non-pyroelectric current, we used the 4-segment thermal cycling protocol with = 2 K/min, = 90 K, = 60 min and = 300 K. The data are plotted in Fig. 4(b). The corresponding plots of and as a function of time elapsed for different segments of the protocol are shown in Fig. 4(c). At Segment 1, the curve starts rising for a chosen value of , in the vicinity of 91 K peak. However, the system is halted at 91 K in Segment 2 with set to 0 K/min. At this point, falls exponentially in Segment 2 as in Fig. 4(c)) for elapsed . It is interesting to note that value does not reach zero instantly in Segment 2 when is set to zero, in contrast to the highly responsive behavior of in the case of GPI and GdMnO3. In the case of HCO, decreases to the background limit only at the end of Segment 2 (shown in Fig. 4(c)) exhibiting much slower response to the change in when compared to GPI and GdMnO3.
In Segment 3 with , continues to remain in the background as seen from Fig. 4(b) and (c). The absence of mirror-symmetry between Segment 1 and Segment 3 demonstrates the irreversible nature of in HCO (unlike that of in GPI). In continuing with thermal cycling at the beginning of Segment 4, the value of is found to be different from that of Segment 1. Hence, the estimated differed values of from these values provide evidence for excluding in HCO. Even, the peak at 91 K has disappeared due to the fully depolarized in Segment 4. Hence, our experiments indicate the absence of in HCO.
It is worthwhile to mention the resemblance of the 4-segment thermal cycling protocol in HCO to the faster mechanism of dipolar relaxation phenomenon (Section II.2 (Fig. 2(b))) in reference to and . The nature of depolarization of in HCO around the 91 K peak in can be correlated very well to the mechanism. This indicates the presence of alone and thus, the absence of in the range of 50 K to 125 K in HCO.
A comment can be made here on the observed sharp peak at 91 K in HCO material by drawing the results of our earlier Synchrotron X-ray diffraction study on HCO [37], which revealed a structural distortion at 100 K. In our earlier study [37], we hypothesized that faster depolarization of in the vicinity of a structural distortion suddenly releases space charges which give rise to the peak in data. However, elaborate experimental evidence is needed to clarify the role of structural distortion in . Further, to understand the origin of this peak, we have quantitatively analysed the measured over a wide range of temperatures up to 300 K (see Fig. 5). This is explained in detail in the latter part of this section.
The B-site disordered orthochomites have been previously the subject of extensive studies for its FE ordering [41, 42]. As a corollary, the less explored DFMO is a good prospect due to its antiferromagnetic insulating characteristics and 320 K [45]. In this context, a detailed study of measurements using the 4-segment thermal cycling protocol on DFMO is in order for which an measurement protocol used for HCO was adapted. Polycrystalline pellet of 8 mm diameter and 1 mm thickness was used for the purpose. The results obtained thereof are given in Fig. 4(d) to (f). DFMO exhibits increase in resistivity as temperature is lowered. Hence, we chose = 190 K where, the resistivity of the sample is reasonably large for applying = kV/cm. Standard measurements were carried out while warming the sample from (= 8 K) to (= 200 K) with = 2 K/min (See Fig. 4(d)). We observed a broad peak near 95 K in both the forward and reverse poling scenario. In order to investigate the nature of the broad peak at 95 K, we performed the 4-segment thermal cycling protocol on DFMO by choosing the to be at 88 K with a of 30 min (Refer Fig. 4(e) and (f)). Notably, during in Segment 2 the recorded current did not instantly drop to zero but remained finite and exhibited a gradual decay. This depolarization process is seen to be incomplete at the end of Segment 2 and the current continues to fall further to lower values in Segment 3 as well (Refer Fig. 4(e) and (f)). This fall of continues further at the beginning of Segment 4. Here, a peak with smaller intensity reappeared in a new position at 88 K. Notable observations in DFMO experiments (including a few similarities with that of HCO) include; (1) the absence of mirror symmetry between Segment 1 and Segment 3 (2) slower response of to the changes in (3) dissimilar values at the beginning of Segment 1 and Segment 4 (4) shifted peak position of in Segment 4. From all the above points, we can conclude that the 95 K peak in DFMO is not synonymous with FE nature since those highly responsive and reversible attributes of are lacking.
Citing the similarities in the data of DFMO and the mechanisms discussed in Section II.2, the resemblance with a slow depolarization mechanism of (Fig. 2(a)) yields more credence to the mechanisms in place for DFMO. In addition, the dependency of on peak position was also tested in case of DFMO with = 3 K/min (not shown). The peak shifts to 105 K for = 3 K/min, a result that validates the simulation data presented in Fig. 6(b) of Appendix. It provides conclusive evidence that the origin of the peak in DFMO is traceable to and not to FE ordering.
As mentioned earlier, Fig. 5 shows the curve measured for HCO up to = 300 K for the forward poling scenario. It is discernible that above 125 K, again increases and shows a very broad feature peaking just below 300 K. We tried fitting sharp as well as broad features along with a few observed shoulder-features with five independent peaks. The fitting parameters such as the peak temperature in (), the initial value of at the beginning of the warming (), the activation energy () and the time constant () are listed in the Table 1. The total fit, a combined effect of all the five peaks, is denoted by a red curve and matches well with the experimental data. The sharp peak near 91 K is accounted by the Fit 1 (see Fig. 5) having a relatively high meV and a low ns and in turn, it describes the faster depolarization observed in the narrow temperature window. Whereas, the values, corresponding to other fits ( Fit 2 to 5) with higher , are relatively high and falls in the range, 10 to 700 ms. Also, magnitudes of are found to increase systematically with in Fits, 2 to 5. Our analysis confirms that the observed peaks in in HCO are a manifestation of due to depolarization of during warming. However, the physical reasons for the observation of different peaks of various is not covered in this study.
In essence, it is readily perceptible that the standard measurement protocols using forward and reverse poling alone are not sufficient to comment on the presence of in a material under scrutiny (HCO and DFMO, in our case). The switching of the sign of with the reverse poling scenario can hold good for both and . Hence, a careful approach is recommended while performing the measurements in samples comprising either alone or, those with both and coexisting. In this regard, adapting the 4-segment thermal cycling protocol in measurement will readily assist in distinguishing the from , and thus avoid inconspicuous and erroneous conclusions of FE ordering and multiferroicity.
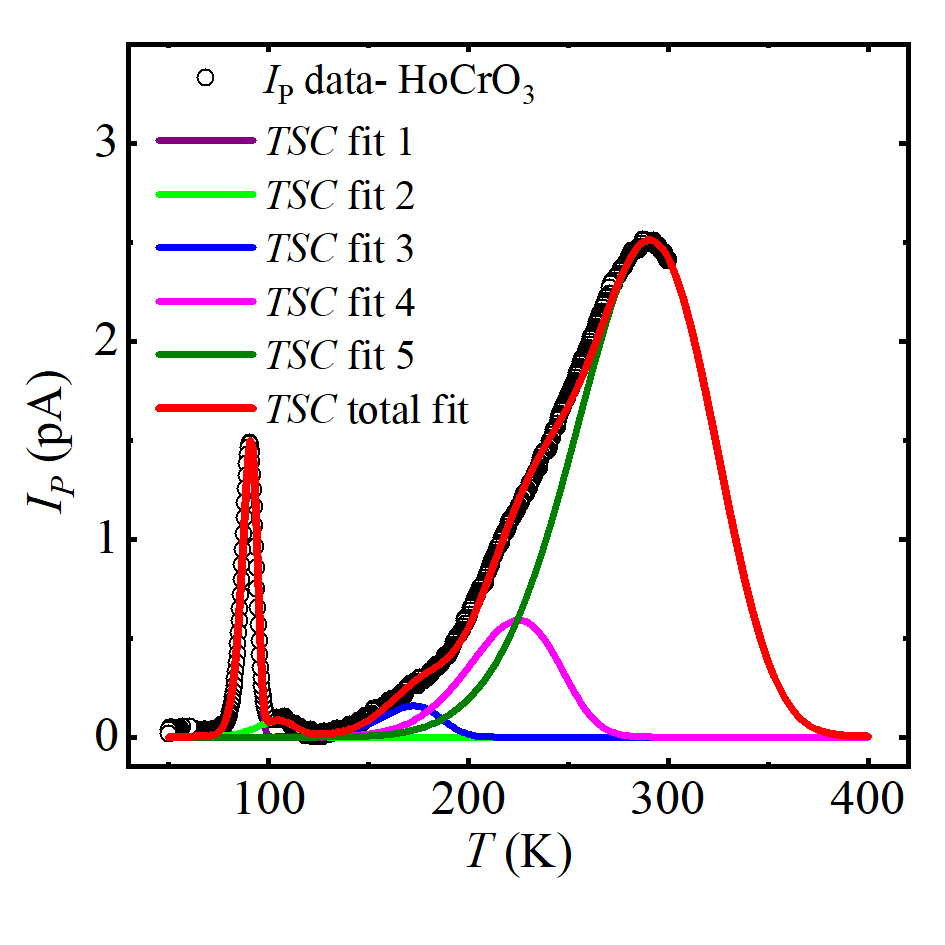
| Peak111De-convoluted peaks. | (K)222Temperature at which exhibits a peak value. | (C)333 in the sample at temperature before starting the thermal ramp run. | (meV)444Activation energy associated with the mechanism of . | (s)555Time constant associated with the mechanism of as . |
| Fit 1 | 91 | 189.0(8) | ||
| Fit 2 | 105 | 90(5) | ||
| Fit 3 | 173 | 154(3) | ||
| Fit 4 | 225 | 173(2) | ||
| Fit 5 | 291 | 184(2) |
V Conclusion
In summary, we have proposed a simple modified protocol for pyroelectric current measurements termed as, 4-segment thermal cycling protocol. A clear and distinct behavior of irreversible induced polarization () can accurately be discerned from that of a reversible and spontaneous electric polarization (), with the help of above mentioned protocol. Thus, our systematic approach primarily helps to avoid the possibilities in misinterpretation of the ferroelectric (FE) phase in a given material. At first, we simulated current response of an FE material consisting of pure , and a non-FE material comprising only to the above protocol. Further, these thermal cycling protocols are experimentally demonstrated on a single crystal of a prototype FE system, Glycine Phosphite. Besides, some equivalence between our thermal cycling protocol and the typical magnetic field cycling method used for characterization of magnetoelectric (ME) multiferroics was discussed with measurements on ME GdMnO3 single crystal. Later, we have employed these protocols to investigate two polycrystalline materials, HoCrO3 and DyFe0.5Mn0.5O3 where HoCrO3 has been reported to be multiferroic elsewhere. Our studies highlight dominant contribution of thermally stimulated currents () in pyroelectric measurements in both the materials. Quantitative analysis in HoCrO3 system based on an existing theory of , allowed us to estimate various activation energies and time constants associated with different depolarization mechanisms. In conclusion, our 4-segment-thermal cycling protocol establishes that HoCrO3 and DyFe0.5Mn0.5O3 do not possess any reversible and spontaneous ferroelectric polarization and thus are not multiferroic in nature within the temperature range tested.
ACKNOWLEDGEMENTS
S.G.B. acknowledges DST INSPIRE Faculty Fellowship for the financial assistance. P.S.A.K. thanks Nano Mission, Department of Science and Technology, India.
A.A.W. and S.G.B. contributed equally to this work.
*
Appendix A Theory of Thermally Stimulated Currents
This section describes depolarization mechanism of induced polarization responsible for thermally stimulated currents () when materials are warmed (or cooled) at constant ramp rates. In this section, we consider dipolar relaxation phenomena [38, 46] and assume that the polarization () can be induced in the material at constant temperature by applying an electric field (). Subsequent removal of results in depolarization and the time rate of depolarization can be described by the following differential equation wherein is an associated time constant.
| (3) |
Solving Eq. (3) for gives,
| (4a) | |||
| where, is an initial value of polarization. | |||
| (4b) | |||
Depolarization current is evaluated in Eq. (4b) by differentiating Eq. (4a) with respect to time. An exponential decrease in both, and the depolarization current density (), with time are plotted in Fig. 6(a) for = 1891 s. The depends on temperature and increases at lower temperature as,
| (5) |
where, is an activation energy related to depolarization mechanism, is the Boltzmann constant and is a magnitude of the as . A generic behaviour of with temperature, as governed by Eq. (5), is shown in Fig. 6(b) for values of and to be 0.1 s and 0.1782 eV, respectively. Notably, attains very high values ( s) at lower temperature. Substituting Eq. (5) in Eq. (3) and solving it for gives the time evolution of depolarization at any constant temperature ,
| (6) |
In particular, by employing a warming (or cooling) protocol with constant ramp rate () the temperature itself becomes a function of time i.e. with
| (7) |
where, is the initial temperature at . Substitution of Eq. (5) and Eq. (7) in Eq. (3) and further solving for yields Eq. (8).
| (8) |
| (9) |
| (10) |
| (11) |
where, Ei is an exponential Integral function. In order to get Eq. (9) for , the time () in Eq. (8) is replaced with . is the temperature evolution of depolarization for the thermal ramp starting from a temperature () at constant . is computed by differentiating Eq. (8) with respect to time, (see Eq. (10)). Further, the temperature evolution of depolarization current density () for the thermal ramp starting from at constant , is expressed in Eq. (11) after the replacement of with in Eq. (10).
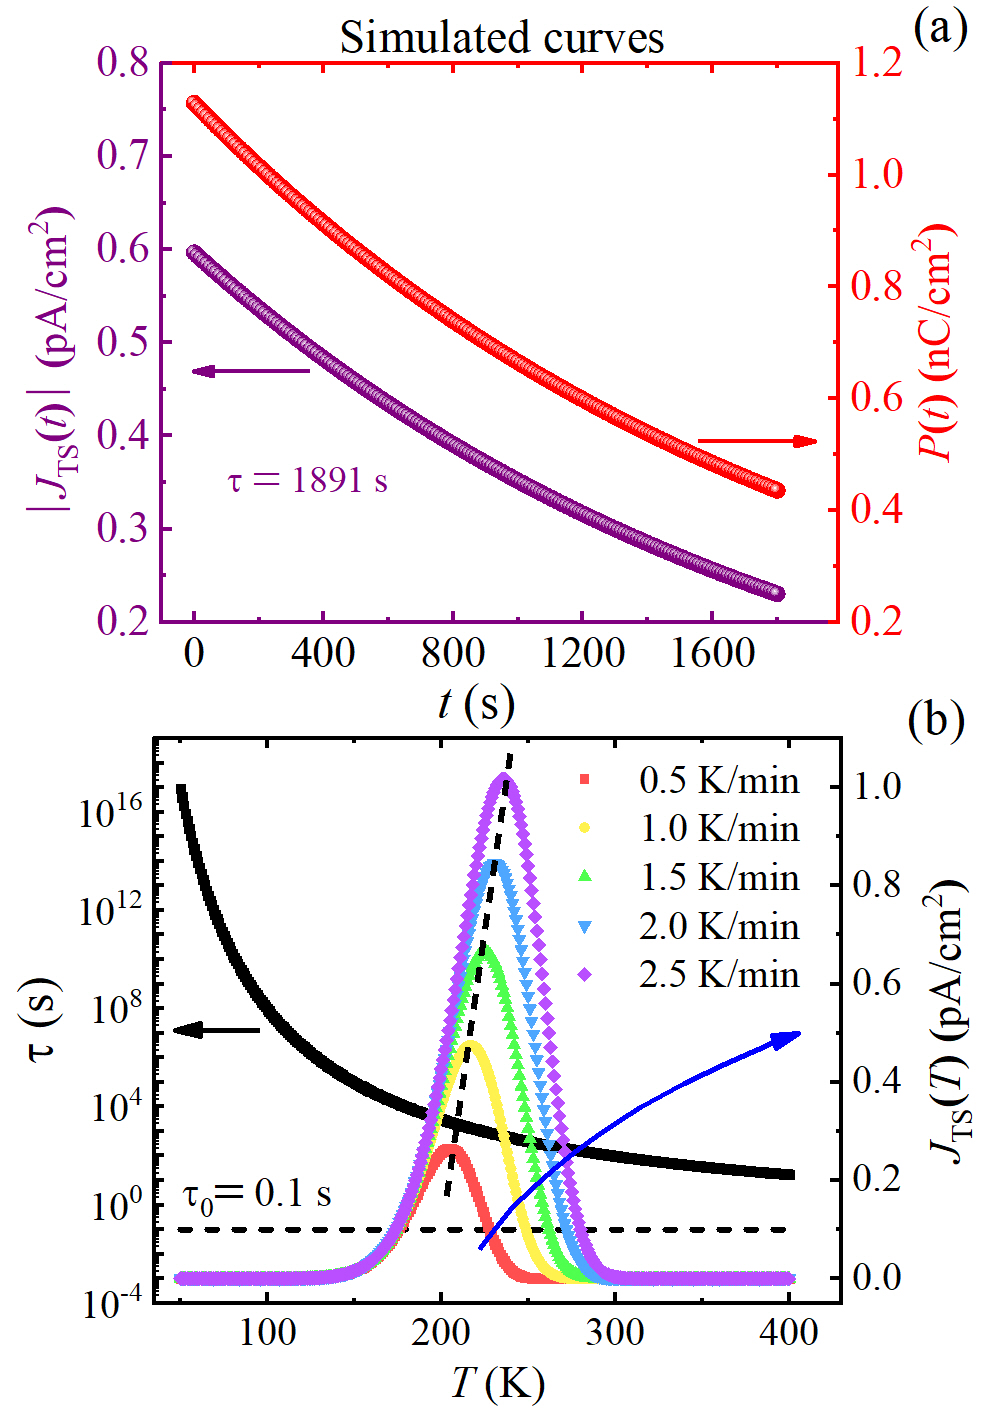
Figure 6 conveys a behaviour of thermally stimulated currents in a nutshell. Particularly, (i.e. ) curves are simulated using Eq. (11) and plotted in Fig. 6(b). Here, we consider a typical electric poling process on a sample having no ferroelectricity. Hence, the poling results only in an induced polarization. at is estimated as, where, is an electric poling field, is the poling temperature, is a dipole moment and is a dipole concentration [46]. With at = 50 K and = 0.1 s, various curves corresponding to different ramp rates ( = 0.5, 1.0, 1.5, 2.0, 2.5 K/min) are plotted for temperature range, 50 to 400 K. Notably, the peak position of shifts to higher temperature, with increase in the value of .
In summary, warming (or cooling) of a non-ferroelectric sample with constant ramp rate, succeeding a typical electric poling process, can give a broad peak in the temperature evolution of thermally stimulated current. This peak needs to be distinguished from the peak that is typically observed in pyroelectric current measurement due to depolarization of spontaneous polarization in ferroelectric material near the transition temperature. Our protocol to distinguish between the two is discussed in the Section II on page II.
References
- Tokura [2007] Y. Tokura, “Multiferroics—toward strong coupling between magnetization and polarization in a solid,” J. Magn. Magn. Mater. 310, 1145–1150 (2007).
- Tokunaga et al. [2008] Y. Tokunaga, S. Iguchi, T. Arima, and Y. Tokura, “Magnetic-field-induced ferroelectric state in \chDyFeO3,” Phys. Rev. Lett. 101, 097205 (2008).
- Tokunaga et al. [2009] Y. Tokunaga, N. Furukawa, H. Sakai, Y. Taguchi, T.-H. Arima, and Y. Tokura, “Composite domain walls in a multiferroic perovskite ferrite,” Nat. Mater. 8, 558–562 (2009).
- Kitagawa et al. [2010] Y. Kitagawa, Y. Hiraoka, T. Honda, T. Ishikura, H. Nakamura, and T. Kimura, “Low-field magnetoelectric effect at room temperature,” Nat. Mater. 9, 797–802 (2010).
- Fiebig et al. [2002] M. Fiebig, T. Lottermoser, D. Fröhlich, A. V. Goltsev, and R. V. Pisarev, “Observation of coupled magnetic and electric domains,” Nature 419, 818–820 (2002).
- Yamasaki et al. [2007] Y. Yamasaki, H. Sagayama, T. Goto, M. Matsuura, K. Hirota, T. Arima, and Y. Tokura, “Electric control of spin helicity in a magnetic ferroelectric,” Phys. Rev. Lett. 98, 147204 (2007).
- Yamaguchi and Tsushima [1973] T. Yamaguchi and K. Tsushima, “Magnetic symmetry of rare-earth orthochromites and orthoferrites,” Phys. Rev. B 8, 5187–5198 (1973).
- Zvezdin and Mukhin [2008] A. K. Zvezdin and A. A. Mukhin, “Magnetoelectric interactions and phase transitions in a new class of multiferroics with improper electric polarization,” JETP Lett. 88, 505–510 (2008).
- Fennie [2008] C. J. Fennie, “Ferroelectrically induced weak ferromagnetism by design,” Phys. Rev. Lett. 100, 167203 (2008).
- Iu\textcommabelowsan et al. [2013] D. Iu\textcommabelowsan, K. Yamauchi, P. Barone, B. Sanyal, O. Eriksson, G. Profeta, and S. Picozzi, “Effects of strain on ferroelectric polarization and magnetism in orthorhombic \chHoMnO3,” Phys. Rev. B 87, 014403 (2013).
- Kimura et al. [2003] T. Kimura, T. Goto, H. Shintani, K. Ishizaka, T. Arima, and Y. Tokura, “Magnetic control of ferroelectric polarization,” Nature 426, 55–58 (2003).
- Kimura et al. [2005] T. Kimura, G. Lawes, T. Goto, Y. Tokura, and A. P. Ramirez, “Magnetoelectric phase diagrams of orthorhombic \chRMnO3,” Phys. Rev. B 71, 224425 (2005).
- Feng et al. [2010] S. M. Feng, Y. S. Chai, J. L. Zhu, N. Manivannan, Y. S. Oh, L. J. Wang, Y. S. Yang, C. Q. Jin, and K. H. Kim, “Determination of the intrinsic ferroelectric polarization in orthorhombic \chHoMnO3,” New J. Phys. 12, 073006 (2010).
- Chai et al. [2012] Y. S. Chai, Y. S. Oh, L. J. Wang, N. Manivannan, S. M. Feng, Y. S. Yang, L. Q. Yan, C. Q. Jin, and K. H. Kim, “Intrinsic ferroelectric polarization of orthorhombic manganites with \chE-type spin order,” Phys. Rev. B 85, 184406 (2012).
- Azuma et al. [2005] M. Azuma, K. Takata, T. Saito, S. Ishiwata, Y. Shimakawa, and M. Takano, “Designed ferromagnetic, ferroelectric \chBi2NiMnO6,” J. Am. Chem. Soc. 127, 8889–8892 (2005).
- Lee et al. [2011a] N. Lee, Y. J. Choi, M. Ramazanoglu, W. Ratcliff, V. Kiryukhin, and S.-W. Cheong, “Mechanism of exchange striction of ferroelectricity in multiferroic orthorhombic \chHoMnO3 single crystals,” Phys. Rev. B 84, 020101(R) (2011a).
- Lee et al. [2011b] J.-H. Lee, Y. K. Jeong, J. H. Park, M.-A. Oak, H. M. Jang, J. Y. Son, and J. F. Scott, “Spin-canting-induced improper ferroelectricity and spontaneous magnetization reversal in \chSmFeO3,” Phys. Rev. Lett. 107, 117201 (2011b).
- Rajeswaran et al. [2012a] B. Rajeswaran, D. I. Khomskii, A. K. Zvezdin, C. N. R. Rao, and A. Sundaresan, “Field-induced polar order at the néel temperature of chromium in rare-earth orthochromites: Interplay of rare-earth and \chCr magnetism,” Phys. Rev. B 86, 214409 (2012a).
- Wang et al. [2003] J. Wang, J. B. Neaton, H. Zheng, V. Nagarajan, S. B. Ogale, B. Liu, D. Viehland, V. Vaithyanathan, D. G. Schlom, U. V. Waghmare, N. A. Spaldin, K. M. Rabe, M. Wuttig, and R. Ramesh, “Epitaxial \chBiFeO3 multiferroic thin film heterostructures,” Science 299, 1719–1722 (2003).
- Sakai et al. [2011] H. Sakai, J. Fujioka, T. Fukuda, D. Okuyama, D. Hashizume, F. Kagawa, H. Nakao, Y. Murakami, T. Arima, A. Q. R. Baron, Y. Taguchi, and Y. Tokura, “Displacement-type ferroelectricity with off-center magnetic ions in perovskite \chSrBaMnO3.” Phys. Rev. Lett. 107, 137601 (2011).
- Byer and Roundy [1972] R. L. Byer and C. B. Roundy, “Pyroelectric coefficient direct measurement technique and application to a nsec response time detector,” Ferroelectrics 19, 333–338 (1972).
- Meher et al. [2014] K. R. S. P. Meher, A. Wahl, A. Maignan, C. Martin, and O. I. Lebedev, “Observation of electric polarization reversal and magnetodielectric effect in orthochromites: A comparison between \chLuCrO3 and \chErCrO3,” Phy. Rev. B 89, 144401 (2014).
- Ghosh et al. [2014] A. Ghosh, K. Dey, M. Chakraborty, S. Majumdar, and S. Giri, “Polar octahedral rotations, cation displacement and ferroelectricity in multiferroic \chSmCrO3,” Europhys. Lett. 107, 47012 (2014).
- Ghosh et al. [2015] A. Ghosh, A. Pal, K. Dey, S. Majumdar, and S. Giri, “Atypical multiferroicity of \chHoCrO3 in bulk and film geometry,” J. Mater. Chem. C 3, 4162–4167 (2015).
- Hao et al. [2016] L. Hao, H. B. Cai, X. N. Xie, H. R. Wang, G. K. Lin, X. P. Wang, and H. Zhu, “Multiferroicity in half-\chCr-doped \chYMnO3 epitaxial films with compressive strain,” Appl. Phys. Lett. 108, 172904 (2016).
- Sharma et al. [2016] M. K. Sharma, T. Basu, K. Mukherjee, and E. V. Sampathkumaran, “Effect of rare-earth (\chEr and \chGd) substitution on the magnetic and multiferroic properties of \chDyFe0.5Cr0.5O3,” J. Phys.: Condens. Matter. 28, 426003 (2016).
- Indra et al. [2016] A. Indra, K. Dey, A. Midya, P. Mandal, O. Gutowski, U. Rütt, S. Majumdar, and S. Giri, “Magnetoelectric coupling and exchange bias effects in multiferroic \chNdCrO3,” J. Phys.: Condens. Matter. 28, 166005 (2016).
- Xie et al. [2017] X. Xie, L. Hao, H. Wang, G. Lin, and H. Zhu, “\chEu-doping effects on the structural and multiferroic properties of \chYMn0.5Cr0.5O3,” J. Appl. Phys. 121, 123904 (2017).
- Dey et al. [2019] J. K. Dey, A. Chatterjee, S. Majumdar, A. C. Dippel, O. Gutowski, M. v. Zimmermann, and S. Giri, “Ferroelectric order associated with ordered occupancy at the octahedral site of the inverse spinel structure of multiferroic \chNiFe2O4,” Phys. Rev. B 99, 144412 (2019).
- Chatterjee et al. [2019] A. Chatterjee, J. K. Dey, S. Majumdar, A.-C. Dippel, O. Gutowski, M. v. Zimmermann, and S. Giri, “Tuning of multiferroic order with \chCo doping in \chCuCr2O4 : Interplay between structure and orbital order,” Phys. Rev. Mater. 3, 104403 (2019).
- Su et al. [2015] J. Su, Z. Z. Yang, X. M. Lu, J. T. Zhang, L. Gu, C. J. Lu, Q. C. Li, J.-M. Liu, and J. S. Zhu, “Magnetism-driven ferroelectricity in double perovskite \chY2NiMnO6.” ACS Appl. Mater. Interfac. 7, 13260–13265 (2015).
- Chynoweth [1956] A. Chynoweth, “Dynamic method for measuring the pyroelectric effect with special reference to barium titanate,” Journal of applied physics 27, 78–84 (1956).
- Holeman [1972] B. Holeman, “Sinusoidally modulated heat flow and the pyroelectric effect,” Infrared Physics 12, 125–135 (1972).
- Nhalil et al. [2015] H. Nhalil, H. S. Nair, C. M. N. Kumar, A. M. Strydom, and S. Elizabeth, “Ferromagnetism and the effect of free charge carriers on electric polarization in the double perovskite \chY2NiMnO6,” Phys. Rev. B 92, 214426 (2015).
- Blasco et al. [2017] J. Blasco, J. L. García-Muñoz, J. García, G. Subías, J. Stankiewicz, J. A. Rodríguez-Velamazán, and C. Ritter, “Magnetic order and magnetoelectric properties of \chR2CoMnO6 perovskites (\chR = \chHo, \chTm, \chYb, and \chLu),” Phys. Rev. B 96, 024409 (2017).
- Yang et al. [2020] J. Y. Yang, X. D. Shen, V. Pomjakushin, L. Keller, E. Pomjakushina, Y. W. Long, and M. Kenzelmann, “Characterization of magnetic symmetry and electric polarization of \chYCr0.5Fe0.5O3,” Phys. Rev. B 101, 014415 (2020).
- Anusree et al. [2020] V. K. Anusree, P. Neenu Lekshmi, S. G. Bhat, A. A. Wagh, G. Das, and P. N. Santhosh, “Dielectric relaxation, magneto-dielectric coupling, and pyrocurrent anomaly in point defect controlled \chHoCrO3,” J. Appl. Phys. 127, 194105 (2020).
- Garn and Sharp [1982] L. E. Garn and E. J. Sharp, “Use of low-frequency sinusoidal temperature waves to separate pyroelectric currents from nonpyroelectric currents. part i. theory,” J. Appl. Phys. 53, 8974–8979 (1982).
- Sharp and Garn [1982] E. J. Sharp and L. E. Garn, “Use of low-frequency sinusoidal temperature waves to separate pyroelectric currents from nonpyroelectric currents. part II. experiment,” J. Appl. Phys. 53, 8980–8987 (1982).
- Saha, Sundaresan, and Rao [2014] R. Saha, A. Sundaresan, and C. N. R. Rao, “Novel features of multiferroic and magnetoelectric ferrites and chromites exhibiting magnetically driven ferroelectricity,” Mater. Horizon. 1, 20–31 (2014).
- Yuan et al. [2016] B. Yuan, J. Yang, X. Zuo, X. Kan, X. Zhu, J. Dai, W. Song, and Y. Sun, “Observation of ferroelectricity and magnetoelectric coupling in \chMn-doped orthochromite \chDyCr0.5Mn0.5O3,” J. Alloy. Comp. 656, 830–834 (2016).
- Rajeswaran et al. [2012b] B. Rajeswaran, P. Mandal, R. Saha, E. Suard, A. Sundaresan, and C. Rao, “Ferroelectricity induced by cations of nonequivalent spins disordered in the weakly ferromagnetic perovskites, \chYCr1-xMxO3 (\chM = \chFe or \chMn),” Chem. Mater. 24, 3591–3595 (2012b).
- Wagh et al. [2015] A. A. Wagh, K. G. Suresh, P. S. A. Kumar, and S. Elizabeth, “Low temperature giant magnetocaloric effect in multiferroic \chGdMnO3 single crystals,” J. Phys. D Appl. Phys. 48, 135001 (2015).
- Damjanovic [1998] D. Damjanovic, “Ferroelectric, dielectric and piezoelectric properties of ferroelectric thin films and ceramics,” Reports on Progress in Physics 61, 1267 (1998).
- Chiang et al. [2011] F.-K. Chiang, M.-W. Chu, F. Chou, H. Jeng, H. Sheu, F. Chen, and C. Chen, “Effect of jahn-teller distortion on magnetic ordering in \chDy(Fe, Mn)O3 perovskites,” Phys. Rev. B 83, 245105 (2011).
- Perlman [1971] M. M. Perlman, “Thermal currents and the internal polarization in carnauba wax electrets,” J. Appl. Phys. 42, 2645–2652 (1971).