Revised Temperatures For Two Benchmark M-dwarfs – Outliers No More
Abstract
Well-characterised M-dwarfs are rare, particularly with respect to effective temperature. In this letter we re-analyse two benchmark M-dwarfs in eclipsing binaries from Kepler/K2: KIC 1571511AB and HD 24465AB. Both have temperatures reported to be hotter or colder by K in comparison with both models and the majority of the literature. By modelling the secondary eclipses with both the original data and new data from TESS we derive significantly different temperatures which are not outliers. Removing this discrepancy allows these M-dwarfs to be truly benchmarks. Our work also provides relief to stellar modellers. We encourage more measurements of M-dwarf effective temperatures with robust methods.
keywords:
stars: binaries-eclipsing, low-mass, fundamental parameters; techniques: photometric, spectroscopic1 Introduction
There is a lack of precisely-characterised M-dwarfs in the literature. This inhibits our ability to constrain models of stellar structure for low mass stars. Exoplanet studies are also hampered, because our knowledge of the planets is limited by our knowledge of the host star. In the era of TESS and JWST, where M-dwarfs are popular targets, this is particularly problematic. In addition to poor statistics, there exist discrepancies between observations and theory. The most thoroughly studied is the so-called “radius inflation” problem, where M-dwarfs have been often observed with radii a few per cent higher at a given mass than expected by theoretical models (Chabrier et al., 2000; Torres et al., 2014). In this paper we tackle a different yet just as fundamental property: effective temperature. Like with the mass-radius relationship, we expect M-dwarfs to follow a mass-temperature relationship, with more massive stars being expectantly hotter. So far there is largely consistency between observations and theory, but any outliers must be rigorously studied.
Eclipsing binaries remain the most robust avenue for precise M-dwarf characterisation (e.g. Triaud et al. 2017; von Boetticher et al. 2019). We can measure M-dwarf temperatures if we can observe the occultation of the M-dwarf by the companion star. In our study the M-dwarf is the smaller and cooler star in the binary, so its occultation is referred to as the secondary eclipse. An M-dwarf in the G + M eclipsing binary EBLM J0113+31 was found to have an effective temperature of K (Gómez Maqueo Chew et al., 2014), roughly 600 K hotter than expected for a star. This irregularity was later shown to be erroneous by Swayne et al. (2020), who calculated K, in line with expectations. The difference between the two studies was that Swayne et al. (2020) used TESS space-based photometry, whereas Gómez Maqueo Chew et al. (2014) only had ground-based photometry. It was suggested that systematic errors in the J-band photometry created the error. A third analysis, Maxted et al. (2022), added CHEOPS photometry and near-infrared SPIRou radial velocities. They derived a slightly higher temperature than Swayne et al. (2020) of K. However, this is consistent with their heavier mass measurement of .
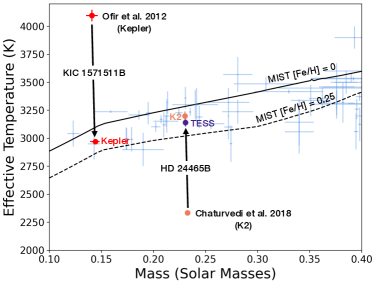
In this paper we study two other benchmark M-dwarfs with outlier temperatures: KIC 1571511B (Ofir et al., 2012) and HD 24465B (Chaturvedi et al., 2018). The outlier nature of these targets is demonstrated in Fig. 1. KIC 1571511B has and , which is K hotter than expected from models and the bulk of the literature. Conversely, HD 24465B has and K, which makes it K colder than expected. This temperature is also suspiciously precise compared with the rest of the literature. Both KIC 1571511AB and HD 24465AB were first analysed using space-based photometry (Kepler and K2, respectively). They both have clearly visible secondary eclipses. We both re-analyse the existing data and new TESS data, using methods applied in several existing studies (Gill et al., 2019; Swayne et al., 2020; Swayne et al., 2021). We demonstrate that, as was the case with EBLM J0113+31, the original published temperatures are erroneous. We derive M-dwarf temperatures in line with theoretical models and the rest of the literature.
2 Targets and Observations
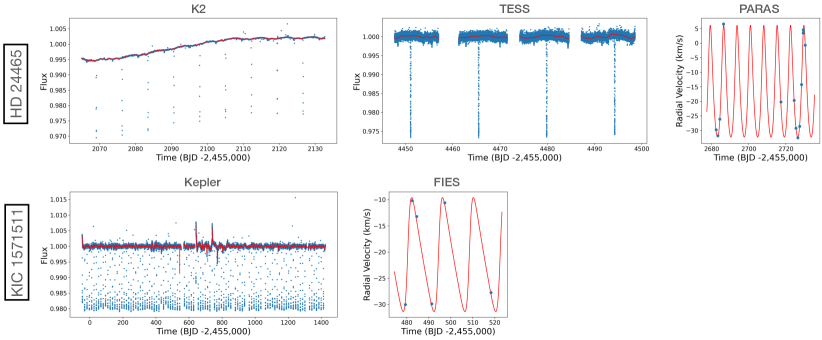
Observational and stellar properties are cataloged in Table 1. The photometric and spectroscopic data are shown in Fig. 2.
2.1 KIC 1571511AB
This is a 14.0-day eclipsing binary containing and stars, discovered using data from the original Kepler mission Ofir et al. (2012). KIC 1571511B is considered a “benchmark” M-dwarf, which we define as having mass and radius errors less than 5%. For KIC 1571511B: and . The secondary star mass comes from six RV measurements from the FIbre-fed Echelle Spectrograph (FIES) on the Nordic Optical Telescope (NOT). Ofir et al. (2012) derive a temperature of , which is roughly 1000 K hotter than expected. KIC 1571511AB has since been observed by the TESS space telescope. Unfortunately, the faintness of the target (Tmag = 12.95) means that we can see primary but not secondary eclipses, so we do not use these data.
2.2 HD 24465AB
This target comes from the Chaturvedi et al. (2018) study of four eclipsing binaries containing M-dwarfs. It is the only one which can be truly considered a benchmark M-dwarf, owing to precise K2 photometry. HD 24465AB is a 7.20-day binary consisting of and stars, where the M-dwarf is constrained to a precision of and , although we suspect that these errors do not properly account for the modelling uncertainties in the primary star’s parameters (Duck et al. under rev.). The mass is derived from 14 radial velocities taken with the PARAS (PRL Advanced Radial-velocity Abu-sky Search) spectrograph on the 1.2-m telescope at Gurushikhar, Mount Abu, India. HD 24465AB was observed by TESS in sectors 42 and 43, both in short cadence (120s). Unlike for KIC 1571511AB, these data are sensitive to the secondary eclipse because this is a much brighter target (Tmag = 8.50). This provides an opportunity to measure the secondary eclipse depth in two different passbands, since TESS has a significantly redder sensitivity than Kepler (Fig. 3).
3 Methods
3.1 Lightcurve Processing
For the Kepler, K2 and TESS data we use the lightkurve software package Lightkurve Collaboration et al. (2018) to download the data. For KIC 1571511AB we use the Kepler PDCSAP flux. For HD 24465AB we use the EVEREST flux (Luger et al., 2016) for K2 and the PDCSAP flux for TESS. We flatten all three lightcurves using the Wotan detrending software (Hippke et al., 2019). We apply a Tukey’s biweight filter with a 1 day window length, such that the eclipse depths are not affected. For HD 26645AB we manually removed the first few days of K2 data (). The original light curves and the fitted trends are shown in Fig 2.
3.2 Exoplanet Fit
We use the exoplanet software (Foreman-Mackey et al., 2021) to create joint photometry and radial-velocity fits. The fitted light curve, with primary and secondary eclipses, is calculated using starry (Luger et al., 2019), with quadratic limb darkening parameters calculated using Kipping (2013). After first estimating the maximum a posteriori parameters, we derive a posterior distribution and errorbars using PyMC3.
To convert from direct observables (e.g. the radial velocity semi-amplitude and the eclipse depths) to physical parameters ( and ) we use the primary star mass and radius from the discovery papers (Table 1). These are implemented as a fixed value in all of the Exoplanet fits. The error in the primary star parameters is propagated to the errors in the secondary star mass and radius. The reason why we do not do a complete re-fit of all of the stellar and orbital parameters is that we want to fix as many parameters as possible. This will make it easier to identify the source of the surprisingly hot/cold temperatures previously published for the two targets.
For HD 22465 we do separate fits for the K2 and TESS data because the secondary eclipse depth will change in different passbands (Fig. 3) and we seek two individual temperature measurements.
We note one issue with the radial velocity fits to HD 24465AB. We were unable to exactly replicate the fit of Chaturvedi et al. (2018) with their published data. In particular, our values for differ by m/s. In their Fig. 2 there are essentially no residuals to the RV fit, but in our best exoplanet fit we have residuals of 100’s of m/s. We attempted an RV-only fit with the genetic algorithm yorbit (Ségransan et al., 2011), but obtained the same fit as with exoplanet. Ultimately, our derived value for is consistent with theirs, so for the purposes of this paper exploring the vs relationship our fit is sufficient. We had no such issues with the radial velocity fits of KIC 1571511AB.
3.3 M-dwarf Effective Temperature Derivation
The secondary eclipse depth is related to the brightness ratio of the two stars by
| (1) |
where is the radius ratio, is the surface brightness ratio and is the geometric albedo (Charbonneau et al., 2005; Cañas et al., 2022). In the first line the factor is the contribution from the intrinsic brightness of the M-dwarf. The factor is light from the primary star reflected off the M-dwarf. Owing to the relatively wide separation of the binaries and a typical albedo of (Marley et al., 1999; Cañas et al., 2022), the reflection effect can be considered negligible. For example, for KIC 1571511 the reflection effect is ppm, relative to a ppm secondary eclipse.
To derive the secondary star’s effective temperature we first calculate from Eq. 1 and then solve for in
| (2) |
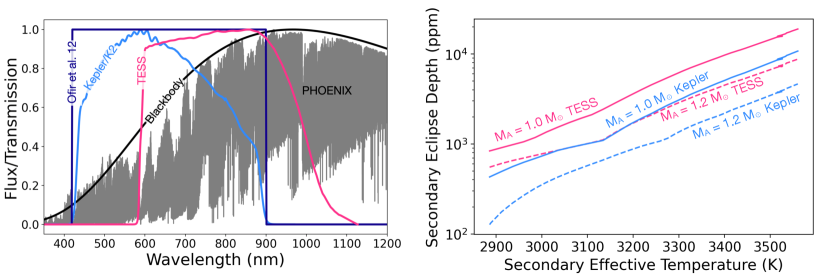
where is the instrumental transmission function for Kepler/K2/TESS111Kepler and K2 are different missions but the same telescope, and hence the same transmission function. Both Kepler and TESS transmission functions can be downloaded here: http://svo2.cab.inta-csic.es/svo/theory/fps3/index.php? and is the flux of each star as a function of wavelength , effective temperature and surface gravity. The factor of inside each integral is the same correction as made in Duck et al. (under rev.), based on Bessell & Murphy (2012). This is because the transmission functions are setup for the photon-counting instrumental CCDs, and so we add a factor of to calculate the instrumental flux rather than the photon count. The constants are added to both integrals and hence cancel. We calculate using an interpolated grid of PHOENIX stellar spectra models (Husser et al., 2013). In Eq. 2 we convolve these theoretical spectra with the instrument’s bandpass to predict the star’s observed brightness. This is done for both stars. For the primary star we take the published value of and . For the secondary star we take our fitted value of , use the literature value for [Fe/H] and test a grid of between 2500 and 4000 K. We then solve Eq. 2 for . The error bar on comes from applying Eq. 2 with the errors on , [Fe/H], , and .
In Fig. 3 (right) we demonstrate how the secondary eclipse depth changes as a function of , for different bandpasses (Kepler and TESS) and different host star masses ( and ). We see that detecting secondary eclipses for late M-dwarfs (<3000 K) becomes very challenging.
4 Results and Discussion
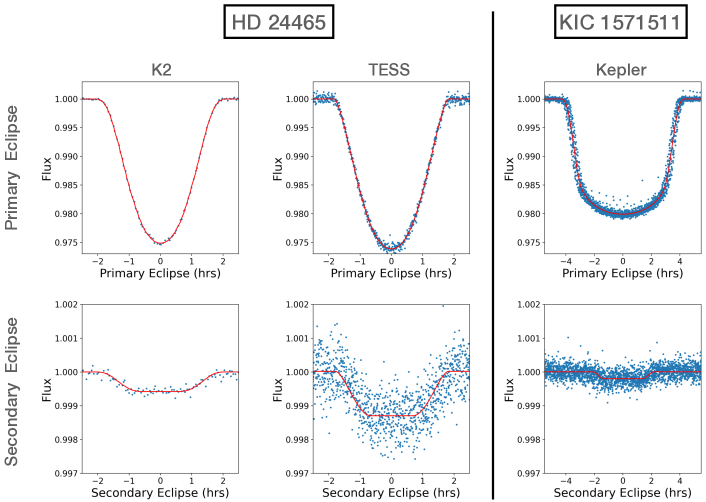
We derive effective temperatures that are significantly different to the Ofir et al. (2012); Chaturvedi et al. (2018) results, but in line with expectations from both models and the rest of the literature. This difference is highlighted in Fig. 1. All of the results provided in Table LABEL:tab:params. In Fig. 4 we show zoomed fits to the primary and secondary eclipses for both targets.
For HD 24465AB our TESS and K2 temperatures are slightly discrepant at the level. This may be an artefact of our handling of dilution or light curve detrending. Our fractional uncertainty on for HD24465AB is 0.4% for K2, compared with 1.7% for TESS. The higher precision of K2 more than compensates for the deeper secondary eclipse in TESS’s redder bandpass (Fig. 3). Our differences between in K2 and TESS are very small relative to the difference with the value from Chaturvedi et al. (2018). Our fitted parameters for the M-dwarf mass and radius, as well as the binary orbital parameters, largely match the discovery papers. This suggests consistency with the fitting of the radial velocities and the primary eclipse, at least.
Why was the Ofir et al. (2012) temperature for KIC 1571511B roughly K too hot, and the Chaturvedi et al. (2018) result for HD 24465B roughly K too cold?
| Target | KIC 1571511AB | HD 24465AB | |||
| Author | This Paper | Ofir et al. (2012) | This Paper | This Paper | Chaturvedi et al. (2018) |
| Instrument | Kepler | Kepler | TESS | K2 | K2 |
| () | |||||
| () | |||||
| (days) | |||||
| (km/s) | |||||
| * | |||||
| * | |||||
| (normalised flux) | 0.000018 | ||||
| (ppm) | 18 | ||||
| *0.01560 | *0.00063 | ||||
| Observed (K) | |||||
| MIST Model (K) | 2863 | 3020 | |||
4.1 KIC 1571511B
Ofir et al. (2012) derive an M-dwarf temperature of 4030 - 4150 K, which is more than 1000 K hotter than our value of K. There are three differences between our studies. First, their secondary eclipse depth () is roughly deeper than ours (), despite both values being derived from Kepler data. It is possible that different light curve processing led to this discrepancy. We re-do our analysis with the Ofir et al. (2012) and derive only a slightly hotter temperature of , which would still be within theoretical expectations.
A second difference is that Ofir et al. (2012) derive assuming blackbodies, as opposed to our PHOENIX model spectra (comparison in Fig. 3). We re-do our analysis with this assumption and actually obtain a colder temperature of K. This would be an outlier, but in the opposite direction of the Ofir et al. (2012) result. The third difference is that Ofir et al. (2012) assume a uniform Kepler passband between 420 and 900 nm. By applying this assumption we obtain . Again, this simplying assumption actually acts to make the M-dwarf cooler. This can be seen in Fig. 3 where the assumption of a uniform bandpass would imply a higher Kepler sensitivity at redder wavelengths. Overall, we cannot explain why the Ofir et al. (2012) result is so hot.
4.2 HD 26645
Chaturvedi et al. (2018) derive , which is 865 K cooler than our value from K2. We suspect that this value does not come from fitting the secondary eclipse, since Chaturvedi et al. (2018) note “The secondary eclipse depth for all the sources were either undetectable or small”, yet they provide measurements for in all four cases. Figure 4 show that the secondary eclipse is in fact clear in our K2 data. However, Chaturvedi et al. (2018) do not appear to be using the EVEREST pipeline, and hence the secondary eclipse may have been hidden to them behind telescope systematics.
Chaturvedi et al. (2018) use the PHOEBE (Prsa et al., 2011) package to model the photometry and radial velocities, and state that is “kept free for fitting”. However, since the fit was seemingly only of the primary eclipse and the radial velocities, there is essentially no information in the light curve concerning . PHOEBE is arguably the most detailed software available for fitting eclipsing binaries, and we doubt it would produce such an outlier if both eclipses were being fit.
Finally, Chaturvedi et al. (2018) do note for HD 24465AB a secondary eclipse depth of 0.000018 in normalised flux units. This value is 32 times smaller than ours. We suspect this is not an observed depth but a predicted depth based on the K effective temperature.
5 Conclusion
We have studied two benchmark M-dwarfs: KIC 1571511B (Ofir et al., 2012) and HD 24465B (Chaturvedi et al., 2018). The former had a reported temperature about 1000 K hotter than expected. The latter was about 800 K colder than expected. Such discoveries would have posed significant challenges to stellar models. We re-analyse the original Kepler/K2 data to derive the M-dwarf effective temperature based on the secondary eclipse depth. Our results differ significantly from the original studies, and instead match the temperatures expected from both models and the majority of other literature M-dwarfs. With these new precise and reliable M-dwarf temperatures, these two targets can be truly considered benchmarks.
Data Availability Statement
All radial velocities and light curves will be made available online.
Acknowledgements
Support for DVM was provided by NASA through the NASA Hubble Fellowship grant HF2-51464 awarded by the Space Telescope Science Institute, which is operated by the Association of Universities for Research in Astronomy, Inc., for NASA, under contract NAS5-26555. This research is also supported work funded from the European Research Council (ERC) the European Union’s Horizon 2020 research and innovation programme (grant agreement n◦803193/BEBOP). Partial support for AD, RRM, and BSG was provided by the Thomas Jefferson Chair Endowment for Discovery and Space Exploration. MIS acknowledges support from STFC grant number ST/T506175/1.
References
- Bessell & Murphy (2012) Bessell M., Murphy S., 2012, PASP, 124, 140
- Cañas et al. (2022) Cañas C. I., et al., 2022, AJ, 163, 89
- Chabrier et al. (2000) Chabrier G., Baraffe I., Allard F., Hauschildt P., 2000, ApJ, 542, 464
- Charbonneau et al. (2005) Charbonneau D., et al., 2005, ApJ, 626, 523
- Chaturvedi et al. (2018) Chaturvedi P., Sharma R., Chakraborty A., Anandarao B. G., Prasad N. J. S. S. V., 2018, AJ, 156, 27
- Dotter (2016) Dotter A., 2016, ApJS, 222, 8
- Foreman-Mackey et al. (2021) Foreman-Mackey D., et al., 2021, The Journal of Open Source Software, 6, 3285
- Gill et al. (2019) Gill S., et al., 2019, A&A, 626, A119
- Gómez Maqueo Chew et al. (2014) Gómez Maqueo Chew Y., et al., 2014, A&A, 572, A50
- Hippke et al. (2019) Hippke M., David T. J., Mulders G. D., Heller R., 2019, AJ, 158, 143
- Husser et al. (2013) Husser T. O., Wende-von Berg S., Dreizler S., Homeier D., Reiners A., Barman T., Hauschildt P. H., 2013, A&A, 553, A6
- Kipping (2013) Kipping D. M., 2013, MNRAS, 435, 2152
- Lightkurve Collaboration et al. (2018) Lightkurve Collaboration et al., 2018, Lightkurve: Kepler and TESS time series analysis in Python (ascl:1812.013)
- Luger et al. (2016) Luger R., Agol E., Kruse E., Barnes R., Becker A., Foreman-Mackey D., Deming D., 2016, AJ, 152, 100
- Luger et al. (2019) Luger R., Agol E., Foreman-Mackey D., Fleming D. P., Lustig-Yaeger J., Deitrick R., 2019, AJ, 157, 64
- Marley et al. (1999) Marley M. S., Gelino C., Stephens D., Lunine J. I., Freedman R., 1999, ApJ, 513, 879
- Maxted et al. (2022) Maxted P. F. L., et al., 2022, MNRAS, 513, 6042
- Ofir et al. (2012) Ofir A., Gandolfi D., Buchhave L., Lacy C. H. S., Hatzes A. P., Fridlund M., 2012, MNRAS, 423, L1
- Prsa et al. (2011) Prsa A., Matijevic G., Latkovic O., Vilardell F., Wils P., 2011, PHOEBE: PHysics Of Eclipsing BinariEs, Astrophysics Source Code Library, record ascl:1106.002 (ascl:1106.002)
- Ségransan et al. (2011) Ségransan D., et al., 2011, A&A, 535, A54
- Swayne et al. (2020) Swayne M. I., Maxted P. F. L., Hodžić V. K., Triaud A. H. M. J., 2020, MNRAS, 498, L15
- Swayne et al. (2021) Swayne M. I., et al., 2021, MNRAS, 506, 306
- Torres et al. (2014) Torres G., Sandberg Lacy C. H., Pavlovski K., Feiden G. A., Sabby J. A., Bruntt H., Viggo Clausen J., 2014, ApJ, 797, 31
- Triaud et al. (2017) Triaud A. H. M. J., et al., 2017, A&A, 608, A129
- von Boetticher et al. (2019) von Boetticher A., et al., 2019, A&A, 625, A150