The physical properties of massive green valley galaxies as a function of environments
at in 3D-HST/CANDELS fields
Abstract
To investigate the effects of environment in the quenching phase, we study the empirical relations for green valley (GV) galaxies between overdensity and other physical properties (i.e., effective radius , Sérsic indices , and specific star formation rate sSFR). Based on five 3D-HST/CANDELS fields, we construct a large sample of 2126 massive () GV galaxies at and split it into the higher overdensity quarter and the lower overdensity quarter. The results shows that GV galaxies in denser environment have higher values and lower sSFR at , while there is no discernible distinction at . No significant enlarging or shrinking is found for GV galaxies in different environments within the same redshift bin. It suggests that a dense environment would promote the growth of bulge and suppress star formation activity of GV galaxies at , but would not affect the galaxy size. We also study the dependence of the fraction of three populations (Blue Cloud, Green Valley, and Red Sequence) on both environments and . At a given , blue cloud fraction goes down with increasing environment density, while red sequence fraction is opposite. For the most massive GV galaxies, a sharp drop appears in the denser environment. Coupled with the mass dependence of three fractions in different redshift bins, our result implies that stellar mass and environments jointly promote the quenching process. Such dual effect is also confirmed by re-calculating the new effective GV fraction as the number of GV galaxies over the number of non-quiescent galaxies.
1 Introduction
A flood of observations on large samples of galaxies found evident cessation of star formation activities during the evolution of galaxies. The cessation of star formation is widely known as “quenching” and is assumed to produce passive galaxies in which the star formation rate (SFR) is very low, commonly resulting in the bimodal distribution of galaxies. In the color–magnitude diagram, the narrow red peak, in which abundant quiescent galaxies (QGs) and a small amount of dusty star-forming galaxies (SFGs) are distributed along with a linear sequence (Blanton & Moustakas 2009), is normally called “red sequence” (RS). The blue peak occupying an extended region mainly consists of SFGs (Kauffmann et al. 2003), similarly called “blue cloud” (BC). An intermediate zone between BC and RS is commonly known as “green valley” (GV), initially proposed and described in several GALEX papers (e.g., Martin et al. 2007; Salim et al. 2007; Wyder et al. 2007).
GV galaxies (see the review of Salim 2014) are often thought to be in a transitional phase. The existence of GV galaxies argues for a continuum of properties from SFGs to QGs (Wyder et al. 2007; Salim 2014). Over the past decades, mechanisms of galaxy quenching remains an unsolved problem. Many previous researches emphasized the role of stellar mass () and environment in the cessation of star formation, generally referred to as “mass quenching” (Peng et al. 2010b; Somerville & Davé 2015; Penny et al. 2018) and “environment quenching” (Peng et al. 2010b; Darvish et al. 2015). A plausible explanation of “mass quenching” is that the feedback from active galactic nucleus (AGN) plays an important role in regulating star formation and in quenching galaxies (Hopkins et al. 2005, 2014; Somerville & Davé 2015; Penny et al. 2018). At the same time, a number of authors have considered that the external environment might be the key factor of suppressing the star formation via some mechanisms to consume the gas reservoir, such as major/minor merger (Springel et al. 2005), ram pressure stripping (Gunn & Gott 1972), and harassment (Farouki & Shapiro 1981). High environmental density might subsequently increase dust attenuation (e.g., Koyama et al. 2013; Sobral et al. 2016) and enrich interstellar medium of SFGs (Sobral et al. 2015; Darvish et al. 2015).
It is noteworthy that galaxy morphology varies with the environment. Generally, galaxies in the lower density environments (field) are bluer, more star-forming, and more disc-like, while galaxies in higher density environments (cluster) are older, redder, less star-forming, and more elliptical (Dressler 1984; Kauffmann et al. 2004). Dressler (1980) found that there is a definite relationship between local galaxy density and morphological type at , which is further confirmed in other studies (Guzzo et al. 1997; Goto et al. 2003; Fasano et al. 2015). The dependence of galaxy morphology on the environment appears not only in the local Universe but also at intermediate and high redshifts (, e.g., Dressler et al. 1997; van der Wel et al. 2007; Allen et al. 2015, 2016). Allen et al. (2015) compared the morphology of SFGs and QGs in different environments (cluster vs. field). They found that cluster SFGs had higher Sérsic indices () than field SFGs at , while there is no difference in light profile and galaxy size for QGs between field and cluster environments. However, it is not consistent with the results of others that QGs in the cluster have shallower profiles (lower ) and larger sizes (Bassett et al. 2013; Strazzullo et al. 2013; Yoon et al. 2017).
Considering that the environment affects both star formation activity and morphology in galaxies at the transitional stage, GV galaxies could be one of the suitable samples to study the environmental effect on physical properties. In our previous series of work, Gu et al. (2018) have assembled a large sample of massive () RS, GV, and BC galaxies at in five fields of 3D-HST/CANDELS, and investigated their morphology, dust content, and environments and revealed a mass-dependent “downsizing” quenching picture. Then, Gu et al. (2019) analyzed the mass dependence of morphology and star formation activity for three populations. We found that the structural properties of GV galaxies are intermediate between those of BC and RS galaxies at fixed stellar mass bins at , and both GV and BC galaxies have similar sizes and compactness at the high-mass end. It implies that GV galaxies could go through a morphological transformation of bulge buildup at , which is consistent with our results of Lu et al. (2021). We found the effect of the morphological quenching mechanism on star formation activity at , after eliminating any possible AGN candidates and considering the stellar mass influence. But we had not studied the effect of the environment on the physical properties of GV galaxies until Gu et al. (2021) defined a dimensionless overdensity (1+) as the environmental indicator by adopting a Bayesian method to consider the contributions of all the th nearest neighbors. Based on this improved environmental method, in this work we set out to explore empirical relations between galaxy environments and other physical properties, including parametric and non-parametric structure, and star-forming parameters, for GV galaxies at . To understand the quenching process for massive galaxies, we also analyze the transformation of different fractions for RS, GV, and BC galaxies.
The structure of our paper is organized as follows. Data and sample selection are described in Section 2. We present the environmental dependence of structural parameters and sSFR in Section 3. Section 4 contains our analysis about the different fractions for RS, GV, and BC populations and the distribution of effective fractions for GV galaxies. Finally, a summary is given in Section 5. Throughout our paper, we adopt the cosmological parameters as following: , , and . All magnitudes adopted in this paper are in the AB system.
2 Data and Sample selection
2.1 3D-HST and CANDELS
The 3D-HST and CANDELS programs cover over 900 arcmin2 in five different fields: AEGIS, COSMOS, GOODS-N, GOODS-S, and UDS, observed by a number of space-based and some ground-based telescopes. It thus provides abundant imaging data from ultraviolet (UV) to infrared (IR) bands via the high-quality WFC3 and ACS spectroscopy and photometry (Grogin et al., 2011; Koekemoer et al., 2011; Skelton et al., 2014; Momcheva et al., 2016). In the 3D-HST/CANDELS, many physical properties of galaxies have been measured by utilizing the homogeneous multi-band data, including the parameters of the stellar population (Skelton et al. 2014; Whitaker et al. 2014; Momcheva et al. 2016) and structure (van der Wel et al. 2014).
In this work, redshifts and rest-frame colors are taken from Momcheva et al. (2016). It is an updated version of the photometric catalog from Skelton et al. (2014) with the grism redshifts from the fits of G141 grism spectroscopy. We refer to Momcheva et al. (2016) for the full details. Following Wang et al. (2017), stellar mass and dust attenuation are re-estimated based on the stellar population synthesis models from Maraston (2005) via the FAST code (Kriek et al., 2009). The Maraston (2005) models are known to give a better description of stellar populations for high-redshift SFGs whereby taking the contribution of the thermally pulsating asymptotic giant branch stars into account. We assume an exponentially declining star formation history with an e-folding time Gyr, a Kroupa (2001) initial mass function (IMF) and solar metallicity. The dust attenuation () varies from 0 to 4 in steps of 0.1 following the Calzetti et al. (2000) law. It is worthy of mentioning that we prefer to take the spectroscopic (or grism) redshifts if available. Otherwise, we will use the photometric redshifts from Skelton et al. (2014) instead.
2.2 Structural Parameters
Quantitative morphological and structural analysis has been developed and complemented in the past decades. There are two main measurements of morphology: parametric modelling of surface brightness profile (Sersic 1968; Peng et al. 2002, 2010a) and non-parametric morphology (Abraham et al. 1994; Lotz et al. 2004a; Conselice 2014).
Parametric models are important in describing light profile to estimate the galaxy size and bulge-to-disk decomposition (Buitrago et al. 2008; Wuyts et al. 2011; Lang et al. 2014; van der Wel et al. 2014). Sérsic indices () and effective radius () in CANDELS fields are taken from van der Wel et al. (2014) which have been measured using GALFIT (Peng et al. 2002). 3D-HST catalog has been matched with J band and H band of CANDELS by Rainbow Database111https://arcoirix.cab.inta-csic.es/Rainbow_Database/Home.html. The rest-frame optical morphologies are traced by J-band (F125W) imaging at and by H-band (F160W) imaging at in this work.
Non-parametric methods are usually used to identify irregular structures in galaxies, especially for high-redshift galaxies, with high irregularity (Bluck et al. 2012; Conselice 2014). We have performed the measurements of the Gini coefficient (; Lotz et al. 2004a) and the second-order moment of the 20% brightest pixels (; Lotz et al. 2004a) on the NIR images using the Morpheus software developed by Abraham et al. (2007). More detailed definitions and calculations for these non-parametric measurements refer to Gu et al. (2018). The effect of signal-to-noise ratio (S/N) on the measurement of non-parametric parameters has been tested by previous work (Kong et al., 2009; Wang et al., 2012; Fang et al., 2015; Gu et al., 2018, 2019; Lu et al., 2021). In sample selection (see Section 2.5) we adopt a flag of that ensures a reliable detection in -band (F160W) with S/N3 and thus reliable non-parametric measurements.
2.3 Star Formation Rates
Young and massive stars produce a large amount of UV photons, which are partly absorbed by interstellar dust and re-emit in IR. Thus, accurate SFR estimation should include both unobscured and obscured parts. The unobscured SFR can be derived from the observed rest-frame UV luminosity, while the obscured one can be estimated through a single mid-infrared measurement, e.g., MIPS 24 m (Battisti et al., 2015; Lin et al., 2016).
In this work, we employ the total SFR by combining UV and IR emissions, provided by Whitaker et al. (2014). Considering the Bell et al. (2005) conversion and the Kroupa (2001) IMF, the can be estimated by:
| (1) |
where is estimated by the rest-frame continuum luminosity at 2800Å, and is the integrated luminosity at 81000 m converted from the Spitzer/MIPS 24 m data using a single luminosity-independent template (Franx et al. 2008; Wuyts et al. 2008).
If the MIPS 24 m data are unavailable, we assume the dust attenuation curve from Calzetti et al. (2000) and correct the effect of dust attenuation on . In this case, the corrected can be derived as follows:
| (2) |
where . The factor of 1.8 converts to that at 2800Å when adopting the Calzetti et al. (2000) attenuation curve.
2.4 Measurements of Environmental Overdensities
The different definitions of environmental density describe disparate physical properties on different physical scales (Muldrew et al. 2012; Etherington & Thomas 2015). In the paper, we adopt the dimensionless overdensity as the indicator of the relative local environment of galaxies, described in detail in Gu et al. (2021). A magnitude-limited sample is selected for the measurements of environmental overdensities. This sample mixes galaxies with spectroscopic, grism, or photometric redshifts and is selected by the following criteria: (1) H-band apparent magnitudes that guarantees the uncertainty of photometric redshifts , (2) a redshift range of , and (3) flag that ensures reliable photometries of galaxies (see Section 2.5 for more details). About 30% of galaxies in this sample with spectroscopic or grism redshifts provide a more convinced derivation of galaxies environments, although using purely photometric redshifts to construct the overdensities would not change our results in general. In the following, we summarise the relevant information on the environmental indicator.
The Bayesian metric in Cowan & Ivezić (2008) is adopted to estimate the local environmental density, which is defined as 1/(). Here is the projected distance of the th nearest neighbor in the projected two-dimensional space within the individual redshift slice. This Bayesian environmental density considers the contribution of all th nearest neighbors, which can improve accuracy in mapping the probability density distribution compared to the traditional method (Ivezić et al. 2005). Given that photometric redshifts have large uncertainties, we choose the redshift slice as , where is the typical uncertainty of photometric redshifts of our sample, and is the redshift of target galaxy to estimate the environment.
With increasing redshift, the comoving number densities of the observed galaxies are expected to decrease. Thus, we adopt a dimensionless overdensity of Gu et al. (2021), 1+, as the indicator of galaxy environment:
| (3) |
where is the standard value of Bayesian density when galaxies are distributed in the uniform environment. At a given density , can be calculated by a linear correction coefficient (see also in the Appendix of Gu et al. 2021). Thus, 0 indicates that the environmental density of a galaxy exceeds the density standard in the uniform condition and vice versa.
Due to the Poisson noise and the possible contamination of foreground and background galaxies, a small value of may cause fluctuation in the density values. We therefore adopt the overdensity based on the distances to all 10 nearest neighbors () as the indicator of galaxy environments in this work. statistically
2.5 Sample Selection
Based on the magnitude-limit sample, we focus on the massive galaxies with . The flag of is set to choose galaxies with a reliable detection following these criteria: 1) not a star, or bright enough to be a reliable galaxy; 2) not close to a bright star; 3) well-exposed in the F125W and F160W bands; 4) a S/N of fF160W / eF160W 3; 5) has a passable photometric redshift fit; 6) has a “non-catastrophic” stellar population fit, with 0 (Skelton et al., 2014). To ensure reliable measurement of the structural parameters, we also make an additional cut on H-band, H 24.5, which could get rid of faint galaxies and guarantee much higher reliable photometric redshifts (Momcheva et al. 2016). Finally, the parent sample contains 7850 massive galaxies at 0.5 z 2.5 from five 3D-HST/CANDELS fields, about 58% of galaxies have spectroscopic or grism redshifts. Considering about half of sample with photometric redshifts, the bias from galaxies spectroscopic redshifts which trend to be brighter might be relieved.
Given that the intrinsic rest-frame colors depend on stellar mass and redshift, we use the extinction-corrected rest-frame U-V colors to divide galaxies into RS, GV, and BC populations as well, as Wang et al. (2017) did. The separation criteria are as follows:
where is the extinction correction of rest-frame U-V color, the value of 0.47 is the correction factor from the Calzetti et al. (2000) attenuation law. Then we obtain 2566 RS galaxies, 2126 GV galaxies, and 3158 BC galaxies.
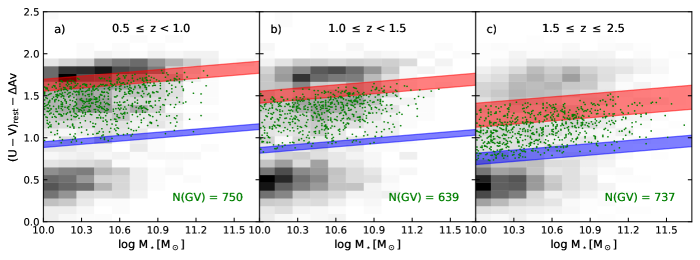
In Figure 1, we show the extinction-corrected rest-frame U-V color of GV galaxies as a function of stellar mass in three redshift bins from 0.5 to 2.5. The criteria for each redshift bin from Wang et al. (2017) are separately shown as red and blue bands, where the width of the ribbon corresponds to the range of redshift. GVs are distributed below the upper limit of the first separation and above the lower limit of the second separation. The background grayscales represent the distributions for all massive galaxies in our parent sample, and also show the separation for BC and RS. The number of GV in each bin is also shown in each panel. Due to the redshift-dependence of the GV definition, we can find that high-redshift galaxies tend to be bluer than low-redshift galaxies in Figure 1.
3 Environmental Effect on Physical Properties
In this section, we discuss the effect of the environment on different physical properties of GV galaxies, including parametric ( and re), non-parametric ( and M20) structures, and sSFR. Considering that the dominated quenching mechanism might vary across cosmic time (Iovino et al. 2010), we carry out the research in three redshift bins (0.5 1.0, 1.0 1.5, and 1.5 2.5). In each redshift bin, GV galaxies are divided into four equal bins according to the local overdensity 1+. In the following, we compare the physical properties of GV galaxies in the highest and lowest overdensity bins, namely the highest and lowest density quarters. To qualify the correlation between stellar mass and different physical properties and the corresponding differences between the highest and lowest density quarters in three redshift bins, we calculate the Spearman correlation coefficients and perform 2-Dimensional Kolmogorov–Smirnov (2D-KS) test (Peacock 1983; Fasano & Franceschini 1987), respectively. It is assumed that there is a significant difference between two density quarters when the p-value of 2D-KS test is smaller than 0.05. All results are listed in Table 2.
3.1 Parametric Structures
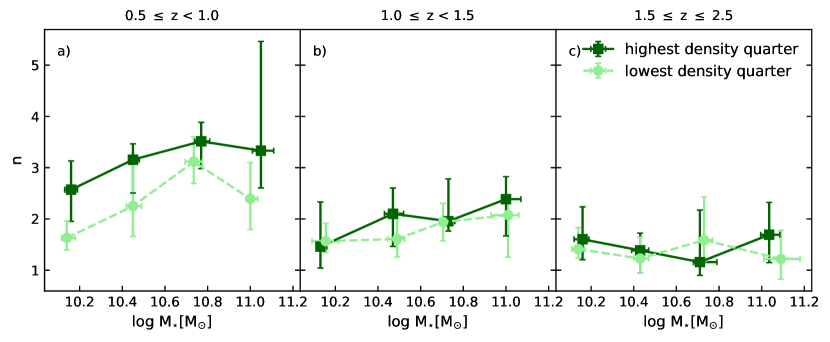
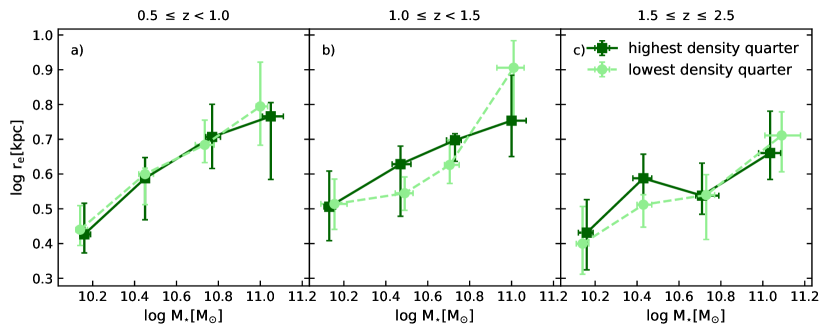
For a galaxy fitted with a single Sérsic profile, the disc-like galaxies have a characteristic of 1, whereas the Sérsic indices of bulge-dominated galaxies are considered to be 2.5 (Shen et al. 2003; Cebrián & Trujillo 2014). Figure 2 shows the dependence of Sérsic index and effective radius re of GV galaxies on stellar mass in two extreme environments. Dark green squares represent the corresponding median values for GV galaxies in the highest density quarter, while light green squares represent those in the lowest density quarter. The error bars represent the 2 uncertainties drawn from the bootstrap method with the 1000 times resamples.
In the top panels of Figure 2, we find that the difference in between the highest and lowest environments is significant at with the p-value of 2D-KS test 0.003, which reveals that Sérsic indices () of GV galaxies are larger in denser environments. It is unlikely to see that GV galaxies are disc-like in the densest environments at , regardless of stellar mass. There are no clear distinctions between two opposite environments at higher redshift () with the corresponding 2D-KS p-value 0.05. Our result indicates that galaxy environments have a significant impact on galaxy structure at . This difference in Sérsic indices between two opposite environments is also reported by Paulino-Afonso et al. (2019), which found that there is an environmental dependence of Sérsic indices () in different stellar mass bins when considering the entire sample including both SFGs and QGs, with denser environments having galaxies with higher Sérsic indices () at . In addition, there is a correlation between and redshift: the overall indices of high-redshift galaxies are smaller than these of low-redshift galaxies. In our sample, it is easier to observe more disc-like GV galaxies at high-redshift.
The bottom panels of Figure 2 show the dependence of galaxy size on the environment density and stellar mass. The galaxy size increases by a small amount with stellar mass in given redshift bins, with the Spearman coefficients 0.3, regardless of the environments. This is consistent with the expectation about the general mass–size relation: more massive galaxies tend to be characterized by a larger radius than their less massive counterparts on average (Shen et al. 2003; van der Wel et al. 2014). Our result provides a specific mass–size relation for massive GV galaxies at in two extreme environments. We find no significant difference in size between galaxies in the highest density and lowest density for three redshift bins with KS p-value 0.05, suggesting that a denser environment is not effective enough for inhibiting or stimulating galaxy size.
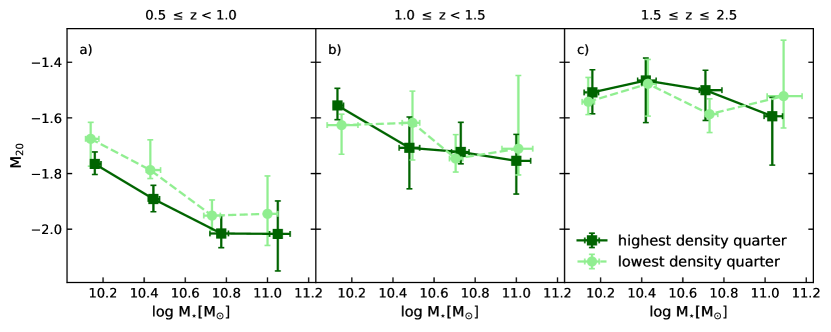
3.2 Non-parametric Structures
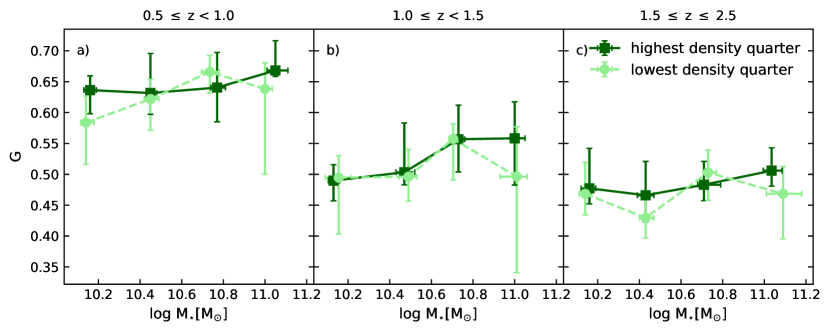
We show the and distributions as functions of stellar mass in different redshift and environment bins in Figure 3. For massive GV galaxies, the average increases with the cosmic time, while M20 generally decreases with decreasing redshifts. A large value hints that the light distribution of a galaxy tends to be not uniform but concentrated. This could explain why has a similar redshift evolution as shown in Figure 2. Peth et al. (2016) have approved that the is sensitive to the . Different from , the decrease of is associated with the disappearance of sub-structures in galaxies, such as bars, spiral arms, and bright cores (Lotz et al., 2004b). In other words, these non-parametric measurements of massive GV galaxies show substantial variations with redshift, i.e, these galaxies at higher redshift tend to have more uniform light distribution globally but more sub-structures locally. The results of median (or KS) test between the highest and lowest environments show that p-values for in all redshift bins are larger than 0.05, indicating no environment-related variation. Figure 3 also shows the dependence of on both stellar mass and at environment overdensity quantiles at , with 2D-KS p-value 0.05. The corresponding Spearman coefficients for higher and lower density quarters are about -0.476 and -0.497, respectively, suggesting that is negatively dependent on stellar mass. GV galaxies with higher mass tend to have less prominent substrctures.
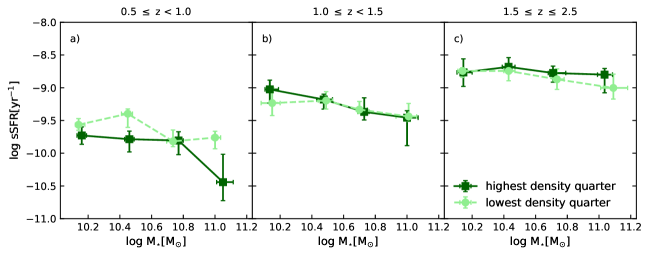
3.3 Specific Star Formation Rate
In Figure 4, we show the sSFR vs. distributions in two extreme environments in three redshift bins. The negative Spearman correlation coefficients ( -0.1) shown in Table 2 reveal that there is a steady drop of sSFR with increasing stellar mass at and . It is consistent with results of Bauer et al. (2005), which reported that sSFR decreases with increasing galaxy stellar mass at . It shows the mass dependence for massive GV galaxies, which decreases at high redshift.
In each redshift bin, the dark green squares represent the sSFR– relation in the highest density quarter, while the light ones are in the lowest density quarter. At , there is no significant difference of sSFR for GV galaxies in two opposite environments, with the corresponding 2D-KS p-value 0.05. While at 0.5 , it could be clearly seen the difference of sSFR between the highest and lowest environmental density, where p-value 0.003, especially for the most massive GV galaxies: a sharp drop at the high-mass end for GV galaxies in the highest overdensity. A possible explanation for this sharp decline is that a denser environment would suppress the star formation activities for more massive GV galaxies at lower redshift. It hints the effect of “environment quenching”. We would discuss the quiescent fraction in Section 4 to explain the quenching process more.
| Spearman | Spearman | 2D KS | Spearman | Spearman | 2D KS | Spearman | Spearman | 2D KS | |||
| (high) | (low) | (high) | (low) | (high) | (low) | ||||||
| 0.292 | 0.244 | 0.003 | 0.056 | 0.084 | 0.567 | -0.046 | -0.031 | 0.528 | |||
| re | 0.498 | 0.584 | 0.417 | 0.429 | 0.447 | 0.274 | 0.373 | 0.322 | 0.266 | ||
| 0.109 | 0.174 | 0.123 | 0.155 | 0.087 | 0.528 | 0.049 | 0.071 | 0.251 | |||
| M20 | -0.476 | -0.497 | 0.015 | -0.214 | -0.155 | 0.407 | -0.137 | -0.081 | 0.755 | ||
| sSFR | -0.258 | -0.275 | 0.003 | -0.327 | -0.167 | 0.260 | -0.085 | -0.181 | 0.192 | ||
4 Discussion
During the sample selection in Section 2.5, we have divided galaxies into three different populations (BC, GV, and RS) according to the corrected rest-frame U-V color. The fraction of each population could give an insight into the quenching timescale, which is defined as the number of each population over the number of the whole sample, i.e., , i = BC, GV, and RS. If the quenching timescale is large, BC galaxies will pass through the GV phase slowly and then become quiescent, resulting in a large . Otherwise, BC galaxies go through the transition and become quiescent quickly, without a significant rise of (Jian et al. 2020). Therefore, comparing the distributions of as a function of environments with those of and might help us understand the quenching process.
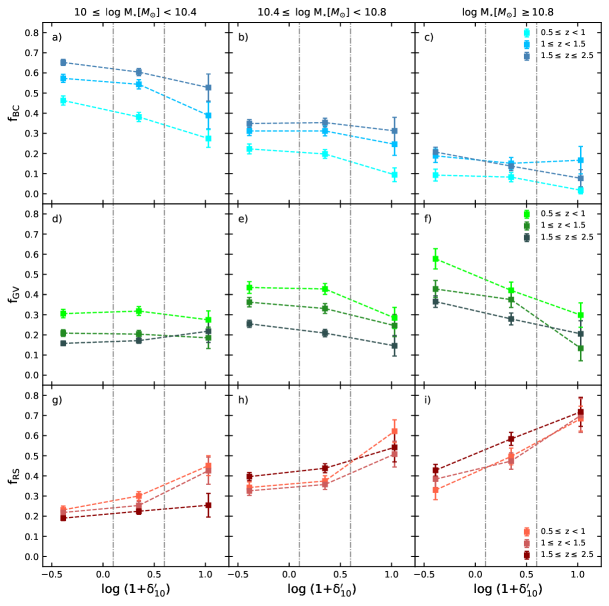
4.1 Fractions of Three Populations
Figure 5 shows the fractions of galaxies belonging to BC (top), GV (middle), and RS (bottom) populations as functions of overdensity in different stellar mass and redshift bins. The vertical dot-dashed lines separate the environment into low (), medium (), and high overdensity () from the left to right. Regardless of redshifts, keeps a steady decline with the rise of local density, while it is the opposite for the RS fraction, which decreases gradually.
At the low-mass end (), and are much more dependent on the overdensity compared to . While at the high-mass end ( 10.8), it becomes that and are both sensitive to the overdensity, while is relatively stable. The comparison of in the high- and low-mass bins implies that the quenching timescale of the massive GV galaxies is larger than that of the less massive GV galaxies, because more massive GV galaxies are undergoing the quenching processes, especially in the field at the high-mass end. So it can reveal the real fact of the influence of stellar mass on the galaxy quenching, called the “mass quenching”.
In addition, when we consider the effects of both the environment and stellar mass, it is expected that more massive galaxies in the high overdensity are easier to be quenched into the RS population, resulting in a higher in the denser environment at the high-mass end as shown in the panels f) and i) of Figure 5. What is interesting in Figure 5 is the general pattern of decline in the GV fraction with the increasing overdensity at , even for the less massive galaxies. Meanwhile, galaxies in denser environments have a higher , regardless of and redshifts, which may imply that denser environments have additional effects on the acceleration of quenching. In summary, we find that GV and BC galaxies would be more likely to transform into RS galaxies in the denser environments for all the massive galaxies. Our results also display the effect of stellar mass on the quenching process as previous researches (Iovino et al. 2010; Peng et al. 2010b), thus suggesting that the joint role of stellar mass and environment promotes the quenching process, as evidence of “mass quenching” and “environment quenching” (Vulcani et al. 2012; Darvish et al. 2017).
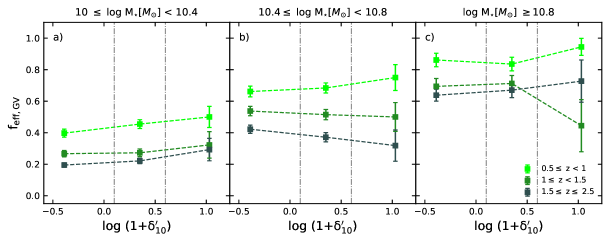
4.2 Effective Fraction of GV Galaxies
In general, BC galaxies could be considered as the progenitors of GV galaxies. With the cosmic time, the abundance of RS galaxies and the shortage of BC galaxies naturally leads to the drop-down of GV population in Figure 5, especially for galaxies at the high-mass end. Recently, Jian et al. (2020) have pointed out that the contamination of RS galaxies might bias the relative fraction of GV galaxies. Therefore, the effective fraction, defined as the relative number of GV galaxies over the number of non-quiescent galaxies (i.e., BC and GV galaxies), , can be a better indicator to reflect the galaxy transitional phase more realistically, after removing the effect due to the dominance of the quiescent galaxies.
Based on the new normalized fraction, Figure 6 shows as a function of overdensity in bins of redshift and stellar mass. After eliminating the RS galaxies, at in the low overdensity environment is lower than those in the environments with higher overdensity , and the relations between GV fraction and environment reverse compared to those shown in Figure 5. This result suggests that the observed negative correlations between and overdensity are mostly due to the reduction of the non-quiescent galaxies with increasing environment densities. The steady increasing trend of with in the lower redshift bin might support a scenario that environment indeed boosts the beginning of quenching process for SFGs in intermediate-redshift Universe. At , there is no slow upward trend of with the increase of local overdensity, implying that environment has no impact on the beginning of the quenching, although it plays an important role in the complete cessation of the star formation activities as seen in the bottom panels of Figure 5.
On the other hand, the overall of at fixed redshift and significantly increases with , which reveals a strong mass dependence of . For more massive GV galaxies at , a sharp drop of the effective fraction of GV from middle to high overdensity is observed, which might be the consequence of the combination of effects from both stellar mass and environment, which is the same as the explains in Section 4.1.
5 Summary
By utilizing the multi-wavelength data from five 3D-HST/CANDELS fields, we construct a sample of 7850 massive () galaxies at . Based on the extinction-corrected rest-frame U-V color, we separate the parent sample into BC, GV, and RS galaxies (Gu et al. 2018, 2019), resulting in a total number of 2126 GV galaxies. We provide empirical relations for GV galaxies between environment and different physical properties, including , , , , and sSFR. We also analyze the fractions of three populations as functions of environments and redshift. Our conclusions are summarized as follows:
1. At , GV galaxies have larger Sérsic indices () in the denser environment. The environment seems to have a significant impact on at . It is unlikely to observe disc-like GV galaxies in the densest environment, which suggests that a denser environment would promote the growth of bulge of low-redshift GV galaxies. We find no significant difference in galaxy size (re) between galaxies in environments with the highest and the lowest overdensity at fixed redshift, indicating that a denser environment is not effective enough to influence galaxy size.
2. Non-parametric measurements of massive GV galaxies show substantial variations with redshift that GV galaxies are more disc-like at higher redshift. Neither stellar mass nor environments have significant impact on in different redshift bins, while there is a dependence of on both stellar mass and environment at .
3. At , there is a decrease of sSFR from the lowest to the highest environmental density, especially at the high-mass end. A plausible explanation is that a denser environment would suppress the star formation activity of GV galaxies, especially for massive GV galaxies at low redshift.
4. We also discuss the effect of the environment on the fraction for three different populations (BC, GV, RS). At the low-mass end (10.010.4), the BC and RS fractions are much more dependent on the overdensity compared to the GV fraction. While at the high-mass end ( 10.8), it becomes that the GV and RS fractions are sensitive to the overdensity, and the BC fraction is relative stable. It implies that the quenching timescale of the massive GV galaxies is longer than that of the less massive GV galaxies, which reveals the influence of “mass quenching”. There is a general pattern of decline in the GV fraction and increase in the RS fraction with the increase of environment density at . It suggests that denser environments have effects on the quenching process. Considering the effect of mass on three fractions, it could be explained that both denser environments and mass aggregation might promote the galaxy quenching process.
5. The rises gradually with the increase of environmental density, suggesting that environment boosts the beginning of the quenching process. The overall is found to have a positive correlation with , regardless of redshift and environments. Both original fraction and new effective fraction suggest that stellar mass and environments jointly promote the quenching process.
References
- Abraham et al. (1994) Abraham, R. G., Valdes, F., Yee, H. K. C., & van den Bergh, S. 1994, ApJ, 432, 75
- Abraham et al. (2007) Abraham, R. G., Nair, P., McCarthy, P. J., et al. 2007, ApJ, 669, 184
- Allen et al. (2016) Allen, R. J., Kacprzak, G. G., Glazebrook, K., et al. 2016, ApJ, 826, 60
- Allen et al. (2015) Allen, R. J., Kacprzak, G. G., Spitler, L. R., et al. 2015, ApJ, 806, 3
- Bassett et al. (2013) Bassett, R., Papovich, C., Lotz, J. M., et al. 2013, ApJ, 770, 58
- Battisti et al. (2015) Battisti, A. J., Calzetti, D., Johnson, B. D., & Elbaz, D. 2015, ApJ, 800, 143
- Bauer et al. (2005) Bauer, A. E., Drory, N., Hill, G. J., & Feulner, G. 2005, ApJ, 621, L89
- Bell et al. (2005) Bell, E. F., Papovich, C., Wolf, C., et al. 2005, ApJ, 625, 23
- Blanton & Moustakas (2009) Blanton, M. R., & Moustakas, J. 2009, ARA&A, 47, 159
- Bluck et al. (2012) Bluck, A. F. L., Conselice, C. J., Buitrago, F., et al. 2012, ApJ, 747, 34
- Buitrago et al. (2008) Buitrago, F., Trujillo, I., Conselice, C. J., et al. 2008, ApJ, 687, L61
- Calzetti et al. (2000) Calzetti, D., Armus, L., Bohlin, R. C., et al. 2000, ApJ, 533, 682
- Cebrián & Trujillo (2014) Cebrián, M., & Trujillo, I. 2014, MNRAS, 444, 682
- Conselice (2014) Conselice, C. J. 2014, ARA&A, 52, 291
- Cowan & Ivezić (2008) Cowan, N. B., & Ivezić, Ž. 2008, ApJ, 674, L13
- Darvish et al. (2017) Darvish, B., Mobasher, B., Martin, D. C., et al. 2017, ApJ, 837, 16
- Darvish et al. (2015) Darvish, B., Mobasher, B., Sobral, D., et al. 2015, ApJ, 814, 84
- Dressler (1980) Dressler, A. 1980, ApJ, 236, 351
- Dressler (1984) —. 1984, ARA&A, 22, 185
- Dressler et al. (1997) Dressler, A., Oemler, Augustus, J., Couch, W. J., et al. 1997, ApJ, 490, 577
- Etherington & Thomas (2015) Etherington, J., & Thomas, D. 2015, MNRAS, 451, 660
- Fang et al. (2015) Fang, G., Ma, Z., Kong, X., & Fan, L. 2015, ApJ, 807, 139
- Farouki & Shapiro (1981) Farouki, R., & Shapiro, S. L. 1981, ApJ, 243, 32
- Fasano & Franceschini (1987) Fasano, G., & Franceschini, A. 1987, MNRAS, 225, 155
- Fasano et al. (2015) Fasano, G., Poggianti, B. M., Bettoni, D., et al. 2015, MNRAS, 449, 3927
- Franx et al. (2008) Franx, M., van Dokkum, P. G., Förster Schreiber, N. M., et al. 2008, ApJ, 688, 770
- Goto et al. (2003) Goto, T., Yamauchi, C., Fujita, Y., et al. 2003, MNRAS, 346, 601
- Grogin et al. (2011) Grogin, N. A., Kocevski, D. D., Faber, S. M., et al. 2011, ApJS, 197, 35
- Gu et al. (2018) Gu, Y., Fang, G., Yuan, Q., Cai, Z., & Wang, T. 2018, ApJ, 855, 10
- Gu et al. (2019) Gu, Y., Fang, G., Yuan, Q., et al. 2019, ApJ, 884, 172
- Gu et al. (2021) Gu, Y., Fang, G., Yuan, Q., Lu, S., & Liu, S. 2021, ApJ, 921, 60
- Gunn & Gott (1972) Gunn, J. E., & Gott, J. Richard, I. 1972, ApJ, 176, 1
- Guzzo et al. (1997) Guzzo, L., Strauss, M. A., Fisher, K. B., Giovanelli, R., & Haynes, M. P. 1997, ApJ, 489, 37
- Hopkins et al. (2005) Hopkins, P. F., Hernquist, L., Cox, T. J., et al. 2005, ApJ, 630, 705
- Hopkins et al. (2014) Hopkins, P. F., Kereš, D., Oñorbe, J., et al. 2014, MNRAS, 445, 581
- Iovino et al. (2010) Iovino, A., Cucciati, O., Scodeggio, M., et al. 2010, A&A, 509, A40
- Ivezić et al. (2005) Ivezić, Ž., Vivas, A. K., Lupton, R. H., & Zinn, R. 2005, AJ, 129, 1096
- Jian et al. (2020) Jian, H.-Y., Lin, L., Koyama, Y., et al. 2020, ApJ, 894, 125
- Kauffmann et al. (2004) Kauffmann, G., White, S. D. M., Heckman, T. M., et al. 2004, MNRAS, 353, 713
- Kauffmann et al. (2003) Kauffmann, G., Heckman, T. M., White, S. D. M., et al. 2003, MNRAS, 341, 54
- Koekemoer et al. (2011) Koekemoer, A. M., Faber, S. M., Ferguson, H. C., et al. 2011, ApJS, 197, 36
- Kong et al. (2009) Kong, X., Fang, G., Arimoto, N., & Wang, M. 2009, ApJ, 702, 1458
- Koyama et al. (2013) Koyama, Y., Smail, I., Kurk, J., et al. 2013, MNRAS, 434, 423
- Kriek et al. (2009) Kriek, M., van Dokkum, P. G., Labbé, I., et al. 2009, ApJ, 700, 221
- Kroupa (2001) Kroupa, P. 2001, MNRAS, 322, 231
- Lang et al. (2014) Lang, P., Wuyts, S., Somerville, R. S., et al. 2014, ApJ, 788, 11
- Lin et al. (2016) Lin, Z., Fang, G., & Kong, X. 2016, AJ, 152, 191
- Lotz et al. (2004a) Lotz, J. M., Primack, J., & Madau, P. 2004a, AJ, 128, 163
- Lotz et al. (2004b) —. 2004b, AJ, 128, 163
- Lu et al. (2021) Lu, S., Fang, G., Gu, Y., et al. 2021, ApJ, 913, 81
- Maraston (2005) Maraston, C. 2005, MNRAS, 362, 799
- Martin et al. (2007) Martin, D. C., Small, T., Schiminovich, D., et al. 2007, ApJS, 173, 415
- Momcheva et al. (2016) Momcheva, I. G., Brammer, G. B., van Dokkum, P. G., et al. 2016, ApJS, 225, 27
- Muldrew et al. (2012) Muldrew, S. I., Croton, D. J., Skibba, R. A., et al. 2012, MNRAS, 419, 2670
- Paulino-Afonso et al. (2019) Paulino-Afonso, A., Sobral, D., Darvish, B., et al. 2019, A&A, 630, A57
- Peacock (1983) Peacock, J. A. 1983, MNRAS, 202, 615
- Peng et al. (2002) Peng, C. Y., Ho, L. C., Impey, C. D., & Rix, H.-W. 2002, AJ, 124, 266
- Peng et al. (2010a) —. 2010a, AJ, 139, 2097
- Peng et al. (2010b) Peng, Y.-j., Lilly, S. J., Kovač, K., et al. 2010b, ApJ, 721, 193
- Penny et al. (2018) Penny, S. J., Masters, K. L., Smethurst, R., et al. 2018, MNRAS, 476, 979
- Peth et al. (2016) Peth, M. A., Lotz, J. M., Freeman, P. E., et al. 2016, MNRAS, 458, 963
- Salim (2014) Salim, S. 2014, Serbian Astronomical Journal, 189, 1
- Salim et al. (2007) Salim, S., Rich, R. M., Charlot, S., et al. 2007, ApJS, 173, 267
- Sersic (1968) Sersic, J. L. 1968, Atlas de Galaxias Australes
- Shen et al. (2003) Shen, S., Mo, H. J., White, S. D. M., et al. 2003, MNRAS, 343, 978
- Skelton et al. (2014) Skelton, R. E., Whitaker, K. E., Momcheva, I. G., et al. 2014, ApJS, 214, 24
- Sobral et al. (2015) Sobral, D., Stroe, A., Dawson, W. A., et al. 2015, MNRAS, 450, 630
- Sobral et al. (2016) Sobral, D., Stroe, A., Koyama, Y., et al. 2016, MNRAS, 458, 3443
- Somerville & Davé (2015) Somerville, R. S., & Davé, R. 2015, ARA&A, 53, 51
- Springel et al. (2005) Springel, V., Di Matteo, T., & Hernquist, L. 2005, ApJ, 620, L79
- Strazzullo et al. (2013) Strazzullo, V., Gobat, R., Daddi, E., et al. 2013, ApJ, 772, 118
- van der Wel et al. (2007) van der Wel, A., Holden, B. P., Franx, M., et al. 2007, ApJ, 670, 206
- van der Wel et al. (2014) van der Wel, A., Franx, M., van Dokkum, P. G., et al. 2014, ApJ, 788, 28
- Vulcani et al. (2012) Vulcani, B., Poggianti, B. M., Fasano, G., et al. 2012, MNRAS, 420, 1481
- Wang et al. (2012) Wang, T., Huang, J.-S., Faber, S. M., et al. 2012, ApJ, 752, 134
- Wang et al. (2017) Wang, T., Elbaz, D., Alexander, D. M., et al. 2017, A&A, 601, A63
- Whitaker et al. (2014) Whitaker, K. E., Franx, M., Leja, J., et al. 2014, ApJ, 795, 104
- Wuyts et al. (2008) Wuyts, S., Labbé, I., Förster Schreiber, N. M., et al. 2008, ApJ, 682, 985
- Wuyts et al. (2011) Wuyts, S., Förster Schreiber, N. M., Lutz, D., et al. 2011, ApJ, 738, 106
- Wyder et al. (2007) Wyder, T. K., Martin, D. C., Schiminovich, D., et al. 2007, ApJS, 173, 293
- Yoon et al. (2017) Yoon, Y., Im, M., & Kim, J.-W. 2017, ApJ, 834, 73