Transfer Ranking in Finance: Applications to Cross-Sectional Momentum with Data Scarcity
Abstract.
Modern cross-sectional strategies incorporating sophisticated neural architectures outperform traditional counterparts when applied to mature assets with long histories. However, deploying them on instruments with limited samples generally produces over-fitted models with degraded performance. In this paper, we introduce Fused Encoder Networks – a hybrid parameter-sharing transfer ranking model which fuses information extracted using an encoder-attention module from a source dataset with a similar but separate module operating on a smaller target dataset of interest. This approach mitigates the issue of models with poor generalisability. Additionally, the self-attention mechanism enables interactions among instruments to be accounted for at the loss level during model training and inference time. We demonstrate the effectiveness of our approach by applying it to momentum strategies on the top ten cryptocurrencies by market capitalization. Our model outperforms state-of-the-art benchmarks on most measures and significantly improves the Sharpe ratio. It continues to outperform baselines even after accounting for the high transaction costs associated with trading cryptocurrencies.
1. Introduction
Cross-sectional strategies are a popular class of trading strategies that involve first sorting assets by some ranking criteria and then trading the winners against losers. Since the seminal work of (Jegadeesh and Titman, 1993) documenting the strategy and its performance trading US equities, numerous technical refinements have been introduced. For instance, the ranking step, which is at the core of the model, evolved from being performed with heuristics (Jegadeesh and Titman, 1993) to involving more sophisticated DL (Deep Learning) prediction models (Gu et al., 2019; Kim, 2019) and modern ranking algorithms such as LambdaMART (Burges, 2010; Poh et al., 2021; Wang and Rasheed, 2018).
Fundamental to calibrating these models is the availability of sufficient data. While this is somewhat mitigated for DL-based strategies operating in the high-frequency domain or for mature assets with longer trading histories, deploying these strategies on newer instruments is challenging due to their small sample sizes, and their degraded performance will likely result in substantial trading losses. Cryptocurrencies, which have recently seen broad interest in academia and industry, are an example of such a class of instruments.
This dilemma reflects the broader challenge of training DL models that generalise well when confronted with limited data. Although numerous approaches (reducing model complexity (Brigato and Iocchi, 2020), few-shot learning (Wang et al., 2021c) and data augmentation techniques (Feng et al., 2021; Shorten and Khoshgoftaar, 2019)) exist for tackling this issue, Transfer Learning stands out as a promising methodology. Transfer Learning focuses on transferring the knowledge obtained across different but related source or upstream domains in order to boost the performance of a decision-making function on some target or downstream domains (we will use ‘source’ and ‘upstream’ interchangeably, the same applies to ‘target’ and ‘downstream’) of interest (Zhuang et al., 2019; Day and Khoshgoftaar, 2017). It is a broad and active research area, and given the nuances that different problems entail, it overlaps several fields such as domain adaptation and multi-task learning111Domain adaptation is used when the source and target datasets belong in different domains (Wang et al., 2021a). Multi-task learning is used when the goal is to jointly learn a group of related tasks by exploiting the interconnections between tasks (Zhuang et al., 2019).. The multitude of transfer learning successes in computer vision (Kolesnikov et al., 2020; Shen et al., 2021) and NLP (natural language processing) (Devlin et al., 2019) tasks have boosted its popularity both as a go-to solution for knowledge transfer problems, as well as a research topic in its own right.
In the space of IR (information retrieval), transfer learning and its closely associated fields have been documented to significantly improve the accuracy of sorting algorithms in target domains with limited samples (Chen et al., 2010; Chapelle et al., 2010; Gao et al., 2010; Li et al., 2020). However, unlike the computer vision and NLP communities, which have rapidly adopted transformer-based solutions in response to their domain-specific transfer learning problems, we note that a corresponding development in IR is surprisingly absent. Inspired by recent works of (Pobrotyn et al., 2020) and (Pei et al., 2019) which exploit the Transformer’s attention module to improve ranking performance as well as a first adaptation in the context of finance (Poh et al., 2022), we similarly make use of this mechanism and propose the Fused Encoder Networks (FEN). Central to the model’s architecture is the usage of dual encoder blocks – one of which is optimised on a larger but related upstream dataset and then deployed in conjunction with the other encoder block calibrated on a smaller downstream dataset of interest. We focus on applying our transfer ranking model to cryptocurrencies, where relatively short trading histories (relative to more mature financial instruments) and recent institutional interest promotes them as a practical use-case. Applying cross-sectional momentum across ten cryptocurrencies with the largest market capitalisation, we provide evidence of the superiority of our approach over a set of benchmarks which includes state-of-the-art LTR (Learning to Rank) algorithms. We obtain a threefold boost in the Sharpe ratio over risk-adjusted momentum and a gain of around 50% over the best baseline model. We structure the rest of the paper as follows: The next section discusses related works applying transfer learning to finance and ranking tasks. We next move on to sections that define the problem and describe the proposed model’s key elements. We subsequently evaluate the results of our study and finally conclude this work.
2. Related Works
2.1. Transfer Learning in Finance
Transfer learning focuses on producing an effective model for a target task with scarce training samples by transferring knowledge across different but related source domain(s) (Zhuang et al., 2019; Day and Khoshgoftaar, 2017). It is an active area of study in machine learning, enjoying success and widespread adoption in various applications (Do and Ng, 2005; Dai et al., 2007; Kornblith et al., 2019; Blumberg et al., 2019). Given the richness of the literature, numerous categorisation schemes have been established to distinguish the diverse yet interconnected strands of transfer learning research. For instance, the work in (Pan and Yang, 2010) states that depending on the availability of label information, problems in transfer learning can be categorised as transductive, inductive, and unsupervised222Inductive transfer learning refers to the scenario where labelled data is available for both the source and target domains. The labelled source data is available in transductive transfer learning, but the labelled target domain data is not. Finally, in unsupervised transfer learning, the label information is unavailable for both source and target domains.. Alternatively, depending on the source and target domains represented in similar feature or label spaces, transfer learning can be loosely classed as either homogeneous or heterogeneous (Zhuang et al., 2019). Using the schema in (Pan and Yang, 2010), transfer learning techniques divides into four groups: instance-based, feature-based, parameter-based, and relational-based approaches333Instance-based techniques are primarily based on the instance weighting strategy, while feature-based approaches construct a new representation from the original set of features. Parameter-based methods typically involve transferring knowledge at the model or parameter level. Lastly, relational-based techniques generally focus on relational problems and extract the rules or the logical relationship from the source for use in the target domain.. Despite these attempts to provide a comprehensive taxonomy of the research landscape, several terminology inconsistencies persist – for example, phrases such as domain adaptation and transfer learning are used interchangeably to refer to the same processes (Weiss et al., 2016). We point our readers to (Pan and Yang, 2010), (Weiss et al., 2016), and (Zhuang et al., 2019) for a better understanding of this broad field.
In the context of transfer learning for finance, most works focus on trading and employ an inductive approach with a parameter-based focus – incorporating the source architecture’s weights or model components into the target model to optimise learning the task of interest. In one of the earliest examples of transfer learning in finance, (Zhang et al., 2019) propose DeepLOB, a hybrid deep neural model that predicts stock price movements using high-frequency limit order data. The authors document DeepLOB’s ability to extract universal features by showing that it can successfully predict the direction of price movement of a target set of stocks that are not part of the source training set. (Nakagawa et al., 2020) develops the RIC-NN (Rank Information Coefficient Neural Net) – a multi-factor approach for stock price prediction using deep transfer learning. They demonstrate that the lower layers of the optimised model’s weights in one region (represented by MSCI North America) can initialise the same model for prediction in a different region (MSCI Asia Pacific). In a similar vein but taking on a broader coverage, (Koshiyama et al., 2021) propose QuantNet, which fuses information by training on different markets with a global bottleneck shared across multiple autoencoder-based architectures. The model then employs a separate decoder for each target market to generate market-specific trading strategies. The work in (Jeong and Kim, 2019) develops a deep Q-learning reinforcement learning trading agent that they combine with pre-trained weights to prevent over-fitting from insufficient financial data. Concentrating on financial time-series forecasting, (He et al., 2019) tackles the poor performance of training deep learning models on limited data with multi-source transfer learning. In a risk-management setting but utilising a similar pre-trained weights approach, (Suryanto et al., 2019) investigate the utility of knowledge transfer methods in evaluating credit risk.
Unlike earlier studies applying transfer learning to the problems in finance, ours differ in a few key aspects. Firstly, (Koshiyama et al., 2021) and (Nakagawa et al., 2020) primarily concentrate on transferring knowledge and do not address model overfitting. Additionally, while (Jeong and Kim, 2019) and (He et al., 2019) are closer in spirit to our work (i.e., they aim to alleviate overfitting that surfaces when calibrating on the target task with limited samples), both do not explicitly connect their research to momentum effects.
Although momentum effects have been documented on numerous asset classes (Asness et al., 2013; Menkhoff et al., 2012; Pirrong, 2005; Luu and Yu, 2012), and with numerous sophisticated prediction models developed to enhance the profitability of momentum-based strategies (Lim et al., 2019; Kim, 2019; Wood et al., 2022), the literature on pre-training these advanced models and applying them to settings where the dataset is small, is scarce. With cryptocurrencies, numerous studies (e.g., (Bellocca et al., 2022) and (Guo et al., 2022)) apply sophisticated machine learning for momentum-based trading. However, few, if any, explore augmenting these trading models by transferring knowledge from different datasets and examining their application over lower frequency settings, such as over weeks (which exacerbates the data scarcity problem). We address this deficiency in the research literature with our work in this paper.
2.2. Transfer Ranking
Transfer Ranking (TR) is defined as the application of transfer learning to LTR algorithms (Li, 2019; Liu, 2011). While a plethora of TR algorithms have been developed to address the extensive nature of ranking tasks (Chapelle et al., 2011), the primary objectives of these algorithms are essentially similar, i.e., to boost the ranking model’s accuracy on a new collection of items (which we refer to as the target or downstream dataset) by leveraging labelled data from another collection (source or upstream dataset) (Li, 2019). From the literature classification in (Li, 2019), TR techniques are either supervised or unsupervised, with each category further divided into homogeneous or heterogeneous depending on the similarity between the source and target feature spaces. Given that our work resembles model adaptation within the space of homogeneous supervised TR techniques, we review works related to this form and point the reader to (Li, 2019) for details on other setups.
Model adaptation TR concentrates on adapting the existing source model with a few labelled training data from the target collection. Most algorithms concentrating on this form treat the source ranker as a base model or exploit it as a feature for training (Li, 2019). These methods respectively resemble the parameter- and feature-based transfer learning methods in the scheme proposed by (Pan and Yang, 2010). The work in (Gao et al., 2009), for instance, explores two classes of model adaptation techniques for web search ranking: (i) model interpolation and (ii) error-driven learning approaches based on boosting. The first method learns an ensemble involving both source and target models; In the second, the authors propose LambdaBoost and LambdaSMART (Burges et al., 2008), which at each boosting iteration adapt the source model to target data (the former searches the space of finite basis functions, while the latter searches the space of regression trees). Other research directions involve calibrating the source model to better align with the target data. For example, (Chen et al., 2008) proposes Trada, which is a tree-based model that tunes both weights and splits based on a combination of source and target data. Trada is further improved by incorporating pairwise information to refine the model’s adaptation process (Bai et al., 2010). Lastly, (Wang et al., 2013) adopts a different approach by coefficient transformation. Concretely, the authors develop an algorithm that generates personalised results by learning a transformation matrix that manipulates the weights of a global ranker.
Surveying the literature surrounding model adaptation TR, solutions employing trees are common. This development is likely owing to their flexibility and robustness, which has been validated by the performant tree-boosting ranking algorithm, LambdaMART (Burges, 2010). While recent LTR breakthroughs, such as (Qin et al., 2021) and (Pobrotyn et al., 2020) provide clear evidence that transformer-based rankers can outperform their tree-based counterparts, we note a lack of models employing this architecture in TR. To this end, we propose the Fused Encoder Networks (FEN) – a novel and hybrid parameter-sharing transfer ranking model inspired by the Transformer. The FEN fuses and leverages information flexibly extracted by a pair of encoder-attention modules operating on both source and target domain data. With this design, the model inherits the advantages of self-attention and can account for dependencies across instruments at the loss level during training and inference time. By incorporating the components of the source model in the FEN model, the networks then determine the optimal combination of source and target information for the ranking task.
3. Problem Definition
This section formalises the problem setting. To get a better idea of the LTR framework as applied to cross-sectional momentum and how TR builds on top of LTR, please refer to the section titled Learning to Rank and Transfer Ranking in the Appendix.
3.1. Linking Returns and Model Formulation
Given a portfolio of cryptocurrencies that is rebalanced weekly, the returns for a cross-sectional momentum (CSM) strategy at week can be expressed as follows:
| (1) |
where refers to the portfolio’s realised returns over weeks to , denotes the number of cryptocurrencies and characterises the CSM signal or trading rule for instrument . We fix the annualised volatility target at 15% and scale returns with which is an estimator for ex-ante weekly volatility. The latter is computed as the rolling exponentially weighted standard deviation with a 26-week (approximately half a year) span on weekly returns.
The CSM signal in Equation (1) can be obtained using heuristics (Jegadeesh and Titman, 1993) or by minimising the empirical loss of some prediction model parameterised by :
| (2) |
With slight abuse of notation, we take each item to be a -sized real-valued feature vector. Since x is a list of items, we have . The training data is denoted as , where y is a list of bins for the same x sorted by realised returns for the next period. When the prediction model adopts a regress-then-rank approach such as those proposed in Gu et al. (2019) and Kim (2019), then the loss function is usually the pointwise MSE (mean squared error). With LTR models, pairwise and listwise losses that account for the mutual interaction among objects are usually used for .
3.2. Model Formulation under the Transfer Ranking Framework
With parameter-based transfer learning approaches, an upstream or source model is first trained on the source data. This process can be expressed as:
| (3) |
where the terms are respectively the prediction model, its parameter vector, and the associated dataset. The tuned upstream weights are then incorporated into the downstream or target model:
| (4) |
where adhering to the form laid out by Equation (2), refers to the ranking function parameterised by both source and target parameters , and is either a pairwise or listwise loss. In the final fine-tuning step, minimising the loss can be formulated as:
| (5) |
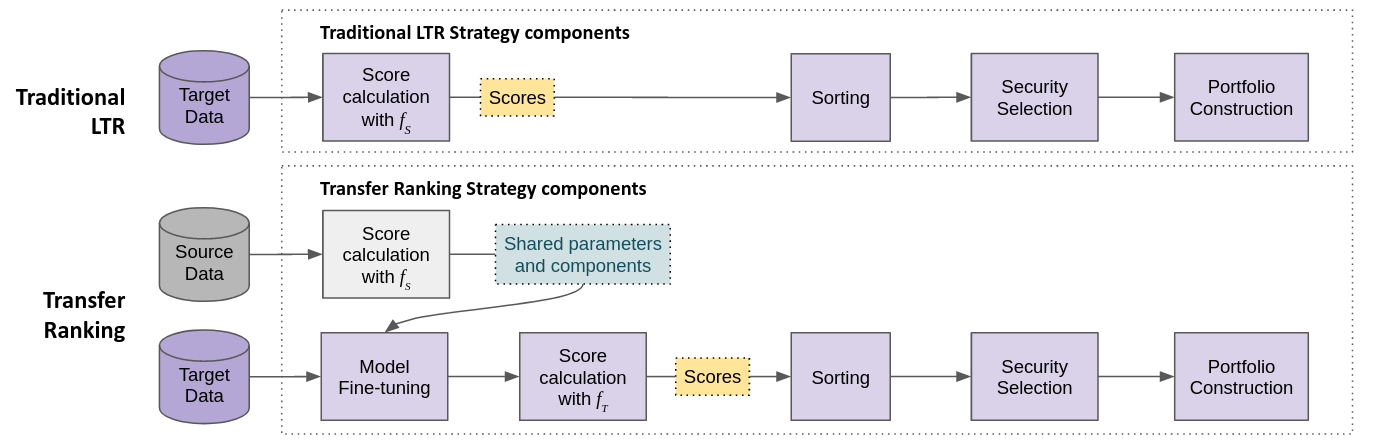
and denotes the subset of parameters within that is permitted to be fine-tuned. Using this final model, we compute ranking scores which we then sort and threshold to obtain the cross-sectional trading signal required for portfolio construction. Figure 1 visualises the TR pipeline and compares it to traditional LTR.
4. Fused Encoder Networks
Optimising the FEN (Fused Encoder Networks) involves training a source model on a larger dataset. The calibrated components are subsequently shared with the target model (i.e., FEN) as part of a broader framework. The following section provides vital details and explains how various components come together.
4.1. Source Model Architecture
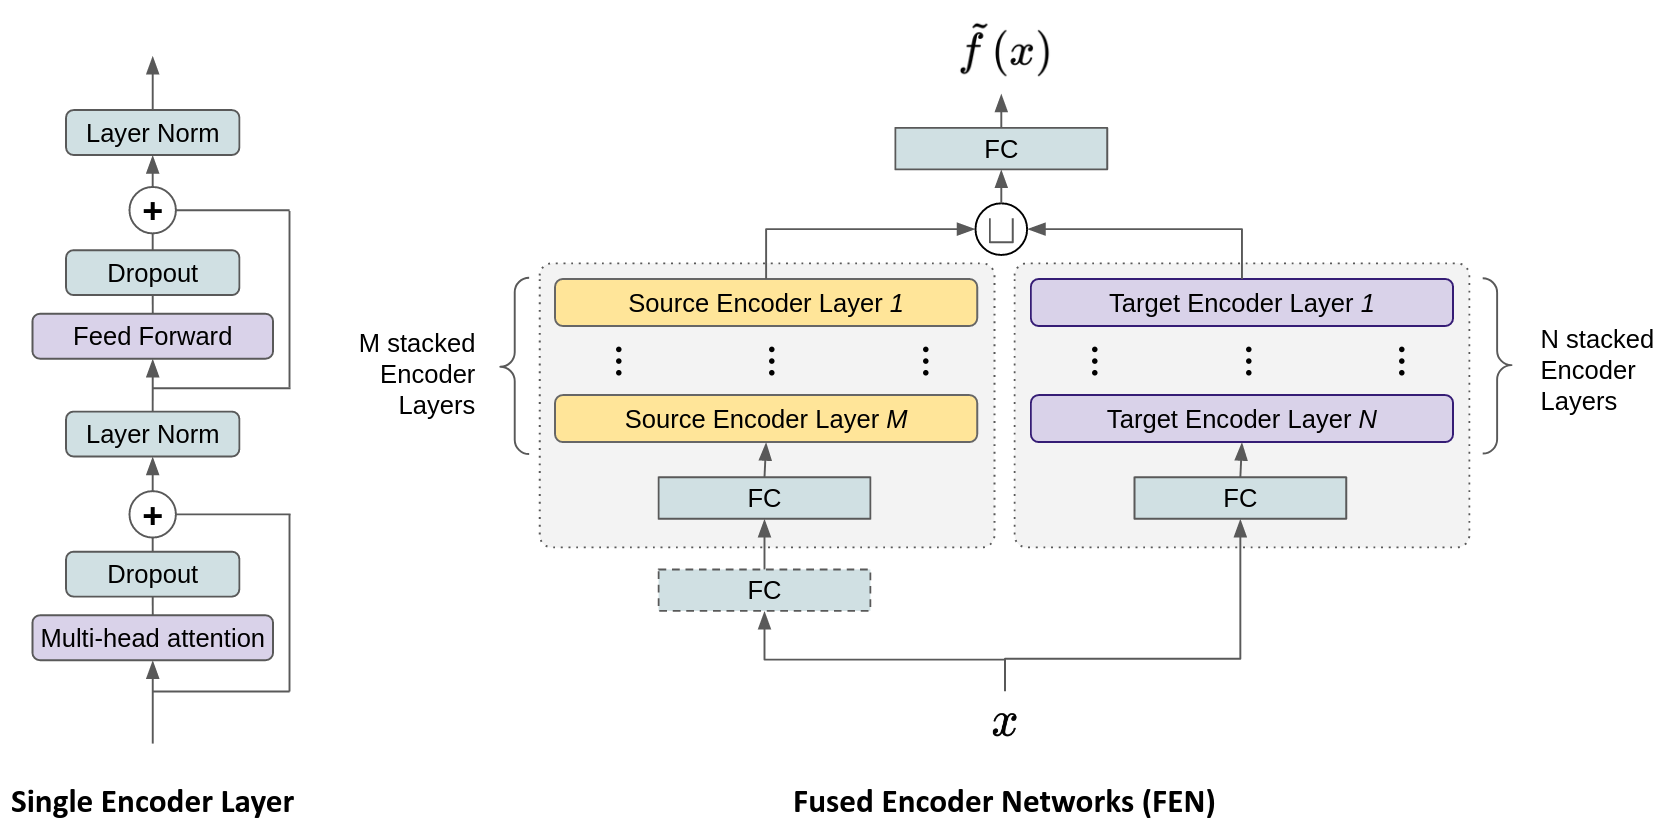
We use a stacked encoder block with a linear projection applied to inputs (similar to those used in Pobrotyn et al. (2020) and Poh et al. (2021)) as our source model. Each encoder within the stack is a composite layer housing the attention mechanism and a feed-forward network that enables it to learn higher-order feature representations. It is an essential component in both the source and target models (See left of Figure 2).
4.2. Feed-forward Network
This component introduces non-linearity via its ELU (Exponential Linear Unit) (Clevert et al., 2016) activation. It also facilitates interactions across different parts of its inputs.
4.3. Self-Attention and Multi-head Attention
The attention mechanism is a function that maps a query and a key-value pair to an output. While a few variants of attention exist, we use the form similar to that employed in the Transformer, which is the scaled dot-product attention followed by a softmax operation (Vaswani et al., 2017):
| (6) |
where Q, K and V are respectively the query, key and value matrices. In self-attention, the same inputs are used for all three matrices. Combining multiple attention units produces the multi-head attention module, which boosts the model’s capacity to learn representations:
| (7) | ||||
| (8) |
where in the above equations, each (out of heads) refers to the th attention mechanism of Equation (6), and learned parameter matrices:
where typically is used.
4.4. Stacking Encoder Layers
A single encoder block can be expressed as:
| (9) | ||||
| (10) | z |
where refers to the layer normalisation operation, a dropout function, and a projection onto a fully-connected layer respectively. Additionally, MHA represents the multi-head attention module. Stacking multiple encoder layers enables the model to learn more complex representations:
| (11) |
where in Equation (11) characterises a stacked encoder block involving a series of encoder layers.
4.5. Target Model Architecture
With conventional parameter-sharing techniques, if a neural model is used to learn the source task, then a target model can be constructed by directly retaining most of its layers (Zhuang et al., 2019). Motivated by the empirical superiority of context-aware LTR models using the attention mechanism over standard rankers (Pobrotyn et al., 2020; Poh et al., 2022), we utilise a hybrid approach – running the pre-trained source Transformer’s encoder block as an additional feature extractor operating in parallel with the target Transformer’s block :
| (12) | |||
| (13) |
where and are respectively the th and th encoder layer from the source and target model (See the right of Figure 2). Note the additional full-connected block with the dashed outline – this is optional and is used when the target and source inputs differ in dimensions. Against standard parameter-sharing methods, our setup has the additional advantage of being plug-and-play, allowing to be appended anywhere to any pre-trained network. The outputs from both encoder blocks are concatenated:
| (14) |
before projecting onto a fully connected layer to obtain our raw score predictions . Although we use a simple projection for simplicity, this can be replaced by more complex processing such as those that involve deep or cross networks (Wang et al., 2021b).
4.6. Loss Function
4.7. Target Model Fine-tuning
Deep networks can be fine-tuned in several ways. A straightforward approach is to optimise all the parameters of the model after initialising it with the pre-trained model’s parameters. Another method, driven by the findings that learned features transition from general to specific along a network (Long et al., 2015), concentrates on re-training only the last few layers while leaving the parameters of the remaining initial layers frozen (at their pre-trained values). There are also other methods, such as those proposed by Girshick et al. (2014) and Razavian et al. (2014). As the number of layers to freeze is a manual design choice that introduces unnecessary complexity, we do not freeze any layers and instead focus on re-training the entire model with a low learning rate.
5. Performance Evaluation Details
5.1. Dataset Overview
For actual performance evaluation, all models utilise daily closing prices obtained from CoinMarketCap (CoinMarketCap, 2022) further downsampled to the weekly frequency. Our universe is defined as the top 10 cryptocurrencies by market capitalisation as of the end of Dec-2019, with at least four years of price history. Given the limited size of the data, this selection ensures sufficient samples for model training and drawing meaningful inferences. We fix this set of cryptocurrencies from the end of Dec-2019 to the end of Dec-2021 to minimise the impact of survivorship bias. The complete data set thus runs from 1-Jan-2016 to 31-Dec-2021, with 2018 and 2021 being the first and last target test years respectively.
To train the source model needed for knowledge transfer, we make use of the same set of daily data relating to 30 currency pairs 444Indeed, it can be argued that other source data sets are more suitable for pre-training given the objective of this study. Returns on technology stocks might be one such example. We leave this for future research. as per Baz et al. (2015) and Poh et al. (2022) obtained from the Bank for International Settlements (BIS) (Bank for International Settlements, 2022) spanning May-2000 to Dec-2021 which we again downsample to the weekly frequency. To measure risk aversion, we use the daily close of the VIX historical data from the Cboe Global Markets (Cboe, 2022), where a week is labelled risk-off if it contains one or more days when the VIX is 5% higher than its 60-day moving average. A normal week is thus a non-risk-off week. For further details about the data, we refer the reader to Dataset Details in the Appendix.
5.2. Strategy and Predictor Descriptions
Our portfolios are rebalanced weekly. We construct an equally weighted long/short portfolio involving the top/bottom two cryptocurrencies as ranked by the model and calculate returns using Equation (1).
We note that there are also other approaches for constructing the cross-sectional portfolio. Within the cryptocurrency literature, our method resembles Tzouvanas et al. (2020), who forms a self-financed long/short strategy based on a risk-adjusted momentum portfolio. Given that volatility-scaling is a common feature in time-series momentum (Moskowitz et al., 2012; Baltas and Kosowski, 2012), it is plausible that our approach captures similar effects to this class of strategies. Liu et al. (2022) adopt a double-sort approach – first sorting based on market capitalisation, and then by three-week momentum. The final portfolios are located at the intersection of this two-step process and are traded without volatility-scaling. This approach resembles the momentum factor portfolio of Fama and French (2018) in the asset pricing research. Finally, in the equity literature, there is Jegadeesh and Titman (1993) who trade equally-weighted winner and loser decile portfolios with no risk scaling.
We use a simple set of returns-based features for predictors across both source and target models. The source model is trained with the following features:
-
(1)
Raw returns – Raw FX returns over the past 1, 2, 3, and 4 weeks, using the findings of Menkhoff et al. (2012).
-
(2)
Normalised returns – Raw FX returns over the previous 1, 2, 3, and 4 weeks standardised by weekly volatility scaled to the appropriate time scale.
For the target model, we again use both raw and normalised cryptocurrency returns but only over the past 1, 2, and 3 weeks as evidence of significant momentum returns in cryptocurrencies is mixed using a 1-month formation period (Tzouvanas et al., 2020).?? see www.packhacker.com
5.3. Models and Comparison Metrics
-
(1)
1-week Returns (1WR) – This is risk-adjusted momentum strategy based on the findings of Tzouvanas et al. (2020). Unlike the original approach, we do not form overlapping portfolios but instead construct weekly long/short portfolios based on returns over the previous week. The final portfolio is scaled to the desired target volatility.
-
(2)
Multi-Layer Perceptron (MLP) – Characterises the typical Regress-then-rank model used by contemporary strategies.
-
(3)
ListNet (LN) – Listwise Learning to Rank model proposed by Cao et al. (2007).
- (4)
-
(5)
Self-attention-based Ranker (SAR) – This benchmark uses the Transformer’s encoder module for ranking and is applied directly to the cryptocurrency data. The use of the encoder as a scoring function for LTR was proposed by Pobrotyn et al. (2020). With this approach, they establish state-of-the-art performance on the WEB30K LTR dataset555WEB30K or MSLR WEB30K (Microsoft Learning to Rank Datasets-30k) is a large scale dataset released by Microsoft that is used for researching and benchmarking LTR algorithms. and report substantial performance gains over the well-known and high performing LambdaMART. This idea was later applied to constructing cross-sectional strategies by Poh et al. (2022)666Unlike Poh et al. (2022), we use the variant without positional encodings as we are not performing re-ranking..
-
(6)
SAR with Parameter-Sharing (SAR+ps) – This involves pre-training the Transformer’s encoder module on the larger FX dataset and then fine-tuning on the target cryptocurrency set. Fine-tuning pre-trained models has been documented to be a valid and successful transfer learning approach for computer vision (Zhuang et al., 2019) and NLP (Devlin et al., 2019; Howard and Ruder, 2018) tasks.
-
(7)
Fused Encoder Networks (FEN) – The proposed model.
We assess the models over four key areas (profitability, riskiness, risk-adjusted performance, and ranking accuracy) with the following metrics:
-
•
Profitability: Expected returns () and Hit rate (percentage of positive returns at the portfolio level obtained over the out-of-sample period).
-
•
Risks: Volatility, Maximum Drawdown (MDD), and Downside Deviation.
-
•
Financial Performance: Sharpe , Sortino and Calmar ratios are used as a gauge to measure risk-adjusted performance. We also include the average profit divided by the average loss .
-
•
Ranking Performance: NDCG@2. This is based on the Normalised Discounted Cumulative Gain (NDCG) (Järvelin and Kekäläinen, 2000), a measure of graded relevance. We focus on assessing the NDCG of the top/bottom two cryptocurrencies, which are linked directly to strategy performance.
5.4. Training and Backtest Details
Benchmark Models:
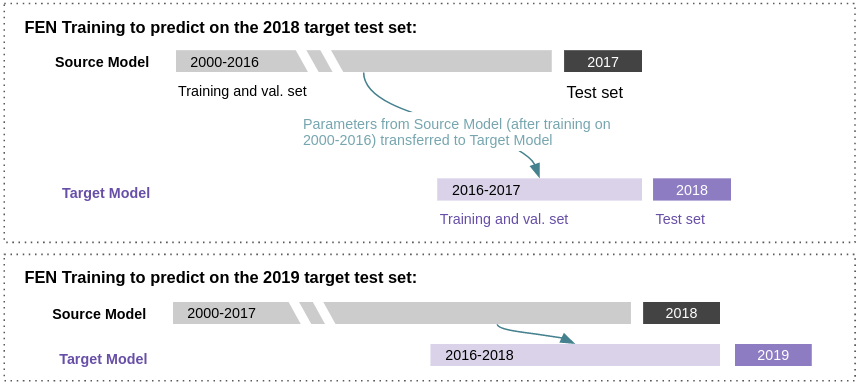
Except for 1WR and LM, all models are tuned with minibatch stochastic gradient descent with the Adam optimiser. All machine-learning-based models are calibrated using an expanding window approach in one-year blocks. Using the first iteration as an example: we retain 90% of the 2016-2017 period for training and use the remainder for cross-validation, with 2018 held out for testing. In the next iteration, the training set is expanded to include 2018 (i.e., 2016 to 2018), and the model is tested using 2019 (See also Figure 3). Backpropagation was conducted for a maximum of 100 epochs and with an expanding window approach, where 90% of a given training block is used for training and the remainder for validation. Early stopping was used to prevent over-fitting and is triggered when the validation loss does not improve for 25 epochs. Model hyperparameters were tuned over 50 iterations of search using HyperOpt (Bergstra et al., 2015).
Further details relating to model calibration can be found in Additional Training Details of the Appendix.
Fused Encoder Networks:
The FEN is optimised in three steps. The upstream model is first calibrated on the source FX data. This is performed with a one-year expanding window approach where we test our strategy on a given year and use all preceding samples for model tuning with a 90%/10% train/validation split. For the next year, we expand and shift the training and test periods respectively.
For the next step, the source model’s encoder block is transferred to the FEN and trained on the target data with the source block frozen. Like source model training, the FEN is trained using a single-year expanding window with a 90%/10% split. To minimise any detrimental effects arising from negative transfer, which is the case when the transferred source knowledge adversely impacts performance on the downstream task, we first proceed as follows: to generate predictions for each out-of-sample year on the target task, we produce ten runs of the source models evaluated on . We pick the source model with the highest Sharpe ratio and use it to train the target model (as we evaluate model performance (discussed later) based on ten runs, we pick the top 2 source models and go on to train five target models with each.). This process is illustrated in Figure 3. The consequences of transferring knowledge from models with the lowest Sharpe ratios can be found in Incorporating Knowledge from Sub-optimal Source Models in the Appendix.
The final fine-tuning phase optimises the unfrozen network with a very low learning rate – set as the smallest value in the search space for learning rates. The model is run for a maximum of 100 epochs and is stopped early if the validation loss fails to improve for ten epochs. We fine-tune only the FEN and SAR+ps. Further details can be found in Additional Training Details in the Appendix.
6. Results and Discussion
6.1. Trading Performance
| Benchmarks | Proposed | ||||||||
|---|---|---|---|---|---|---|---|---|---|
| 1WR | MLP | LN | LM | SAR | SAR+ps | FEN | |||
| E[returns] | 0.053 | 0.0800.043 | -0.0940.132 | 0.0760.109 | 0.0840.100 | -0.0060.074 | *0.1410.080 | ||
| Volatility | 0.221 | 0.2010.033 | 0.2110.087 | 0.2050.068 | *0.1760.015 | 0.1780.012 | 0.1870.012 | ||
| Sharpe Ratio | 0.238 | 0.4030.240 | -0.3970.539 | 0.4560.546 | 0.4960.583 | -0.0350.406 | *0.7490.410 | ||
| Sortino Ratio | 0.484 | 0.6920.436 | -0.4050.745 | 0.9431.061 | 0.9371.070 | 0.0280.597 | *1.5261.023 | ||
| Calmar Ratio | 0.190 | 0.3730.231 | -0.1090.364 | 0.4390.546 | 0.4540.543 | 0.0270.205 | *0.8280.543 | ||
| Downside Deviation | 0.109 | 0.1250.039 | 0.1730.098 | 0.1320.081 | 0.1150.029 | 0.1220.022 | *0.1020.017 | ||
| Max. Drawdown | 0.276 | 0.2480.084 | 0.4430.153 | 0.2850.115 | 0.2720.097 | 0.3560.113 | *0.1880.036 | ||
| Avg. Profit / Avg. Loss | *1.417 | 1.1750.155 | 0.8400.194 | 1.1720.239 | 1.1900.211 | 1.0680.187 | 1.3420.275 | ||
| Hit Rate | 0.435 | 0.4990.030 | 0.4810.035 | 0.5050.026 | 0.5000.029 | 0.4720.019 | *0.5090.031 | ||
Table 1 consolidates trading performance across the various strategies after ten runs777The results of 1WR are obtained after a single run as there is no stochastic training involved. All other models are based on ten runs. We produce ten source models for each ranker that use transfer learning, i.e., SAR+ps and FEN. With each set, we pick the top 2 ranked by the Sharpe ratio and train five target models with each. . While we compute the statistics here without transaction costs to focus on raw performance, we consider the impact of different cost assumptions later in Turnover Analysis. An additional layer of volatility scaling is applied at the portfolio level to facilitate comparison. Where applicable, each bold and asterisked figure indicate the best measurement across all models for its respective performance measures.
The statistics presented in Table 1 demonstrate the superiority of the FEN model – delivering an approximately threefold boosting of the Sharpe ratio relative to the heuristics-based 1WR and an improvement of about 50% versus the best benchmark (SAR). From a risk perspective, FEN is among the least volatile and possesses the lowest downside deviation and max drawdown figures. We also note that the instability associated with cryptocurrencies is reflected across all models running at levels higher than the 15% annual target.
Focusing on the reference baselines, SAR is the best model, while LN is the worst. While SAR’s performance is likely a result of its sophisticated underlying model, it is only marginally better than the tree-based LM. This observation is reasonable since SAR and LM have produced state-of-the-art results on different LTR tasks (Pobrotyn et al., 2020; Qin et al., 2021). Additionally, the consequence of over-fitting is reflected in LN’s results – which are significantly worse than the simpler 1WR model. While both SAR and SAR+ps share the same transformer-based architecture, the latter’s inferiority suggests that only relying on a network pre-trained on FX data is insufficient in the context of this work.
In FEN, the pre-trained network runs in parallel with the target encoder block. This setup leads to the model behaving like an ensemble of (potentially shallow) networks. Specifically, this setup avoids depending solely on the pre-trained module – which can be catastrophic for performance when affected by negative transfer (See Incorporating Knowledge from Sub-optimal Source Models in the Appendix) – and instead allows extracted features to be flexibly combined in a data-driven manner.
6.2. Ranking Performance
We assess ranking precision with the NDCG (Normalised Discounted Cumulative Gain), a popular measure in the IR literature, with higher values implying greater accuracy in sorting objects (to match some optimal ordering). Given that we trade the top/bottom quintile each time, we concentrate on the average NDCG@2 for long and short trades aggregated over all weekly rebalances. Table 2 indicates that the MLP can rank the most accurately based on this measure, and this is followed by FEN. Although better accuracy generally implies higher returns and Sharpe ratios as seen in Table 1, this does not hold for the MLP. This inconsistency can be resolved when we group FEN’s returns conditioned on the relative accuracy (over rebalances) of FEN against the MLP888The MLP has a higher average NDCG@2 than FEN for about 52% of the times when the portfolio is rebalanced.. By segmenting returns and accuracy in this manner, we observe that FEN is only slightly worse off returns-wise when it is less accurate than the MLP but generates considerably higher returns when it is more accurate – which explains its higher overall returns (and Sharpe ratio). These results are presented in Table 3.
| Benchmarks | Proposed | |||||||
| 1WR | MLP | LN | LM | SAR | SAR+ps | FEN | ||
| NDCG@2 | 0.5800.198 | *0.6150.007 | 0.5970.010 | 0.6010.007 | 0.6040.010 | 0.5940.007 | 0.6070.011 | |
| MLP more accurate | FEN more accurate | ||||
|---|---|---|---|---|---|
| MLP | FEN | MLP | FEN | ||
| NDCG@2 | 0.6480.115 | 0.5660.117 | 0.5760.108 | 0.6480.105 | |
| Avg. Returns | 0.0060.023 | 0.0000.020 | -0.0040.016 | 0.0060.014 | |
6.3. Attention Heatmap Patterns
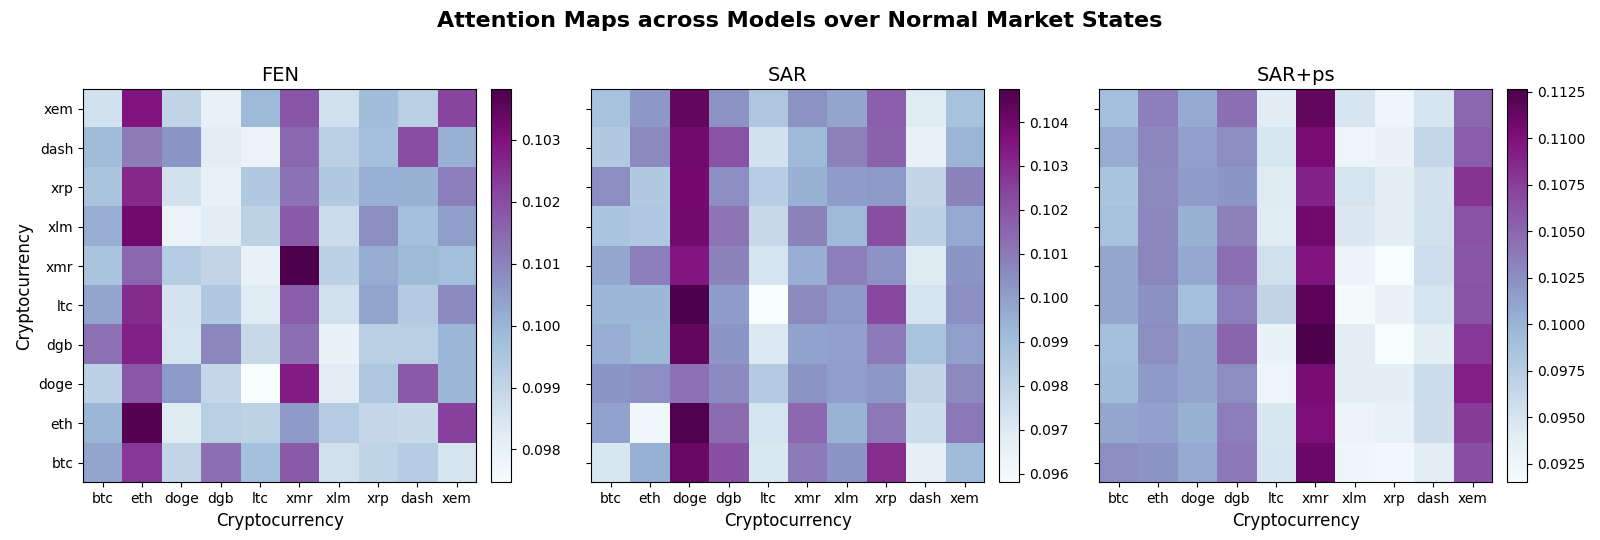
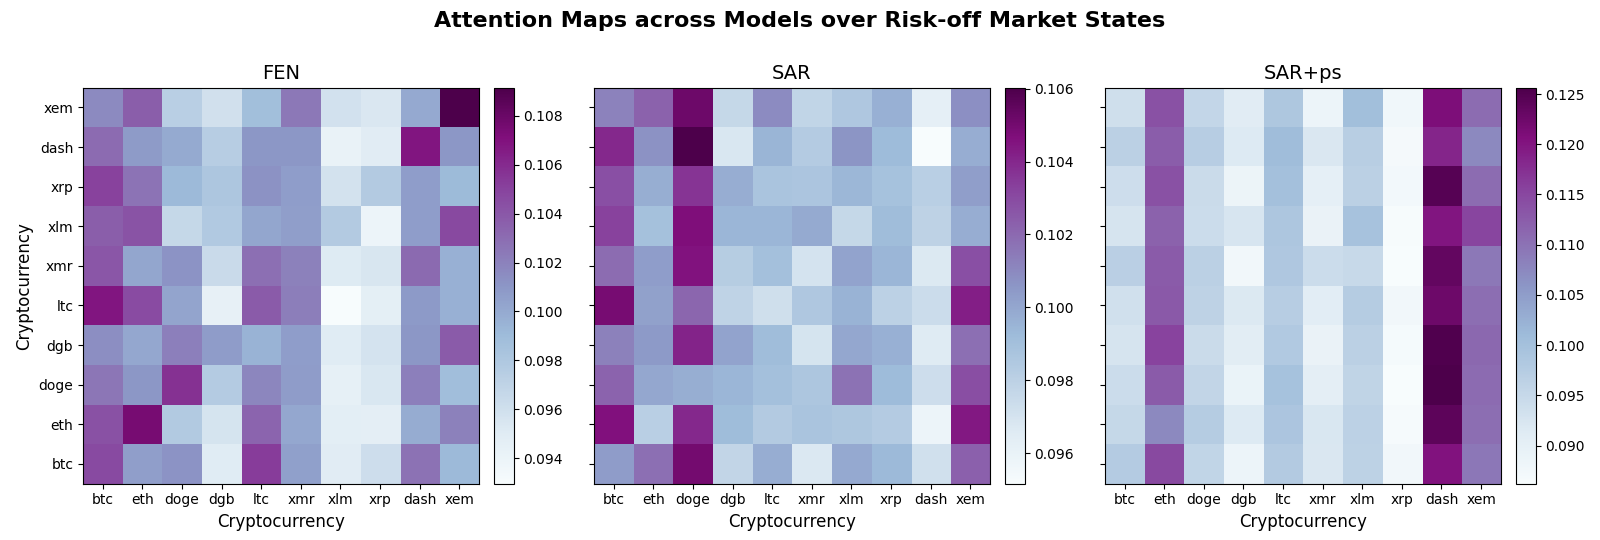
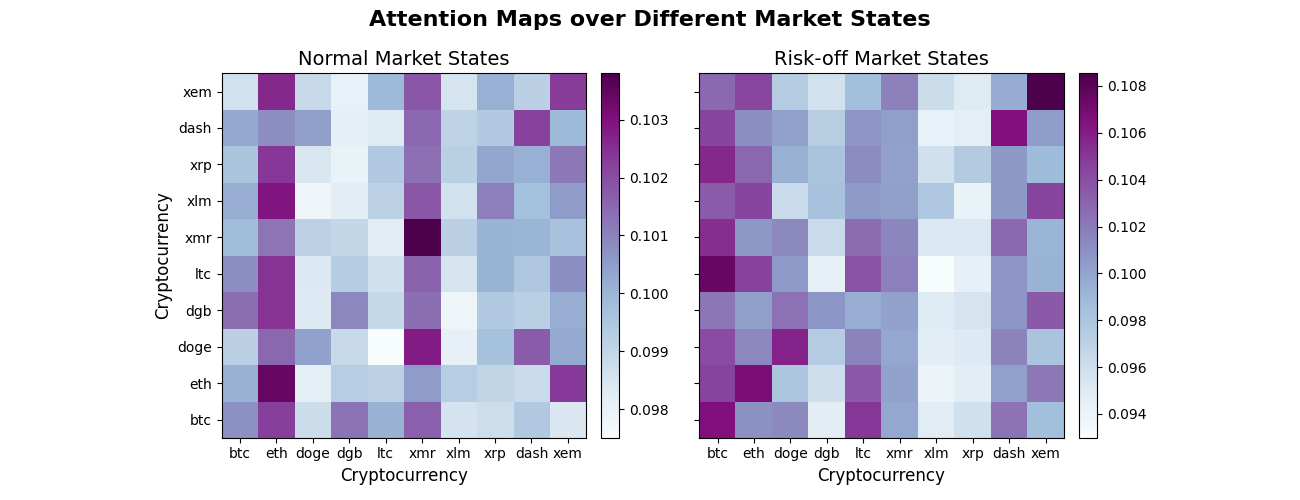
Attention is an integral part of various state-of-the-art Transformer-based architectures, providing these models with an effective way to model relationships by attending to relevant regions in the data. We examine the raw attention heatmaps of our proposed model to determine if this mechanism can learn helpful information. Specifically, we visualise the last attention layer of the model’s target encoder stack since deeper layers tend to capture high-level representation and global relationships (Pan et al., 2021). Against increasingly coupled markets, volatility spillovers have grown increasingly frequent such as risk transmission from the equity to cryptocurrency markets (Uzonwanne, 2021). Figure 4 depicts the aggregated heatmaps across normal and global risk-off regimes999We define a risk-off event at the weekly frequency as an instance when the daily VIX over any one or more days within the week is 5% points higher than its 60-day moving average, and all normal states are thus defined to be non-risk-off states. This definition classifies approximately 20% of the target dataset’s evaluation period as risk-off.. Darker cells correspond to larger weights which play a more significant role in the model’s prediction101010We also note that attention has been documented by Serrano and Smith (2019) to be a noisy indicator of a model inputs’ overall contribution to final prediction, and is not a fail-safe measure. Additionally, the heatmaps are not symmetric due to the softmax operator used in computing attention.. The heatmaps show that the darker cells are more dispersed in risk-off states since multiple instruments are affected. This pattern of dispersion is less evident over normal states and is likely due to idiosyncratic developments in the cryptocurrency markets.
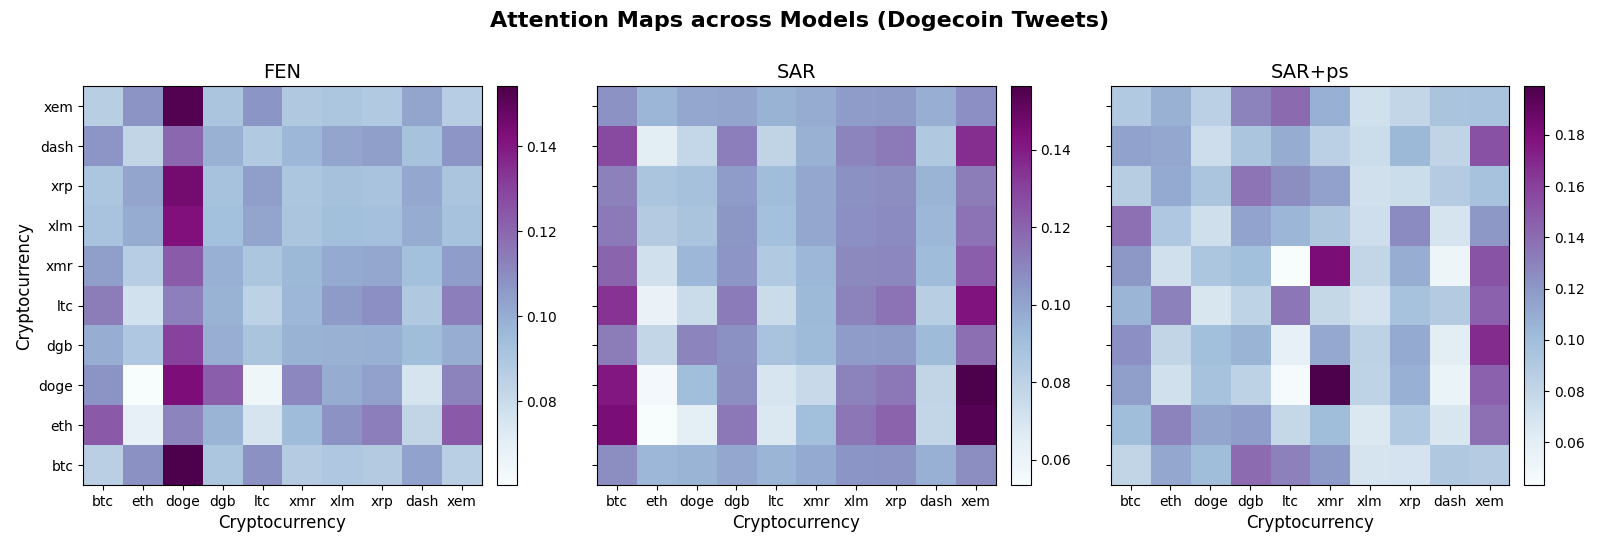
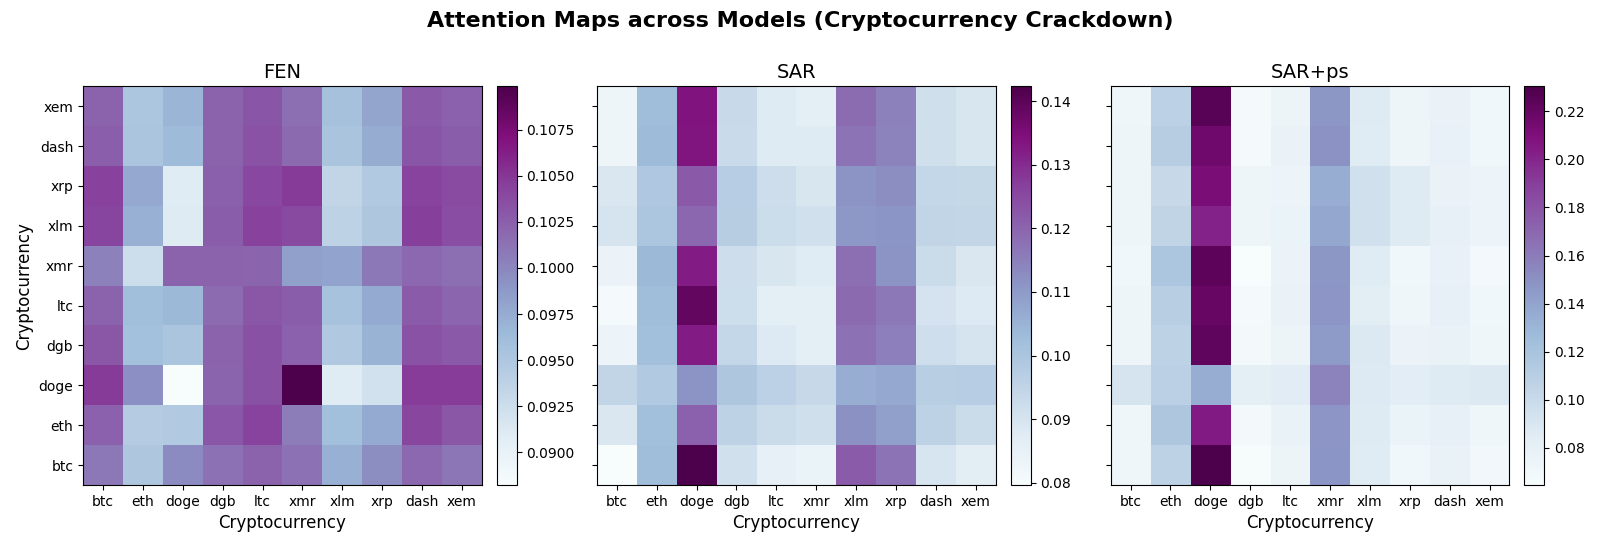
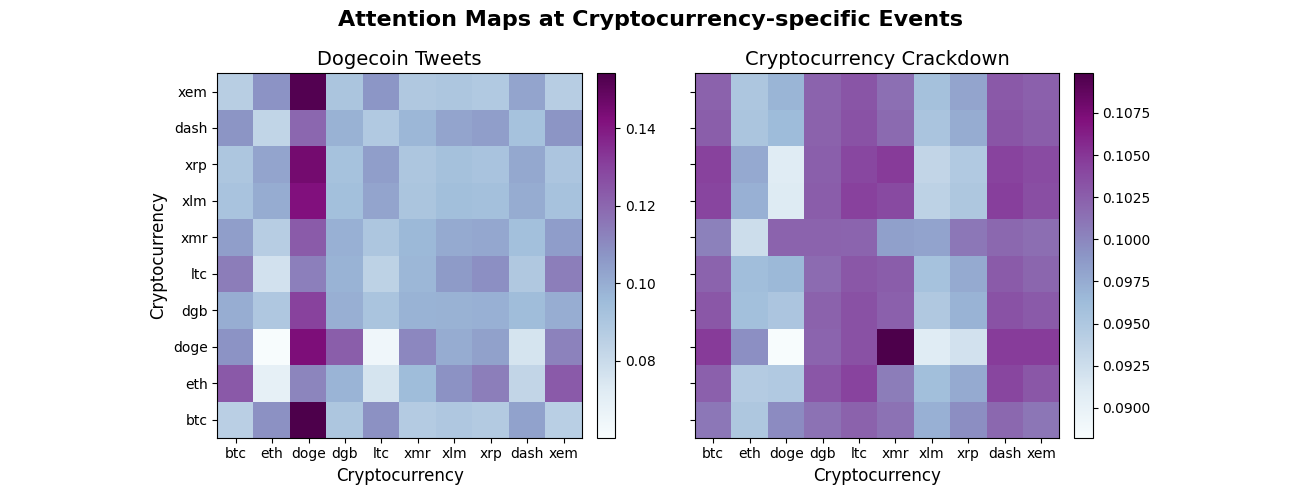
Beyond the impactful macro-level episodes that cause sharp changes to the VIX, we observe similar behaviour of the FEN’s attention mechanism at significant cryptocurrency-specific market events. In the left of Figure 5 for instance, a distinct darker column of cells over Dogecoin formed around Elon Musk’s tweet about the digital token (Westbrook and Wilson, 2021). On the right heatmap, the dispersed region of darker cells reflects the risk-off sentiments inherent in China’s regulators’ intent to crack down on the use of cryptocurrencies (Hale et al., 2021). These plots indicate that FEN’s attention module is responsive to market dynamics and is capable of learning valuable information. More importantly, it appears to possess an interpretable structure and provide an additional perspective that helps explain the model’s strong performance against other attention-based benchmarks. We refer the interested reader to the section titled Comparing Attention Heatmaps in the Appendix to see how the heatmaps of other models compare.
| Benchmarks | Proposed | ||||||||
| 1WR | MLP | LN | LM | SAR | SAR+ps | FEN | |||
| Turnover | 0.832 | 0.7100.030 | 0.7110.047 | 0.7870.018 | 0.6760.038 | 0.7150.053 | *0.6730.039 | ||
| Benchmarks | Proposed | ||||||
|---|---|---|---|---|---|---|---|
| Transaction Costs | 1WR | MLP | LM | SAR | FEN | ||
| 0 bps | 0.238 | 0.4030.240 | 0.4560.546 | 0.4960.583 | *0.7490.410 | ||
| 5 bps | 0.115 | 0.2730.248 | 0.3020.542 | 0.3600.580 | *0.6210.415 | ||
| 10 bps | -0.011 | 0.1440.257 | 0.1530.532 | 0.2250.576 | *0.4930.418 | ||
| 15 bps | -0.140 | 0.0160.267 | 0.110.515 | 0.0890.574 | *0.3660.422 | ||
| 20 bps | -0.271 | -0.1110.276 | -0.1340.506 | -0.0460.571 | *0.2380.425 | ||
| 25 bps | -0.404 | -0.2360.286 | -0.2830.504 | -0.1800.569 | *0.1110.429 | ||
| 30 bps | -0.538 | -0.3590.297 | -0.4330.504 | -0.3150.567 | *-0.0170.432 | ||
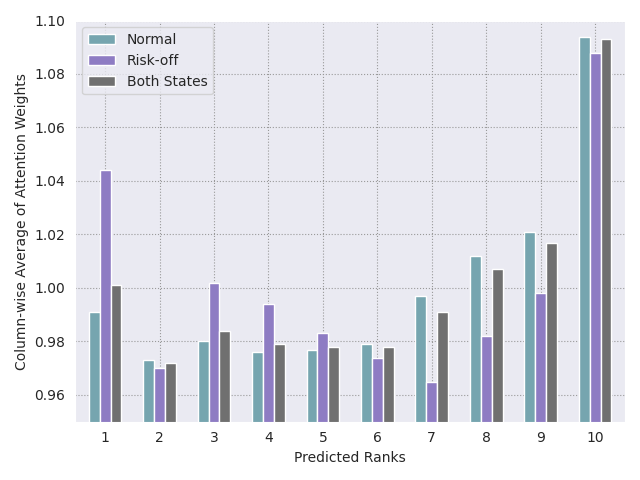
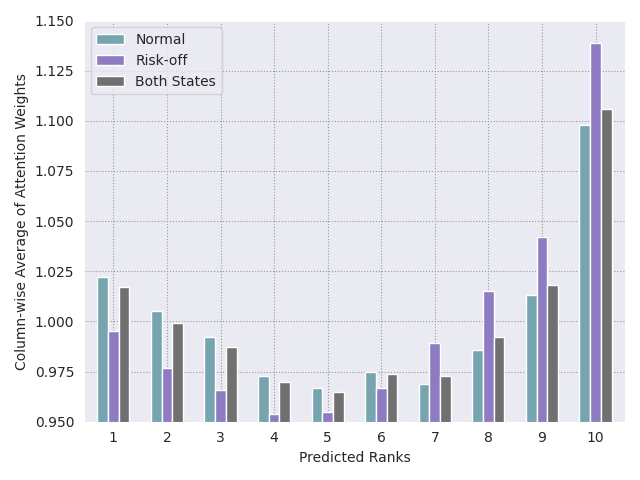
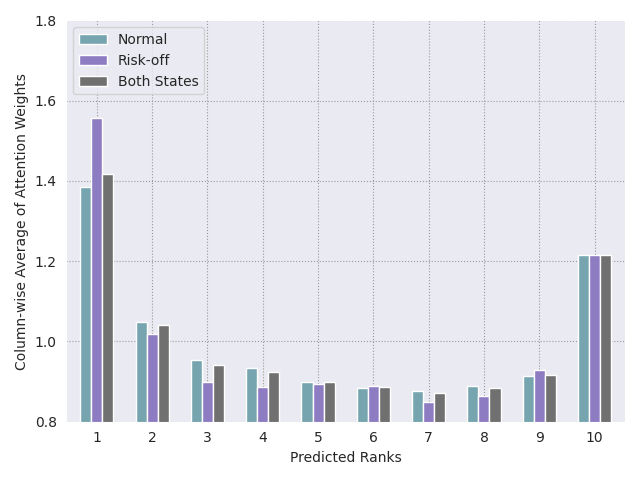
To further examine the link between attention values, predicted ranks, and eventual trading positions, we compute the column-wise averages111111 We compute column-wise averages as the softmax operation in Equation (6) is performed on each row of the matrix. Given this, if the model is paying more attention to a particular cryptocurrency, then the average of the heatmap cells in its column should register a higher value than the other column averages (For instance, refer to the discussion on the heatmap patterns formed around Elon Musk’s tweet about Dogecoin and also the left heatmap in Figure 5). of the attention heatmaps grouped by different market states and aggregated across all runs, with the final result presented in Figure 6. The histogram for each state has values that approximately follow a ’J’ shape. Higher averages for the upper and lower halves of the ranked list generally coincide with trading positions (long trades are labelled 9 and 10 on the horizontal axis, while shorts are 1 and 2), with the longs’ half of the histogram typically registering higher values. This pattern of higher weights near the ends of the ranked list is similarly observed in the other attention-based models SAR (Figure 11) and SAR+ps (Figure 12) – highlighting the close connection between attention, ranking outcomes, and, eventually, the traded positions generated by these models.
Before proceeding to the next section on turnover analysis, we highlight a limitation of the attention mechanism. Specifically, while it can pick up complex dependencies between the model’s input elements, it is computationally prohibitive – scaling quadratically with the length of the input sequence (Choromanski et al., 2021). Hence, directly using FEN on a broader cross-sectional slate of instruments will likely be challenging. To this end, a few workarounds have been proposed (Bello et al., 2019; Chan et al., 2020; Child et al., 2019; Gulati et al., 2020; Beltagy et al., 2020). We also note the recent work of Choromanski et al. (2021) who develop Performers, which is not just linear in both time and space complexities but can produce provably accurate estimates of softmax full-rank attention.
6.4. Turnover Analysis
To investigate the impact of transaction costs on strategy performance, we first compute the weekly portfolio turnover at period which we define as:
| (16) |
Table 4 shows the FEN model as among the strategies with the lowest average turnover over 2018-2021. To further examine and quantify the impact of transaction cost on performance, we also compute the ex-cost Sharpe ratios and present the results in Table 5. The figures show that FEN can deliver higher and positive cost-adjusted Sharpe ratios up to 29 bps – above the 26 bps per trade assumed for cryptocurrencies (Tzouvanas et al., 2020) and therefore demonstrating its suitability for trading these instruments.
7. Conclusion
We introduce Fused Encoder Networks (FEN) – a novel hybrid parameter-sharing transfer ranking model that overcomes the difficulties of constructing cross-sectional strathttps://www.ft.com/content/29d7826c-b591-4c02-aa13-d570f5629c11egies based on neural rankers to trade instruments with short histories. Using the popular momentum strategy applied to cryptocurrencies as a demonstrative use-case, we validate the effectiveness of our proposed approach. Concretely, the FEN surpasses the reference baselines, which include state-of-the-art LTR algorithms, on most performance measures – notably delivering an approximately threefold boosting of the Sharpe ratio over risk-adjusted momentum and a gain of approximately 50% over the best benchmark. Future work includes modifying various components of the original framework, such as introducing additional processing in the output head or replacing the listwise loss with other loss functions. Another direction is to explore transferring and synthesising knowledge from other/multiple source domains.
Acknowledgements.
We would like to thank the Oxford-Man Institute of Quantitative Finance for financial and computing support. SR is grateful for support from the Royal Academy of Engineering.References
- (1)
- Abadi et al. (2015) Martín Abadi, Ashish Agarwal, Paul Barham, Eugene Brevdo, Zhifeng Chen, Craig Citro, Greg S. Corrado, Andy Davis, Jeffrey Dean, Matthieu Devin, Sanjay Ghemawat, Ian Goodfellow, Andrew Harp, Geoffrey Irving, Michael Isard, Yangqing Jia, Rafal Jozefowicz, Lukasz Kaiser, Manjunath Kudlur, Josh Levenberg, Dandelion Mané, Rajat Monga, Sherry Moore, Derek Murray, Chris Olah, Mike Schuster, Jonathon Shlens, Benoit Steiner, Ilya Sutskever, Kunal Talwar, Paul Tucker, Vincent Vanhoucke, Vijay Vasudevan, Fernanda Viégas, Oriol Vinyals, Pete Warden, Martin Wattenberg, Martin Wicke, Yuan Yu, and Xiaoqiang Zheng. 2015. TensorFlow: Large-Scale Machine Learning on Heterogeneous Systems. https://www.tensorflow.org/ Software available from tensorflow.org.
- Asness et al. (2013) Clifford S. Asness, Tobias J. Moskowitz, and Lasse Pedersen. 2013. Value and Momentum Everywhere. Journal of Finance 68, 3 (2013), 929–985.
- Bai et al. (2010) Jing Bai, Fernando Diaz, Yi Chang, Zhaohui Zheng, and Keke Chen. 2010. Cross-market model adaptation with pairwise preference data for web search ranking. In Proceedings of the 23rd international conference on computational linguistics: Posters (COLING ’10). Association for Computational Linguistics, USA, 18–26. Number of pages: 9 Place: Beijing, China.
- Baltas and Kosowski (2012) Akindynos-Nikolaos Baltas and Robert Kosowski. 2012. Momentum Strategies in Futures Markets and Trend-following Funds. SSRN Electronic Journal (2012). https://doi.org/10.2139/ssrn.1968996
- Bank for International Settlements (2022) (BIS) Bank for International Settlements. 2022. US dollar exchange rates. Calculated (or Derived) based on BIS data. (2022). https://www.bis.org/statistics/xrusd.htm
- Baz et al. (2015) Jamil Baz, Nicolas M Granger, Campbell R. Harvey, Nicolas Le Roux, and Sandy Rattray. 2015. Dissecting Investment Strategies in the Cross Section and Time Series. SSRN Electronic Journal (2015). https://doi.org/10.2139/ssrn.2695101
- Bello et al. (2019) Irwan Bello, Barret Zoph, Quoc Le, Ashish Vaswani, and Jonathon Shlens. 2019. Attention Augmented Convolutional Networks. In 2019 IEEE/CVF International Conference on Computer Vision (ICCV). IEEE, Seoul, Korea (South), 3285–3294. https://doi.org/10.1109/ICCV.2019.00338
- Bellocca et al. (2022) Gian Pietro Bellocca, Giuseppe Attanasio, Luca Cagliero, and Jacopo Fior. 2022. Leveraging the momentum effect in machine learning-based cryptocurrency trading. Machine Learning with Applications 8 (2022), 100310. https://doi.org/10.1016/j.mlwa.2022.100310
- Beltagy et al. (2020) Iz Beltagy, Matthew E. Peters, and Arman Cohan. 2020. Longformer: The Long-Document Transformer. arXiv:2004.05150 [cs]
- Bergstra et al. (2015) James Bergstra, Brent Komer, Chris Eliasmith, Dan Yamins, and David D Cox. 2015. Hyperopt: A Python Library for Model Selection and Hyperparameter Optimization. Computational Science & Discovery 8, 1 (July 2015), 014008. https://doi.org/10.1088/1749-4699/8/1/014008
- Blumberg et al. (2019) Stefano B. Blumberg, Marco Palombo, Can Son Khoo, Chantal M. W. Tax, Ryutaro Tanno, and Daniel C. Alexander. 2019. Multi-stage Prediction Networks for Data Harmonization. In Medical Image Computing and Computer Assisted Intervention – MICCAI 2019, Dinggang Shen, Tianming Liu, Terry M. Peters, Lawrence H. Staib, Caroline Essert, Sean Zhou, Pew-Thian Yap, and Ali Khan (Eds.). Vol. 11767. Springer International Publishing, Cham, 411–419. https://doi.org/10.1007/978-3-030-32251-9_45 Series Title: Lecture Notes in Computer Science.
- Brigato and Iocchi (2020) Lorenzo Brigato and Luca Iocchi. 2020. A Close Look at Deep Learning with Small Data. In 25th International Conference on Pattern Recognition, ICPR 2020, Virtual Event / Milan, Italy, January 10-15, 2021. IEEE, 2490–2497. https://doi.org/10.1109/ICPR48806.2021.9412492
- Bruch et al. (2019) Sebastian Bruch, Masrour Zoghi, Michael Bendersky, and Marc Najork. 2019. Revisiting Approximate Metric Optimization in the Age of Deep Neural Networks. In Proceedings of the 42nd International ACM SIGIR Conference on Research and Development in Information Retrieval. ACM, Paris France, 1241–1244. https://doi.org/10.1145/3331184.3331347
- Burges (2010) Christopher J. C. Burges. 2010. From RankNet to LambdaRank to LambdaMART: An overview. Technical Report MSR-TR-2010-82. Microsoft Research. http://research.microsoft.com/en-us/um/people/cburges/tech_reports/MSR-TR-2010-82.pdf
- Burges et al. (2008) Chris J. C. Burges, Krysta M. Svore, Qiang Wu, and Jianfeng Gao. 2008. Ranking, boosting, and model adaptation. Technical Report MSR-TR-2008-109. 18 pages. https://www.microsoft.com/en-us/research/publication/ranking-boosting-and-model-adaptation/
- Cao et al. (2007) Zhe Cao, Tao Qin, Tie-Yan Liu, Ming-Feng Tsai, and Hang Li. 2007. Learning to rank: from pairwise approach to listwise approach. In Proceedings of the 24th international conference on Machine learning - ICML ’07. ACM Press, Corvalis, Oregon, 129–136. https://doi.org/10.1145/1273496.1273513
- Cboe (2022) Cboe Global Markets Cboe. 2022. VIX Historical Price Data. Calculated (or Derived) based on Cboe data. (2022). https://www.cboe.com/tradable_products/vix/vix_historical_data/
- Chan et al. (2020) William Chan, Chitwan Saharia, Geoffrey Hinton, Mohammad Norouzi, and Navdeep Jaitly. 2020. Imputer: Sequence Modelling via Imputation and Dynamic Programming. In Proceedings of the 37th International Conference on Machine Learning (ICML’20). JMLR.org, Article 131.
- Chapelle et al. (2011) Olivier Chapelle, Yi Chang, and Tie-Yan Liu. 2011. Future directions in learning to rank. In Proceedings of the learning to rank challenge (Proceedings of machine learning research, Vol. 14), Olivier Chapelle, Yi Chang, and Tie-Yan Liu (Eds.). PMLR, Haifa, Israel, 91–100. https://proceedings.mlr.press/v14/chapelle11b.html tex.pdf: http://proceedings.mlr.press/v14/chapelle11b/chapelle11b.pdf.
- Chapelle et al. (2010) Olivier Chapelle, Pannagadatta Shivaswamy, Srinivas Vadrevu, Kilian Weinberger, Ya Zhang, and Belle Tseng. 2010. Multi-task learning for boosting with application to web search ranking. In Proceedings of the 16th ACM SIGKDD international conference on Knowledge discovery and data mining - KDD ’10. ACM Press, Washington, DC, USA, 1189. https://doi.org/10.1145/1835804.1835953
- Chen et al. (2010) Depin Chen, Yan Xiong, Jun Yan, Gui-Rong Xue, Gang Wang, and Zheng Chen. 2010. Knowledge transfer for cross domain learning to rank. Information Retrieval 13, 3 (June 2010), 236–253. https://doi.org/10.1007/s10791-009-9111-2
- Chen et al. (2008) Keke Chen, Rongqing Lu, C. K. Wong, Gordon Sun, Larry Heck, and Belle Tseng. 2008. Trada: tree based ranking function adaptation. In Proceeding of the 17th ACM conference on Information and knowledge mining - CIKM ’08. ACM Press, Napa Valley, California, USA, 1143. https://doi.org/10.1145/1458082.1458233
- Chen and Guestrin (2016) Tianqi Chen and Carlos Guestrin. 2016. XGBoost: A Scalable Tree Boosting System. In Proceedings of the 22nd ACM SIGKDD International Conference on Knowledge Discovery and Data Mining (San Francisco, California, USA) (KDD ’16). ACM, New York, NY, USA, 785–794. https://doi.org/10.1145/2939672.2939785
- Child et al. (2019) Rewon Child, Scott Gray, Alec Radford, and Ilya Sutskever. 2019. Generating Long Sequences with Sparse Transformers. CoRR abs/1904.10509 (2019). arXiv:1904.10509
- Choromanski et al. (2021) Krzysztof Marcin Choromanski, Valerii Likhosherstov, David Dohan, Xingyou Song, Andreea Gane, Tamas Sarlos, Peter Hawkins, Jared Quincy Davis, Afroz Mohiuddin, Lukasz Kaiser, David Benjamin Belanger, Lucy J Colwell, and Adrian Weller. 2021. Rethinking Attention with Performers. In International Conference on Learning Representations.
- Clevert et al. (2016) Djork-Arné Clevert, Thomas Unterthiner, and Sepp Hochreiter. 2016. Fast and Accurate Deep Network Learning by Exponential Linear Units (ELUs). In 4th International Conference on Learning Representations, ICLR 2016, San Juan, Puerto Rico, May 2-4, 2016, Conference Track Proceedings, Yoshua Bengio and Yann LeCun (Eds.). http://arxiv.org/abs/1511.07289
- CoinMarketCap (2022) CoinMarketCap. 2022. Cryptocurrency Prices, Charts And Market Capitalizations — CoinMarketCap. Calculated (or Derived) based on CoinMarketCap data. (2022). https://coinmarketcap.com/
- Dai et al. (2007) Wenyuan Dai, Gui-Rong Xue, Qiang Yang, and Yong Yu. 2007. Co-clustering based classification for out-of-domain documents. In Proceedings of the 13th ACM SIGKDD international conference on Knowledge discovery and data mining - KDD ’07. ACM Press, San Jose, California, USA, 210. https://doi.org/10.1145/1281192.1281218
- Day and Khoshgoftaar (2017) Oscar Day and Taghi M. Khoshgoftaar. 2017. A survey on heterogeneous transfer learning. Journal of Big Data 4, 1 (Dec. 2017), 29. https://doi.org/10.1186/s40537-017-0089-0
- Devlin et al. (2019) Jacob Devlin, Ming-Wei Chang, Kenton Lee, and Kristina Toutanova. 2019. BERT: Pre-training of deep bidirectional transformers for language understanding. In Proceedings of the 2019 conference of the north american chapter of the association for computational linguistics: Human language technologies, NAACL-HLT 2019, minneapolis, MN, USA, june 2-7, 2019, volume 1 (long and short papers), Jill Burstein, Christy Doran, and Thamar Solorio (Eds.). Association for Computational Linguistics, 4171–4186. https://doi.org/10.18653/v1/n19-1423 tex.bibsource: dblp computer science bibliography, https://dblp.org tex.biburl: https://dblp.org/rec/conf/naacl/DevlinCLT19.bib tex.timestamp: Fri, 06 Aug 2021 00:41:31 +0200.
- Do and Ng (2005) Chuong B. Do and Andrew Y. Ng. 2005. Transfer learning for text classification. In Advances in neural information processing systems, Y. Weiss, B. Schölkopf, and J. Platt (Eds.), Vol. 18. MIT Press. https://proceedings.neurips.cc/paper/2005/file/bf2fb7d1825a1df3ca308ad0bf48591e-Paper.pdf
- Fama and French (2018) Eugene F. Fama and Kenneth R. French. 2018. Choosing Factors. Journal of Financial Economics 128, 2 (May 2018), 234–252. https://doi.org/10.1016/j.jfineco.2018.02.012
- Feng et al. (2021) Steven Feng, Varun Gangal, Jason Wei, Sarath Chandar, Soroush Vosoughi, Teruko Mitamura, and Eduard Hovy. 2021. A Survey of Data Augmentation Approaches for NLP. In Findings of the Association for Computational Linguistics: ACL-IJCNLP 2021. Association for Computational Linguistics, Online, 968–988. https://doi.org/10.18653/v1/2021.findings-acl.84
- Gao et al. (2009) Jianfeng Gao, Qiang Wu, Chris Burges, Krysta Svore, Yi Su, Nazan Khan, Shalin Shah, and Hongyan Zhou. 2009. Model adaptation via model interpolation and boosting for web search ranking. In Proceedings of the 2009 Conference on Empirical Methods in Natural Language Processing Volume 2 - EMNLP ’09, Vol. 2. Association for Computational Linguistics, Singapore, 505. https://doi.org/10.3115/1699571.1699578
- Gao et al. (2010) Wei Gao, Peng Cai, Kam-Fai Wong, and Aoying Zhou. 2010. Learning to rank only using training data from related domain. In Proceeding of the 33rd international ACM SIGIR conference on Research and development in information retrieval - SIGIR ’10. ACM Press, Geneva, Switzerland, 162. https://doi.org/10.1145/1835449.1835478
- Girshick et al. (2014) Ross Girshick, Jeff Donahue, Trevor Darrell, and Jitendra Malik. 2014. Rich feature hierarchies for accurate object detection and semantic segmentation. In Proceedings of the 2014 IEEE conference on computer vision and pattern recognition (CVPR ’14). IEEE Computer Society, USA, 580–587. https://doi.org/10.1109/CVPR.2014.81 Number of pages: 8.
- Gu et al. (2019) Shihao Gu, Bryan T. Kelly, and Dacheng Xiu. 2019. Autoencoder Asset Pricing Models. SSRN Electronic Journal (2019). https://doi.org/10.2139/ssrn.3335536
- Gulati et al. (2020) Anmol Gulati, James Qin, Chung-Cheng Chiu, Niki Parmar, Yu Zhang, Jiahui Yu, Wei Han, Shibo Wang, Zhengdong Zhang, Yonghui Wu, and Ruoming Pang. 2020. Conformer: Convolution-augmented Transformer for Speech Recognition. In Interspeech 2020, 21st Annual Conference of the International Speech Communication Association, Virtual Event, Shanghai, China, 25-29 October 2020, Helen Meng, Bo Xu, and Thomas Fang Zheng (Eds.). ISCA, 5036–5040. https://doi.org/10.21437/Interspeech.2020-3015
- Guo et al. (2022) Li Guo, Wolfgang Karl Härdle, and Yubo Tao. 2022. A Time-Varying Network for Cryptocurrencies. Journal of Business & Economic Statistics (Dec. 2022), 1–20. https://doi.org/10.1080/07350015.2022.2146695
- Hale et al. (2021) Thomas Hale, Tabby Kinder, and Philip Stafford. 2021. Bitcoin gyrates on fears of regulatory crackdown. Financial Times (May 2021). https://www.ft.com/content/c4c29bb3-c8ee-454c-a2dd-eac9f644007f
- He et al. (2019) Qi-Qiao He, Patrick Cheong-Iao Pang, and Yain-Whar Si. 2019. Transfer Learning for Financial Time Series Forecasting. In PRICAI 2019: Trends in Artificial Intelligence, Abhaya C. Nayak and Alok Sharma (Eds.). Vol. 11671. Springer International Publishing, Cham, 24–36. https://doi.org/10.1007/978-3-030-29911-8_3 Series Title: Lecture Notes in Computer Science.
- Howard and Ruder (2018) Jeremy Howard and Sebastian Ruder. 2018. Universal Language Model Fine-tuning for Text Classification. In Proceedings of the 56th Annual Meeting of the Association for Computational Linguistics (Volume 1: Long Papers). Association for Computational Linguistics, Melbourne, Australia, 328–339. https://doi.org/10.18653/v1/P18-1031
- Järvelin and Kekäläinen (2000) Kalervo Järvelin and Jaana Kekäläinen. 2000. IR Evaluation Methods for Retrieving Highly Relevant Documents. In Proceedings of the 23rd Annual International ACM SIGIR Conference on Research and Development in Information Retrieval - SIGIR ’00. ACM Press, Athens, Greece, 41–48. https://doi.org/10.1145/345508.345545
- Jegadeesh and Titman (1993) Narasimhan Jegadeesh and Sheridan Titman. 1993. Returns to Buying Winners and Selling Losers: Implications for Stock Market Efficiency. The Journal of Finance 48, 1 (March 1993), 65–91. https://doi.org/10.1111/j.1540-6261.1993.tb04702.x
- Jeong and Kim (2019) Gyeeun Jeong and Ha Young Kim. 2019. Improving financial trading decisions using deep Q-learning: Predicting the number of shares, action strategies, and transfer learning. Expert Systems with Applications 117 (March 2019), 125–138. https://doi.org/10.1016/j.eswa.2018.09.036
- Kim (2019) Saejoon Kim. 2019. Enhancing the momentum strategy through deep regression. Quantitative Finance 19, 7 (July 2019), 1121–1133. https://doi.org/10.1080/14697688.2018.1563707 tex.ids: kimEnhancingMomentumStrategy2019.
- Kolesnikov et al. (2020) Alexander Kolesnikov, Lucas Beyer, Xiaohua Zhai, Joan Puigcerver, Jessica Yung, Sylvain Gelly, and Neil Houlsby. 2020. Big Transfer (BiT): General Visual Representation Learning. In Computer Vision – ECCV 2020, Andrea Vedaldi, Horst Bischof, Thomas Brox, and Jan-Michael Frahm (Eds.). Vol. 12350. Springer International Publishing, Cham, 491–507. https://doi.org/10.1007/978-3-030-58558-7_29 Series Title: Lecture Notes in Computer Science.
- Kornblith et al. (2019) Simon Kornblith, Jonathon Shlens, and Quoc V. Le. 2019. Do Better ImageNet Models Transfer Better?. In 2019 IEEE/CVF Conference on Computer Vision and Pattern Recognition (CVPR). IEEE, Long Beach, CA, USA, 2656–2666. https://doi.org/10.1109/CVPR.2019.00277
- Koshiyama et al. (2021) Adriano Koshiyama, Stefano B. Blumberg, Nick Firoozye, Philip Treleaven, and Sebastian Flennerhag. 2021. QuantNet: transferring learning across trading strategies. Quantitative Finance (Dec. 2021), 1–20. https://doi.org/10.1080/14697688.2021.1999487
- Li (2011) Hang Li. 2011. Learning to Rank for Information Retrieval and Natural Language Processing. Synthesis Lectures on Human Language Technologies 4, 1 (April 2011), 1–113. https://doi.org/10.2200/S00348ED1V01Y201104HLT012
- Li (2019) Pengfei Li. 2019. Transfer learning for information retrieval. Ph.D. Dissertation. RMIT University.
- Li et al. (2020) Pengfei Li, Mark Sanderson, Mark Carman, and Falk Scholer. 2020. Self-labeling methods for unsupervised transfer ranking. Information Sciences 516 (April 2020), 293–315. https://doi.org/10.1016/j.ins.2019.12.067
- Lim et al. (2019) Bryan Lim, Stefan Zohren, and Stephen Roberts. 2019. Enhancing Time Series Momentum Strategies Using Deep Neural Networks. SSRN Electronic Journal (2019). https://doi.org/10.2139/ssrn.3369195
- Liu (2011) Tie-Yan Liu. 2011. Transfer Ranking. In Learning to Rank for Information Retrieval. Springer Berlin Heidelberg, Berlin, Heidelberg, 127–130. https://doi.org/10.1007/978-3-642-14267-3_9
- Liu et al. (2022) Yukun Liu, Aleh Tsyvinski, and Xi Wu. 2022. Common Risk Factors in Cryptocurrency. The Journal of Finance 77, 2 (2022), 1133–1177. https://doi.org/10.1111/jofi.13119
- Long et al. (2015) Mingsheng Long, Yue Cao, Jianmin Wang, and Michael I. Jordan. 2015. Learning transferable features with deep adaptation networks. In Proceedings of the 32nd international conference on international conference on machine learning - volume 37 (ICML’15). JMLR.org, 97–105. Place: Lille, France Number of pages: 9.
- Luu and Yu (2012) Bac Van Luu and Peiyi Yu. 2012. Momentum in Government-Bond Markets. The Journal of Fixed Income 22, 2 (Sept. 2012), 72–79. https://doi.org/10.3905/jfi.2012.22.2.072
- Menkhoff et al. (2012) Lukas Menkhoff, Lucio Sarno, Maik Schmeling, and Andreas Schrimpf. 2012. Currency momentum strategies. Journal of Financial Economics 106, 3 (Dec. 2012), 660–684. https://doi.org/10.1016/j.jfineco.2012.06.009
- Moskowitz et al. (2012) Tobias J. Moskowitz, Yao Hua Ooi, and Lasse Heje Pedersen. 2012. Time Series Momentum. Journal of Financial Economics 104, 2 (May 2012), 228–250. https://doi.org/10.1016/j.jfineco.2011.11.003
- Nakagawa et al. (2020) Kei Nakagawa, Masaya Abe, and Junpei Komiyama. 2020. A Robust Transferable Deep Learning Framework for Cross-sectional Investment Strategy. 2020 IEEE 7th International Conference on Data Science and Advanced Analytics (DSAA) (Oct. 2020), 370–379. https://doi.org/10.1109/DSAA49011.2020.00051 arXiv: 1910.01491.
- Pan and Yang (2010) Sinno Jialin Pan and Qiang Yang. 2010. A Survey on Transfer Learning. IEEE Transactions on Knowledge and Data Engineering 22, 10 (Oct. 2010), 1345–1359. https://doi.org/10.1109/TKDE.2009.191 Conference Name: IEEE Transactions on Knowledge and Data Engineering.
- Pan et al. (2021) Zizheng Pan, Bohan Zhuang, Haoyu He, Jing Liu, and Jianfei Cai. 2021. Less is More: Pay Less Attention in Vision Transformers. http://arxiv.org/abs/2105.14217 Number: arXiv:2105.14217 arXiv:2105.14217 [cs].
- Pei et al. (2019) Changhua Pei, Yi Zhang, Yongfeng Zhang, Fei Sun, Xiao Lin, Hanxiao Sun, Jian Wu, Peng Jiang, and Wenwu Ou. 2019. Personalized Re-ranking for Recommendation. arXiv:1904.06813 [cs] (July 2019). http://arxiv.org/abs/1904.06813 arXiv: 1904.06813.
- Pirrong (2005) Craig Pirrong. 2005. Momentum in Futures Markets. SSRN Electronic Journal (2005). https://doi.org/10.2139/ssrn.671841
- Pobrotyn et al. (2020) Przemysław Pobrotyn, Tomasz Bartczak, Mikołaj Synowiec, Radosław Białobrzeski, and Jarosław Bojar. 2020. Context-Aware Learning to Rank with Self-Attention. In arXiv:2005.10084 [cs] (SIGIR eCom ’20). Virtual Event China. http://arxiv.org/abs/2005.10084 arXiv: 2005.10084.
- Poh et al. (2021) Daniel Poh, Bryan Lim, Stefan Zohren, and Stephen Roberts. 2021. Building Cross-Sectional Systematic Strategies by Learning to Rank. The Journal of Financial Data Science (March 2021), 70–86. https://doi.org/10.3905/jfds.2021.1.060
- Poh et al. (2022) Daniel Poh, Bryan Lim, Stefan Zohren, and Stephen Roberts. 2022. Enhancing Cross-Sectional Currency Strategies by Context-Aware Learning to Rank with Self-Attention. arXiv:2105.10019 [cs, q-fin] (Jan. 2022). http://arxiv.org/abs/2105.10019 arXiv: 2105.10019.
- Qin et al. (2021) Zhen Qin, Le Yan, Honglei Zhuang, Yi Tay, Rama Kumar Pasumarthi, Xuanhui Wang, Mike Bendersky, and Marc Najork. 2021. Are neural rankers still outperformed by gradient boosted decision trees?. In International conference on learning representations (ICLR).
- Razavian et al. (2014) Ali Sharif Razavian, Hossein Azizpour, Josephine Sullivan, and Stefan Carlsson. 2014. CNN Features Off-the-Shelf: An Astounding Baseline for Recognition. In 2014 IEEE Conference on Computer Vision and Pattern Recognition Workshops. 512–519. https://doi.org/10.1109/CVPRW.2014.131 ISSN: 2160-7516.
- Serrano and Smith (2019) Sofia Serrano and Noah A. Smith. 2019. Is Attention Interpretable?. In Proceedings of the 57th Annual Meeting of the Association for Computational Linguistics. Association for Computational Linguistics, Florence, Italy, 2931–2951. https://doi.org/10.18653/v1/P19-1282
- Shen et al. (2021) Zhiqiang Shen, Zechun Liu, Jie Qin, Marios Savvides, and Kwang-Ting Cheng. 2021. Partial is better than all: Revisiting fine-tuning strategy for few-shot learning. In Thirty-fifth AAAI conference on artificial intelligence, AAAI 2021, thirty-third conference on innovative applications of artificial intelligence, IAAI 2021, the eleventh symposium on educational advances in artificial intelligence, EAAI 2021, virtual event, february 2-9, 2021. AAAI Press, 9594–9602. https://ojs.aaai.org/index.php/AAAI/article/view/17155 tex.bibsource: dblp computer science bibliography, https://dblp.org tex.biburl: https://dblp.org/rec/conf/aaai/ShenLQSC21.bib tex.timestamp: Sat, 05 Jun 2021 18:11:55 +0200.
- Shorten and Khoshgoftaar (2019) Connor Shorten and Taghi M. Khoshgoftaar. 2019. A survey on Image Data Augmentation for Deep Learning. Journal of Big Data 6, 1 (Dec. 2019), 60. https://doi.org/10.1186/s40537-019-0197-0
- Suryanto et al. (2019) Hendra Suryanto, Charles Guan, Andrew Voumard, and Ghassan Beydoun. 2019. Transfer learning in credit risk. In Machine learning and knowledge discovery in databases - european conference, ECML PKDD 2019, würzburg, germany, september 16-20, 2019, proceedings, part III (Lecture notes in computer science, Vol. 11908), Ulf Brefeld, Élisa Fromont, Andreas Hotho, Arno J. Knobbe, Marloes H. Maathuis, and Céline Robardet (Eds.). Springer, 483–498. https://doi.org/10.1007/978-3-030-46133-1_29 tex.bibsource: dblp computer science bibliography, https://dblp.org tex.biburl: https://dblp.org/rec/conf/pkdd/SuryantoGVB19.bib tex.timestamp: Fri, 22 May 2020 21:56:37 +0200.
- Tzouvanas et al. (2020) Panagiotis Tzouvanas, Renatas Kizys, and Bayasgalan Tsend-Ayush. 2020. Momentum trading in cryptocurrencies: Short-term returns and diversification benefits. Economics Letters 191 (June 2020), 108728. https://doi.org/10.1016/j.econlet.2019.108728
- Uzonwanne (2021) Godfrey Uzonwanne. 2021. Volatility and return spillovers between stock markets and cryptocurrencies. The Quarterly Review of Economics and Finance 82 (Nov. 2021), 30–36. https://doi.org/10.1016/j.qref.2021.06.018
- Vaswani et al. (2017) Ashish Vaswani, Noam Shazeer, Niki Parmar, Jakob Uszkoreit, Llion Jones, Aidan N. Gomez, undefinedukasz Kaiser, and Illia Polosukhin. 2017. Attention is all you need. In Proceedings of the 31st international conference on neural information processing systems (NIPS’17). Curran Associates Inc., Red Hook, NY, USA, 6000–6010. Number of pages: 11 Place: Long Beach, California, USA.
- Wang et al. (2013) Hongning Wang, Xiaodong He, Ming-Wei Chang, Yang Song, Ryen W. White, and Wei Chu. 2013. Personalized ranking model adaptation for web search. In Proceedings of the 36th international ACM SIGIR conference on Research and development in information retrieval. ACM, Dublin Ireland, 323–332. https://doi.org/10.1145/2484028.2484068
- Wang et al. (2021a) Jindong Wang, Cuiling Lan, Chang Liu, Yidong Ouyang, Tao Qin, Wang Lu, Yiqiang Chen, Wenjun Zeng, and Philip S. Yu. 2021a. Generalizing to Unseen Domains: A Survey on Domain Generalization. arXiv:2103.03097 [cs] (Dec. 2021). http://arxiv.org/abs/2103.03097 arXiv: 2103.03097.
- Wang and Rasheed (2018) Liang Wang and Khaled Rasheed. 2018. Stock ranking with market microstructure, technical indicator and news. In Proceedings on the international conference on artificial intelligence (ICAI). 322–328. https://csce.ucmss.com/cr/books/2018/LFS/CSREA2018/ICA3687.pdf tex.organization: The Steering Committee of The World Congress in Computer Science, Computer ….
- Wang et al. (2021b) Ruoxi Wang, Rakesh Shivanna, Derek Cheng, Sagar Jain, Dong Lin, Lichan Hong, and Ed Chi. 2021b. DCN V2: Improved deep & cross network and practical lessons for web-scale learning to rank systems. In Proceedings of the web conference 2021 (WWW ’21). Association for Computing Machinery, New York, NY, USA, 1785–1797. https://doi.org/10.1145/3442381.3450078 Number of pages: 13 Place: Ljubljana, Slovenia.
- Wang et al. (2021c) Yaqing Wang, Quanming Yao, James T. Kwok, and Lionel M. Ni. 2021c. Generalizing from a Few Examples: A Survey on Few-shot Learning. Comput. Surveys 53, 3 (May 2021), 1–34. https://doi.org/10.1145/3386252
- Weiss et al. (2016) Karl Weiss, Taghi M. Khoshgoftaar, and DingDing Wang. 2016. A survey of transfer learning. Journal of Big Data 3, 1 (Dec. 2016), 9. https://doi.org/10.1186/s40537-016-0043-6
- Westbrook and Wilson (2021) Tom Westbrook and Tom Wilson. 2021. Musk tweets, dogecoin leaps and bitcoin retreats. Reuters (May 2021). https://www.reuters.com/technology/dogecoin-pops-after-musk-tweets-about-promising-system-improvements-2021-05-13/
- Wood et al. (2022) Kieran Wood, Stephen Roberts, and Stefan Zohren. 2022. Slow Momentum with Fast Reversion: A Trading Strategy Using Deep Learning and Changepoint Detection. The Journal of Financial Data Science 4, 1 (Jan. 2022), 111–129. https://doi.org/10.3905/jfds.2021.1.081
- Xia et al. (2008) Fen Xia, Tie-Yan Liu, Jue Wang, Wensheng Zhang, and Hang Li. 2008. Listwise approach to learning to rank: Theory and algorithm. In Proceedings of the 25th international conference on machine learning (ICML ’08). Association for Computing Machinery, New York, NY, USA, 1192–1199. https://doi.org/10.1145/1390156.1390306 Number of pages: 8 Place: Helsinki, Finland.
- Zhang et al. (2019) Zihao Zhang, Stefan Zohren, and Stephen Roberts. 2019. DeepLOB: Deep Convolutional Neural Networks for Limit Order Books. IEEE Transactions on Signal Processing 67, 11 (June 2019), 3001–3012. https://doi.org/10.1109/TSP.2019.2907260 arXiv:1808.03668 [q-fin].
- Zhuang et al. (2019) Fuzhen Zhuang, Zhiyuan Qi, Keyu Duan, Dongbo Xi, Yongchun Zhu, Hengshu Zhu, Hui Xiong, and Qing He. 2019. A comprehensive survey on transfer learning. CoRR abs/1911.02685 (2019). http://arxiv.org/abs/1911.02685 arXiv: 1911.02685 tex.bibsource: dblp computer science bibliography, https://dblp.org tex.biburl: https://dblp.org/rec/journals/corr/abs-1911-02685.bib tex.timestamp: Sat, 29 Aug 2020 18:19:14 +0200.
Appendix A Learning to Rank and Transfer Ranking
A.1. Learning to Rank for Cross-Sectional Momentum
Learning to Rank (LTR) is a supervised learning problem where the goal is to sort a list of objects to maximise some measure of utility (e.g., discounted cumulative gain). For training, we are presented with a set of dates where at each we have instruments . We also have a corresponding set of quintiles of realised returns from the next period that have been assigned based on an ascending sort. Here, where . Additionally, where stands for the order relation. In other words, instruments possessing higher realised returns are assigned higher quintiles. With each rebalance-instrument pair at period , a feature vector can be formed, noting that characterises the feature function and that . Letting , we can go on to form the broader training set . The goal of LTR is to learn a function that predicts a score at the Score Calculation phase (refer to the Traditional LTR pipeline in Figure 1) when presented with an out-of-sample input . For more details, we point the reader to Poh et al. (2021) and Li (2011).
A.2. From Learning to Rank to Transfer Ranking
Transfer Ranking (TR) builds on top of the LTR framework. A domain consists of a feature space and a marginal distribution , i.e., . represents an instance set and is defined as . A task is composed of a label space and a decision function , so . The decision function is learned from the data. Using these definitions, the goal of LTR for CSM in the preceding section can be expressed as learning the ranking function in over some domain of interest . The feature space and instance set are represented by and respectively. A single instance at period is given as where .
In the TR setting, we are given observations corresponding to source domains and tasks, i.e., as well as observations about target domains and tasks, i.e., . TR aims to exploit the knowledge embedded in the source domains to enhance the performance of the learned decision functions on the target domains. In this work, we focus on . Specifically, we want to enhance the performance of , which is the scoring function for cryptocurrencies, by incorporating knowledge extracted from the FX dataset . This is achieved by sharing the parameters of the calibrated with as described in Problem Definition.
Appendix B Dataset Details
B.1. Source Dataset
Our source dataset is composed of 31 currencies all expressed versus the USD over the period 2-May-2000 to 31-Dec-2021. We make use of this data to train the upstream model required for knowledge transfer. The full list of currencies is as follows:
-
•
G10: AUD, CAD, CHF, EUR, GBP, JPY, NOK, NZD, SEK, USD
-
•
EM Asia: HKD, INR, IDR, KRW, MYR, PHP, SGD, TWD, THB
-
•
EM Latam: BRL, CLP, COP, PEN, MXN
-
•
CEEMEA: CZK, HUF, ILS, PLN, RUB, TRY
-
•
Africa: ZAR
B.2. Target Dataset
Our target dataset is focused on the following 10 cryptocurrencies: Bitcoin (BTC), Ethereum (ETH), DogeCoin (DOGE), DigiByte (DGB), Litecoin (LTC), Stellar (XLM), XRP, Monero (XMR), NEM (XEM), Dash (DASH). The dataset for these digital tokens span 1-Jan-2016 to 31-Dec-2021.
B.3. Data Preprocessing
In order to reduce the impact of outliers during training, we winsorise both foreign exchange and cryptocurrency data by capping and flooring it to be within 3 times its exponentially weighted moving (EWM) standard deviation from its EWM average that is calculated with a 26-week halflife decay.
Appendix C Additional Training Details
Model Fine-tuning: We fine-tune both FEN and SAR+ps models. In this step, we unfreeze the entire network and re-train with the lowest value in the learning rate search range, i.e., and over different batch sizes.
Python Libraries: LambdaMART uses XGBoost (Chen and Guestrin, 2016). All other machine learning models are developed with Tensorflow (Abadi et al., 2015).
Hyperparameter Optimisation: Hyperparameters are tuned using HyperOpt (Bergstra et al., 2015). For LambdaMART, we refer to the hyperparameters as they are named in the XGBoost library. The feature search spaces for various machine learning models are as follows:
Multi-layer Perceptron (MLP):
-
•
Dropout Rate – [0.0, 0.2, 0.4, 0.6, 0.8]
-
•
Hidden Width – [8, 16, 32, 64, 128]
-
•
Batch Size – [8, 16, 32, 64, 128]
-
•
Learning Rate – [
ListNet (LN):
-
•
Dropout Rate – [0.0, 0.2, 0.4, 0.6, 0.8]
-
•
Hidden Width – [8, 16, 32, 64, 128]
-
•
Batch Size – [1, 2, 4, 8, 16]
-
•
Learning Rate –
LambdaMART (LM):
-
•
‘objective’ – ‘rank:pairwise’
-
•
‘eval_metric’ – ‘ndcg’
-
•
‘num_boost_round’ – [50, 100, 250, 500, 1000]
-
•
‘max_depth’ – [6, 7, 8, 9, 10]
-
•
‘eta’ –
-
•
‘reg_alpha’ –
-
•
‘reg_lambda’ –
-
•
‘tree_method’ – ‘gpu_hist’
Self-attention Ranker (SAR), Self-attention Ranker with Parameter-sharing (SAR+ps), both the source model for Fused Encoder Networks (FEN) and FEN itself:
-
•
– [8, 16, 32, 64, 128]
-
•
– [8, 16, 32, 64, 128]
-
•
Dropout Rate – [0.0, 0.2, 0.4, 0.6, 0.8]
-
•
Hidden Width – [16, 32, 64, 128, 256]
-
•
Batch Size – [2, 4, 6, 8, 10]
-
•
Learning Rate –
-
•
No. of Encoder Layers – [1, 2, 3, 4]
-
•
No. of Attention Heads – 1
Fine-tuning step for SAR+ps and FEN:
-
•
Batch Size – [2, 4, 6, 8, 10]
-
•
Learning Rate –
Appendix D Incorporating Knowledge from Sub-optimal Source Models
We investigate the impact on model performance when inappropriate source models are used for knowledge transfer. Out of 10 runs of the source model, we pick the worst 2 as measured by the strategy’s Sharpe ratio on the out-of-sample period. Using components from each, we construct their respective target models and make predictions on the corresponding target dataset. The results of this exercise are presented in Table 6. Importantly, we see that transferring knowledge from sub-optimal source models has a substantial performance drag for FEN (around 45% reduction in the Sharpe ratio).
| SAR+ps | FEN | ||
|---|---|---|---|
| E[returns] | -0.0500.097 | 0.0780.055 | |
| Volatility | 0.1740.013 | 0.1900.018 | |
| Sharpe Ratio | -0.2770.569 | 0.4140.302 | |
| Sortino Ratio | -0.2600.819 | 0.7190.527 | |
| Calmar Ratio | -0.0090.321 | 0.3640.264 | |
| Downside Deviation | 0.1310.025 | 0.1170.018 | |
| Max. Drawdown | -0.4240.173 | 0.2400.066 | |
| Avg. Profit / Avg. Loss | 1.0160.249 | 1.1890.163 | |
| Hit Rate | 0.4590.026 | 0.4960.020 |
Appendix E Comparing Attention Heatmaps
This section compares the heatmaps of models that use the attention mechanism: the SAR, SAR+ps, and FEN. Specifically, we present the weights of each model’s last attention layer for each market state and cryptocurrency-specific event discussed in Attention Heatmap Patterns. Darker cells correspond to larger weights, contributing more to the model’s prediction. Additionally, attention weights across different models are not comparable since these are raw weights. Overall, the patterns produced by FEN appear to broadly align with what one might expect. Risk-off states, for instance, are associated with heatmaps with darker cells that are dispersed – reflecting the broad impact felt by multiple instruments. This development is observed to a lesser extent in SAR, and is almost entirely absent in SAR+ps.