A Visual Analytics Framework for Composing a Hierarchical Classification for Medieval Illuminations
Abstract
Annotated data is a requirement for applying supervised machine learning methods, and the quality of annotations is crucial for the result. Especially when working with cultural heritage collections that inhere a manifold of uncertainties, annotating data remains a manual, arduous task to be carried out by domain experts. Our project started with two already annotated sets of medieval manuscript images which however were incomplete and comprised conflicting metadata based on scholarly and linguistic differences. Our aims were to create (1) a uniform set of descriptive labels for the combined data set, and (2) a hierarchical classification of a high quality that can be used as a valuable input for supervised machine learning. To reach these goals, we developed a visual analytics system to enable medievalists to combine, regularize and extend the vocabulary used to describe these data sets. Visual interfaces for word and image embeddings as well as co-occurrences of the annotations across the data sets enable annotating multiple images at the same time, recommend annotation label candidates and support composing a hierarchical classification of labels. Our system itself implements a semi-supervised method as it updates visual representations based on the medievalists’ feedback, and a series of usage scenarios document its value for the target community.
Keywords: Labeling, Digital humanities, Visualization in the Humanities, Visual analytics.
1 Introduction
Historical library collections contain hundreds of thousands of ancient manuscripts which have been described over the years in different print publications and cataloging systems. In today’s world of digital libraries, manuscripts are often fully digitized, but researchers in art history and book history who want to access these collections in a more granular fashion often turn to earlier iconographic databases created in the era of partial digitization of the 1980s and 1990s on account of the rich metadata they contain. These annotations in earlier cultural heritage collections provide a propitious opportunity for applying supervised machine learning methods such as training a classifier. And yet, in spite of originating in common thesauri and controlled vocabularies and growing in size over the years, it is not a straightforward task to use these annotated images for machine learning. Not only have the original vocabularies of various collections ”drifted apart,” but the collections also contain manifold uncertainties, such as imprecision, incompleteness and non-homogeneity in both the annotated metadata and in the data of the collection itself (Börner et al., 2019). Similar problems can be found in image classification and object detection tasks from other research areas such as medical imaging, traffic monitoring or geology. One interest lies in organizing and structuring similar data sets with overlapping metadata that allow researchers to gain deeper insight into specific materials or phenomena, which for artificial reasons have been siloed in different cultural institutions. Further, more robust general connections between divergent image collections should allow for greater retrieval and discoverability in the cultural heritage sector between varied vocabularies or even across multilingual metadata schemas.
Another problem with annotations is that of missing labels or inappropriate hierarchies that do not match those usually used for machine learning. The assumption that labels are independent from each other does often not represent real-world scenarios, therefore taking relations between labels into account can improve classification (Dhall et al., 2020) or retrieval tasks (Barz & Denzler, 2019). The most common label hierarchy in computer vision is the ImageNet (Deng et al., 2009) hierarchy, which uses a subset of WordNet (Miller, 1995) labels. This hierarchy can be problematic for multiple reasons, in particular for historical image domains, where its natural images and hierarchies associated with them are not applicable to the kinds of images found therein. Also, relations in such hierarchies can over time be seen as no longer appropriate, e.g., abusive language, or they can include non-visual concepts that can be problematic for image annotation (Yang et al., 2020).
Our project focuses on two large image databases from medieval manuscripts digitized from French libraries, Mandragore (nationale de France, 2003) and Initiale (de recherche et d’histoire des textes du Centre national de la recherche scientifique Section des manuscrits enluminés, 2012). The images come from the so-called ”Paris Bible” tradition, a genre of Latin manuscript including the Old and New Testament of the Christian Bible with widespread diffusion in Europe in the thirteenth and fourteenth centuries (Light, 2012). Although the genre exhibits significant repetition in the themes and forms of the images across the Biblical books, the two databases in question contain conflicting metadata fields which prevent us from automatically combining different labels. The process of connecting the data sets can be achieved through different approaches, including extending existing metadata using a significant amount of domain-specific knowledge, some initial normalization of already existing metadata as well as the creation of a logical hierarchy for downstream tasks with the images.
We designed a visual analytics system that supports combining the Mandragore and Initiale data sets by semi-automatically unifying their annotations and creating a shared, high-quality label hierarchy. In our case, labeling or annotating can be seen as assigning multiple categorical labels to an image as well as defining relations between labels. The system allows annotating multiple images at the same time while suggesting existing annotations from the different data sets, recommendations made using word embeddings, co-occurrences of the annotations across the data sets and image embeddings of the images in the collection. Furthermore, it allows the creation of label hierarchies appropriate for the corpus by using the given metadata and additional concepts. We decided to construct the label hierarchy from both the annotations already present in the data sets, and entirely new terms, since existing external hierarchies do not include all of the domain-specific vocabulary like people and objects linked to religious practices.
Continuing our longstanding interdisciplinary collaboration (Jänicke & Wrisley, 2017; Meinecke et al., 2021), we adopted a participatory visual design process (Jänicke et al., 2020) for addressing the problem described above. In addition to the creation of a combined image data set that is in itself a valuable resource for medievalists, the main contributions to our community are:
-
•
A multi-layered visual analytics framework that tailors Shneiderman’s Information Seeking Mantra (Shneiderman, 2003) to navigate large sets of images from embeddings to detailed annotation views.
-
•
A multi-view image annotation environment that provides various visual interfaces for exploring various aspects of the data in support of evaluating the similarity and relatedness of images.
-
•
A description of user pathways that document various strategies how such annotation environments can be used by domain experts, allowing valuable insights to be gained for related scenarios.
-
•
A label hierarchy for medieval illuminations as a direct result produced by content specialists using the system. It can be straightforwardly applied to scenarios in which hierarchical classification or object detection is performed on specific historical sets of images with related themes.
While the question of the specific medieval manuscripts represented in our corpus might seem quite specialized, the situation of divergent versions of common vocabularies and the desire to resolve and combine labels across knowledge bases is common to many research areas. Our system in designed to support various ways that subject specialists from different backgrounds look at sources (here different kinds of specialists in pre-modern culture, such as paleographers, art historians, codicologists, philologists), and by extension, different publics in visual cultural studies, each of which has very different academic training and looks for different details in groups of images. Consequently, our solution is adaptable to related image annotation scenarios in which it is desirable to revise, create and/or organize domain-specific labels in a hierarchical structure.
2 Related Works
We visualize images of cultural heritage (Windhager et al., 2018) but in contrast to other works, we do not primarily focus on the exploration of the images (Thudt et al., 2012; Dumas et al., 2014; Dörk et al., 2017; Meinecke et al., 2022). In order to include exploratory methods for multiple data sets of images and their labels, set visualizations (Dinkla et al., 2012; Lex et al., 2014) can be combined with other visualizations, because labeling a collection with categorical labels can be seen as defining multiple sets over the collection (Alsallakh et al., 2016). The focus of our work lies on the annotation/labeling of the images, which is similar to visual annotation systems, interactive labeling and other human-in-the-loop processes. Furthermore, our work shares similarities with works on profiling (Jänicke et al., 2015) and recommender systems (Parra et al., 2014).
2.1 Computer Vision for Cultural Heritage Collections
A theoretical framework in order to work with large cultural heritage collections of visual material was proposed by Arnold & Tilton (2019). They applied object detection and image similarity measurements. Pre-trained neural networks were also applied to historic photographs from the twentieth century to find similarities and to observe trends (Wevers & Smits, 2020). Such photographs are old, but still quite close to contemporary image datasets. For medieval images, computer vision algorithms were used to spot pattern (Úbeda et al., 2020), to classify crowns (Yarlagadda et al., 2010) or gestures (Schlecht et al., 2011). Lang & Ommer (2018) applied computer vision methods to find general recurrences and to organize medieval manuscripts in order to assist iconographic research. Other works focused on aligning illustrations in manuscripts by image collation methods (Kaoua et al., 2021), or aligning text and image data of medieval manuscripts and their illuminations through visual-semantic embeddings (Baraldi et al., 2018; Cornia et al., 2020). But none of these works applied advanced interactive visualization methods to explore the results, let alone to adjust and enrich the metadata from the collections.
2.2 Visual Annotation Systems
The ability to annotate spatial regions in images is required to apply localization methods like object detection. Annotation tools like the VGG Image Annotator (Dutta & Zisserman, 2019) support this but do not apply visualizations to communicate the data distribution and other features of the data. Although allowing to annotate spatial regions like bounding boxes is often important, it is not in the focus of our work, as we first want to regularize the vocabulary of the already existing annotations.
In general, visual annotation systems support manual labeling tasks through visualizations. Label can be either numerical (Wall et al., 2017), relations (Sperrle et al., 2019), or categorical (Borghesani et al., 2010). Zhao et al. (2016) proposed a graph visualization to explore annotations inside an annotation system. Some of the systems support only a small predefined vocabulary (Willett et al., 2011) or properties of the data like outlier (Chen et al., 2010). While others support any textual annotations without a defined vocabulary (Elias & Bezerianos, 2012). In contrast to them, we use an already existing vocabulary, and allow to extend and regularize it. Other systems focus more on the collaboration aspect between multiple users through monitoring functionalities like inter-annotator agreement (Qwaider et al., 2017), common ground construction in asynchronous collaborations (Chen et al., 2011), or organizing findings, hypotheses, and evidence in a collaborative visual analytic system (Mahyar & Tory, 2014). As we currently designed the system for a small number of experts that communicate with each other, we did not focus on the collaboration aspect in detail, but still included some methods. Furthermore, labeling can be supported by visualizations to explore the data and machine learning methods to recommend points of interest (Felix et al., 2018; Khayat et al., 2019). Other visualization systems close the loop between machine learning algorithms and users by supporting different labeling tasks through interactive visualizations.
2.3 Interactive Data Labeling
Active learning (Wu et al., 2020) is a popular method in order to reduce the amount of manual labeling. In an active learning process, a user labels data samples that are queried by an algorithm based on different strategies to improve the underlying model while minimizing the amount of work. Some initial works (Fails & Olsen Jr, 2003; Ware et al., 2001; Heimerl et al., 2012; Höferlin et al., 2012) extended the concept of user interaction to interactive learning, in which a user interacts with visualizations to create a classifier without parameter selection. Visualization can help in the machine learning process by increasing trust (Chatzimparmpas et al., 2020) and by helping in the sense-making process (Endert et al., 2017).
Modern visual analytics systems combine interactive visualizations with active learning strategies to better understand the classifier and support several tasks and domains like correcting mislabeled training data (Xiang et al., 2019), text data annotation (Kucher et al., 2017; Sun, Lank & Terry, 2017), labeling documents (Choi et al., 2019), constructing sentiment lexicons (Makki et al., 2014) or classifying the relevance of tweets in real-time (Snyder et al., 2019). Bernard et al. (2018) introduced visual interactive labeling (VIAL) as a concept to combine active learning with visualization systems for the exploration and selection of data points for labeling. Furthermore, Chegini et al. (2020) showed that VIAL can outperform active learning under specific conditions and can help solve the cold start problem. Combining active learning with additional visual encodings that expose the internal state of the learning model and using knowledge from visual perception theory can therefore help in the labeling process (Liu et al., 2018). VIAL processes were already applied to suggest keywords for articles in a literature collection (Agarwal et al., 2018), labeling and classification of question types (Sevastjanova et al., 2021) and music songs (Ritter et al., 2018).
Our approach shares similarities to works on visual-interactive labeling. In contrast, we do not include active learning strategies, but our exploratory approach can be extended to include recommendations based on active learning. We exclude active learning because the large number of potential label classes (over 1000) leads to computational constraints. Currently, the identification of labeling candidates is solely dependent on the domain experts. Although the applied visualizations are helping in this process by showing similarities based on embeddings and metadata.
3 Data
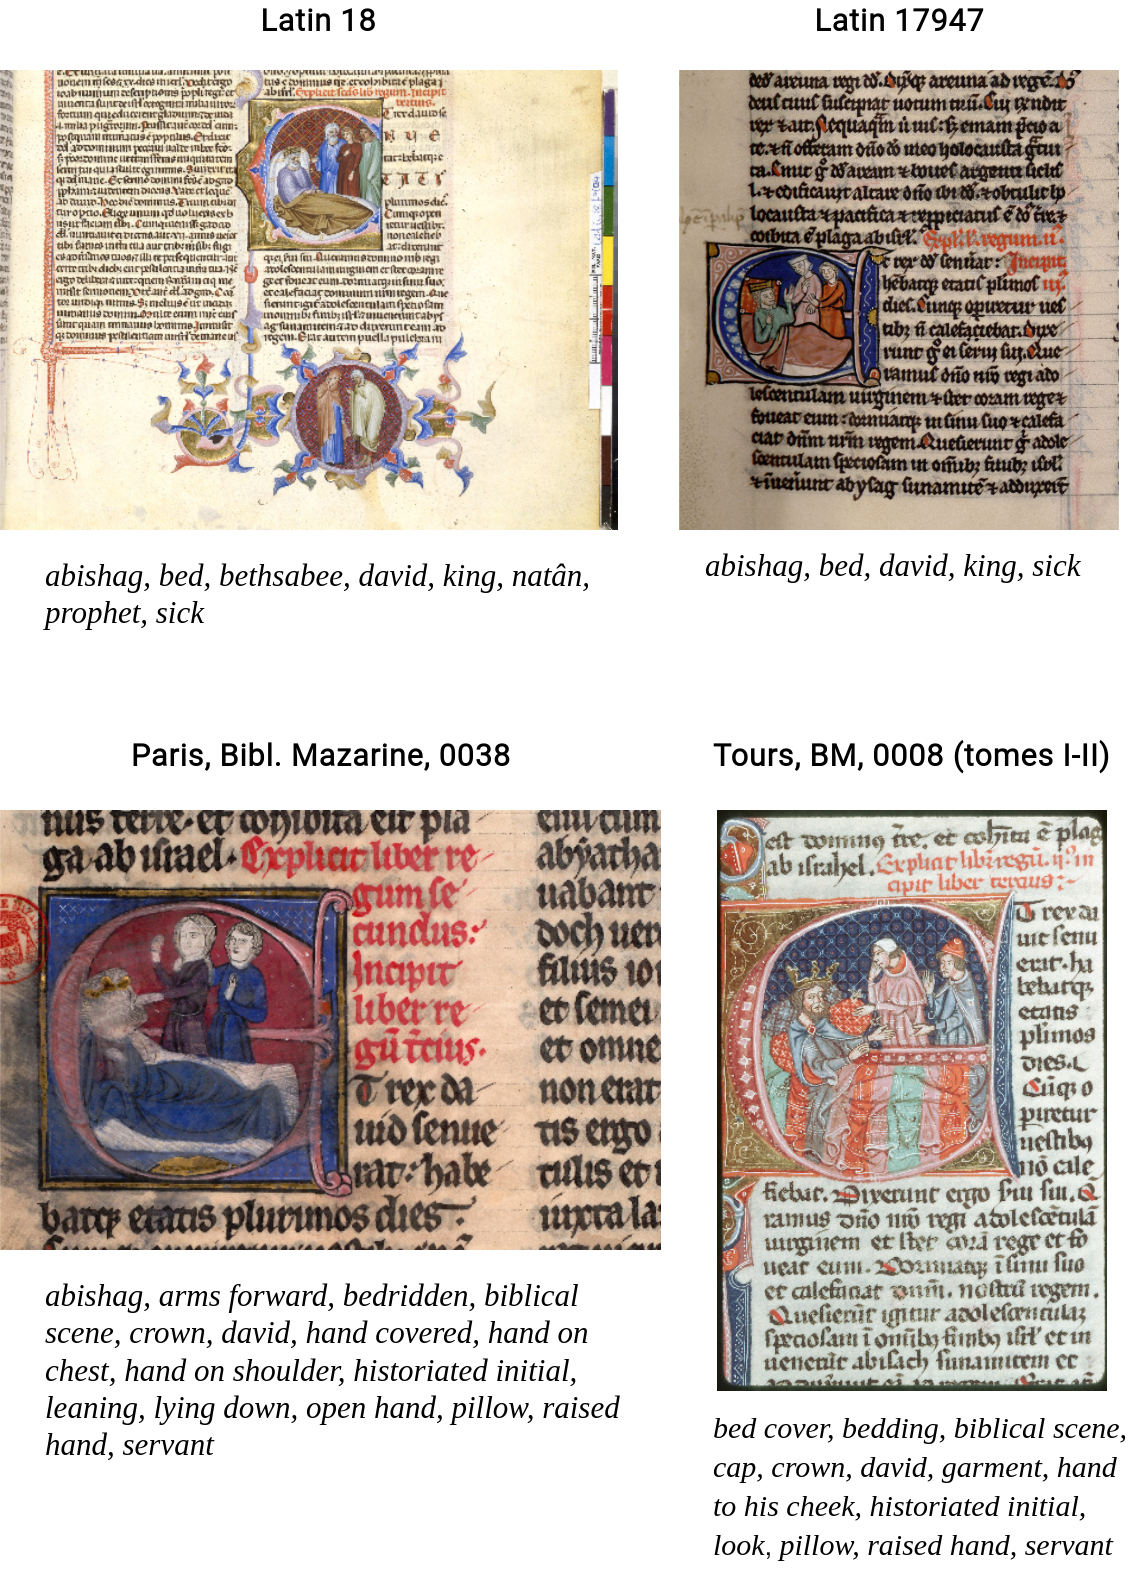
Up until the early thirteenth century, manuscripts were mostly produced in workshops attached to courts or by monks in monasteries, but the creation of universities in medieval Europe greatly influenced this form of written, cultural production. ”Paris Bibles” emerged in the thirteenth century Europe as a mass-produced written object in response to new forms of literacy, namely teaching and preaching. After 1220, these hand copied Bibles contained a corrected text and followed a standard order, introduced by prologues and divided into chapters, usually including related series of illuminations (that is, hand-painted images) and decoration particularly collocated with the prologues and chapter beginnings. At first glance, the images found in Paris Bible seem similar from one manuscript to another, yet a closer look shows how different these illuminations are, from the use of colors and the details of representation, presence or absence of particular objects or people, differences which can be attributed to the origin of the manuscript, to the individual illuminator or workshop. Examples can be seen in Figure 1.
The first part concerns pre-processing of textual data Our data set of images from Paris Bibles is made up of a small subset of the Mandragore (nationale de France, 2003) and Initiale (de recherche et d’histoire des textes du Centre national de la recherche scientifique Section des manuscrits enluminés, 2012) databases corresponding to the examples of Paris Bibles; it contains respectively 1.633 images from 53 manuscripts and 11.472 images from 241 manuscripts. Each digital image illustrates one or two pages of a specific manuscript and can contain one or several illuminations depicting various scenes and objects. Accompanying the images, the data set also includes general geospatial and temporal information about the manuscripts, topical description of the images and tags indicating the book of the Bible depicted.
Mandragore is an iconographic database of medieval manuscripts created in 1989 at the Bibliothèque nationale de France. It describes the decoration of more than 200.000 manuscript descriptions. It is based on a controlled vocabulary of 20.349 labels, 530 of which are used in this subset. This vocabulary was originally based on the ”Thésaurus Garnier” (Garnier, 1984). It continues to be enriched on a daily basis by curators, librarians and researchers. In a later stage, it was enriched with the aim of identifying, in each illumination, all the objects, places, people and iconographic subjects represented. There is both descriptive and interpretive vocabulary included.
Although both databases contain samples of Paris Bibles, they were in fact created at very different times and with different priorities. Created in the early 1990s Initiale is an online catalog of medieval manuscripts belonging to the public libraries of France, beyond the Bibliothèque nationale de France. Initiale includes about 10.000 manuscripts descriptions and more than 90.000 illuminations from these manuscripts. Developed with research in mind, it uses a refined iconographic index with a controlled vocabulary and offers art-historical analyses of the decoration. This vocabulary was also originally based on the ”Thésaurus Garnier” (Garnier, 1984) but evolved in a different direction over the last 30 years (Lalou, 2001). Our subset uses 1734 words from this controlled vocabulary, only 279 of which are shared with Mandragore.
While deep, the divide between Mandragore and Initiale is an artificial one, owing to the history of institutions and collections, rather than the original historical material. This is far from optimal for scholars who would like to see relationships in the larger picture of medieval Bibles. Moreover, similar images from the same unit of text have completely different attention paid to them, which can be also seen by the example in Figure 1. Since the two databases use a different vocabulary, a desirable endpoint is not so much a fuller description of the scenes depicted like creation or death, but a more granular depiction of details found in the images that ”make up” the scene like a cross, a certain species of bird, a blue background, or a desk. What has been required in the process of connecting the data sets is a significant amount of subject knowledge and some initial normalization of some of the metadata. The metadata resolution led to an expanded code for books of the Bible, based on the OSIS Book abbreviations following the SBL Handbook of Style (Alexander, 1999).
4 Visual Analytics Framework
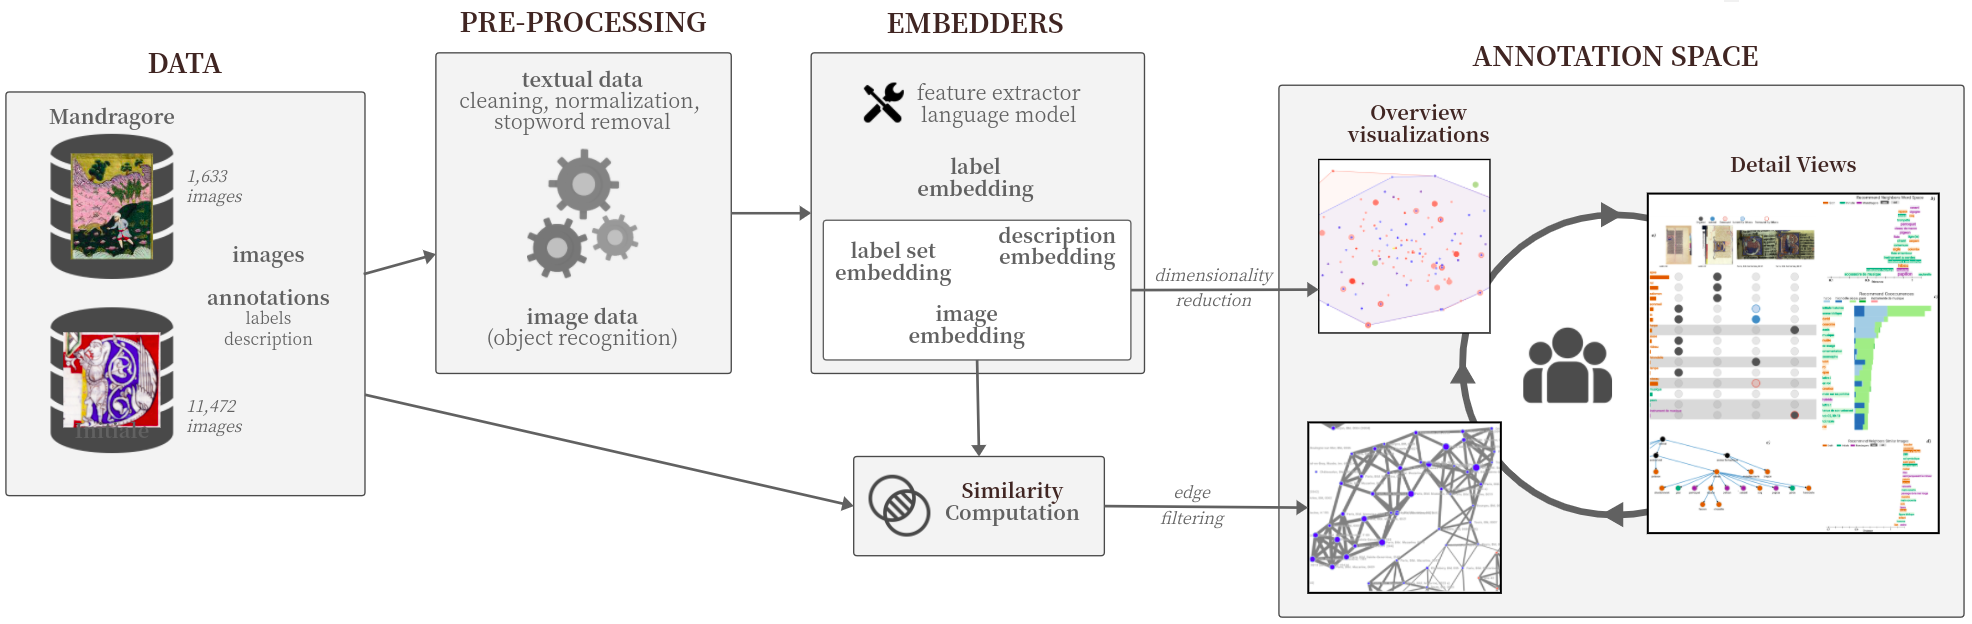
The goal of our visual analytics system–composed of multiple parts–is to allow annotating medieval illuminations and composing a label hierarchy of the objects depicted in the images. A systematic of our annotation framework is depicted in Figure 2. The first part concerns pre-processing of textual data. Pre-processing of image data in the form of object recognition would be valuable, however, high-quality label hierarchies describing medieval illuminations do not exist and object detection or image classification based on modern hierarchies like Open Images (Kuznetsova et al., 2020) or ImageNet (Deng et al., 2009) fail. Only few objects that are depicted inside our image data set are found, since many classes of these hierarchies consist of objects that did not exist in the given time period. The pre-processing is followed by applying machine learning methods to generate vector representations in order to compute image similarities. After these data processings, the annotator requires an entry point to the data. In our case, we aggregate the different facets of the data based on the manuscripts to which they belong. The relations between the manuscripts are then visualized. In addition to the manuscripts, we also needed to present and filter the actual images in the data set. We apply dimensionality reduction methods based on embeddings of the images and their metadata for that purpose. The next step is to enable the inspection of a specific subset of the image data. The subset can be selected based on the same or similar metadata or relations in a vector space. This is needed to allow annotating images by adding missing concepts and objects that are depicted but not yet labeled as such. This task can be supported by different recommendation methods like word and image similarities, co-occurrences or even active learning methods. The annotation space also includes an interactive graph to support creating a high-quality label hierarchy for medieval illuminations to generate a valuable resource for medievalists.
4.1 Image and Annotation Processing
The first step of our framework consists of processing the images, textual metadata and annotations. For the image pre-processing, we tested multiple methods to extract the illuminations from the images. Although the method in Grana et al. (2011) based on the Otsu algorithm (Otsu, 1979) showed good results on subsets of the data set, it was not adaptable for the whole corpus because of the varying preservation status and background colors of the manuscripts. Furthermore, we tested pre-trained models of the docExtractor (Monnier & Aubry, 2020) but the results were not satisfying. Because of this, we used the whole image for the next processing steps.
For the next processing steps of the images, we applied the Efficient Net B7 (Tan & Le, 2019) that was pre-trained on ImageNet (Deng et al., 2009). We used the top layer of the network to compute image embeddings for each image in the data set. These embeddings are vectors with a dimension of 2560 and are used to compute similarities between the images i.e. the nearest neighbors. Although the network was trained on natural images, the features can still be used to compute similarities between the images in the corpus (Crowley & Zisserman, 2014). All embeddings are added to a faiss (Johnson et al., 2019) index structure, where similarity is based on the Euclidean distance between them. For each image, the most similar images can be queried by searching the index based on the vector of the image. We also used the nearest neighbor search to find duplicates in the data sets that could be a result of the structure of the data set or the crawling process. All neighbors with a Euclidean distance of 0 are treated as duplicates. In cases where the same image has different entries for the same metadata attribute, the entries were combined.
For the pre-processing of the annotations, we lower-cased all words and removed diacritics and special characters. Additionally, for the computation of embeddings, we did not include stopwords from annotations with more than one word to prevent a high similarity in cases where stopwords overlap. We applied two pre-trained models for modern French fastText (Bojanowski et al., 2017; Grave et al., 2018) and CamemBERT (Martin et al., 2020) to embedd the annotations. For the fastText model, we used the word vectors and in cases where an annotation is composed of multiple words we computed an average vector. For the CamemBERT model we applied a mean pooling to the hidden state embeddings of the neural network. We also added the vectors to a faiss index. Some of the images are also annotated with a sentence that describes the images, for which we also computed embeddings. The fastText vectors seemed to better grasp the word relations based on the nearest neighbors of the annotations. Because most of the annotations are single words, we disregarded the CamemBERT embeddings, although they could be better in other application scenarios where annotations consist of multiple sentences.
We also computed for each image in the data set three types of two-dimensional embeddings with UMAP (McInnes, Healy, Saul & Grossberger, 2018; McInnes, Healy & Melville, 2018), which we use to visualize the images in a two-dimensional space. The different UMAP embeddings are based on the image embeddings, the word embeddings of the annotations of an image, and the embeddings of the descriptions. In order to ensure that the same data results in the same embeddings, we used a fixed random state for the computation. This is important as the annotation embeddings of the images change with successive annotation by the domain expert. It is also important to consider the time the different methods need to compute. The same goes for the actual computation of the embeddings. It would be also possible to include other types of embeddings like color or other textual metadata.
In order to compute similarities between the manuscripts in the data set, we applied multiple similarity measurements. To define an image similarity we computed an average vector for each manuscript based on its image embeddings and then computed the Euclidean distance between all manuscripts. The annotation similarity is defined in a similar way, where we use an average over all word vectors of annotations that are associated with a manuscript. We do the same for the textual descriptions. For each type of measurement we saved the maximum distance in order to transform the distances into similarities in range 0 and 1 by computing for each distance between two manuscripts and . Combining image similarity with annotation similarity, or description similarity can be helpful for multiple reasons, similar images depict similar scenes, and similar scenes are likely to have similar annotations or similar descriptions. Also, not all images in the data set are annotated, so the image similarity allows to include them.
4.2 Manuscript Graph
The user wants to inspect the annotation status of the data set. For this, they select the annotation similarity to compute the layout for the manuscript graph. They can see multiple small clusters of manuscripts of the Initiale data set, and one big connected component of Initiale manuscripts that are connected through a few edges with a large number of manuscripts from the Mandragore data set. They also noticed that several manuscripts are not connected to any other manuscripts in the graph. For now, they decide to focus on a subset of these manuscripts by selecting them.
Tasks
The manuscript graph is the entry point to the visual collection that allows selecting manuscripts of interest for which the images can be accessed. The graph shows similarities between the manuscripts in the data set based on several features like image similarity, annotation similarity or other metadata.
Design
The manuscript graph (Figure 3) displays the manuscripts of the data sets as nodes and connects them by edges based on user-selected similarities. The nodes are color-coded based on the data set they belong to and the size indicates the number of images that belong to this manuscript. Next to each node, a text label shows the name of the manuscript. The graph layout is a force-directed layout, where nodes repel each other and edges pull nodes together. The edge thickness shows the selected similarity value, on a scale from the selected threshold to 1.
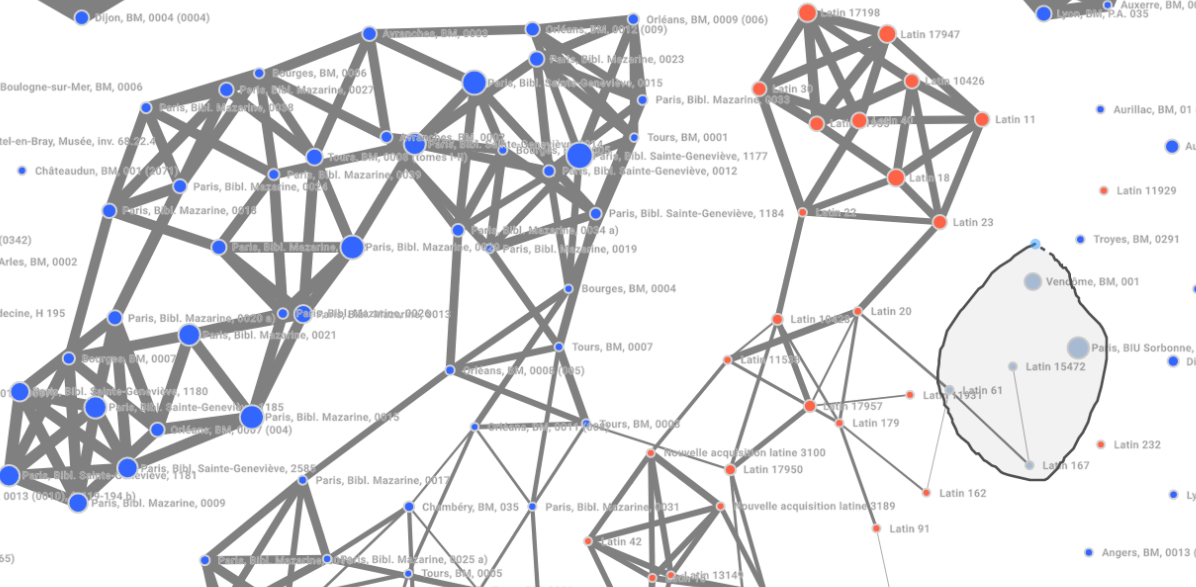
The user can select one or multiple similarity metrics for the graph like image similarity, annotation similarity or description similarity. When two or more similarities are combined the edge value corresponds to the average of the values. In order to prevent visual clutter, the user can select the maximum number of edges a node can have and filter the displayed edges based on a similarity threshold, which filters all edges below the threshold. If more than the selected number of edges satisfy the threshold, only the ones with the highest similarity value are displayed. Before selecting an additional similarity metric, the metric can be added as a graph overlay to see how the metric would impact the graph. The overlay edges have no impact on the currently displayed layout, new edges are shown in blue and edges that would disappear are red. It is also possible to drag nodes to another position and to zoom in and pan the graph. In order to explore a specific subset of manuscripts, the user can use a lasso selection to draw a polygon around the nodes. The selected nodes are then increased in size and colored in steel-blue. A drawer on the left side that can be toggled shows a bar chart, a timeline and a tag cloud with information about the metadata of the selected manuscripts. The user can also click on the recommend button to show places in the graph where images have no annotations.
Usage Scenario
In the manuscript graph based on the annotation similarity, we would avoid drawing a perimeter around a number of already connected manuscripts since this would only reinforce exiting connections in the metadata. Instead, we would select a group with a trade-off of connected and unconnected points. Such an example can be seen in Figure 3. If the number of manuscripts chosen was large, we would filter at the next step by book of the Bible. This provides us with a wide swathe of possibilities, with also the risk of not finding many connections.
4.3 Image Point Cloud
The user first also selects annotation similarity for the point cloud. It is visible that not all of the selected manuscripts contain images with annotations. The user selects multiple images (Figure 4a). Then, they add the image similarity to show all of the images of the selected manuscripts, which reveal over 100 images that are not annotated. In order to find a good starting point, they change the similarity to the description similarity, which shows that some of the images of the manuscript Vendôme, BM, 001 that are not annotated have almost the same description as some of the annotated ones. They select one of the clusters of similar images to start annotating (Figure 4b).
Tasks
The purpose of the Image Point Cloud is to give an entry point to the annotation process by showing two-dimensional representations of the images of the selected manuscripts, so that images with similar features are presented near to each other in the space. Filtering mechanisms based on metadata and the coordinates allow focusing on a specific subset of images that can be selected for annotation purposes.
Design
The images of the selected manuscripts can be explored in a point cloud below the graph (Figure 4), where each circle represents an image. For the two-dimensional representation of an image, UMAP is applied to multiple embeddings of the data sets. The user can select and combine embeddings based on the images, the word vectors of the annotations and the description of the images. When combining multiple embeddings the average is used.
Each selected manuscript has a different color, which is displayed in a legend together with the manuscript name. To highlight the positions of the images of a specific manuscript the convex hull of the points is drawn as a contour. For this, other designs based on reduced convex hulls are possible like a butterfly plot (Schreck et al., 2008) to reduce visual clutter in case of overlapping convex hulls. The convex hull can be toggled by clicking on the manuscript in the legend. The user can zoom in and pan the point cloud. In case of similar or the same two-dimensional representation for multiple images, or when multiple manuscripts with a large number of images are selected this can result in overplotting. In order to solve this, it is possible to filter the displayed points based on metadata like text units and annotations, or by drawing a rectangle around them, which recomputes the layout. On mouseover, the image is shown. A lasso selection can be used on the points to select a set of images for the annotation process. The selected points are increased in size to better highlight them. By opening the drawer on the left side the user can click on a button to switch to the annotation space. The current state of the graph and the point cloud are saved, so that when the user is done with the annotation of a subset, they can go back to the same place they worked on before.
Usage Scenario
A possibility to know where to begin would be to target images across the same units of text. For this, we would filter by book of the Bible. If our goal is to work progressively by a category, say one book, we choose more images at this point. Another option is to select a cluster of similar images.
4.4 Annotation Space
When inspecting the selected images of both manuscripts the user noticed that both sets consist of several depictions of people with swords. The only annotation that is presented is “épée” (a type of sword). After annotating some of the images with the missing information, they decide to go back to focus on another part of the manuscripts. When inspecting the now selected images they notice that one of the images is annotated with “hirondelle” (swallow) and another with “paon” (peacock). One of the recommended similar words is “oiseau” (bird). Further, one of the other selected images has the annotation “harpe,” (harp) with multiple recommendations about musical instruments. They decide to create an edge between these annotations in the label hierarchy.
Tasks
The annotation space allows to see the current annotation status of a number of images, and also allows to add and remove annotations. The domain expert can zoom in on the details of the images, in order to annotate them. It is also possible to add new labels that are not part of the data set and to filter the images based on metadata like the same unit of text. Further, the annotation space recommends possible labels, communicates why they are recommended and to which data set they belong to. Furthermore, it allows to construct a label hierarchy and to inspect the current status of the hierarchy.
Design
In the annotation space, the domain expert can filter the currently selected images, based on metadata in order to select a subset to focus on for annotation. The selected subset of images is placed on the top and their position is fixed in order to allow seeing them when scrolling the list of annotations. Figure 5a presents the current annotations of the images together with a bar chart showing the number of appearances inside the corpus, color-coded based on the data set. The annotations are sorted based on the number of selected images they belong to in descending order. When annotations belong to the same number of images the number of occurrences in the whole data set is used, also in descending order. When clicking on the bar, the user can see other images that are annotated with this annotation in a popup. For each word and image pair, a circle is shown that is either black to show annotations or grey and less saturated in case no annotation exists.
When clicking on a circle an annotation can be added or removed. An added annotation is shown by a blue circle and a removed annotation is shown by a red circle with less saturation. Annotations that were added by other users are shown in a less saturated blue and with a red border if an existing annotation was removed. A legend for the colors is provided on the top. When the domain expert is done, they can save the annotations to the database. All saved changes of all users can be inspected in a history popup showing the timestamp, the user and the changes. This allows to keeping track of their own interactions and the interactions of other users. In order to better examine an image for potential annotations, the image can be viewed in high resolution in a pop up by clicking on it. If a specific word is not of interest to the annotation process it can be removed from the annotation space by clicking on it. The other visualizations are linked to the annotation space so that an update of the annotation space also updates the other views. To select one or multiple words for the other views a row in the annotation space can be clicked, which is then highlighted in a dark-grey. By default, the content of the other views is based on all words in the annotation space.
Next to the annotation space, words are recommended based on multiple criteria. The first visualization (Figure 5b) displays the most similar words to the currently selected words in the annotation space, similar to the word space in the iteal system (Meinecke et al., 2021). Each word is placed on the x-axis based on its minimum distance to the target words. We apply a collision detection to adjust the y-coordinate to prevent words from overlapping. The words are colored based on the data set they belong to. To highlight which words are added based on the last selection in the annotation space we use a less saturated color to either present the background for old words or the font color for new words. When hovering over a word the words in the annotation space that are the most similar are shown in a tooltip together with the distance to give reason why a word is recommended. We use the same visualization to show the most similar annotations of the most similar images of the currently selected images (Figure 5d). This can be helpful in cases where the selected images have no annotations, but similar images have.
In Figure 5c the words that co-occur the most frequent with the currently selected words are displayed. The words are ordered based on their total number of co-occurrences. To distinguish between the co-occurrences with different words we visualize the occurrences with a stacked bar chart for each word. The bars are ordered based on the ordering in the annotation space. A legend for the colors is given on top. Because the number of annotations can grow really fast, the colors repeat themselves every 12 steps. Although this is not a problem when selecting a small number of annotations in the annotation space to get recommendations. On hovering over a rectangle, the number of co-occurrences is displayed in a tooltip. Similar to the previous visualization we use a less saturated color to either present the background for old words or the font color for new words.
Usage Scenario
Putting multiple images together raises interesting questions about how annotation might be improved (or simply changed) when noticing differences across multiple examples simultaneously. Owing to screen space limitations, the annotation space accommodates about 5 images at a time for labeling without scrolling. We choose the desired number of images one at a time according to different criteria: the same book of the Bible from different manuscripts or images coming from the same manuscript, both of which are assumed to have common metadata, although proceeding by book seems most efficient for this stage of the process of connecting the data sets. First, we make sure that the selection of images does not include doubles, then we build our image set for annotation. Then we temporarily blacklist any annotations which are extraneous. Choosing one of the possible annotations, we open each of the images to see if there are missing labels and if so, we add them, referring to the recommended word space and co-occurrences.
4.5 Label Hierarchy
The user creates an edge between the annotations “hirondelle” (swallow) and “oiseau” (bird) and also between “paon” (peacock) and “oiseau” (bird). While swallow and bird are annotations that appear in both data sets, peacock only appears in the Initiale data set. Furthermore, they add the parent concept “animal”, which was not present in both data sets. They also added a relation between “instrument de musique” (musical instrument), and the musical instruments that are recommended. As “instrument de musique” only appears in the Mandragore data set they decide to draw an edge to “musique”, which only appears in Initiale. Therefore connecting the annotations that use different vocabulary from both data sets with each other.
Tasks
The label hierarchy view shows the current state of the underlying label hierarchy of the data set. Furthermore, it is possible to modify the hierarchy, by adding new nodes and to create edges between nodes. This allows to classify metadata into categories like themes or objects and also to connect metadata from different data sets.
Design
In order to draw a label hierarchy, we use the Sugiyama framework (Sugiyama et al., 1981) to draw a directed acyclic graph. In the first step, it is checked with a depth-first search for each node if the graph contains cycles. If there is a cycle i.e. an edge that leads to an already visited edge, the edge is removed from the hierarchy but added back after the layout is computed. For more complex hierarchies, methods like (Sun, Ajwani, Nicholson, Sala & Parthasarathy, 2017) could be possible to include domain knowledge when removing cycles. In the next step, the nodes are assigned a layer for which we use the Network Simplex method (Gansner et al., 1993) to minimize the length of edges in the graph. Then the nodes are ordered on the layer they are assigned to reduce edge crossings for this additional dummy nodes are added to the internal computation to replace edges that span more than one layer. For this, we use a top-down one-layer crossing minimization approach that orders the nodes based on the aggregation of their parents’ indices. In the last step, the nodes are assigned a specific coordinate using the quadratic programming approach, while minimizing the distance between connected nodes, the curvature of edges, and the distance between disconnected components. For each step, other methods of the Sugiyama framework are possible.
After the layout is computed the nodes are color-coded based on the data set they belong to. An excerpt of the hierarchy can be seen in Figure 5e. The removed edges from the cycle detection are drawn with a red color to indicate to the domain expert that there is a conflict that should be resolved in order to preserve the acyclic structure of the label hierarchy. In the beginning, all annotations that belong to the currently selected images are shown together with their ancestors and descendants in the hierarchy. It is possible to add new nodes to the hierarchy by selecting words from the recommendations, to search for a specific word in the data set and to add a new word. Nodes of words that are not part of the data sets are colored black. To modify the hierarchy the domain expert can draw a yellow edge from one node to another and to click on an edge to remove it, after each operation the layout is recomputed and a list of other potential edges is shown in a popup based on the nearest neighbors relation of the word vectors. After saving, the changes are also added to the history, allowing other users to investigate them. Edges that were drawn by other users are presented by a dashed line in the label hierarchy.
Usage Scenario
In examining the annotations, if there are related ones, then we use the label hierarchy creation view to link the terms in child and parent relationships, or by adding new parent categories that are not presented in the data set in order to link metadata from both data sets.
4.6 Feedback Computation
New annotations are added in real-time to the data set, which also updates the annotation co-occurrences and can result in new recommendations in all views. Because the graph similarities and the UMAP embeddings are computational more complex they take up to a few minutes. In order to prevent unnecessary computations, the update of the graph similarities and the UMAP embeddings are done asynchronous in the background. If the user is interested in inspecting the state of the graph after a specific session, they can select a specific state of the graph and the embeddings using a slider.
The resulting label hierarchy is also used to adjust the word embeddings through retrofitting (Faruqui et al., 2015). This results in moving words that share an edge in the graph to move closer together in the vector space. Because this process could be problematic when only a small number of edges is presented as it could distort the underlying vector space, we create a second vector space for the adjusted vectors, so that both the original and the adjusted space are used to find the nearest neighbors.
5 Complementary User Pathways
Carrying out a systematic relabeling of images from two legacy iconographic databases would be next to impossible by hand. Not only has it taken public institutions many decades to get to the point where the data are now, but the two sets are artificially siloed as we have mentioned above. Both tasks–adjusting the annotations based on recommendations and creating the hierarchy of annotations–as organized in our visual analytics system provide a framework for understanding the logic of previous annotators but also to rethink and expand the two data sets of common cultural artifacts into a more unified data set. The process of annotating can be undertaken simultaneously, from several perspectives and following different objectives. This is not due to any fault on the part of the domain specialists involved, but is quite typical of different training and points of view with respect to humanistic research.
For User 1, choosing a ”trade-off” set in the manuscript graph view of artifacts, split between ones that had been found to be similar and others that had not, was one way of beginning to understand the processes by which previous annotators had passed through the material and to identify missing annotations. The selection of a small set of four to six images for annotation inevitably led to many false pathways and re-selection of new images, but in combination with the recommendations in the word space and the co-occurrences, in particular, guided by the color coding, led me to find numerous annotations not included in either the Initiale or Mandragore data sets. In fact, when a missing annotation was identified using the recommended images provided an effective way of cycling through a number of other possible candidates for annotation. Important in this process in the initial rounds were the indications of frequency which allowed for commonly occurring labels to be explored with priority. It was in cases of synonymous or near synonymous labels, that the hierarchy was at first useful as a way of linking and establishing an order between them.
On the other hand, User 2 started the process not by labeling the images with missing annotations, but by working on the hierarchy. Starting with the hierarchy helped to understand the variety of the labels from a holistic point of view and understand how they relate to each other. The hierarchy also helped to organize and group the labels by thematic either well known and widely used (animals, furniture, etc.) or specific to this corpus (positions of the body, steps of creation or any other biblical scene, various descriptions of God, etc.) Furthermore, adding and organizing the labels in the hierarchy also helped to detect the potentially missing labels in the system. Annotating the illuminations with a good idea of the existing vocabulary acquired by working on the hierarchy improved the quality of the annotation system. Sometimes several labels belonging to the same hierarchy exist when only the most precise one would be enough. Because the words appearing higher in the hierarchy belong implicitly to it, they do not need to be added to the annotation system. Knowing the hierarchy system also helps to be more precise in the description and the labels used; for example, a lower label, more detailed, encompasses more information.
6 Discussion
By following a participatory visual design approach (Jänicke et al., 2020), we extend Munzner’s nested model (Munzner, 2009) with frequent interdisciplinary exchange on a multitude of design aspects of our system. Thus, the visual interfaces that compose our system underwent regular implicit evaluations by the target users. This process revealed limitations, some of which were addressed during our iterative process, on the one hand, and future directions, on the other hand.
6.1 Limitations
Our visual analytics framework for composing hierarchies is currently only tested with two visual data sets, but should be extendable to more than two. Nevertheless, there could be scaling issues in the color coding for more than two data sets that can be addressed. Similar issues would occur if there were more than two users using the system.
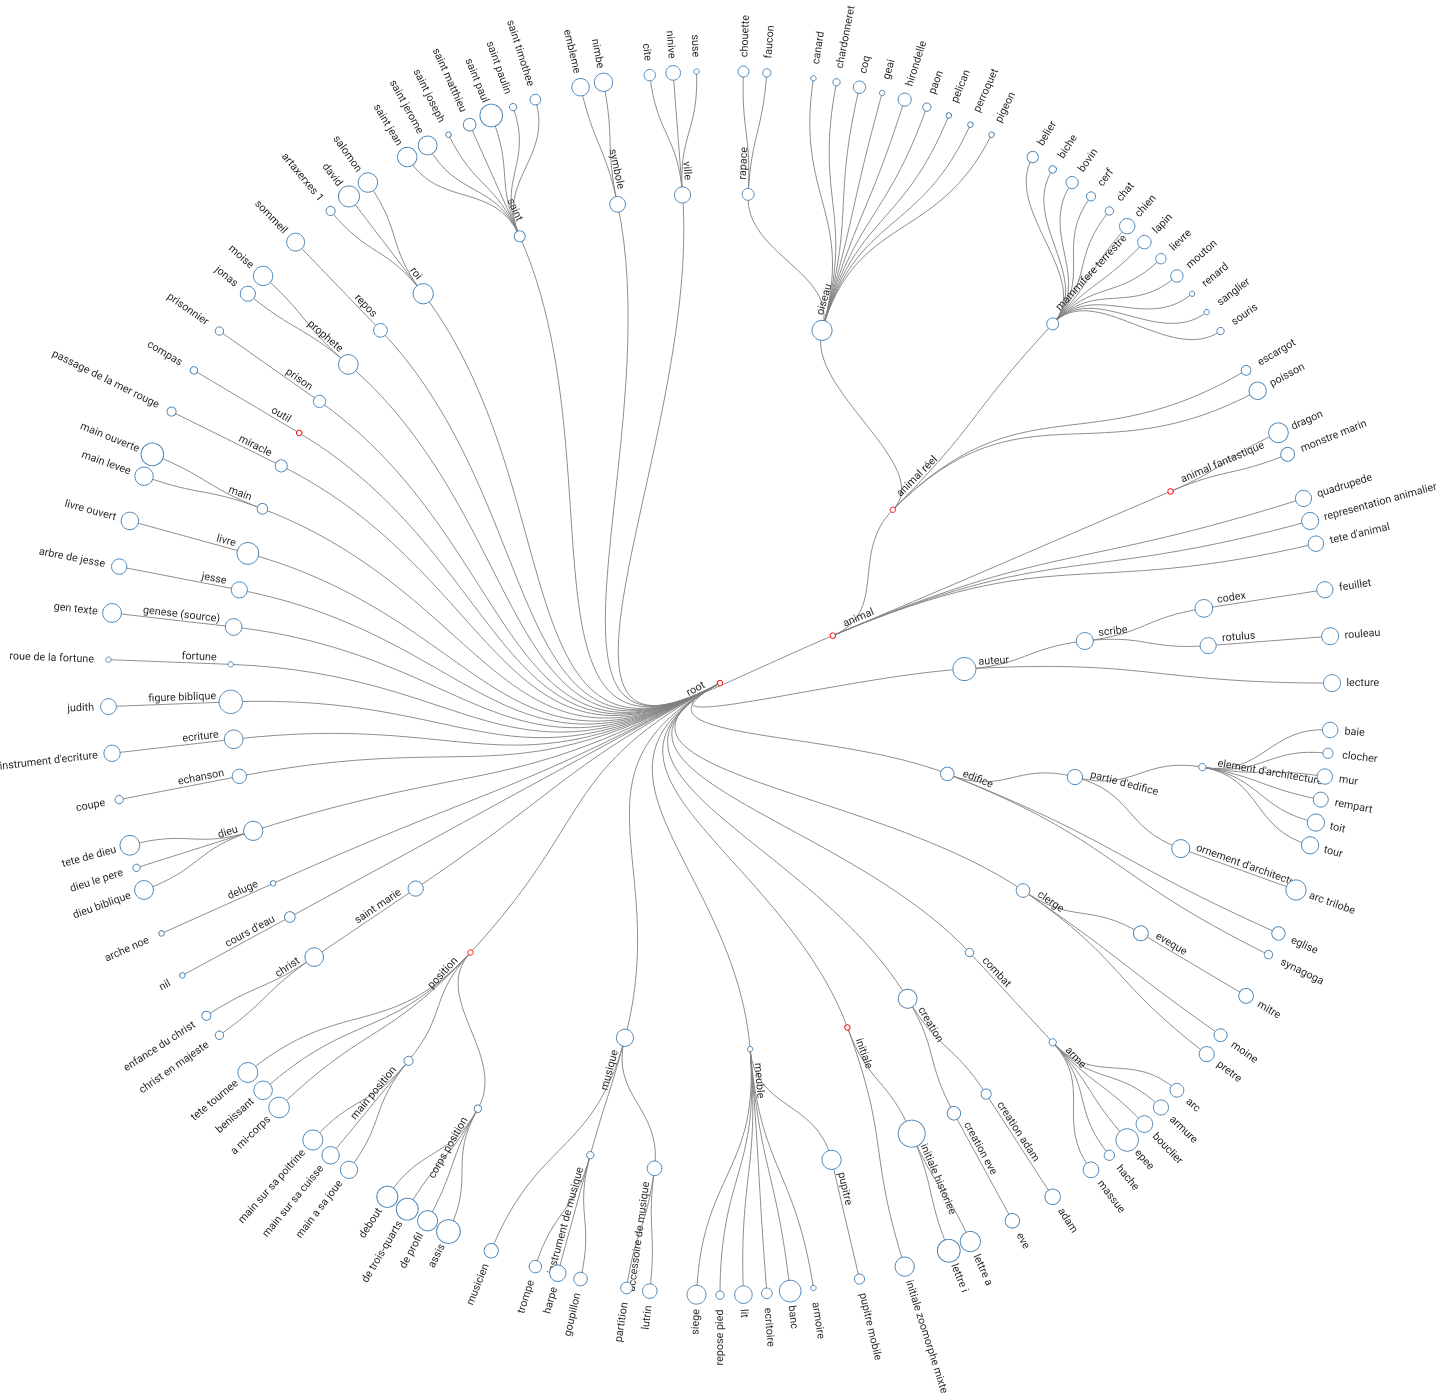
Creating the hierarchy can be difficult as the images can contain a larger number of annotations. The currently applied graph drawing algorithm does not include domain knowledge about the annotations. Often, related words that are not connected are positioned far away from each other. This problem could be addressed by including methods to automatically group similar words together, thus recommending possible connections to the user through spatial proximity. A growing hierarchy also presents some scaling issues. Those make navigating tasks cumbersome, and it is hard to keep track of the overview even with methods like zooming and panning. This leads, on a larger scale, to the resulting label hierarchy suffering from incompleteness as all hierarchies suffer from this problem. The current state of the label hierarchy includes 169 of the terms in the data set and could be used for image classification tasks, for example, for a specific subtree of the hierarchy like ”positions”. To further include object localization tasks like object detection an additional annotation process to add bounding boxes would be needed with the subset of the data that belongs to the annotations of interest. Also including other types of relations than parent child relations, such as synonyms could be of interest. Furthermore, including more means to show the data distribution could help in the process of creating the label hierarchy.
We did not extract the illuminations from the scanned manuscripts prior to processing, because state of the art methods for extracting illuminations were not robust. The complexity of the page structures, the backgrounds and the preservation statuses led to insufficient, unusable results. Instead, we used the raw image that is presented in the data set. Depending on the content of the image, this leads to a smaller depiction of the illuminations and also in background noise through the text and the background. Another limitation lies in the cross depiction problem (Hall et al., 2015), as the applied neural network to compute the image embeddings (Tan & Le, 2019) is pre-trained on natural images and not on medieval illuminations.
6.2 Qualitative Evaluation
The nature of the data set makes a quantitative evaluation of the system at this stage of our research near impossible. Nonetheless, we are able to offer a qualitative analysis of the implementation of the system and a comparison of the two users’ observations in section 5 above. We have created a system that allows for annotation and hierarchy creation among the full data set of some 13.000 images and 2.000 labels. In this first step of the research with the combined data sets from Initiale and Mandragore, the two users working on the system were able to generate with relative ease an initial labeling hierarchy including over 50 parent labels with many more children (Figure 6). In the majority of cases, parents were created imminently from the existing lables, and in a minority of cases, they were based on abstraction and created anew. Given more time the users are enthusiastic about progressing much further, as the process allows the inherent relationships of the labels to emerge in an organized manner. Whereas they found this process much faster than labeling images one by one in the annotation space, they nonetheless expect that the creation of new labels in the annotation space will facilitate the expansion of this hierarchy long term.
Furthermore, the two approaches they took to the materials in the system were neither contradictory nor inconsistent with each others work. Instead, both users were keen on the annotation space and the hierarchy builder to be linked so that their work was complementary. The success of the system in our eyes is its interconnected and non-contradictory qualities which allow multiple users with different experiences of analytics systems, metadata and humanities databases to work in a cohesive and favorable manner compatible with their experiences. Moreover, the users were eager to continue the work and advance the process to the next step. It was commented that because the data sets already contain annotations that the hierarchy will probably expand faster than the numbers of annotations, which may actually be beneficial for passing to a new stage of the work including downstream tasks using it, such as automated object recognition.
6.3 Future Works
Next to the limitations that give multiple directions for future works, a multitude of additional future works is possible. In order to align matching illuminations in the data sets e.g. depiction of the same person, image collation methods could be applied (Kaoua et al., 2021). Aligning annotations, descriptions and images by visual-semantic embeddings could also help in the recommendation process and in automatic annotating images (Baraldi et al., 2018; Cornia et al., 2020). Another future work would be to communicate the changes in the vector space. The two-dimensional representation of an image changes with new annotations and re-computation of UMAP. Changes over several iterations could be communicated in the point cloud and in the convex hull.
For both the hierarchy and the annotations, instead of the user cycling through the images manual in order to complete the tasks, the system can be combined with incremental machine learning methods that combine the algorithm with user interaction. This would help in creating robust, and generalizable models. One possibility would be to include an active learning component to combine it with the current labeling process. Also, including methods to focus on the uncertainties of other metadata like spatio-temporal annotation can be a next step. We currently, disregarded this information because the spatio-temporal metadata is annotated to the manuscripts, but is often uncertain. Such a system moves from annotating and training to prediction, illustrating new relationships that the new metadata can suggest.
It would be interesting to extend the system to a larger number of users who potentially do not know each other. An image annotation and exploration system that is conceived for multiple actors, that takes input from them and allows us to see disagreement and debate amongst scholars about how we label and classify, but also that attempts to provide multiple classifications. Given that our system is designed to create a label hierarchy as we annotate, and there is potential disagreement across annotators, we will need to explore visual modes for representing (and resolving) ambiguities and disagreement. For annotations, methods based on Fleiss’ Kappa (Fleiss, 1971) could be used to display inter-annotator agreement. Visualization should help to keep the human in the system, by showing the different paths users took and the different decisions they made and so to make the collective contribution of knowledge and labor visible.
Cultural collections of images are siloed and metadata can be inconsistent or inexistent. The knowledge of the images found in this single genre–the Latin Bible of the thirteenth and fourteenth century–should obviously be expanded to encompass many more periods and genres of Christian art. The larger picture of the project is to leverage what is known about the images in one place with some expert input to expand what is known in others. The hierarchy co-constructed in our visual analytics system would ideally be used to expand to other genres. In the long view, learning how to predict classification for the entire data set or any other digitized collections of medieval art could be fascinating repeated themes; style transfer to stained glass, other cross-genre depictions found in other legacy art historical collections. Such a system would definitely be of benefit to the larger community of medievalists and other scholars interested in images.
7 Conclusion
In this paper, we have presented a visual analytics framework to create annotations and label hierarchies based on a data set of medieval illuminations. The system itself gives access to a large image data set by providing different entry points to understand complex relations between manuscripts, images and the ways that these images have been studied by generations of art historical scholarship. We argued that such a system can be generalized to a number of different cultural heritage collections where metadata gaps prevent holistic discoverability. It supports the annotation process by combining machine learning methods with interactive visualizations. The resulting annotations and the label hierarchy are in a preliminary stage at present, but can be iteratively refined and used for machine learning tasks where contemporary hierarchies are not appropriate. The results presented here are just a starting point to build bridges between the artificial siloes created in historical research, but also to provide more complex, multi-faceted access to the illuminations in later work. Furthermore, we presented cases of how a user would work with such a system, descriptions of what tasks were most appealing to them, a qualitative evaluation of the state of the research and an assessment of the current limitations and potential for future work in this domain.
References
- (1)
- Agarwal et al. (2018) Agarwal, S., Bernard, J. & Beck, F. (2018), Computer-supported interactive assignment of keywords for literature collections, in ‘Proceedings of the Machine Learning from User Interaction for Visualization and Analytics Workshop at IEEE VIS’.
- Alexander (1999) Alexander, P. H. (1999), The SBL handbook of style: for Ancient Near Eastern, Biblical, and early Christian studies, Hendrickson Publishers.
- Alsallakh et al. (2016) Alsallakh, B., Micallef, L., Aigner, W., Hauser, H., Miksch, S. & Rodgers, P. (2016), ‘The state-of-the-art of set visualization’, Computer Graphics Forum 35(1), 234–260.
- Arnold & Tilton (2019) Arnold, T. & Tilton, L. (2019), ‘Distant viewing: analyzing large visual corpora’, Digital Scholarship in the Humanities 34(Supplement_1), i3–i16.
- Baraldi et al. (2018) Baraldi, L., Cornia, M., Grana, C. & Cucchiara, R. (2018), Aligning text and document illustrations: towards visually explainable digital humanities, in ‘2018 24th International Conference on Pattern Recognition (ICPR)’, IEEE, pp. 1097–1102.
- Barz & Denzler (2019) Barz, B. & Denzler, J. (2019), Hierarchy-based image embeddings for semantic image retrieval, in ‘2019 IEEE Winter Conference on Applications of Computer Vision (WACV)’, IEEE, pp. 638–647.
- Bernard et al. (2018) Bernard, J., Zeppelzauer, M., Sedlmair, M. & Aigner, W. (2018), ‘Vial: a unified process for visual interactive labeling’, The Visual Computer 34(9), 1189–1207.
- Bojanowski et al. (2017) Bojanowski, P., Grave, E., Joulin, A. & Mikolov, T. (2017), ‘Enriching word vectors with subword information’, Transactions of the Association for Computational Linguistics 5, 135–146.
- Borghesani et al. (2010) Borghesani, D., Grana, C. & Cucchiara, R. (2010), Surfing on artistic documents with visually assisted tagging, in ‘Proceedings of the 18th ACM international conference on Multimedia’, pp. 1343–1352.
- Börner et al. (2019) Börner, K., Eide, O., Mchedlidze, T., Rehbein, M. & Scheuermann, G. (2019), Network visualization in the humanities (dagstuhl seminar 18482), in ‘Dagstuhl Reports’, Vol. 8, Schloss Dagstuhl-Leibniz-Zentrum fuer Informatik.
- Chatzimparmpas et al. (2020) Chatzimparmpas, A., Martins, R. M., Jusufi, I., Kucher, K., Rossi, F. & Kerren, A. (2020), ‘The state of the art in enhancing trust in machine learning models with the use of visualizations’, Computer Graphics Forum 39(3), 713–756.
- Chegini et al. (2020) Chegini, M., Bernard, J., Cui, J., Chegini, F., Sourin, A., Andrews, K. & Schreck, T. (2020), ‘Interactive visual labelling versus active learning: an experimental comparison’, Frontiers of Information Technology & Electronic Engineering 21(4), 524–535.
- Chen et al. (2011) Chen, Y., Alsakran, J., Barlowe, S., Yang, J. & Zhao, Y. (2011), Supporting effective common ground construction in asynchronous collaborative visual analytics, in ‘2011 IEEE Conference on Visual Analytics Science and Technology (VAST)’, IEEE, pp. 101–110.
- Chen et al. (2010) Chen, Y., Barlowe, S. & Yang, J. (2010), Click2annotate: Automated insight externalization with rich semantics, in ‘2010 IEEE symposium on visual analytics science and technology’, IEEE, pp. 155–162.
- Choi et al. (2019) Choi, M., Park, C., Yang, S., Kim, Y., Choo, J. & Hong, S. R. (2019), Aila: Attentive interactive labeling assistant for document classification through attention-based deep neural networks, in ‘Proceedings of the 2019 CHI Conference on Human Factors in Computing Systems’, pp. 1–12.
- Cornia et al. (2020) Cornia, M., Stefanini, M., Baraldi, L., Corsini, M. & Cucchiara, R. (2020), ‘Explaining digital humanities by aligning images and textual descriptions’, Pattern Recognition Letters 129, 166–172.
- Crowley & Zisserman (2014) Crowley, E. J. & Zisserman, A. (2014), In search of art, in ‘European Conference on Computer Vision’, Springer, pp. 54–70.
- de recherche et d’histoire des textes du Centre national de la recherche scientifique Section des manuscrits enluminés (2012) de recherche et d’histoire des textes du Centre national de la recherche scientifique Section des manuscrits enluminés, I. (2012), ‘Initiale catalogue de manuscrits enluminés’, http://initiale.irht.cnrs.fr/. (Retrieved 2022-03-31).
- Deng et al. (2009) Deng, J., Dong, W., Socher, R., Li, L.-J., Li, K. & Fei-Fei, L. (2009), ImageNet: A Large-Scale Hierarchical Image Database, in ‘CVPR09’.
- Dhall et al. (2020) Dhall, A., Makarova, A., Ganea, O., Pavllo, D., Greeff, M. & Krause, A. (2020), Hierarchical image classification using entailment cone embeddings, in ‘Proceedings of the IEEE/CVF Conference on Computer Vision and Pattern Recognition Workshops’, pp. 836–837.
- Dinkla et al. (2012) Dinkla, K., Van Kreveld, M. J., Speckmann, B. & Westenberg, M. A. (2012), ‘Kelp diagrams: Point set membership visualization’, Computer Graphics Forum 31(3pt1), 875–884.
- Dörk et al. (2017) Dörk, M., Pietsch, C. & Credico, G. (2017), ‘One view is not enough: High-level visualizations of a large cultural collection’, Information Design Journal 23(1), 39–47.
- Dumas et al. (2014) Dumas, B., Moerman, B., Trullemans, S. & Signer, B. (2014), Artvis: combining advanced visualisation and tangible interaction for the exploration, analysis and browsing of digital artwork collections, in ‘Proceedings of the 2014 International Working Conference on Advanced Visual Interfaces’, pp. 65–72.
- Dutta & Zisserman (2019) Dutta, A. & Zisserman, A. (2019), The via annotation software for images, audio and video, in ‘Proceedings of the 27th ACM international conference on multimedia’, pp. 2276–2279.
- Elias & Bezerianos (2012) Elias, M. & Bezerianos, A. (2012), Annotating bi visualization dashboards: Needs & challenges, in ‘Proceedings of the SIGCHI Conference on Human Factors in Computing Systems’, pp. 1641–1650.
- Endert et al. (2017) Endert, A., Ribarsky, W., Turkay, C., Wong, B. W., Nabney, I., Blanco, I. D. & Rossi, F. (2017), ‘The state of the art in integrating machine learning into visual analytics’, Computer Graphics Forum 36(8), 458–486.
- Fails & Olsen Jr (2003) Fails, J. A. & Olsen Jr, D. R. (2003), Interactive machine learning, in ‘Proceedings of the 8th international conference on Intelligent user interfaces’, pp. 39–45.
- Faruqui et al. (2015) Faruqui, M., Dodge, J., Jauhar, S. K., Dyer, C., Hovy, E. & Smith, N. A. (2015), Retrofitting word vectors to semantic lexicons, in ‘Proceedings of NAACL’.
- Felix et al. (2018) Felix, C., Dasgupta, A. & Bertini, E. (2018), The exploratory labeling assistant: Mixed-initiative label curation with large document collections, in ‘Proceedings of the 31st Annual ACM Symposium on User Interface Software and Technology’, pp. 153–164.
- Fleiss (1971) Fleiss, J. L. (1971), ‘Measuring nominal scale agreement among many raters.’, Psychological bulletin 76(5), 378.
- Gansner et al. (1993) Gansner, E. R., Koutsofios, E., North, S. C. & Vo, K.-P. (1993), ‘A technique for drawing directed graphs’, IEEE Transactions on Software Engineering 19(3), 214–230.
- Garnier (1984) Garnier, F. (1984), ‘Thesaurus iconographique’, Système descriptif des reprèsentation, París: CNRS .
- Grana et al. (2011) Grana, C., Borghesani, D. & Cucchiara, R. (2011), ‘Automatic segmentation of digitalized historical manuscripts’, Multimedia Tools and Applications 55(3), 483–506.
- Grave et al. (2018) Grave, E., Bojanowski, P., Gupta, P., Joulin, A. & Mikolov, T. (2018), Learning word vectors for 157 languages, in ‘Proceedings of the International Conference on Language Resources and Evaluation (LREC 2018)’.
- Hall et al. (2015) Hall, P., Cai, H., Wu, Q. & Corradi, T. (2015), ‘Cross-depiction problem: Recognition and synthesis of photographs and artwork’, Computational Visual Media 1(2), 91–103.
- Heimerl et al. (2012) Heimerl, F., Koch, S., Bosch, H. & Ertl, T. (2012), ‘Visual classifier training for text document retrieval’, IEEE Transactions on Visualization and Computer Graphics 18(12), 2839–2848.
- Höferlin et al. (2012) Höferlin, B., Netzel, R., Höferlin, M., Weiskopf, D. & Heidemann, G. (2012), Inter-active learning of ad-hoc classifiers for video visual analytics, in ‘2012 IEEE Conference on Visual Analytics Science and Technology (VAST)’, IEEE, pp. 23–32.
- Jänicke et al. (2015) Jänicke, S., Focht, J. & Scheuermann, G. (2015), ‘Interactive visual profiling of musicians’, IEEE transactions on visualization and computer graphics 22(1), 200–209.
- Jänicke et al. (2020) Jänicke, S., Kaur, P., Kuźmicki, P. & Schmidt, J. (2020), Participatory Visualization Design as an Approach to Minimize the Gap between Research and Application, in ‘The Gap between Visualization Research and Visualization Software (VisGap)’, The Eurographics Association.
- Jänicke & Wrisley (2017) Jänicke, S. & Wrisley, D. J. (2017), Interactive visual alignment of medieval text versions, in ‘2017 IEEE Conference on Visual Analytics Science and Technology (VAST)’, IEEE, pp. 127–138.
- Johnson et al. (2019) Johnson, J., Douze, M. & Jégou, H. (2019), ‘Billion-scale similarity search with gpus’, IEEE Transactions on Big Data .
- Kaoua et al. (2021) Kaoua, R., Shen, X., Durr, A., Lazaris, S., Picard, D. & Aubry, M. (2021), Image collation: Matching illustrations in manuscripts, in ‘International Conference on Document Analysis and Recognition’, Springer, pp. 351–366.
- Khayat et al. (2019) Khayat, M., Karimzadeh, M., Zhao, J. & Ebert, D. S. (2019), ‘Vassl: A visual analytics toolkit for social spambot labeling’, IEEE transactions on visualization and computer graphics 26(1), 874–883.
- Kucher et al. (2017) Kucher, K., Paradis, C., Sahlgren, M. & Kerren, A. (2017), ‘Active learning and visual analytics for stance classification with alva’, ACM Transactions on Interactive Intelligent Systems (TiiS) 7(3), 1–31.
- Kuznetsova et al. (2020) Kuznetsova, A., Rom, H., Alldrin, N., Uijlings, J., Krasin, I., Pont-Tuset, J., Kamali, S., Popov, S., Malloci, M., Duerig, T. et al. (2020), ‘The open images dataset v4: Unified image classification, object detection, and visual relationship detection at scale’, International Journal of Computer Vision 128(7), 1956––1981.
- Lalou (2001) Lalou, É. (2001), ‘Une base de données sur les manuscrits enluminés des bibliothèques’.
- Lang & Ommer (2018) Lang, S. & Ommer, B. (2018), ‘Attesting similarity: Supporting the organization and study of art image collections with computer vision’, Digital Scholarship in the Humanities 33(4), 845–856.
- Lex et al. (2014) Lex, A., Gehlenborg, N., Strobelt, H., Vuillemot, R. & Pfister, H. (2014), ‘Upset: visualization of intersecting sets’, IEEE transactions on visualization and computer graphics 20(12), 1983–1992.
- Light (2012) Light, L. (2012), The thirteenth century and the paris bible, in ‘The New Cambridge History of the Bible: Volume 2: From 600 to 1450’, pp. 380–391.
- Liu et al. (2018) Liu, S., Liu, X., Liu, Y., Feng, L., Qiao, H., Zhou, J. & Wang, Y. (2018), ‘Perceptual visual interactive learning’, arXiv preprint arXiv:1810.10789 .
- Mahyar & Tory (2014) Mahyar, N. & Tory, M. (2014), ‘Supporting communication and coordination in collaborative sensemaking’, IEEE transactions on visualization and computer graphics 20(12), 1633–1642.
- Makki et al. (2014) Makki, R., Brooks, S. & Milios, E. E. (2014), Context-specific sentiment lexicon expansion via minimal user interaction, in ‘2014 International Conference on Information Visualization Theory and Applications (IVAPP)’, IEEE, pp. 178–186.
-
Martin et al. (2020)
Martin, L., Muller, B., Ortiz Suárez, P. J., Dupont, Y., Romary, L., de la
Clergerie, É., Seddah, D. & Sagot, B. (2020), CamemBERT: a tasty French language model, in ‘Proceedings of the 58th Annual Meeting of the Association for
Computational Linguistics’, Association for Computational Linguistics,
Online, pp. 7203–7219.
https://www.aclweb.org/anthology/2020.acl-main.645 - McInnes, Healy & Melville (2018) McInnes, L., Healy, J. & Melville, J. (2018), ‘Umap: Uniform manifold approximation and projection for dimension reduction’, arXiv preprint arXiv:1802.03426 .
- McInnes, Healy, Saul & Grossberger (2018) McInnes, L., Healy, J., Saul, N. & Grossberger, L. (2018), ‘Umap: Uniform manifold approximation and projection’, The Journal of Open Source Software 3(29), 861.
- Meinecke et al. (2022) Meinecke, C., Hall, C. & Jänicke, S. (2022), ‘Towards enhancing virtual museums by contextualizing art through interactive visualizations’, Journal on Computing and Cultural Heritage (JOCCH) .
- Meinecke et al. (2021) Meinecke, C., Wrisley, D. & Janicke, S. (2021), ‘Explaining semi-supervised text alignment through visualization’, IEEE Transactions on Visualization and Computer Graphics .
- Miller (1995) Miller, G. A. (1995), ‘Wordnet: a lexical database for english’, Communications of the ACM 38(11), 39–41.
- Monnier & Aubry (2020) Monnier, T. & Aubry, M. (2020), docextractor: An off-the-shelf historical document element extraction, in ‘2020 17th International Conference on Frontiers in Handwriting Recognition (ICFHR)’, IEEE, pp. 91–96.
- Munzner (2009) Munzner, T. (2009), ‘A nested model for visualization design and validation’, IEEE transactions on visualization and computer graphics 15(6), 921–928.
- nationale de France (2003) nationale de France, B. (2003), ‘Mandragore, base des manuscrits enluminés de la bnf’, http://mandragore.bnf.fr. (Retrieved 2022-03-31).
- Otsu (1979) Otsu, N. (1979), ‘A threshold selection method from gray-level histograms’, IEEE transactions on systems, man, and cybernetics 9(1), 62–66.
- Parra et al. (2014) Parra, D., Brusilovsky, P. & Trattner, C. (2014), See what you want to see: visual user-driven approach for hybrid recommendation, in ‘Proceedings of the 19th international conference on Intelligent User Interfaces’, pp. 235–240.
- Qwaider et al. (2017) Qwaider, M. R., Minard, A.-L., Speranza, M. & Magnini, B. (2017), Find problems before they find you with annotatorpro’s monitoring functionalities., in ‘CLiC-it’.
- Ritter et al. (2018) Ritter, C., Altenhofen, C., Zeppelzauer, M., Kuijper, A., Schreck, T. & Bernard, J. (2018), Personalized visual-interactive music classification., in ‘EuroVA@ EuroVis’, pp. 31–35.
- Schlecht et al. (2011) Schlecht, J., Carqué, B. & Ommer, B. (2011), Detecting gestures in medieval images, in ‘2011 18th IEEE International Conference on Image Processing’, IEEE, pp. 1285–1288.
- Schreck et al. (2008) Schreck, T., Schüßler, M., Zeilfelder, F. & Worm, K. (2008), ‘Butterfly plots for visual analysis of large point cloud data’.
- Sevastjanova et al. (2021) Sevastjanova, R., Jentner, W., Sperrle, F., Kehlbeck, R., Bernard, J. & El-Assady, M. (2021), ‘Questioncomb: A gamification approach for the visual explanation of linguistic phenomena through interactive labeling’, ACM Transactions on Interactive Intelligent Systems (TiiS) 11(3-4), 1–38.
- Shneiderman (2003) Shneiderman, B. (2003), The eyes have it: A task by data type taxonomy for information visualizations, in ‘The craft of information visualization’, Elsevier, pp. 364–371.
- Snyder et al. (2019) Snyder, L. S., Lin, Y.-S., Karimzadeh, M., Goldwasser, D. & Ebert, D. S. (2019), ‘Interactive learning for identifying relevant tweets to support real-time situational awareness’, IEEE transactions on visualization and computer graphics 26(1), 558–568.
- Sperrle et al. (2019) Sperrle, F., Sevastjanova, R., Kehlbeck, R. & El-Assady, M. (2019), Viana: Visual interactive annotation of argumentation, in ‘2019 IEEE Conference on Visual Analytics Science and Technology (VAST)’, IEEE, pp. 11–22.
- Sugiyama et al. (1981) Sugiyama, K., Tagawa, S. & Toda, M. (1981), ‘Methods for visual understanding of hierarchical system structures’, IEEE Transactions on Systems, Man, and Cybernetics 11(2), 109–125.
- Sun, Ajwani, Nicholson, Sala & Parthasarathy (2017) Sun, J., Ajwani, D., Nicholson, P. K., Sala, A. & Parthasarathy, S. (2017), Breaking cycles in noisy hierarchies, in ‘Proceedings of the 2017 ACM on Web Science Conference’, pp. 151–160.
- Sun, Lank & Terry (2017) Sun, Y., Lank, E. & Terry, M. (2017), Label-and-learn: Visualizing the likelihood of machine learning classifier’s success during data labeling, in ‘Proceedings of the 22nd International Conference on Intelligent User Interfaces’, pp. 523–534.
- Tan & Le (2019) Tan, M. & Le, Q. (2019), Efficientnet: Rethinking model scaling for convolutional neural networks, in ‘International conference on machine learning’, PMLR, pp. 6105–6114.
- Thudt et al. (2012) Thudt, A., Hinrichs, U. & Carpendale, S. (2012), The bohemian bookshelf: supporting serendipitous book discoveries through information visualization, in ‘Proceedings of the SIGCHI Conference on Human Factors in Computing Systems’, pp. 1461–1470.
- Úbeda et al. (2020) Úbeda, I., Saavedra, J. M., Nicolas, S., Petitjean, C. & Heutte, L. (2020), ‘Improving pattern spotting in historical documents using feature pyramid networks’, Pattern Recognition Letters 131, 398–404.
- Wall et al. (2017) Wall, E., Das, S., Chawla, R., Kalidindi, B., Brown, E. T. & Endert, A. (2017), ‘Podium: Ranking data using mixed-initiative visual analytics’, IEEE transactions on visualization and computer graphics 24(1), 288–297.
- Ware et al. (2001) Ware, M., Frank, E., Holmes, G., Hall, M. & Witten, I. H. (2001), ‘Interactive machine learning: letting users build classifiers’, International Journal of Human-Computer Studies 55(3), 281–292.
- Wevers & Smits (2020) Wevers, M. & Smits, T. (2020), ‘The visual digital turn: Using neural networks to study historical images’, Digital Scholarship in the Humanities 35(1), 194–207.
- Willett et al. (2011) Willett, W., Heer, J., Hellerstein, J. & Agrawala, M. (2011), Commentspace: structured support for collaborative visual analysis, in ‘Proceedings of the SIGCHI conference on Human Factors in Computing Systems’, pp. 3131–3140.
- Windhager et al. (2018) Windhager, F., Federico, P., Schreder, G., Glinka, K., Dörk, M., Miksch, S. & Mayr, E. (2018), ‘Visualization of cultural heritage collection data: State of the art and future challenges’, IEEE transactions on visualization and computer graphics 25(6), 2311–2330.
- Wu et al. (2020) Wu, J., Sheng, V. S., Zhang, J., Li, H., Dadakova, T., Swisher, C. L., Cui, Z. & Zhao, P. (2020), ‘Multi-label active learning algorithms for image classification: Overview and future promise’, ACM Computing Surveys (CSUR) 53(2), 1–35.
- Xiang et al. (2019) Xiang, S., Ye, X., Xia, J., Wu, J., Chen, Y. & Liu, S. (2019), Interactive correction of mislabeled training data, in ‘2019 IEEE Conference on Visual Analytics Science and Technology (VAST)’, IEEE.
- Yang et al. (2020) Yang, K., Qinami, K., Fei-Fei, L., Deng, J. & Russakovsky, O. (2020), Towards fairer datasets: Filtering and balancing the distribution of the people subtree in the imagenet hierarchy, in ‘Proceedings of the 2020 Conference on Fairness, Accountability, and Transparency’, pp. 547–558.
- Yarlagadda et al. (2010) Yarlagadda, P., Monroy, A., Carque, B. & Ommer, B. (2010), Recognition and analysis of objects in medieval images, in ‘Asian Conference on Computer Vision’, Springer, pp. 296–305.
- Zhao et al. (2016) Zhao, J., Glueck, M., Breslav, S., Chevalier, F. & Khan, A. (2016), ‘Annotation graphs: A graph-based visualization for meta-analysis of data based on user-authored annotations’, IEEE transactions on visualization and computer graphics 23(1), 261–270.