A 0.9% calibration of the Galactic Cepheid luminosity scale
based on Gaia DR3 data of open clusters and Cepheids ††thanks: Tables 1 - 5, 7, 11 and 17 are available in electronic form
at the CDS via anonymous ftp to cdsarc.cds.unistra.fr (130.79.128.5)
or via https://cdsarc.cds.unistra.fr/cgi-bin/qcat?J/A+A/
We have conducted a search for open clusters in the vicinity of classical Galactic Cepheids based on high-quality astrometry from the third data release (DR3) of the ESA mission Gaia to improve the calibration of the Leavitt law (LL). Our approach requires no prior knowledge of existing clusters, allowing us to both detect new host clusters and cross-check previously reported associations. Our Gold sample consists of 34 Cepheids residing in 28 open clusters, including 27 fundamental mode and seven overtone Cepheids. Three new bona fide cluster Cepheids are reported (V0378 Cen, ST Tau, and GH Lup) and the host cluster identifications for three others (VW Cru, IQ Nor, and SX Vel) are corrected. The fraction of Cepheids occurring in open clusters within kpc of the Sun is . Nonvariable cluster members allow us to determine cluster parallaxes to as in the range mag, where recent studies found that parallax corrections by Lindegren et al. (2021) (L21) are accurate and require no further offset corrections. By comparing Cepheids in MW clusters to Cepheids in the LMC, we confirm these independent results and the adequacy of the L21 corrections for the cluster members in this range. By combining cluster and field Cepheids, we calibrate the LL for several individual photometric passbands, together with reddening-free Wesenheit magnitudes based on Gaia and HST photometry, while solving for the residual offset applicable to Cepheid parallaxes, . The most direct comparison of our results with the SH0ES distance ladder yields excellent () agreement for both the absolute magnitude of a d solar metallicity Cepheid in the near-IR HST Wesenheit magnitudes, mag, and the residual parallax offset, as. Despite the use of a common set of photometry, this is an important cross-check of the recent Hubble constant measurement by Riess et al. (2022a) based on independently determined cluster membership and average parallaxes. Using the larger sample of Gold cluster Cepheids and MW Cepheids with recent Gaia DR3 astrometry and photometry, we determine mag in the optical Gaia Wesenheit magnitude at the sample average iron abundance of () and as. Correcting to solar metallicity yields mag and as. These results mark the currently most accurate absolute calibrations of the Cepheid luminosity scale based purely on observations of Milky Way Cepheids, and it is also the most precise determination of the residual Cepheid parallax offset at a significance of .
Key Words.:
Stars:distances – Stars: variables: Cepheids – open clusters and associations: general – distance scale1 Introduction
The absolute calibration of the classical Cepheid luminosity scale is fundamental for a distance estimation in the nearby Universe and the accurate measurement of Hubble’s constant, . The third data release (DR3) of the ESA mission Gaia has provided astrometry of unprecedented quantity and quality (The Gaia collaboration et al., 2016, 2021) for approximately 1.5 billion stars in the magnitude range , including 14992 classical Cepheid stars (Eyer et al., 2022; Ripepi et al., 2022b) with an average parallax uncertainty of as. Because the parallax is generally considered the gold standard of geometric distance measurements, the Gaia parallaxes are of crucial importance for the absolute calibration of Leavitt’s law Leavitt & Pickering (1912, henceforth: LL), also known as the period-luminosity relation, and they are of great interest for all further applications of Cepheids as distance tracers. In particular, Gaia parallaxes are required to clarify the implications of the current discrepancy between the value of measured using a distance ladder composed of classical Cepheids and type Ia supernovae (e.g., Riess et al., 2022b) and the value of inferred from observations of the ESA mission Planck of the cosmic microwave background assuming a flat CDM Universe (Planck Collaboration et al., 2020).
However, Gaia-based LL calibrations based on Cepheid parallaxes must currently simultaneously solve for a residual parallax offset due to systematics of the Gaia data processing in addition to the LL intercept and slope (e.g., Riess et al., 2021). Because this simultaneous parallax offset determination reduces the precision to which Gaia can calibrate the LL, strategies for mitigating this problem are needed.
Lindegren et al. (2021, henceforth: L21) derived corrections to the zeropoint offset of about arcsec, whose exact value depends nontrivially on the magnitude of the observed source, its position in the sky, and its color. Several studies (not necessarily based on Cepheids) have investigated residual (compared to Lindegren’s correction) zeropoint offsets, generally finding good agreement at magnitudes ( mag) at which L21 is well calibrated (e.g., Huang et al., 2021; Riess et al., 2021; El-Badry et al., 2021), whereas an offset remains at the brighter end, where the L21 calibration was based on fewer sources. The origins of these residual offsets are complex and not yet fully understood, although it is likely that they originate from differences between the Cepheid and quasar samples, with Cepheids being systematically brighter, of redder intrinsic color, and photometrically and chromatically variable. Moreover, the Milky Way Cepheids that were used to calibrate the LL fall within a magnitude range ( mag) that requires special observational and data-processing steps to avoid saturation (including the gating mechanism to avoid saturation and changing from 2D to 1D image processing for the astrometric model, cf. L21).
An interesting possibility for avoiding difficulties related to this zeropoint systematic could be the use of parallax information derived from stars that are observationally as similar as possible to the objects used to determine the Gaia systematics. Because Cepheids are relatively young stars ( Myr), they are occasionally found in open star clusters (cf. Anderson et al., 2013, and references therein), whose brightest main-sequence members will tend to be bluer than Cepheids, and several magnitudes fainter. At the same time, open clusters contain many stars, so that an average cluster parallax will benefit from a improvement in precision, eventually limited by the angular covariance of the Gaia parallaxes (Lindegren et al., 2021; Apellániz et al., 2021; Vasiliev & Baumgardt, 2021; Zinn, 2021).
The currently most common approach to identifying cluster Cepheids is to consider cluster input lists from studies based on Gaia astrometry (Cantat-Gaudin & Anders, 2020; Hunt & Reffert, 2021; Castro-Ginard et al., 2022; Zhou & Chen, 2021; He et al., 2022) and to then compare the astrometric parameters of Cepheids with the average cluster parameters (Anderson et al., 2013; Breuval et al., 2020; Zhou & Chen, 2021; Medina et al., 2021). However, there is no guarantee that all Cepheid-hosting clusters have been detected so far, and the selection function of clusters is not well known. It is also rather common for Cepheids to reside in the coronae of their host clusters, that is, farther from the center than the typical cluster core radius of pc (e.g., Anderson et al., 2013). This is to some extent expected from the clustered star formation process that causes the majority of birth clusters to disperse into the field over timescales of tens of million years (Dinnbier et al., 2022). Tidal deformations further cause cluster shapes to deviate from circular over hundreds of million years, thus breaking the symmetry of the appearance and complicating the detection of cluster members against a highly contaminated background (Boffin et al., 2022). Additionally, it is quite common for multiple clusters to exist relatively close to each other on the sky (Turner, 1998) because of the high density of clusters in spiral arms and the superposition on sky of multiple spiral arms. Substantial and spatially variable extinction can further complicate the issue. To most reliably determine the most complete sample of cluster Cepheids detectable with Gaia DR3 data, we therefore adopted the approach of searching for clusters in the vicinity of Cepheids, rather than the other way around.
A major improvement of the extragalactic distance ladder built by the SH0ES project (Riess et al., 2022b) has been the photometric homogeneity of Cepheid observations carried out exclusively in the Hubble Space Telescope (HST) photometric system. With the release of time-series observations in Gaia DR3, there is now an additional data set of very high quality, well-resolved multichromatic observations based on a well-characterized and homogeneous photometric system that includes observations of Milky Way and Local Group Cepheids, reaching Cepheids as far as M31 and M33 (Evans et al., 2022), albeit with increased uncertainties due to higher instrumental noise and higher crowding. The goal of this paper is to leverage these unprecedented data sets to achieve the most accurate absolute calibration of the MW LL in well-characterized filters, notably including the reddening-free near-IR HST Wesenheit function used by the SH0ES team to measure the Hubble constant (Riess et al., 2022b), while simultaneously solving for the residual parallax offset of Cepheids.
This article is organized as follows. Section 2 describes our method for detecting and estimating the parameters of clusters in the physical vicinity of MW Cepheids based on Gaia data and the estimation of membership probabilities for the Cepheids. Section 3 separates the sample of cluster Cepheid candidates into Gold, Silver, and Bronze samples. Section 4 presents the simultaneous calibration of the Cepheid LL in multiple photometric bands and an LMC-based cross-check of the L21 corrections applied to cluster member stars. Section 5 presents an additional discussion, and Sect. 6 lists our conclusions. Additional tables and figures are provided in the online appendix.
2 Method
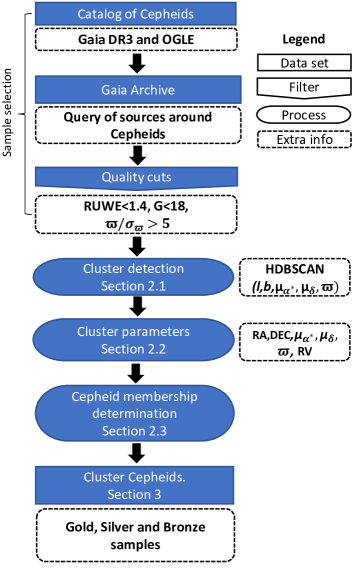
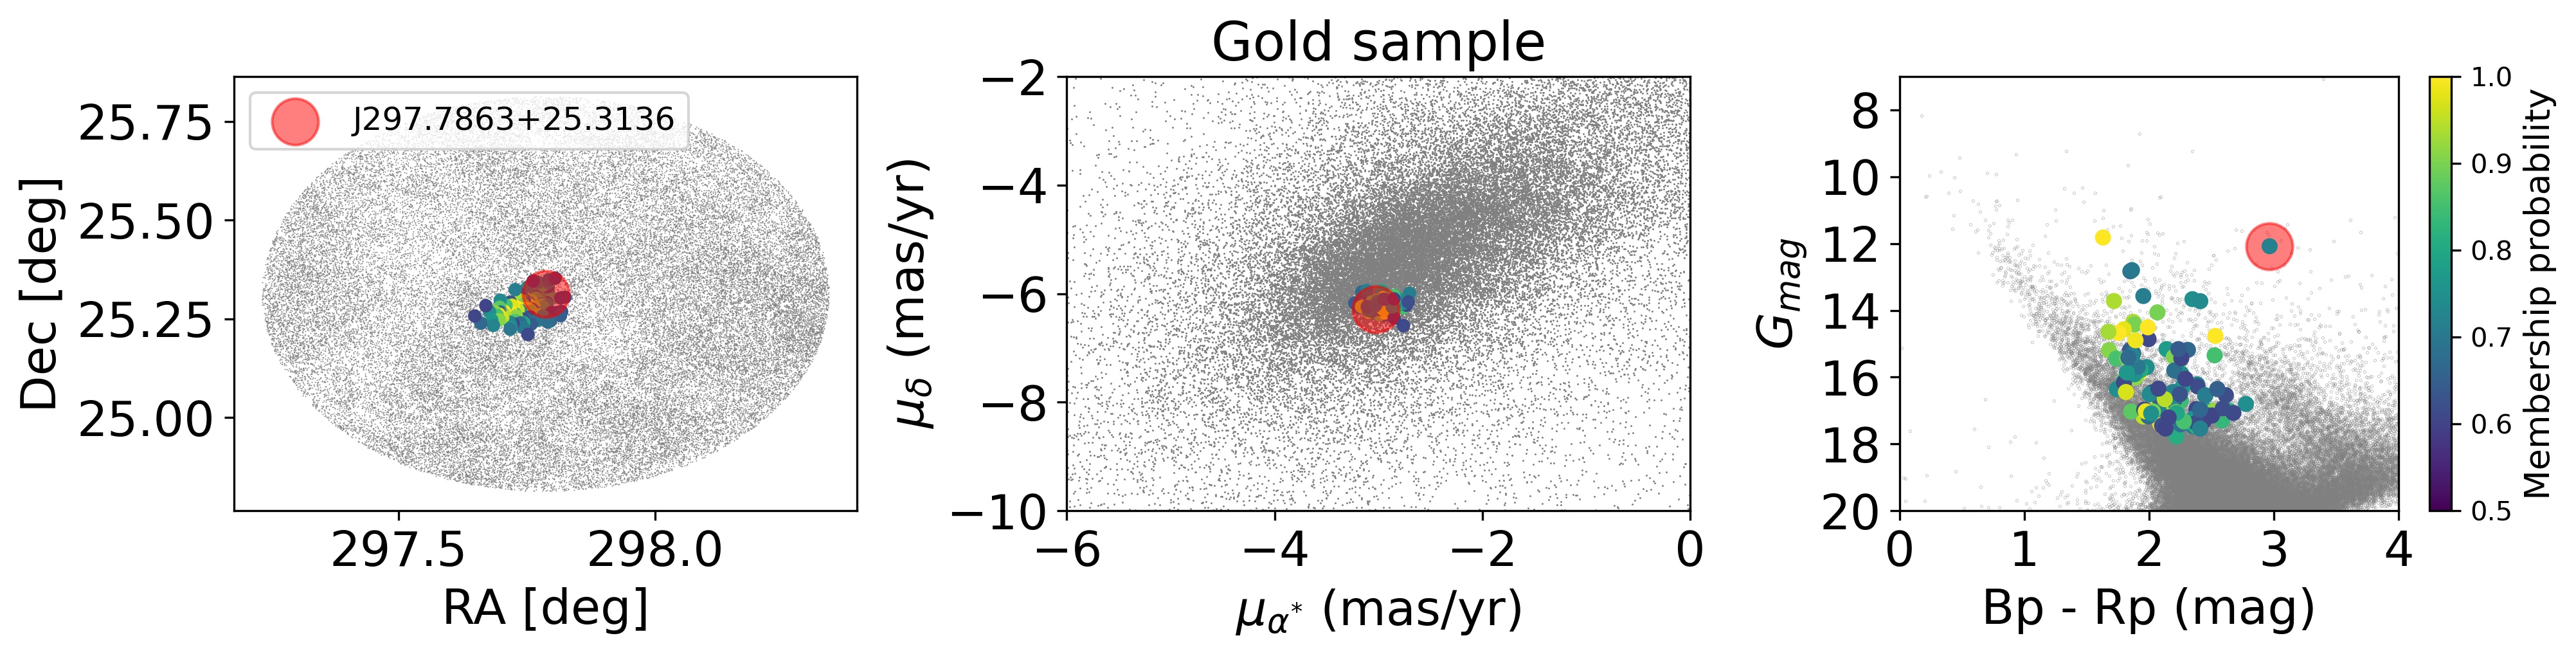
The starting point of our analysis was the list of positions of 3352 Milky Way classical Cepheids that were classified by the OGLE collaboration based on a large combination of all-sky time-series survey data (Pietrukowicz et al., 2021), which we extended by 230 additional classical Cepheids that were reported by Gaia DR3 in June 2022 (Ripepi et al., 2022b; Eyer et al., 2022). While there can be disagreements over Cepheid classifications, especially for overtone Cepheids with sinusoidal light curves, we note that the list by Pietrukowicz et al. (2021) was used to validate the Gaia DR3 sample, and that the samples of MW Cepheids overlap by . Extragalactic Cepheids and Cepheids that are too distant for identifying clusters were removed from the Gaia DR3 sample by the quality cuts explained in Sec. 2.1 and by requiring Cepheids to be brighter than mag. For each Cepheid we considered, we retrieved all stars within a radius of one degree from the Gaia archive111https://gea.esac.esa.int/archive/ and then searched for host clusters as explained in the following and as illustrated schematically in Fig. 1.
2.1 Cluster detection
Because clusters are gravitationally bound systems, cluster members share similar positions (RA, DEC), proper motions (), parallaxes (), and radial velocities. Thus, stars belonging to a common cluster can be separated from fore- or background stars as overdensities in the multidimensional space spanned by the available membership constraints.
Gaia DR3 provides information for all six of these parameters, although radial velocity information is only available for a rather limited number of stars owing to the faintness of most member stars. Hence, our analysis employs only positions, proper motions, and parallaxes for the cluster identification. Where available, radial velocity information was used to assess membership probabilities of Cepheids (cf. Sec. 2.3).
We detected clusters using the publicly available code called hierarchical density-based spatial clustering of applications with noise (McInnes et al., 2017, HDBSCAN). As is common practice, we included only stars in our analyis whose parallax signal-to-noise ratio , whose renormalised unit weight error (RUWE) is smaller than to exclude sources with poor astrometry (Fabricius et al., 2021, e.g., due to the presence of companions), and that are brighter than mag (parameter phot_g_mean_mag in table gaiadr3.gaia_source), where the Gaia astrometry is most precise. In practice, this magnitude cut represents no serious limitation for our work and allows us to clearly recover the main sequences of Cepheid-hosting clusters that are several magnitudes fainter than their Cepheid members. Gaia parallaxes of all stars considered for membership were corrected for systematics using the recipe provided by L21.
The code HDBSCAN uses the dimensional distance between objects to identify overdense regions. As Cepheids and open clusters are located in the Galactic plane, we used Galactic coordinates () for the positional constraints rather than RA and DEC. The ability of HDBSCAN to detect arbitrarily shaped clusters was particularly useful for our purposes because the physical shape of clusters in various stages of dispersal was not known a priori. The only fixed input parameter required by HDBSCAN is the number of stars that are expected to qualify an overdensity as a cluster. Deviations of the number of cluster stars from will cause overdensities with to remain undetected by HDBSCAN and may sometimes result in a single cluster being split into multiple parts if . To ensure that our analysis was not sensitive to these undesirable side effects, we repeated our analysis using ten different values for ranging from 10 to 100 in increments 10 and found a consistent number of cluster members in each case. The mean (median) number of member stars reported per cluster is 230 (152) (cf. Sect. 3).
Following Castro-Ginard et al. (2018) and Hunt & Reffert (2021), we rescaled each of the Gaia astrometric parameters to variables with zero mean and unit standard deviation by subtracting the mean from each parameter and rescaling parameters such that the percentile has unit variance. This procedure ensures equal weighting among the five dimensions and improves robustness against outliers.
Inspection of the parallax distributions returned by HDBSCAN revealed outliers in parallax. To retain only likely cluster members, we determined the mode of the parallax distribution returned by HDBSCAN and retained all cluster members whose parallaxes agreed to within standard deviations of a Gaussian fit to the parallax distribution centered on the mode.
At distances beyond kpc, cluster identification becomes increasingly limited due to the current parallax and proper motion uncertainties of Gaia. Because our goal of calibrating the Galactic LL requires utmost accuracy and precision, we prioritized greater purity (lower contamination) at the potential cost of completeness. We thus visually inspected all identified cluster candidates to ensure that cluster stars were overdense in each of the membership constraints considered and that the resulting color-magnitude diagrams indicated a coeval population being detected, as evidenced by a clearly visible main sequence. Additionally, we discarded clusters in which a majority of main-sequence stars exceeded the brightness of their candidate Cepheid members.
For each cluster, HDBSCAN provided a list of likely cluster members together with membership probabilities. By design, all identified clusters were within the projected vicinity of Cepheids. However, these same Cepheids were not necessarily selected as cluster members by HDBSCAN, requiring a separate membership analysis for Cepheids in the detected clusters (cf. Sec. 2.3).
2.2 Cluster parameters
For each cluster that passed the first visual screening, we computed the center position in RA and DEC. We additionally computed averages and dispersions in both proper motion directions, parallax, and radial velocity, where available.
2.2.1 Cluster parallaxes
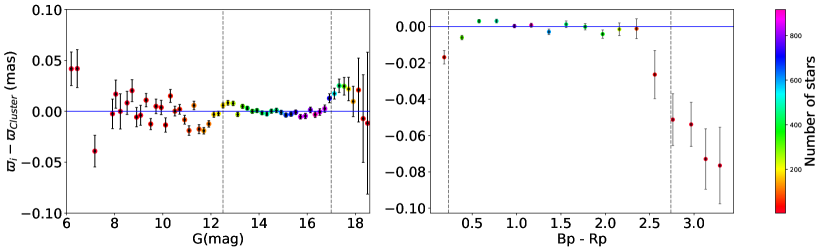
For a given source, the Gaia parallax systematics are well known to depend on its sky position as well as its magnitude and color (L21). Magnitude and color trends are likely related to the sophisticated on-board processing of Gaia, which was implemented to avoid saturation across the extreme dynamic range of the survey (limit mag). Using the cluster members returned by HDBSCAN, we investigated whether an optimal magnitude and color range could be identified to obtain the most reliable and precise average cluster parallax. We calculated the deviation from the cluster average, , for all member stars of all host clusters. We combined all values of into a single set, which we divided into bins of mag in band. For each bin, we estimated the weighted mean and the weighted error of . Figure 2 illustrates this result and shows a noticeable decrease in the variance of for and . The observed variance is dominated by the uncertainty in parallaxes for fainter stars and by lower statistics for bright stars ( mag). Systematic trends at mag can be partially due to the gating mechanism of Gaia or to differences in photometric processing 222According to Fig. 1 in L21, no gating is applied to stars fainter than mag. However, the WC0b and WC1 calibration models of the astrometric field overlap in the range mag, which implies a transition from 2D images to binned 1D images, respectively.. We note that the exact magnitude range is not critical for the estimation of the cluster parallaxes. For example, restricting the magnitude range further to mag changes the mean cluster parallax by less than as, while increasing the uncertainty in average parallax for clusters with members (e.g., CWNU 175 or vdBergh 1) by approximately as (cf. Sect. 3). Because of these clear and consistent trends and to avoid sensitivity to gating-related issues, we adopted the range of mag as the optimal range for determining high-fidelity average cluster parallaxes and their uncertainties. We further restricted the color range of member stars to to avoid the color range for which Fig. 2 shows increasing deviations from zero residuals, accompanied by increasing uncertainties due to low statistics.
Several studies have shown the existence of nonzero residual parallax offsets for stars brighter than mag after the L21 corrections were applied (e.g., Huang et al., 2021; Zinn, 2021; El-Badry et al., 2021; Riess et al., 2021, 2022a). However, analyses of open and globular clusters, as well as of the LMC, have shown the L21 procedure to accurately correct parallax systematics to within as (Flynn et al., 2022; Maíz Apellániz, 2022) in the optimal magnitude and color range established above. As a result, a significant nonzero residual parallax offset is expected for (bright) Cepheids, while no residual parallax offset is expected for cluster members after the L21 corrections are applied.
The final cluster parallaxes were computed as the weighted mean of the retained cluster members. The total parallax uncertainty sums the statistical uncertainty determined as the error on the weighted mean in quadrature and the systematic contribution due to angular covariance determined by Apellániz et al. (2021). Because our initial search radius around Cepheids is deg, the full diameters of all clusters is significantly smaller than deg. This allowed us to consider the estimation of angular covariance based on the LMC alone as given by in their Eq. 10 (cf. also Sect. 2.2 in Ripepi et al., 2022c), neglecting wide-angle contributions estimated using quasars. This is analogous to the approach taken by Zinn (2021) in conjunction with the angular covariance estimates based on the Kepler field. In practice, this reduces the error floor for average cluster parallaxes from to as. Because the mean separation of our Cepheid clusters is very large, covariance among clusters is negligible.
2.2.2 Maximum angular separations
We calculated the projected distance of the Cepheid from cluster center assuming that both objects are at the distance of the cluster. Candidate associations with separations greater than pc were discarded in favor of sample purity and to ensure that cluster average parallaxes can be used as accurate proxies for Cepheid parallaxes. Hypothetical Cepheids residing in extended tidal tails (Jerabkova et al., 2021) would thus be excluded from our analysis. We refer to Cepheids as coronal cluster members if their projected separation from cluster center exceeds pc but does not exceed pc.
2.2.3 Proper motions
We computed bulk cluster proper motions as the mean of all clusters members as well as proper motion dispersions using cluster members in the color and magnitude range used for parallaxes. We used proper motions to reject cluster candidates as spurious asterisms if the resulting velocity dispersion exceeded reasonable values for gravitationally bound systems following Cantat-Gaudin & Anders (2020) and Hunt & Reffert (2021). Specifically, up to mas, we rejected associations whose projected velocity dispersion exceeds ( ), whereas a maximum difference of was allowed for clusters with a smaller parallax to reflect the increased uncertainties, in particular, of the fainter main-sequence cluster members. Thus, we required333We recall that , so that at mas (1.5 kpc).
| (1) |
In practice, however, all retained clusters exhibit a significantly lower velocity dispersion, with a mean value of (cf. Fig. A). Inspection revealed that the proper motion dispersion estimated using only spatially densely concentrated cluster members returned by our clustering analysis underestimated the intrinsic velocity dispersion of true cluster members observed at large angular separations, which require a statistically greater velocity dispersion to reach their large separations from cluster centers. To avoid unrealistically low membership probabilities for coronal cluster Cepheids (cf. Sec. 2.3), we therefore adopted twice the standard deviation determined based on the member stars recovered by HDBSCAN as the more conservative estimate of true cluster proper motion dispersion when assessing Cepheid membership in clusters.
2.2.4 Radial velocity
Cluster radial velocities (RV) are computed using Gaia DR3 mean radial velocities (Katz et al., 2022, parameter radial_velocity from table gaia_source). For each cluster with available DR3 RVs, Table 1 lists the number of (non-Cepheid) cluster member stars, their median RV, standard error on the cluster median RV, and the Cepheid paramaters.
We did not consider cluster RVs based on few stars () sufficiently reliable for further analysis. Thus, we did not consider RV as a membership constraint for the candidate host clusters of WX Pup, CV Mon, IQ Nor, and SX Vel.
2.3 Cepheid membership determination
We computed cluster membership probabilities for Cepheids whose proper motions and parallaxes separately agreed to within approximately of their potential host cluster parameters. This subsection presents our method, and the resulting probabilities are presented in Sec. 3. A tolerance of up to was permitted in this initial screening. In this context, refers to combined (square-summed) dispersions or uncertainties, depending on the parameter, of clusters and Cepheids as follows. For proper motions, the cluster dispersion as described in Sec. 2.2.3 was combined with the Cepheid uncertainties reported by Gaia. For parallaxes, contains the squared sum of uncertainties of the weighted cluster average (no significant internal dispersion expected), the individual Cepheid parallax uncertainty, and an additional as uncertainty to reflect the magnitude dependence of the residual parallax offset after applying the L21 corrections.
We computed Cepheid membership probabilities using the likelihood formalism developed in Anderson et al. (2013) and the membership constraints , , , and RVs. Strictly speaking, this approach performs a hypothesis test under the null hypothesis of the Cepheid cluster membership and can only reject this null hypothesis, not prove it. As in Anderson et al. (2013), we computed the Bayesian likelihood , where is the value of the distributed quantity
| (2) |
where the vector contains the differences between Cepheid and cluster parameters, that is,
| (3) |
and is the diagonal covariance matrix containing the squared values of for the various membership constraints, as explained above. Our threshold for rejecting the membership hypothesis was , which corresponds to a rejection criterion. Stars with a higher probability are considered bona fide cluster Cepheids provided the host cluster detection is sufficiently robust.
Radial velocities were included in this calculation if cluster average RVs () could be estimated using at least three member stars and if Cepheid systemic radial velocities, , could be determined using a Fourier series fit to time-series data from either the velocities of Cepheids project (cf. Anderson et al. in prep., VELOCE I) or the literature (e.g., Anderson et al., 2016a). In addition to cluster average values, Table 1 lists RV data for Cepheids, including , its uncertainty, references to data used, and the difference between cluster median and Cepheid , the total uncertainty (summed in quadrature), and the difference between cluster and Cepheid in units of the total uncertainty. The only Cepheid for which RV information significantly contradicts membership is XZ Car, which is part of our Silver sample (cf. Sect. 3.2). All other stars are found to agree to within with their host cluster median velocities. Further information about Cepheid RVs and Gaia DR3 radial velocities of Cepheids will be provided as part of the VELOCE project (Anderson et al. in prep.).
| Cluster | median RV | Cepheid | Refs | |||||||
|---|---|---|---|---|---|---|---|---|---|---|
| () | () | () | () | () | () | |||||
| UBC 129 | 9 | -14.84 | 6.18 | X Vul | -14.54 | 0.14 | a;b;c | -0.30 | 6.18 | 0.05 |
| NGC 103 | 7 | -77.88 | 9.89 | NO Cas | -79.13 | 0.17 | V | 1.25 | 9.89 | 0.13 |
| UBC 130 | 3 | -0.20 | 2.08 | SV Vul | -0.68 | 2.80 | V | 0.49 | 3.49 | 0.14 |
| NGC 6067 | 93 | -39.04 | 3.10 | QZ Nor | -38.60 | 0.13 | V | -0.44 | 3.10 | 0.14 |
| UBC 290 | 19 | -23.50 | 5.17 | X Cru | -24.26 | 0.15 | d | 0.76 | 5.17 | 0.15 |
| NGC 6067 | 93 | -39.04 | 3.10 | V0340 Nor | -39.63 | 0.09 | V | 0.59 | 3.10 | 0.19 |
| Berkeley 58 | 3 | -71.36 | 28.59 | CG Cas | -77.52 | 0.56 | e;c;V | 6.16 | 28.59 | 0.22 |
| UBC 533 | 9 | -17.96 | 7.95 | GH Lup | -16.11 | 0.25 | f | -1.85 | 7.95 | 0.23 |
| UBC 375 | 6 | -13.13 | 9.86 | V0438 Cyg | -10.06 | 2.05 | e | -3.07 | 10.07 | 0.30 |
| FSR 0951 | 16 | 44.02 | 3.05 | RS Ori | 42.94 | 0.04 | V | 1.08 | 3.05 | 0.35 |
| Cl X Pup | 4 | 74.70 | 10.07 | X Pup | 71.05 | 0.38 | V | 3.65 | 10.08 | 0.36 |
| NGC 6649 | 21 | -1.44 | 24.70 | V0367 Sct | -10.60 | 1.26 | e;g;b;c | 9.16 | 24.73 | 0.37 |
| Lynga 6 | 14 | -46.98 | 24.41 | TW Nor | -56.60 | 0.29 | g;b | 9.62 | 24.41 | 0.39 |
| NGC 129 | 5 | -52.12 | 6.51 | DL Cas | -46.53 | 0.32 | V | -5.59 | 6.52 | 0.86 |
| NGC 6664 | 12 | 9.33 | 8.54 | Y Sct | 14.03 | 0.15 | V | -4.70 | 8.54 | 0.55 |
| IC 4725 | 184 | 2.03 | 1.71 | U Sgr | 3.16 | 0.09 | V | -1.13 | 1.71 | 0.66 |
| CWNU 175 | 4 | 6.19 | 11.53 | VW Cru | -2.82 | 5.30 | h | 9.01 | 12.69 | 0.71 |
| NGC 7790 | 6 | -68.61 | 11.94 | CF Cas | -77.76 | 0.15 | e;h;b;c | 9.15 | 11.94 | 0.77 |
| UBC 106 | 28 | 41.88 | 2.84 | CM Sct | 39.63 | 0.24 | e;g;h | 2.25 | 2.85 | 0.79 |
| NGC 6087 | 69 | 2.91 | 2.67 | S Nor | 6.09 | 2.12 | V | -3.18 | 3.41 | 0.93 |
| Cl ST Tau | 15 | 9.01 | 6.79 | ST Tau | 1.73 | 0.26 | a;b;c;i;V | 7.28 | 6.80 | 1.07 |
| Cl V0378 Cen | 7 | -25.57 | 8.50 | V0378 Cen | -16.24 | 0.04 | V | -9.33 | 8.50 | 1.10 |
| Ruprecht 79 | 11 | 34.55 | 6.28 | CS Vel | 27.10 | 0.19 | g;b | 7.45 | 6.29 | 1.19 |
| NGC 5662 | 89 | -26.60 | 3.59 | V Cen | -21.74 | 0.08 | V | -4.86 | 3.59 | 1.35 |
| UBC 231 | 3 | 75.64 | 7.54 | WX Pup | 52.98 | 0.03 | V | 22.66 | 7.54 | (3.01) |
| Ruprecht 93 | 13 | -27.77 | 2.73 | XZ Car | 5.72 | 0.42 | V | -33.49 | 2.76 | 12.12 |
| vdBergh 1 | 1 | 9.35 | 0.00 | CV Mon | 19.44 | 0.11 | a;g;c;j | -10.09 | 0.11 | (91.71) |
| Cl IQ Nor | 1 | 6.07 | 0.00 | IQ Nor | -24.51 | 0.13 | V | 30.58 | 0.13 | (244.66) |
| Cl SX Vel | 1 | -22.52 | 0.00 | SX Vel | 29.79 | 0.05 | V | -52.31 | 0.05 | (1046.18) |
In contrast to Anderson et al. (2013), we did not explicitly use the angular separation as an external multiplicative prior because individual cluster members were already separated from the background by our clustering analysis. However, our use of a maximum allowed projected separation of pc could be seen as a flat prior with for absolute projected separations smaller than this cutoff value. Ages and chemical compositions were not considered in the calculation of the likelihood.
3 Cluster Cepheids
We grouped our sample of cluster Cepheids into Gold, Silver, and Bronze samples according to the following criteria. The Gold sample contains cluster Cepheids whose host cluster detections were robust and whose membership likelihoods exceeded the threshold for rejecting the membership hypothesis (cf. Sec. 2.3). This sample is best suited for LL calibration. The Silver sample contains cases where the host cluster detection is solid, whereas the likelihood computation quantitatively rejects cluster membership due to a difference slightly larger than in individual constraints. This sample is of particular interest for the further study to refine possible membership, for instance, taking uncertainties related to stellar multiplicity into account. The Bronze sample is composed of two cases for which the host cluster detection is not as clean as in the Gold sample.
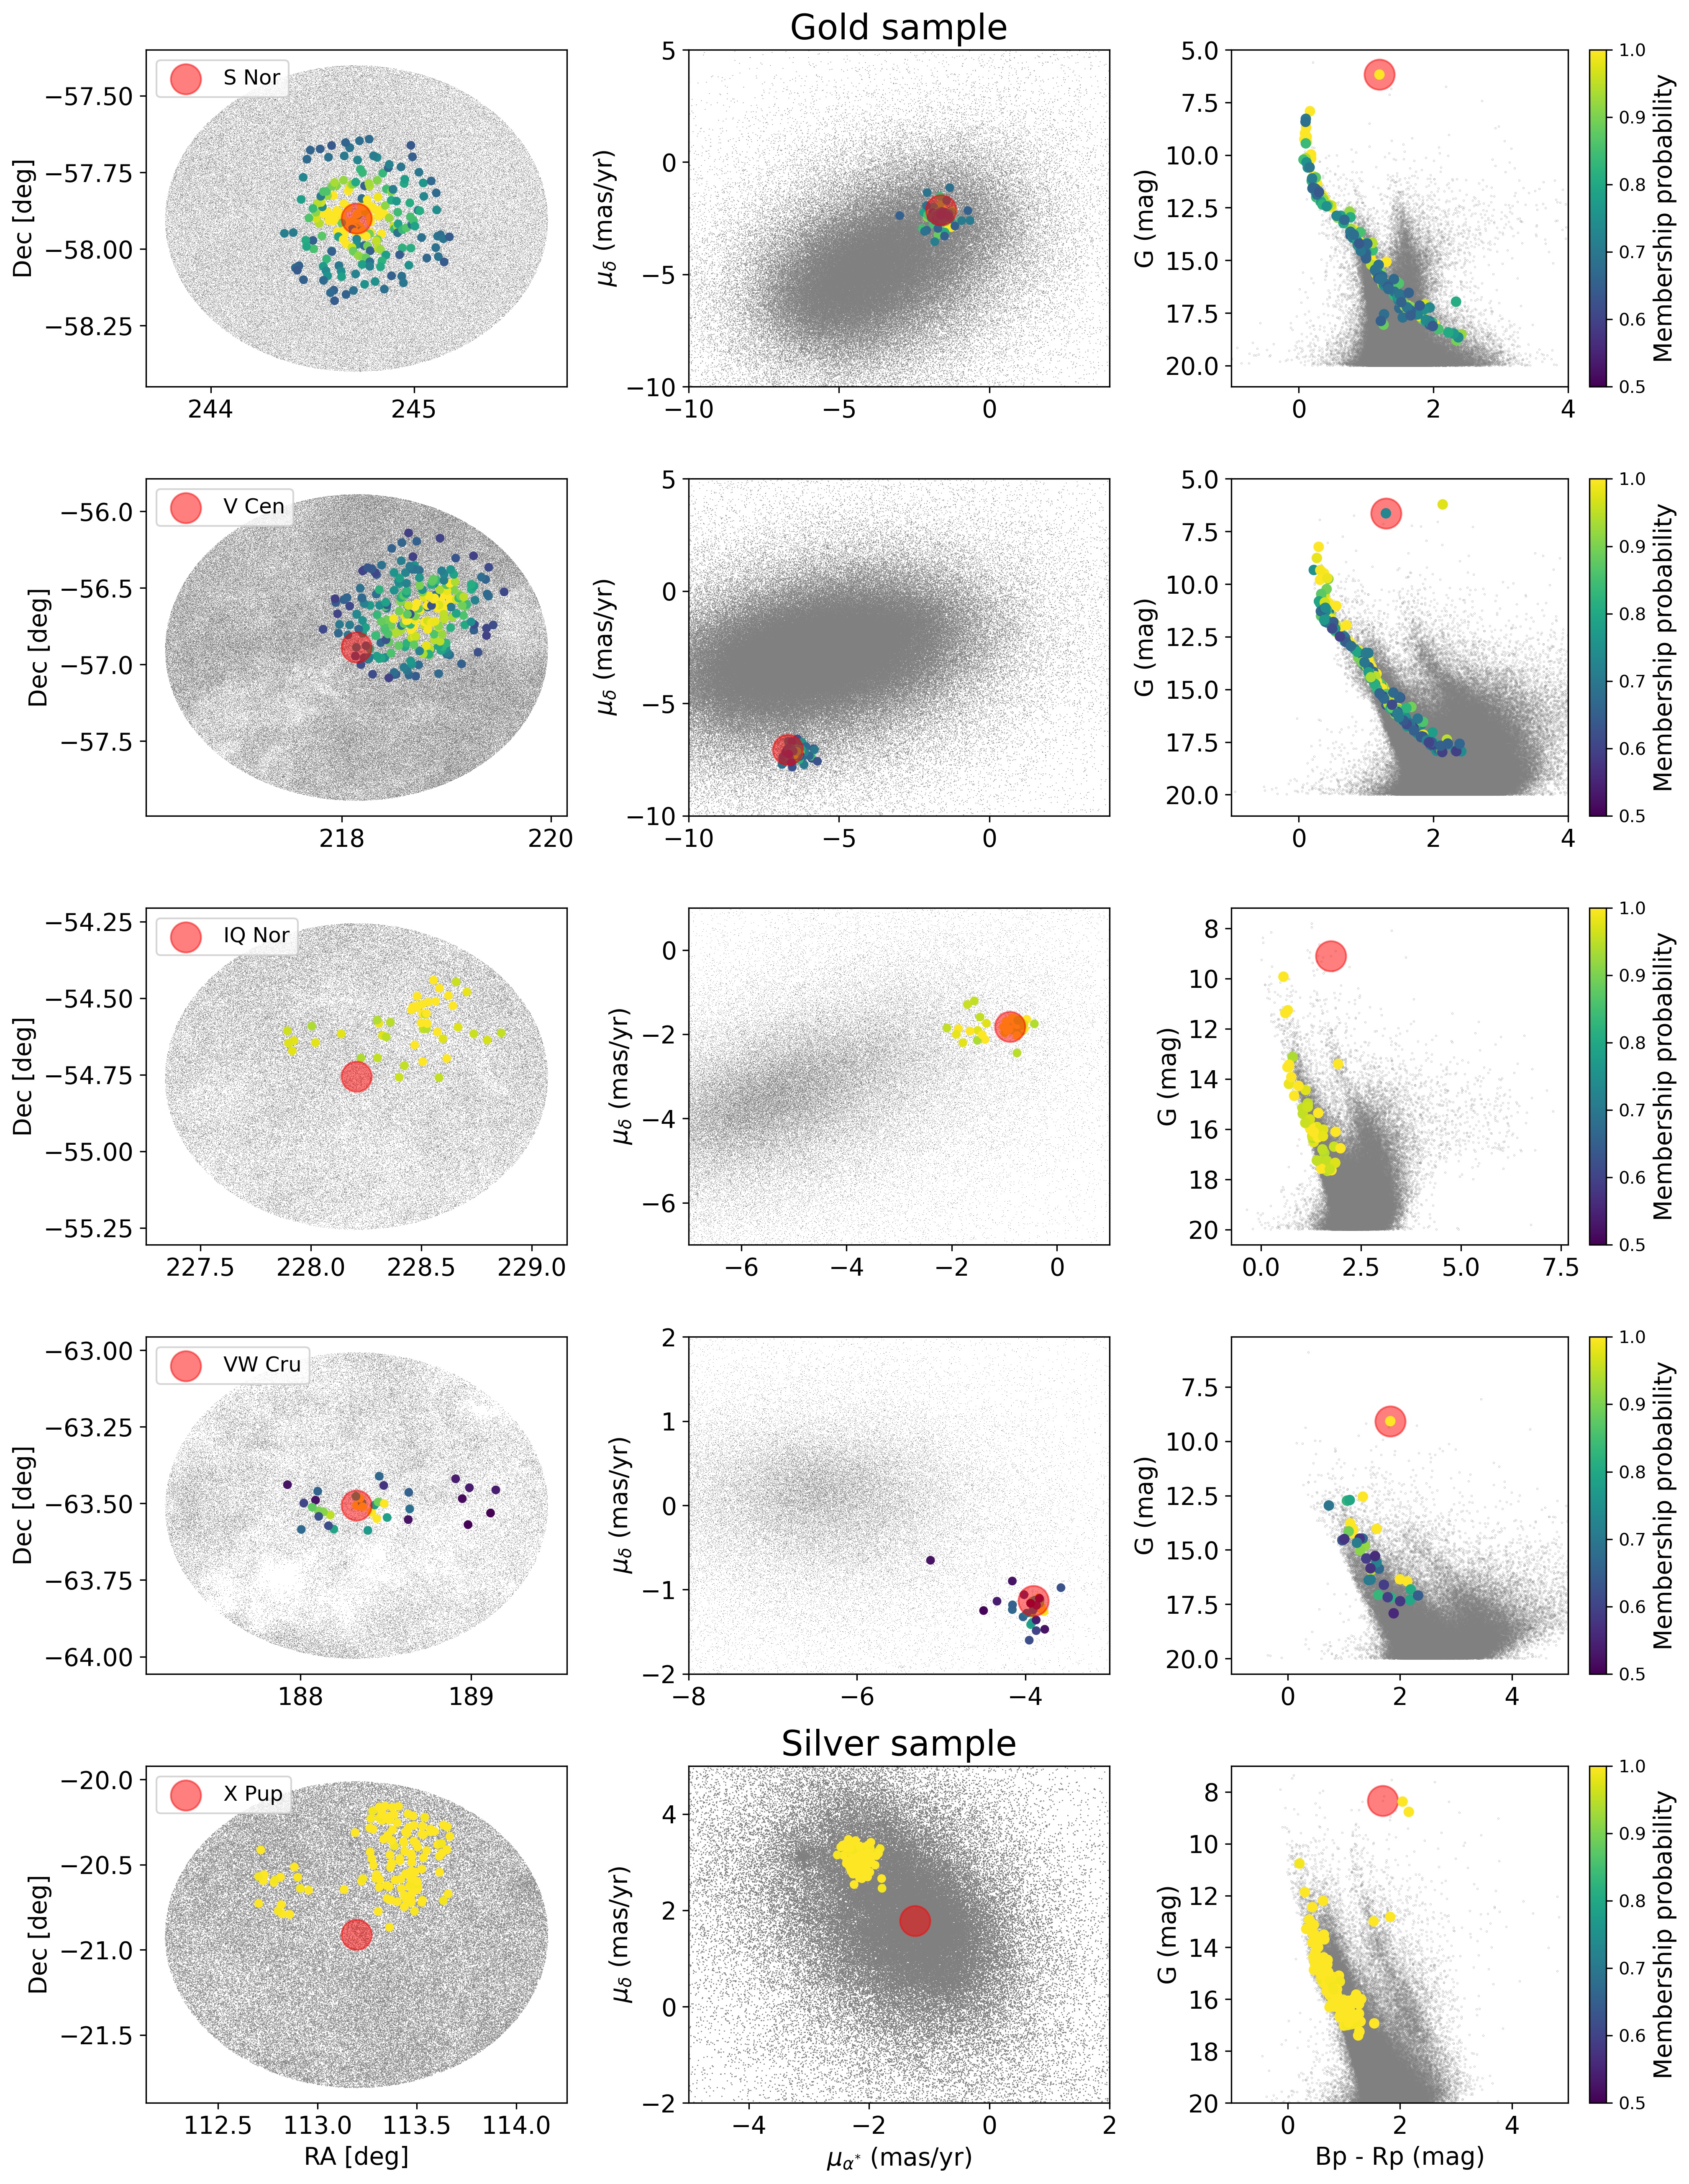
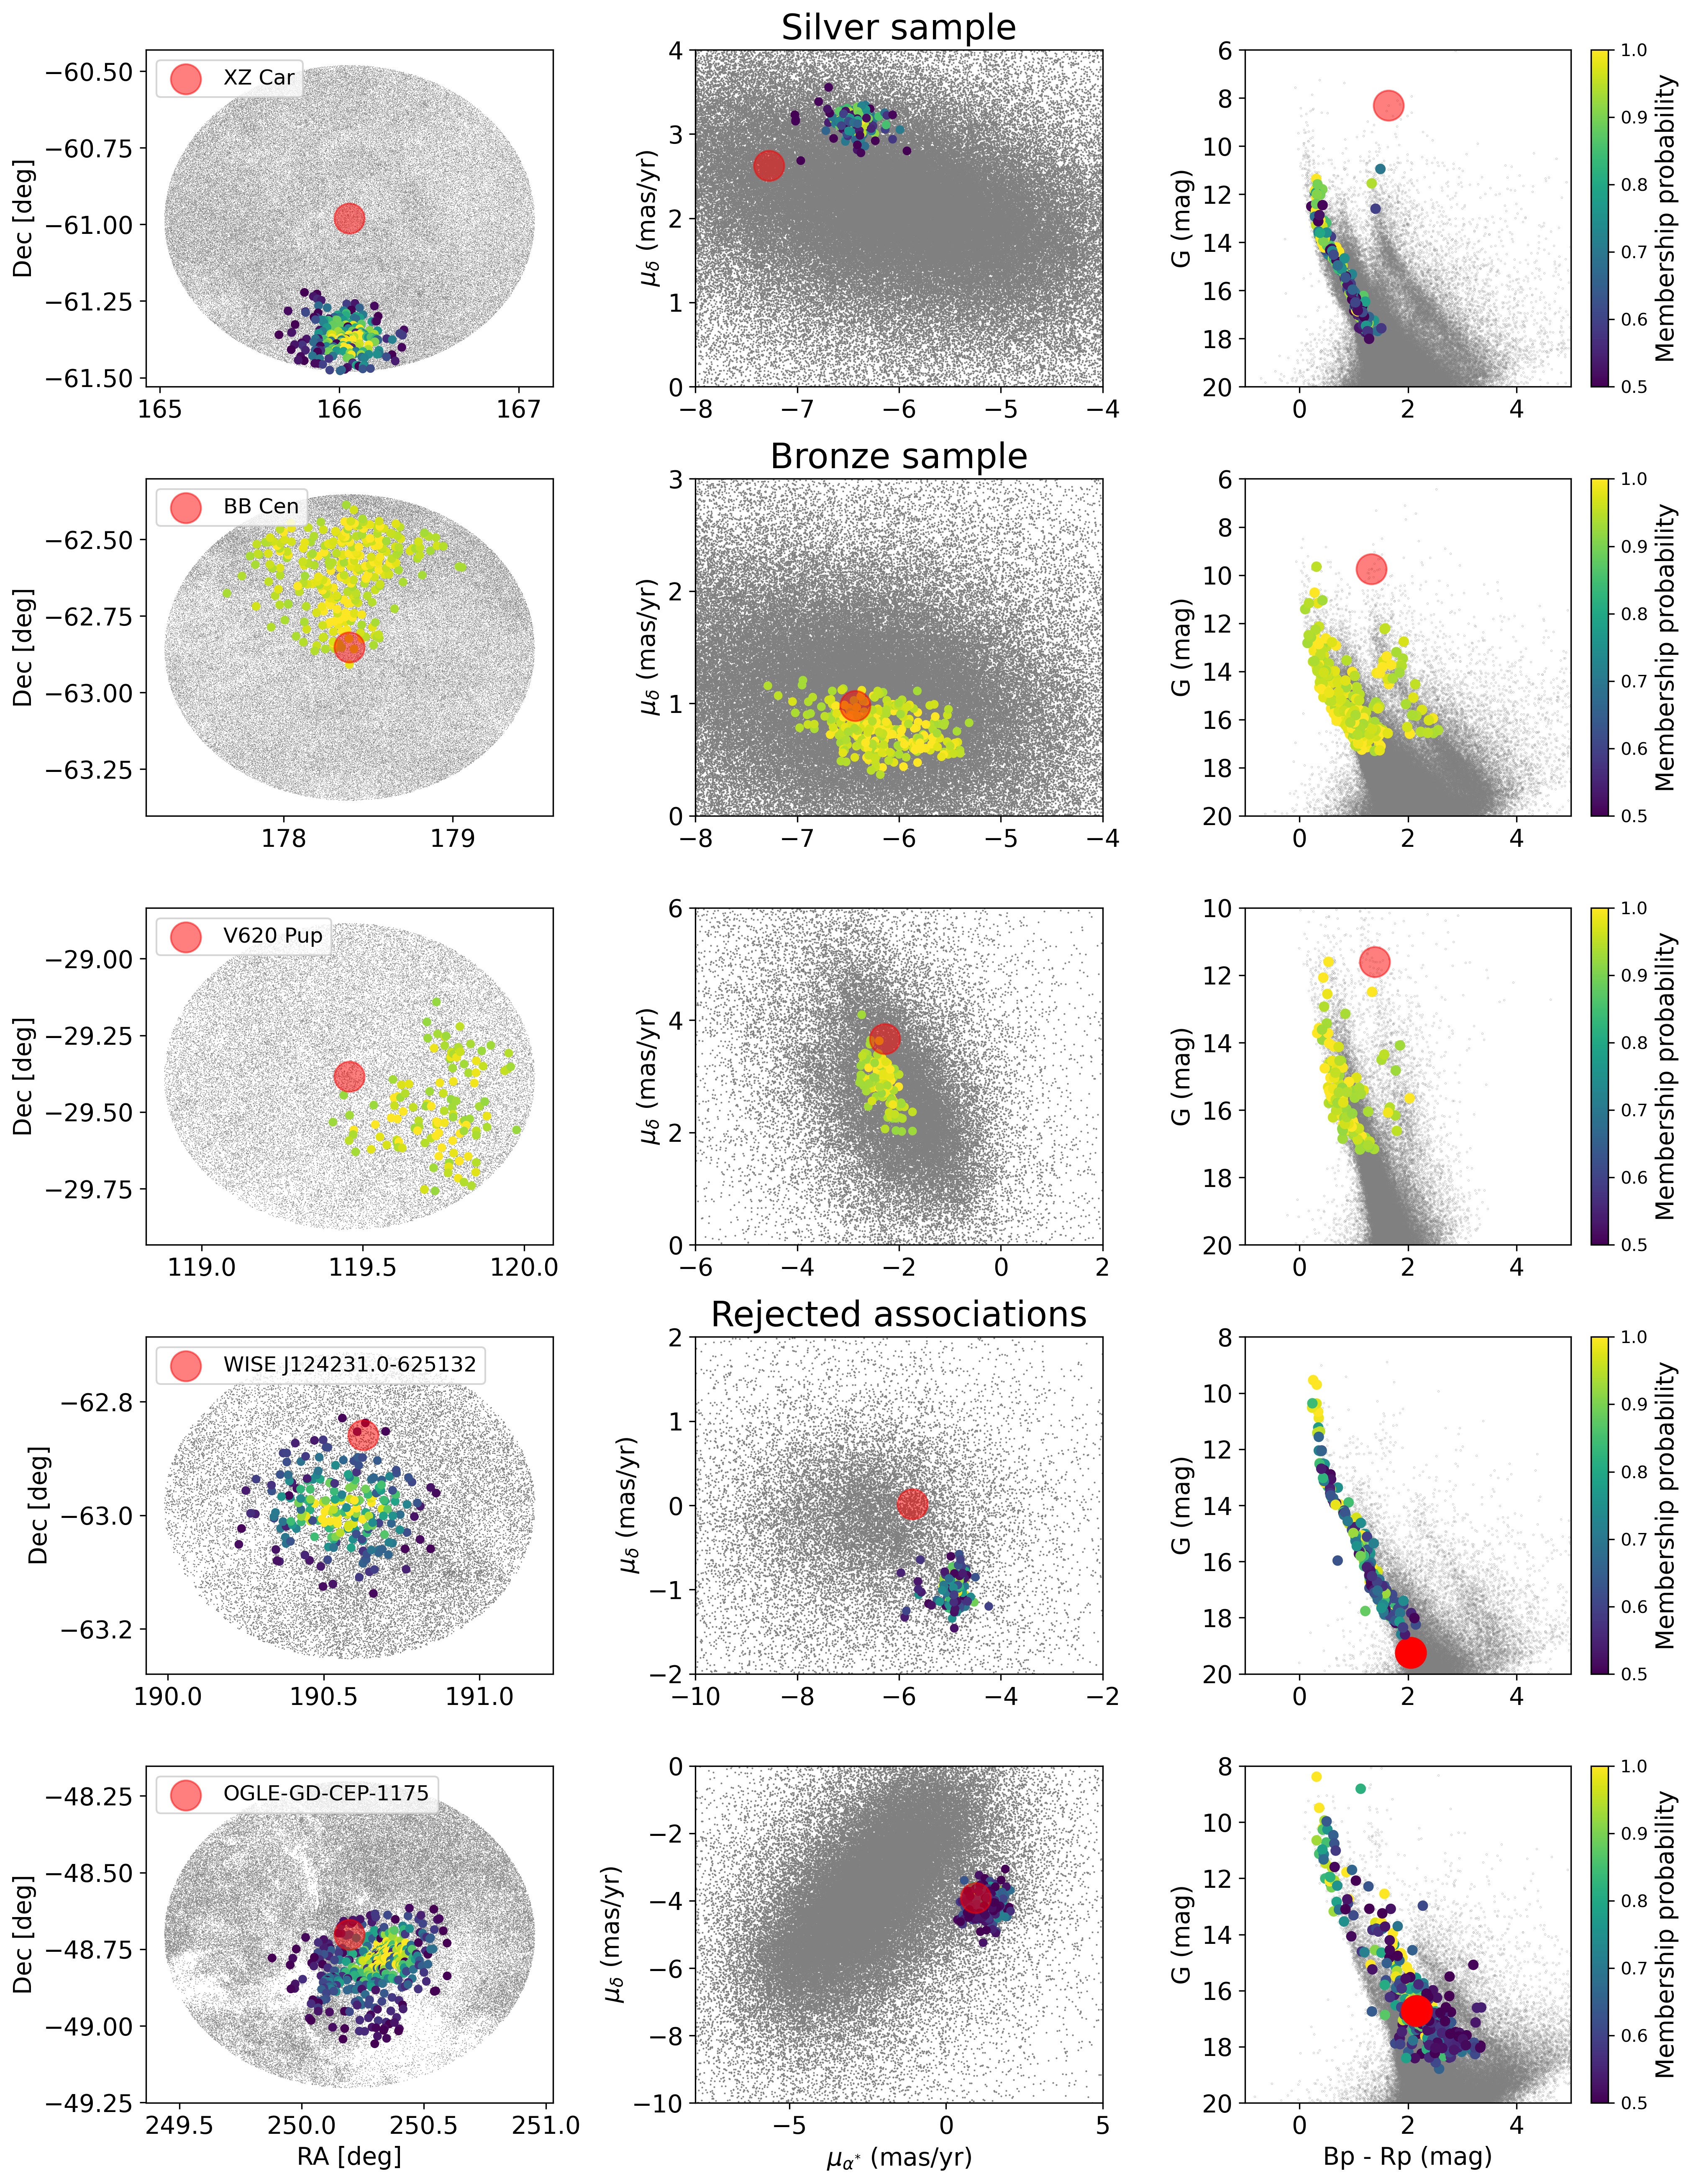
Tables 2-5 list the Cepheids and their host clusters for the Gold, Silver, and Bronze samples, along with their main astrometric information. Representative examples of each set are shown in Figs. 3 and 4. We applied an additional uncertainty of as when we computed the significance of the disagreement in parallax (cf. Sec. 2.3). Table 17 provides a list of the Gaia EDR3 source ids for all the cluster members and their L21 corrected parallaxes.
3.1 Gold sample
| Cluster parameters | Cepheid parameters | ||||||||||||
|---|---|---|---|---|---|---|---|---|---|---|---|---|---|
| Cluster | N | (as) | (mas/yr) | (mas/yr) | Cepheid | (as) | (mas/yr) | (mas/yr) | Sep (pc) | M.P | |||
| Czernik 41 | 112 | ATO J297 | 0.82 | 0.05 | |||||||||
| NGC 7790 | 149 | 322 7 | -3.229 0.115 | -1.729 0.085 | CE Cas A | 332 15 | -3.298 0.015 | -1.873 0.017 | 2.3 | 0.80 | |||
| NGC 7790 | 149 | 322 7 | -3.229 0.115 | -1.729 0.085 | CE Cas B | 333 15 | -3.301 0.014 | -1.809 0.016 | 2.3 | 0.90 | |||
| NGC 7790 | 149 | 322 7 | -3.229 0.115 | -1.729 0.085 | CF Cas | 316 12 | -3.240 0.012 | -1.766 0.012 | 1.5 | 0.95 | |||
| Berkeley 58 | 183 | 336 7 | -3.430 0.237 | -1.791 0.130 | CG Cas | 296 14 | -3.241 0.013 | -1.673 0.015 | 4.8 | 0.43 | |||
| UBC 106 | 495 | 443 7 | -1.048 0.108 | -1.365 0.134 | CM Sct | 444 16 | -1.064 0.015 | -1.414 0.014 | 6.7 | 0.96 | |||
| Ruprecht 79 | 152 | 281 7 | -4.615 0.183 | 3.086 0.200 | CS Vel | 272 12 | -4.567 0.014 | 3.131 0.014 | 2.7 | 0.81 | |||
| vdBergh 1 | 60 | 585 10 | 0.411 0.204 | -0.704 0.185 | CV Mon | 601 15 | 0.349 0.016 | -0.666 0.014 | 0.5 | 0.92 | |||
| NGC 129 | 297 | 556 7 | -2.594 0.120 | -1.169 0.104 | DL Cas | 580 27 | -2.706 0.025 | -1.189 0.027 | 1.9 | 0.82 | |||
| NGC 6664 | 361 | 504 7 | -0.065 0.176 | -2.514 0.351 | EV Sct(∗) | 526 18 | -0.209 0.018 | -2.546 0.015 | 1.9 | 0.79 | |||
| UBC 533 | GH Lup | 12.7 | 0.25 | ||||||||||
| Cl IQ Nor | 48 | 544 9 | -0.999 0.433 | -1.790 0.173 | IQ Nor | 535 18 | -0.897 0.015 | -1.821 0.020 | 7.4 | 0.99 | |||
| NGC 103 | 243 | 317 7 | -2.695 0.383 | -1.031 0.149 | NO Cas(∗) | 298 13 | -2.828 0.012 | -1.208 0.012 | 11.3 | 0.87 | |||
| NGC 6067 | 1085 | 513 7 | -1.948 0.149 | -2.595 0.186 | QZ Nor(∗) | 484 20 | -1.896 0.023 | -3.848 0.019 | 11 | 0.01 | |||
| FSR 0951 | 176 | 610 7 | 0.214 0.102 | 0.032 0.142 | RS Ori | 589 30 | 0.196 0.036 | 0.005 0.028 | 1.5 | 0.97 | |||
| NGC 6087 | 196 | -1.603 0.272 | -2.424 0.247 | S Nor | 1099 22 | -1.608 0.025 | -2.136 0.020 | 0.3 | 0.72 | ||||
| Cl ST Tau | 79 | 953 8 | 0.691 0.248 | -3.636 0.288 | ST Tau | 916 34 | 0.188 0.035 | -2.318 0.022 | 10.0 | 0.08 | |||
| UBC 130 | 42 | 425 9 | -2.103 0.071 | -5.872 0.102 | SV Vul | 402 21 | -2.158 0.016 | -5.962 0.021 | 6.5 | 0.90 | |||
| Cl SX Vel | 77 | 497 7 | -5.057 0.160 | 4.976 0.120 | SX Vel | 501 19 | -4.345 0.019 | 4.921 0.022 | 9.6 | 0.17 | |||
| Lyngå 6 | 173 | 421 8 | -1.915 0.187 | -2.762 0.183 | TW Nor | 360 20 | -1.891 0.021 | -2.806 0.017 | 0.6 | 0.25 | |||
| IC 4725 | 492 | 1554 6 | -1.685 0.239 | -6.159 0.319 | U Sgr | 1605 22 | -1.795 0.025 | -6.127 0.017 | 0.1 | 0.42 | |||
| NGC 5662 | 241 | 1337 6 | -6.461 0.157 | -7.189 0.180 | V Cen | 1409 22 | -6.697 0.016 | -7.068 0.018 | 17.2 | 0.05 | |||
| FSR 0384 | 63 | 520 8 | -3.446 0.198 | -1.752 0.096 | V Lac | 496 16 | -3.237 0.016 | -1.439 0.017 | 16.9 | 0.27 | |||
| NGC 6067 | 1085 | 513 7 | -1.948 0.149 | -2.595 0.186 | V0340 Nor | 491 25 | -2.066 0.027 | -2.634 0.021 | 0.5 | 0.94 | |||
| NGC 6649 | 425 | 514 7 | 0.025 0.132 | -0.121 0.156 | V0367 Sct | 473 20 | 0.082 0.021 | -0.273 0.019 | 1.7 | 0.60 | |||
| Cl V0378 Cen | 107 | 518 8 | -4.325 0.319 | -1.744 0.194 | V0378 Cen(∗) | 524 19 | -5.656 0.014 | -2.282 0.019 | 7.7 | 0.11 | |||
| NGC 129 | 311 | 557 7 | -2.591 0.123 | -1.169 0.113 | V0379 Cas(∗) | 524 14 | -2.696 0.012 | -1.313 0.015 | 25.0 | 0.42 | |||
| UBC 375 | 160 | 562 7 | -3.073 0.461 | -5.219 0.284 | V0438 Cyg | 530 16 | -3.324 0.017 | -4.559 0.019 | 2.9 | 0.48 | |||
| CWNU 175 | 37 | 732 9 | -3.987 0.277 | -1.187 0.165 | VW Cru | 738 16 | -3.903 0.015 | -1.134 0.015 | 1.1 | 0.96 | |||
| UBC 231 | 68 | WX Pup | 387 15 | -2.163 0.010 | 2.559 0.014 | 22.2 | 0.01 | ||||||
| UBC 290 | 253 | 639 6 | -5.918 0.279 | -0.273 0.198 | X Cru | 654 19 | -5.926 0.015 | -0.173 0.017 | 7.6 | 0.98 | |||
| FSR 0384 | 63 | 520 8 | -3.446 0.198 | -1.752 0.096 | X Lac(∗) | 520 18 | -3.296 0.017 | -1.442 0.017 | 17.2 | 0.43 | |||
| UBC 129 | 131 | 880 7 | -1.031 0.138 | -4.363 0.189 | X Vul | 864 22 | -1.352 0.016 | -4.247 0.020 | 4.9 | 0.77 | |||
| NGC 6664 | 361 | 504 7 | -0.065 0.176 | -2.514 0.351 | Y Sct | 558 20 | -0.737 0.025 | -2.878 0.019 | 16.23 | 0.08 | |||
The Gold sample consists of 34 Cepheids residing in 28 distinct Galactic open clusters. Out of the 34 Cepheids, 27 Cepheids pulsate in the fundamental mode, and 7 Cepheids pulsate in the first overtone. We identify ST Tau, V0378 Cen, and GH Lup as bona fide cluster Cepheids for the first time.
We cross-matched all 28 Gold sample host clusters with cluster catalogs from the literature (Anderson et al., 2013; Usenko et al., 2019; Cantat-Gaudin et al., 2018, 2020; He et al., 2022; Hunt & Reffert, 2021; Medina et al., 2021). We found cluster parameters in agreement to within of the previously reported parameters in the literature for 24 of them. However, we found disagreements greater than among at least one of the astrometric parameters for the host clusters of SX Vel, IQ Nor, and VW Cru.
Last but not least, we identified four entirely new clusters that host one Cepheid each. We denoted them by the prefix Cl followed by the Cepheid name. Additional information for a subset of Gold sample cluster Cepheids is provided below.
SX Vel
is found to be a member of a newly detected host cluster (Cl SX Vel, pc) at a projected separation of pc. The presence of multiple clusters in close proximity somewhat complicates this membership analysis. Anderson et al. (2013) investigated multiple possible host clusters, including Bochum 7, NGC 2660, FSR 1441, SAI 94, and Ruprecht 70, and we here add NGC 2659. Membership in Bochum 7 ( pc; cf. Kharchenko et al., 2005) and SAI 94 ( pc; cf. Elsanhoury & Amin, 2019) is readily excluded based on distance, while proper motion differences exclude membership in NGC 2660, and FSR 1441 (Cantat-Gaudin et al., 2018). However, NGC 2659 and Ruprecht 70 require some discussion because the computed likelihoods for cluster membership are consistent with the hypothesis of membership for both and because the likelihood obtained for NGC 2659 is even higher () than for Cl SX Vel (). However, closer inspection revealed that the higher likelihood for NGC 2659 is driven by weaker proper motion constraints (twice larger dispersion). The parallaxes of both clusters agree to within (as vs as). Additionally, the observed separation of pc is inconsistent with our maximum allowed separation of pc. Similarly, for Ruprecht 70, the separation of pc rejects this association, although the likelihood alone () would not reject membership according to our criteria.
IQ Nor
is associated with a cluster at a distance of pc. Previously, Anderson et al. (2013) investigated the membership of IQ Nor in the following clusters: NGC 5582, NGC 5925, or Loden 2115. Membership in NGC 5822 is excluded based on parallax ( difference Cantat-Gaudin et al., 2018), whereas proper motions exclude membership in NGC 5925 (Cantat-Gaudin et al., 2018) and Loden 2115 (Kharchenko et al., 2013).
VW Cru
resides in a cluster reported independently as CWNU 175 while this article was in preparation (He et al., 2022). Although Anderson et al. (2013) previously investigated possible membership in Loden 624 (Kharchenko et al., 2013), we note that CWNU 175 is a different physical object separated by deg from Loden 624.
WX Pup
is a coronal member of the cluster UBC 231 (see also Zhou & Chen, 2021) and a good example of how the Gaia systematics can limit the ability to detect host clusters because the cluster and Cepheid parallaxes differed by prior to applying L21 parallax corrections. After applying L21 corrections, this differences reduces to . While the membership likelihood of WX Pupis a relatively low and the projected separation of 22.2 pc is close to our cutoff, its membership in UBC 231 is not rejected according to the criteria we specified. We searched for other cases where the chronological order of the L21 corrections would affect the conclusion concerning membership, but found none.
ATO J297.7863+25.3136
SV Vul
is especially valuable for LL calibration due to its long period because the majority of Cepheids in distant supernova-host galaxies have periods (e.g., Riess et al., 2018). We find a very high likelihood of for this cluster Cepheid combination at a distance of pc, and we note the small pc separation from cluster center. Thus, our analysis confirms previous statements of the SV Vul cluster membership reported by Negueruela et al. (2020) and Medina et al. (2021). Moreover, inspection of several membership constraints as well as the residuals from our LL calibration does not corroborate the possibility that the parallaxes of SV Vul are unreliable, reported by Owens et al. (2022) (cf. Fig. 6 and Sect. 4.3). We therefore find no reason to discard this valuable star from LL calibration.
3.2 Silver sample
The Silver sample contains three Cepheids with likelihoods that are formally inconsistent with membership in well-defined clusters according to our criteria. However, disagreements among the individual membership constraints are sufficiently small to warrant additional discussion and inspection.
AP Vel
was previously reported as a member of the cluster Ruprecht 65 (Chen et al., 2015) located at a distance of pc. The low membership probability is dominated by the parallax difference. We do note, however, that the proper motion parameters of AP Vel (, ) are within and of the cluster averages, and that the Cepheid is located rather close to (0.21 deg) from cluster center.
X Pup
is located at a rather large separation of pc from the center of its possible newly identified host cluster. The low likelihood is driven by proper motion differences between Cepheid and cluster, which are significant at the level of and for and , respectively. However, we note that the total velocity dispersion of Cl X Pup is merely , which may indicate that an underestimated proper motion dispersion was used to calculate the membership. Additionally, the comparatively large separation from the cluster (cf. Sec. 2.2.3) as well as orbital motion tentatively reported by Anderson et al. (2016a) may contribute to deviations in proper motion. We note the good agreement in parallax () and radial velocity, where the Cepheid barycentric velocity is km/s (Anderson et al. in prep), which is fully consistent with the median cluster radial velocity based on four stars reported in Gaia DR3 ( km/s) (cf. Table 1). We therefore consider the cluster membership of X Pup to be potentially underestimated due to an underestimated cluster proper motion dispersion. Further study is required to ascertain its membership before X Pup is included in the Gold sample.
XZ Car
is situated at a projected separation of 15 pc from its potential newly identified host cluster Ruprecht 93. Although the parallax of XZ Car fully agrees with that of the cluster, we find a low membership probability due to differences in the kinematic membership constraints, notably radial velocities, which differ by between the pulsation-averaged Cepheid RV and the median RV of the 13 cluster members with DR3 radial velocities (cf. Table 1). Although XZ Car is a long-term spectroscopic binary and exhibits a trend of its pulsation-averaged velocity that exceeds over a baseline of yr (Anderson et al., 2016a, Shetye et al. in prep.), we caution that orbital motion is unlikely to explain the large RV difference. Additionally, and differ by and . We note that evidence of orbital motion has also been found using Gaia proper motion anomalies (Kervella et al., 2019), however, indicating that proper motion may also provide incorrect membership indications for XZ Car. It would be intriguing (but beyond scope for this article) to investigate the nature of the orbit and the companion required to explain these differences. However, XZ Car does not appear to be gravitationally bound to Ruprecht 93. Further membership analysis using the full Gaia temporal baseline might clarify this high-interest association.
| Cluster parameters | Cepheid parameters | ||||||||||||
|---|---|---|---|---|---|---|---|---|---|---|---|---|---|
| Cluster | N | (as) | (mas/yr) | (mas/yr) | Cepheid | (as) | (mas/yr) | (mas/yr) | Sep (pc) | M.P | |||
| Ruprecht 65 | 133 | AP Vel(∗) | 545 12 | -6.030 0.013 | 5.647 0.013 | 8.5 | 0 | ||||||
| Ruprecht 93 | 206 | 482 7 | -6.437 0.143 | 3.130 0.097 | XZ Car | 473 18 | -7.277 0.019 | 2.622 0.017 | 15.3 | 0 | |||
| Cl X Pup | 125 | 363 6 | -2.166 0.149 | 3.125 0.205 | X Pup | 397 20 | -1.236 0.016 | 1.786 0.018 | 24.4 | 0 | |||
| Cluster parameters | Cepheid parameters | ||||||||||||
|---|---|---|---|---|---|---|---|---|---|---|---|---|---|
| Cluster | N | (as) | (mas/yr) | (mas/yr) | Cepheid | (as) | (mas/yr) | (mas/yr) | Sep (pc) | M.P | |||
| Asterism BB Cen | 284 | 316 6 | -6.196 0.378 | 0.781 0.173 | BB Cen | 330 11 | -6.43 0.011 | 0.978 0.013 | 15.0 | 0.83 | |||
| Asterism V620 Pup | 118 | 293 7 | -2.346 0.232 | 2.895 0.350 | V620 Pup | 268 14 | -2.282 0.012 | 3.668 0.013 | 17.3 | 0.45 | |||
| Cepheid | Cluster | Reason of rejection | Reference |
|---|---|---|---|
| BB Sgr | Collinder 394 | difference in parallax | Gieren et al. (1997); Usenko et al. (2019) |
| OGLE-GD-CEP-1175 | NGC 6193 | Position in the color magnitude diagram | Medina et al. (2021) |
| WISE J124231.0-625132 | NGC 4609 | Position in the color magnitude diagram | Medina et al. (2021) |
| SX Car | ASCC 61 | No host cluster detected at this location | Anderson et al. (2013); Chen et al. (2015) |
| S Mus | ASCC 69 | No host cluster detected at this location | Anderson et al. (2013); Chen et al. (2015) |
3.3 Bronze sample
Clusters reported as part of the Gold and Silver samples can be clearly distinguished from field stars in position and proper motion. However, these distinctions were less clear in the case of possible host clusters (tentatively labeled asterisms) reported here as part of the Bronze sample. Additionally, the Gaia CMDs exhibit two main sequences, suggesting likely fore- or background contamination, perhaps by spiral arms being crossed (cf. Figure 4). Unfortunately, the cluster membership probabilities provided by HDBSCAN do not allow us to filter out contaminants. However, there appear to be a clear overdensities in parallax space for stars in the vicinity of both BB Cen and V0620 Pup, and we note that the computed likelihoods for the Cepheid are high and fully consistent with cluster membership, assuming the cluster is real.
3.4 Rejected associations
Our analysis refuted the cluster membership of several Cepheids previously considered as cluster members in the literature, and these cases are listed in Table 5. Specifically, OGLE-GD-CEP-1175 and WISE J124231.0-625132 were previously reported as members of NGC 6193 and NGC 4609 (Medina et al., 2021), respectively. They are both too faint to be among the most luminous evolved stars in the recovered host clusters, however (cf. Fig. 4). BB Sgr was previously considered to be a member of Collinder 394 (Gieren et al., 1997; Usenko et al., 2019). However, Medina et al. (2021) found that neither parallax nor proper motion match for this combination. Notably, the parallax differs by , which reliably excludes membership.
Data from the All-Sky Compiled Catalogue (Kharchenko, 2001) led Anderson et al. (2013) and Chen et al. (2015) to consider the Cepheids SX Car and S Mus potential cluster members of the clusters ASCC 61 and 69, respectively. Evans et al. (2014) reported the detection of a population of X-ray sources near the position of S Mus and interpreted this population as evidence for young stars in the cluster ASCC 69. At the reported cluster distances of and pc, Gaia data should allow the detection of even relatively small clusters near the positions of the two Cepheids. However, because no clusters are detected, we conclude that S Mus and SX Car are not bona fide cluster Cepheids.
4 LL and Gaia zeropoint offset calibration
In this section, we calibrate period luminosity relations for MW Cepheids that pulsate in the fundamental mode while simultaneously investigating residual parallax offsets that are applicable after applying the L21 corrections. Section 4.1 describes the observational data for MW Cepheids, Sect. 4.2 contains a cross-check of the expected zero residual offset applicable to cluster parallaxes using the LMC, and Sect. 4.3 describes the calibration of the MW LL using combined cluster and field Cepheids.
4.1 Milky Way Cepheids
| Astrometric constraints | Photometric constraints |
|---|---|
| RUWE | |
| num_clean_epochs_g | |
| astrometric_chi2_al | num_clean_epochs_bp |
| astrometric_excess_noise | num_clean_epochs_rp |
| astrometric_excess_noise_sig | ipd_frac_multi_peak |
| int_average_g |
| Cepheid | Gaia DR3 source id | ||||||||||
|---|---|---|---|---|---|---|---|---|---|---|---|
| (d) | (mas) | (mas) | |||||||||
| AA Gem | 3430067092837622272 | 11.297 | 0.274 | 0.311 | |||||||
| AA Mon | 3102535635624415872 | 3.937 | 0.313 | 0.316 | |||||||
| AB Cam | 473239154746762112 | 5.788 | 0.212 | 0.241 | |||||||
| … | … | … | … | … | … | … | … | … | … | … | … |
We compiled samples of fundamental-mode MW Cepheids based on the astrometric and photometric quality criteria tabulated in Table 6. The astrometric constraints were compiled such as to reproduce the sample of 68 low-reddening MW Cepheids observed by the SH0ES team using HST (Riess et al., 2018, 2021). However, a larger sample of Cepheids is considered in other photometric bands and using Gaia photometry. Hence, we added cuts based on astrometric goodness-of-fit parameters to remove Cepheids whose astrometry was very likely flawed, such as RX Cam, the only Cepheid for which an orbital parallax solution is available in Gaia DR3. The photometric criteria we adopted include a magnitude cut to avoid saturated stars, a color cut to limit exposure to reddening, a cut on the number of available photometric epochs based on which the mean magnitudes were computed, and the parameter ipd_frac_multi_peak which was adopted to limit exposure to blended sources. We further adopted a cut on period for the Gaia sample d to avoid exposure to misclassified overtone Cepheids. The most stringent cut in practice is that we require individual iron abundance measurements based on high-resolution spectroscopy for all sample stars (Genovali et al., 2014, 2015). The final sample of fundamental-mode classical Cepheids for contains stars and is listed in Table 7.
We compiled ground-based photometry in the Johnson and Cousins bands from Groenewegen (2018) and Breuval et al. (2020, 2021). This dataset has been homogenized by Groenewegen (2018) and was studied extensively. It mainly includes and band data reported by Mel’nik et al. (2015), which are based on observations by L. Berdnikov (e.g., Berdnikov, 2008). Reddening values, for Galactic Cepheids are taken from Fernie et al. (1995) and scaled by a factor of following Groenewegen (2018). We also computed reddening-free Wesenheit magnitudes (Madore, 1982) using and band data, (cf. below).
We collected Gaia DR3 photometry in Gaia band, as well as integrated and spectrophotometry (Ripepi et al., 2022b; Riello et al., 2021). Specifically, we used intensity-averaged magnitudes from Gaia CU7 Specific objects studies (parameters int_average_g, int_average_g_error and analogous for and from table gaiadr3.vari_cepheid) published as part of the Gaia DR3 variability analysis for Cepheids (Ripepi et al., 2022b; Eyer et al., 2022). We also computed reddening-free Wesenheit magnitudes, , based on , , and as stated below.
Finally, we collected HST WFC3-IR F160W photometry for MW Cepheids from Riess et al. (2019) and Ripepi et al. (2022c), as well as their reported reddening-free NIR Wesenheit magnitudes . Benefits of this homogeneous HST dataset include the excellent calibration of the HST photometric system, homogeneity with respect to extragalactic Cepheids, high spatial resolution, and the lack of time- and location-specific calibration issues typical of ground-based NIR photometry. We also experimented with ground-based near-IR photometry available from a range of literature references following Breuval et al. (2021), notably combining ground-based photometry from Laney & Stobie (1992), Monson & Pierce (2011), and Genovali et al. (2014). However, the homogenization of these data sets is not as straightforward due to different photometric systems in use (e.g., improvements in detector technology), the calibration of atmospheric absorption in the NIR, and the standardization of NIR passbands. After some tests, and notably in comparison with the HST F160W photometry available from Riess et al. (2019), we discarded ground-based NIR photometry as not sufficiently accurate for the purposes of our study.
HST WFC3-IR observations are subject to count-rate nonlinearity (CRNL) at the level of mag/dex (Riess et al., 2019). We took these CRNL corrections into acount when we compared Cepheid samples spanning a significant dynamic range, that is, when we compared MW Cepheids to extragalactic Cepheids, such as those in the LMC, or when we compared them to Cepheids in supernova-host galaxies (SN-hosts). CRNL corrections to offset differences among MW Cepheids alone are at the level of mmag and were therefore neglected.
We used the following definitions for Wesenheit magnitudes (Breuval et al., 2022), (Riess et al., 2016), and (Ripepi et al., 2019):
| (4) |
| (5) |
| (6) |
Extinction corrections were applied using reddening coefficients calculated for a Fitzpatrick (1999) reddening law with and a spectral energy distribution representative of a d Cepheid near the center of the instability strip (cf. Anderson, 2022) as given by a Castelli & Kurucz (2003) model atmosphere with , [Fe/H], . Specifically, this yields , , and , , , where the subscript F160W refers to the HST WFC3-IR system. All filter profiles were downloaded from the Spanish VO filter profile service888http://svo2.cab.inta-csic.es/theory/fps/. These values were used in conjunction with color excess values defined for Johnson-Cousins to estimate extinction in the respective bands. We also compiled individual iron abundances from the literature ensuring a common solar iron abundance (cf. Sec. 4.2).
4.2 Confirming the adequacy of L21 parallax corrections for cluster parallaxes using the LMC
Lindegren et al. (2021) provided a recipe for correcting systematic parallax errors related to source magnitude, color, and sky-position (ecliptic latitude) based on millions of quasars and LMC stars as well as 7000 bright physical stellar pairs. However, previous articles have presented evidence that residual parallax offsets need to be applied even after the L21 corrections are applied. For example, Riess et al. (2021) determined an additional constant parallax offset of as based on 75 Galactic Cepheids in the magnitude range , and these residual offsets are now well documented using different methods and stellar types (e.g., Zinn et al., 2019; Zinn, 2021; Khan et al., 2019; Schönrich et al., 2019; Stassun & Torres, 2021; Ren et al., 2021; Wang et al., 2022; Flynn et al., 2022). Hence, an accurate LL calibration based on Cepheid parallaxes requires solving for the residual offset applicable to the sample of stars used in the calibration.
However, recent work based on open and globular clusters as well as the Magellanic Clouds has shown that the L21 recipe accurately corrects parallax systematics of stars fainter than mag (Flynn et al., 2022; Maíz Apellániz, 2022). As a result, average cluster parallaxes based on L21-corrected member stars in this magnitude range are particularly useful for LL calibration because no further offsets need to be determined, that is, . Average cluster parallaxes can therefore inform the residual parallax offset applicable to Cepheid parallaxes, . This is done in Sect. 4.3. However, prior to adopting , we decided to verify the validity of this approach using observations of Cepheids in the LMC, whose distance is known with an accuracy of from detached eclipsing binary stars (Pietrzyński et al., 2019).
We compiled Johnson-Cousins and band photometry of LMC Cepheids from the OGLE-III catalog of variable stars (Soszyński et al., 2017) and selected fundamental-mode OGLE-III Cepheids within the matching period range of cluster Cepheids ( d) and cross-matched their positions (maximum search radius ) with Gaia DR3 positions to obtain Gaia band, , and photometry from the SOS Cepheid list (Ripepi et al., 2022b, gaiadr3.vari_cepheid). The accuracy of the cross-match was verified by considering the agreement between periods reported by OGLE and Gaia. We adopted the OGLE-III Cepheid sample instead of the Gaia DR3 list of Cepheids in the LMC direction because a) geometric corrections (cf. below) are well described for this sky region (Pietrzyński et al., 2019), and b) the classification of Cepheids in OGLE-III benefits from longer time series and long-standing human experience in classification. Since OGLE-III covers the main part of the LMC disk, and thus the bulk of the Cepheid population, including outer regions from Gaia is not expected to add a significantly greater number of Cepheids outweighing the downsides related to the geometric correction. We used reddening maps based on red clump stars (Skowron et al., 2021) to correct for extinction using the values of mentioned in Sect. 4.1 and the conversion derived analogously.
For our NIR analysis, we used HST WFC3 observations of 70 LMC Cepheids (Riess et al., 2019) because they can be directly compared to the HST observations of MW cluster Cepheids (Riess et al., 2022a) after the appropriate CRNL corrections are applied. Because the NIR Wesenheit magnitudes, , reported by Riess et al. (2019) already include a CRNL correction applicable for the comparison with Cepheids in the SN-host sample, we recomputed using Eq. 5 and their original HST observations in the individual passbands , and . We then applied appropriate CRNL corrections (average of mag) to account for the flux difference of dex between MW cluster and LMC Cepheids.
We applied geometric corrections to apparent magnitudes following Jacyszyn-Dobrzeniecka et al. (2016), effectively treating all LMC Cepheids as though they were observed at the same distance, determined to an accuracy of using detached eclipsing binary systems (Pietrzyński et al., 2019). As a result of this correction, the effect of the LMC intrinsic depth on the observed scatter in the LL is minimized. This is necessary due to the large sky region covered by OGLE-III ( kpc) and to ensure that the distance estimate to the LMC reflects the distance to the barycenter of the detached eclipsing binaries. Moreover, the correction decreases the observed scatter in the LL, resulting in a slight (mag) improvement in the uncertainties for the LL intercept .
For LMC Cepheids, we fit linear LLs of the form using a least-squares fitting procedure and a outlier rejection (applying Chauvenet’s criterion for the HST LMC Cepheid sample); denotes apparent magnitudes corrected to the LMC barycenter. Depending on the photometric data set, the samples used in the fit contained between and LMC Cepheids. The results for a range of individual photometric bands and Wesenheit magnitudes are listed in Table 8, including the number of available Cepheids, and the assumed intrinsic width of the LL.
| Band | LMC | WIS | ||
| (mag) | (mag/) | (mag) | ||
| 546 | 0.23 | |||
| 701 | 0.22 | |||
| 546 | 0.19 | |||
| 546 | 0.16 | |||
| 712 | 0.14 | |||
| 68 | 0.09 | |||
| 684 | 0.08 | |||
| 543 | 0.10 | |||
| 68 | 0.06 | |||
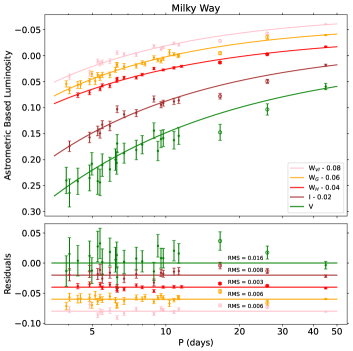
To determine the validity of the expected , we computed the absolute magnitude of LMC Cepheids by applying the distance modulus measured obtained using detached eclipsing binaries (Pietrzyński et al., 2019, mag),
| M | (7) | |||
| (8) |
These absolute magnitudes of LMC metallicity Cepheids were then compared to MW Cepheids using the astrometry-based luminosity (Arenou & Luri, 1999, ABL), which avoids the issue of inverting parallaxes to obtain distances,
| ABL | (9) |
Superscript in Eq. 8 implies that and are given in apparent magnitudes after applying geometric corrections to the LMC Cepheids. denotes the LL intercept at the average sample metallicity, is the LL intercept corrected to solar metallicity, and is the difference in iron abundance between the MW and LMC Cepheid samples. Table 9 lists the results of this comparison for six individual photometric bands and three Wesenheit formulations.
The metallicity difference between LMC and MW Cepheid requires careful consideration. For the LMC, we adopted a common mean iron abundance, , based on the recently remeasured average iron abundances of LMC Cepheids that has been shown to be consistent with a single value (Romaniello et al., 2022, dispersion dex). For MW cluster Cepheids, we adopted individual iron abundances as described above and compiled in Table 11. Although several improvements in the determination of have been recently presented (Gieren et al., 2018; Breuval et al., 2021, 2022; Ripepi et al., 2022a), we here preferred to use as a free parameter, while first fixing and then performing the same comparison while fitting for and simultaneously. The individual MW Cepheid abundances are compiled in Table 11.
| Band | free and | and free | ||||
| (mag/dex) | (as) | (mag/dex) | (as) | |||
| 23 | ||||||
| 22 | ||||||
| 23 | ||||||
| 23 | ||||||
| 15 | ||||||
| 15 | ||||||
| 15 | ||||||
| 26 | ||||||
| 15 | ||||||
Our results for listed in Table 9 show that metal-rich Cepheids are typically brighter than metal poor Cepheids in each of the photometric bands as well as the three Wesenheit formulations. This echoes recent results by Breuval et al. (2022), albeit at lower precision because the metallicity range we considered is limited. Additionally, as noted by Breuval et al., our results are consistent with predictions of derived from Geneva stellar evolution models (Anderson et al., 2016b). We further confirm the particularly strong metallicity dependence in Gaia band and the Gaia Wesenheit function reported by Breuval et al. (2022) and Ripepi et al. (2022a), while neither nor exhibit such a steep trend with metallicity.
Concerning , we find residual offsets consistent with to within in all nine cases, and a weighted mean value of as. Additionally, we note that the values of obtained when fixing are consistent to within their uncertainties with values obtained when both parameters are free, as well as with recent literature results. In summary, our comparison involving the LMC thus strongly supports that the average cluster parallaxes determined above exhibit no evidence of residual parallax offsets beyond the L21 corrections.
| Name | Period | [Fe/H] | Reference | E(B-V) | ||||||
|---|---|---|---|---|---|---|---|---|---|---|
| (d) | (as) | (as) | (as) | (as) | (mag) | (mag) | (mag) | |||
| CE Cas A | 5.141 | 3.1 | 6.7 | 7.4 | ||||||
| CE Cas B | 4.479 | 3.1 | 6.7 | 7.4 | ||||||
| CF Cas | 4.875 | 3.1 | 6.7 | 7.4 | LL11 | 0.556 0.021 | ||||
| CG Cas | 4.366 | 3.0 | 6.7 | 7.3 | LL11 | 0.667 0.009 | ||||
| CM Sct | 3.917 | 2.2 | 6.2 | 6.6 | LL11 | 0.775 0.045 | ||||
| CS Vel | 5.905 | 2.8 | 6.7 | 7.3 | G14 | |||||
| CV Mon | 5.379 | 6.9 | 6.6 | 9.6 | G14 | 0.705 0.018 | ||||
| DL Cas | 8.001 | 2.2 | 6.5 | 6.9 | L11 | |||||
| EV Sct(∗) | 3.090 | 2.8 | 6.4 | 7.0 | G15 | |||||
| GH Lup | 9.276 | 6.1 | 6.4 | 8.8 | G14 | |||||
| IQ Nor | 8.220 | 7.2 | 6.1 | 9.4 | G15 | |||||
| NO Cas(∗) | 2.582 | 2.7 | 6.4 | 7.0 | ||||||
| QZ Nor(∗) | 3.786 | 1.4 | 6.5 | 6.6 | G15 | |||||
| RS Ori | 7.567 | 3.5 | 6.3 | 7.2 | G15 | |||||
| S Nor | 9.754 | 3.8 | 6.1 | 7.2 | R08 | |||||
| ST Tau | 4.034 | 5.6 | 6.0 | 8.3 | L07 | |||||
| SV Vul | 44.993 | 5.9 | 6.6 | 8.9 | L11 | |||||
| SX Vel | 9.550 | 4.0 | 6.0 | 7.2 | L07 | |||||
| TW Nor | 10.786 | 3.7 | 6.6 | 7.6 | G15 | |||||
| U Sgr | 6.745 | 2.7 | 5.4 | 6.0 | L11 | |||||
| V Cen | 5.494 | 2.2 | 6.1 | 6.5 | R08 | 0.265 0.016 | ||||
| V Lac | 4.982 | 4.7 | 6.6 | 8.1 | LL11 | |||||
| V0340 Nor | 11.289 | 1.4 | 6.5 | 6.6 | G15 | |||||
| V0367 Sct | 6.295 | 2.7 | 6.7 | 7.2 | G15 | |||||
| V0378 Cen(∗) | 6.459 | 3.7 | 6.5 | 7.5 | LL11 | |||||
| V0379 Cas(∗) | 4.305 | 2.2 | 6.5 | 6.9 | L11 | |||||
| V0438 Cyg | 11.211 | 3.6 | 6.4 | 7.3 | LL11 | |||||
| VW Cru | 5.265 | 6.1 | 6.3 | 8.7 | LL11 | 0.640 0.046 | ||||
| WX Pup | 8.933 | 4.6 | 6.5 | 8.0 | G14 | |||||
| X Cru | 6.220 | 2.5 | 6.0 | 6.5 | LL11 | |||||
| X Lac(∗) | 5.443 | 4.7 | 6.6 | 8.1 | LL11 | |||||
| X Pup | 25.972 | 3.7 | 5.1 | 6.4 | G15 | |||||
| X Vul | 6.320 | 3.2 | 6.0 | 6.8 | L11 | |||||
| XZ Car | 16.652 | 2.5 | 6.6 | 7.1 | LL11 | |||||
| Y Sct | 10.341 | 2.8 | 6.4 | 7.0 | LL11 |
References: (LL11): Luck & Lambert (2011), (G14): Genovali et al. (2014), (L11): Luck et al. (2011), (G15): Genovali et al. (2015), (R08): Romaniello et al. (2008), (L07): Lemasle et al. (2007).
4.3 Galactic LL and residual parallax offset for Cepheids
We calibrated the Milky Way LL and the residual parallax offset applicable to MW Cepheid parallaxes, , using our Gold sample of cluster Cepheids. We note that the following exclusively considers MW Cepheid information and is thus independent of the LMC, which was merely used as a cross-check in Sect. 4.2.
We fit the MW LL while simultaneously determining the residual parallax offset for Cepheids, , using
| (10) |
with . Both LL slope and zeropoint were used as free parameters, and as explained above.
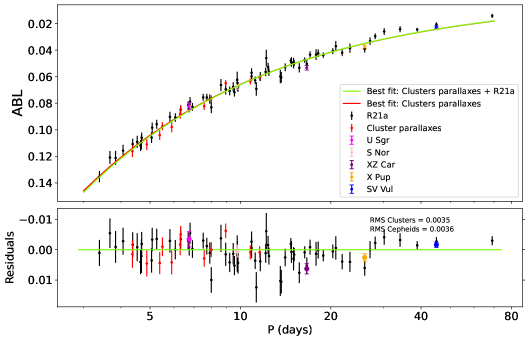
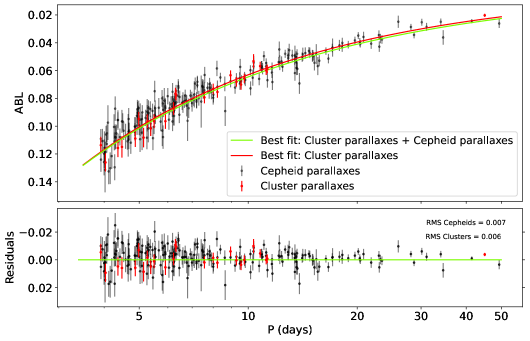
We first performed this fit at the sample average iron abundance and then repeated the fit assuming a fixed value of from the literature, specifically, (Riess et al., 2022b) and (Breuval et al., 2022). We used individual Cepheid iron abundances, not the sample average, to determine the zeropoint at solar metallicity, . Using fixed literature slopes for has the significant benefit of being informed by a wider range of metallicities, while both the range of [Fe/H] in the MW sample and the correction to the solar value are small. Although we propagated the errors, this metallicity correction has virtually no effect on the final results due to the only slightly supersolar metallicity of MW Cepheids. Following common practice (e.g., Kodric et al., 2018; Riess et al., 2022b), we applied a outlier rejection. This step removed of Cepheids for the Gaia-only sample, the vast majority of which are outliers. The ABL fit results are illustrated in Figures 7 and 8.
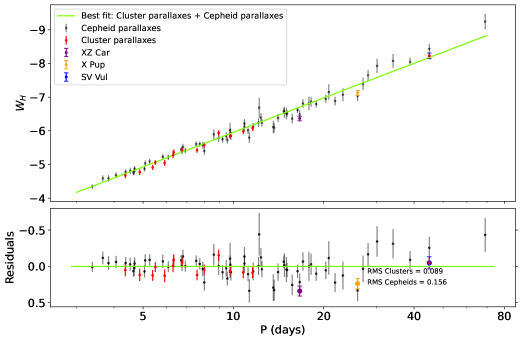
At the average sample metallicity, we find for the NIR Wesenheit LL ()
| (11) | |||
| (12) | |||
| (13) |
which at solar metallicity becomes
| (14) | |||
| (15) | |||
| (16) |
We note that CRNL corrections ( mag) were applied to the apparent WFC3/IR F160W and NIR Wesenheit magnitudes to facilitate the comparison with Cepheids in supernova-host galaxies and simplify the comparison with the SH0ES distance ladder.
Both results establish a nonzero residual parallax offset for MW Cepheid parallaxes at significance, and this result is fully consistent with the as offset determined by Riess et al. (2021). This provides additional evidence that clusters and Cepheids require different residual parallax offsets.
To directly compare our results to the value of determined as part of the SH0ES distance ladder (Riess et al., 2022b, a), we fixed the LL slope to the SH0ES baseline value and obtained
| (17) | |||
| (18) | |||
| (19) |
Our result for agrees to within with the value of determined by the SH0ES team via the two-parameter Gold sample fit in Table 5 of Riess et al. (2022a), where mag. Nevertheless, our approach to determine using the NIR Wesenheit function (Eq. 14) differs from their approach in three important elements. First, we used a combined fit of Cepheid and cluster parallaxes to obtain an absolute calibration based exclusively on Gaia astrometry. Second, our clustering analysis in Sect. 2.1 was conducted entirely independently of Riess et al. (2022a). Third, the samples of cluster member stars differ between our study and Riess et al. (2022a), resulting in an average difference of as among cluster parallaxes. We therefore consider our result an important cross-check based on mostly independent astrometric information.
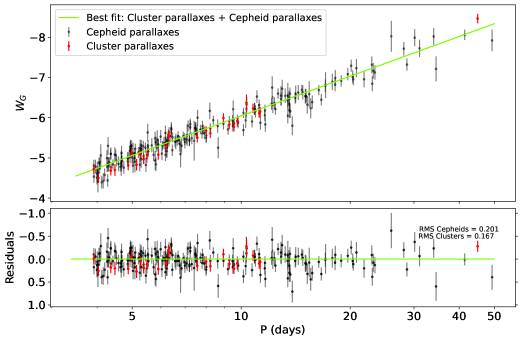
For the corresponding Gaia Wesenheit function () at sample average metallicity, we obtain
| (20) | |||
| (21) | |||
| (22) |
and, after correcting to solar metallicity using the individual Cepheid iron abundances,
| (23) | |||
| (24) | |||
| (25) |
We thus find agreement for regardless of whether HST or Gaia photometry is used, and using different, albeit not independent, sets of Cepheids and cluster parallaxes. In particular, we note the improved precision on determined using Gaia photometry, for which we obtain a detection that is consistent with the value determined using the independent HST photometry. We further note that metallicity corrections do not challenge the accuracy of our determination of . To illustrate our results in a more conventional LL form, we plot the absolute Wesenheit magnitudes as a function of in Figure 9.
| Filter | NCep | Ncl | ||||
| (mag/) | (mag) | (as) | ||||
| 0.086 | 67 | 15 | ||||
| 0.069 | 225 | 26 | ||||
| 0.069 | 243 | 23 | ||||
| 0.069 | 246 | 22 | ||||
| 0.068 | 238 | 23 | ||||
| 0.068 | 234 | 23 | ||||
| 0.088 | 67 | 15 | ||||
| 0.086 | 67 | 15 | ||||
| 0.088 | 67 | 15 |
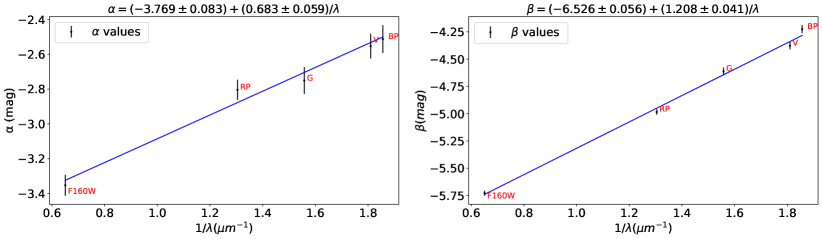
We further applied the same approach for Johnson band, Gaia , , and , and HST photometry. The results are listed in Table 12. In particular, we note that the value of is consistent within less than for all nine rows in Table 12. Figure 10 illustrates the results for individual photometric passbands together with linear fits of the LL parameters as a function of the inverse of the effective central wavelength of each filter. The average iron abundances of the samples differ by dex, and we thus expect a difference of 0.02 dex 0.2 mag/dex = 0.004 mag at most between the values of evaluated at the lower and upper metallicity of our sample. This difference is well contained within the uncertainties. Fitting the wavelength dependence of and as a function of inverse wavelength, we determine the following dependence of LL slope and zeropoint on central wavelength:
| (26) | ||||
| (27) |
5 Discussion
5.1 Using Silver sample Cepheids for LL calibration
Our criteria placed two long-period Cepheids with uncertain cluster membership, X Pup and XZ Car, in the Silver sample, which we conservatively did not use for LL calibration. As explained in Sec. 3.2, both stars featured low membership likelihoods due primarily to mismatching kinematic information. However, closer inspection suggested that X Pup is possibly a true cluster Cepheid that can be used for LL calibration (cf. Sec. 3.2). We determine the impact of including these stars in our analysis below.
Including X Pup and XZ Car in the cross-check of involving the LMC (Sect. 4.2) would not significantly affect the results. For we find as, mag/dex, and for , we obtain as, mag/dex. All these values agree to within much less than one standard deviation with those obtained using only the Gold sample of Cepheids.
Including XZ Car in the combined LL fit in Sec. 4.3 has no impact because it is a LL outlier that would be rejected by the clipping procedure. Including X Pup in the fit does not significantly affect the LL calibration (, , all agree to much better than with results in Eq. 20) and marginally increases the reduced by . Furthermore, X Pup has not been identified as an LL outlier by Riess et al. (2022a) in the NIR Wesenheit formulation.
5.2 Fraction of Cepheids in clusters within kpc
The fraction of Cepheids residing in clusters is of interest for understanding clustered star formation (Dinnbier et al., 2022) and the extragalactic distance scale (Anderson & Riess, 2018), among other things. Using our Gold sample of cluster Cepheids and data from the recent Gaia DR3, we updated previous estimates of this fraction, . Assuming that all Cepheid-hosting clusters within kpc could be identified by our method, we have (Gold sample), which includes coronal members separated by projected distances of pc from their host cluster centers.
We estimated the total number of Cepheids within kpc, using the photometric parallaxes obtained with our LL calibration for all stars classified as DCEP in Gaia DR3 table gaiadr3.vari_cepheid. This yields fundamental mode Cepheids as well as first-overtone or multimode Cepheids, where overtone periods were fundamentalized using the period ratios determined by Kovtyukh et al. (2016, assuming a mean metallicity ). For multimode Cepheids, either the fundamental or first-overtone period was used to compute the distance. We also sought to estimate using distances provided by the parameter distance_gspphot in Gaia DR3 table gaiadr3.gaia_source as well as Gaia parallaxes (including the residual offset determined in Eq. 24). However, this reduced the size of Cepheid samples by approximately due to limited data availability. We therefore considered the estimation based on photometric distances our baseline result due to greater completeness. The results are tabulated in Table 13, where asymmetric uncertainties reflect the range of stars defined by the distance or parallax uncertainties.
We thus estimate , where the uncertainties provided denote the full range of possibilities. We further find a slightly higher fraction of fundamental mode Cepheids in clusters, with and , assuming the OGLE classification of cluster Cepheids (Pietrukowicz et al., 2021). If the pulsation modes assigned in Gaia DR3 (Ripepi et al., 2022b) were used instead, the difference would be slightly larger, with and . This difference could be explained by the dependence of on age due to clusters dissolving into the field over time combined with the tendency of overtone Cepheids to originate from older lower-mass stars than fundamental-mode Cepheids, which can be rather young.
We note that a few bright Cepheids, such as Polaris and the cluster Cepheid U Sgr, are not included in the vari_cepheid table. However, their absence does not change the overall result. Our new estimate supersedes our previous slightly lower estimate of reported in Dinnbier et al. (2022) due to improvements in our membership determination and the input data from Gaia DR3.
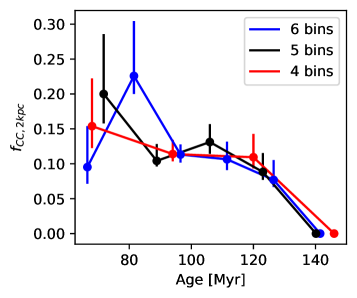
Figure 11 illustrates the fraction of Cepheids residing in clusters within 2 kpc of the Sun as a function of age. Cepheid ages were computed using period-age relations for fundamental and first-overtone Cepheids (Anderson et al. (2016b)). We confirmed that ages based on periods of overtone Cepheids matched ages computed using period-age relations for fundamental-mode Cepheids after fundamentalizing the pulsation periods of first-overtone Cepheids using period ratios of Milky Way double-mode Cepheids (Kovtyukh et al., 2016). Figure 11 thus illustrates the dispersal of Cepheid host clusters over time, an effect previously reported by Anderson & Riess (2018) and also seen in dynamical NBODY simulations (Dinnbier et al., 2022). We caution that young ages are rather poorly sampled within kpc of the Sun due to the low volumetric rate of long-period Cepheids. At ages above 132 Myr, no cluster Cepheids are found within kpc of the Sun.
| Sample | Method | Fundamental mode | Overtone | Multi mode | Total |
|---|---|---|---|---|---|
| Field | LL | ||||
| Field | distance_gspphot | ||||
| Field | Parallax | ||||
| Clusters | LL , OGLE classifiers | ||||
| Clusters | LL , Gaia classifiers |
5.3 Expected improvements
Astrometric uncertainties tend to increase with distance, complicating the identification of distant open clusters. For Gaia EDR3, the number of false cluster detections at distances greater than kpc increases rapidly, so that significant work is required to ascertain the veracity of the recovered cluster candidates. However, upcoming Gaia data releases will improve the ability to correctly identify clusters at large distances, which can be expected to result in much improved cluster Cepheid samples with Gaia DR4 and beyond. Whereas Gaia EDR3 was based on 34 months of observations, the DR4 astrometric solution of Gaia will be based on approximately 66 months of observations, and the Gaia Collaboration expects improvements in proper motion proportional to and in parallax proportional to . Hence, DR4 proper motion uncertainties may be about times their DR3 uncertainties, whereas DR4 parallax uncertainties could be approximately times those reported in DR3. As Eq. 1 illustrates (cf. also footnote 3), the ability of detecting clusters against the background depends on distance and proper motion uncertainties. However, it is unlikely that the full gain in proper motion precision will directly map to a greater volume limit for detecting clusters because parallax errors improve less rapidly. To obtain a rough estimate of future improvements, we therefore considered a mean improvement by a factor of approximately 2 (counting parallax and both proper motion directions separately), which would double the distance within which cluster Cepheids can be detected. Based on their location in the Galactic plane, the number of clusters increases proportional to , resulting in a potential quadrupling of cluster-hosting Cepheids with DR4, and thus, in a potential improvement of a factor of for the LL calibration. Since most long-period Cepheids are located at distances beyond kpc, this will be particularly useful to increase the number of these high-priority targets.
Calibrating the cosmic distance ladder to within requires parallaxes of Cepheids measured to an accuracy of as (Riess et al., 2021). At present, cluster Cepheids appear to be the most viable route to this goal. However, the angular covariance of the (E)DR3 parallaxes currently still sets an error floor of as and is therefore in urgent need of further improvement. It is very noteworthy that cluster members apparently do not require residual parallax offset corrections, since solving for this offset has thus far limited the power of Gaia parallaxes for measuring (e.g., Riess et al., 2018, 2021). Additionally, new HST observations of cluster Cepheids will be crucial to avoid uncertainties related to photometric transformations from the ground to the HST system. In summary, identifying new cluster Cepheids and measuring their photometry using HST will provide the most accurate basis for calibrating the distance ladder for a measurement. We are optimistic that future Gaia data releases will continue to improve the error floor set by angular covariance and that other mitigation strategies can be identified to leverage the power of Gaia for the extragalactic distance scale and cosmology.
6 Conclusions
We carried out a systematic search for MW cluster Cepheids using Gaia EDR3 and DR3 data. The improved proper motion precision of EDR3 over DR2 allowed us to obtain a more detailed and accurate view of cluster membership for previously discussed cluster Cepheids. Since our method requires no advance knowledge of clusters being present in the vicinity of Cepheids, we a) determined cluster astrometry without the need for prior literature search on the host clusters, and b) avoided confusion of cluster identification in case of complex sky areas featuring multiple clusters. We thus established a Gold sample of 34 Cepheids residing in 28 distinct MW open clusters. They include the three new bona fide cluster Cepheids ST Tau, V0378 Cen, and GH Lup. Additionally, we corrected the host cluster identification for three Cepheids previously discussed in the literature, namely SX Vel, IQ Nor, and VW Cru. We find SV Vul to be a bona fide cluster Cepheid that falls squarely on the Galactic LL. We find three Silver sample cluster Cepheid candidates of interest, of which X Pup is a likely cluster Cepheid, whereas the XZ Car cluster membership is tentatively excluded by kinematic constraints and the AP Vel parallax narrowly contradicts membership in Ruprecht 65. Additional combinations of possible interest are included in a Bronze sample.
Using photometric distances of Cepheids in the Gold sample and the concatenated list of Cepheids from Pietrukowicz et al. (2021) and Ripepi et al. (2022b), we estimate the fraction of clustered Cepheids within kpc to be in the range of . We find a slightly larger fraction for Cepheids pulsating in the fundamental mode compared to the first overtone, which may be related to the dependence of on age and cluster dispersal timescales.
Cluster parallaxes are superior for LL calibration compared to individual Cepheid parallaxes because cluster member stars combine several benefits, including a) greater statistical precision, b) better systematics in a fainter magnitude range that does not require special processing, c) the absence of high-amplitude variability, and d) greater consistency in brightness and color with LMC stars and quasars used to determine the EDR3 parallax systematics (L21). The uncertainty of average cluster parallaxes is currently dominated by angular covariance, which limits average parallax uncertainties to as, although the statistical uncertainty can be as low as as.
We identified the magnitude and color ranges of mag and as a sweet spot for determining average cluster parallaxes. Previous studies (e.g,. Flynn et al., 2022; Maíz Apellániz, 2022) found that parallaxes of cluster member stars in this magnitude range are adequately corrected by the L21 recipes, and we cross-checked this result using Cepheids in the LMC, taking the metallicity difference between MW and LMC Cepheids into account. Using the LL metallicity slope yielded negative values in six individual photometric passbands and three reddening-free Wesenheit magnitudes, confirming recent results by Breuval et al. (2022). Allowing for a nonzero offset for cluster parallaxes yields a weighted average of as, with each individual offset consistent with to within . Hence, we confirm that cluster parallaxes determined using member stars in this magnitude and color range require no further correction of residual parallax offsets beyond the L21 corrections. We stress that the LMC was used only for comparison and does not otherwise enter the results of this study.
Setting , we calibrated the Galactic Cepheid LL in the several passbands and reddening-free Wesenheit magnitudes while simultaneously solving for a residual parallax offset of Gaia parallaxes of Cepheids, . In particular, we calibrated the absolute luminosity scale of d fundamental-mode Cepheids at solar metallicity to a precision of using NIR HST Wesenheit magnitudes and to a precision of using optical Gaia Wesenheit magnitudes. The LL slope and metallicity effect from the SH0ES analysis provide the most direct comparison of our results of relevance for the Hubble constant and reveals excellent () agreement with the recent results by Riess et al. (2022a). Using NIR HST and optical Gaia Wesenheit magnitudes, we obtained and as, respectively. This measurement of the residual parallax offset for Cepheids is the most precise to date and provides strong independent confirmation of the Cepheid parallax offset of as measured by the SH0ES team.
Cluster Cepheids can play a crucial role for the measurement of by providing an accurate absolute trigonometric scale based on Gaia astrometry without the need to solve for further offsets while determining the Hubble constant. Future developments, such as improved proper motion membership constraints for cluster detection through the longer astrometric baselines of Gaia in future data releases, improved corrections of the Gaia parallax systematics and angular covariance, and high-quality photometry of MW Cepheids in and out of clusters will particularly improve the base calibration of the distance scale toward a Hubble constant measurement.
Acknowledgements.
We thank the anonymous referee for comments that allowed to improve the quality of the manuscript. We are thankful for useful discussions with Adam Riess and Stefano Casertano as well as their comments on an earlier version of the manuscript. We further acknowledge useful discussions in the framework of the ISSI International Team project #490 meeting in Bern in July 2022.MC & RIA acknowledge support from the European Research Council (ERC) under the European Union’s Horizon 2020 research and innovation programme (Grant Agreement No. 947660). RIA further acknowledges support through a Swiss National Science Foundation Eccellenza Professorial Fellowship (award PCEFP2_194638). This work has made use of data from the European Space Agency (ESA) mission Gaia (https://www.cosmos.esa.int/gaia), processed by the Gaia Data Processing and Analysis Consortium (DPAC, https://www.cosmos.esa.int/web/gaia/dpac/consortium). Funding for the DPAC has been provided by national institutions, in particular the institutions participating in the Gaia Multilateral Agreement. This research has made use of NASA’s Astrophysics Data System; the SIMBAD database and the VizieR catalog access tool141414http://cdsweb.u-strasbg.fr/ provided by CDS, Strasbourg; Astropy151515http://www.astropy.org, a community-developed core Python package for Astronomy (Robitaille et al., 2013; Price-Whelan et al., 2018); TOPCAT161616http://www.star.bristol.ac.uk/~mbt/topcat/ (Taylor, 2005).
Appendix A Detected host clusters
Figure 12 shows the estimated dispersion in proper motion for the detected clusters in this study. Table 17 provides the Gaia EDR3 source ids for all cluster members, as well as the parallax corrections that were used to compute the residual offset for MW Cepheids in Sect. 4.3.
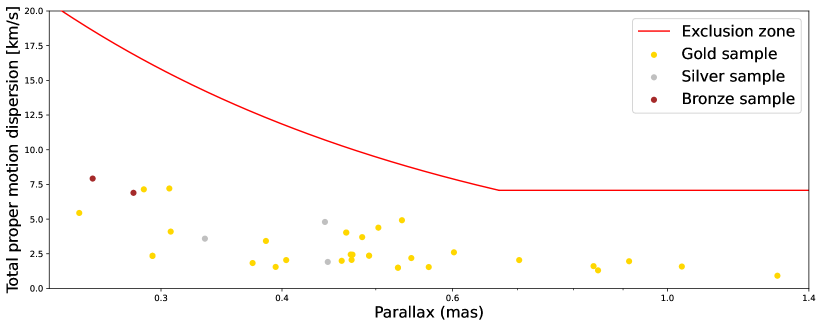
| Cluster | Gaia EDR3 source id | ||
|---|---|---|---|
| (mas) | (mas) | ||
| Czernik 41 | 2026716726778925568 | 0.3398 | -0.0148 |
| Czernik 41 | 2026716692420403328 | 0.4367 | -0.0408 |
| Czernik 41 | 2026716731097672704 | 0.3948 | -0.0470 |
| … | … | … | … |
References
- Anderson et al. (2016a) Anderson, R., Casertano, S., Riess, A., et al. 2016a, The Astrophysical Journal Supplement Series, 226, 18
- Anderson (2022) Anderson, R. I. 2022, A&A, 658, A148
- Anderson et al. (2013) Anderson, R. I., Eyer, L., & Mowlavi, N. 2013, Monthly Notices of the Royal Astronomical Society, 434, 2238
- Anderson & Riess (2018) Anderson, R. I. & Riess, A. G. 2018, The Astrophysical Journal, 861, 36
- Anderson et al. (2016b) Anderson, R. I., Saio, H., Ekström, S., Georgy, C., & Meynet, G. 2016b, Astronomy & Astrophysics, 591, A8
- Apellániz et al. (2021) Apellániz, J. M., González, M. P., & Barbá, R. 2021, Astronomy & Astrophysics, 649, A13
- Arenou & Luri (1999) Arenou, F. & Luri, X. 1999, in Astronomical Society of the Pacific Conference Series, Vol. 167, Harmonizing Cosmic Distance Scales in a Post-HIPPARCOS Era, ed. D. Egret & A. Heck, 13–32
- Barnes et al. (1988) Barnes, III, T. G., Moffett, T. J., & Slovak, M. H. 1988, ApJS, 66, 43
- Berdnikov (2008) Berdnikov, L. 2008, VizieR Online Data Catalog, II
- Bersier (2002) Bersier, D. 2002, ApJS, 140, 465
- Bersier et al. (1994) Bersier, D., Burki, G., Mayor, M., & Duquennoy, A. 1994, A&AS, 108, 25
- Boffin et al. (2022) Boffin, H. M. J., Jerabkova, T., Beccari, G., & Wang, L. 2022, MNRAS, 514, 3579
- Breuval et al. (2020) Breuval, L., Kervella, P., Anderson, R. I., et al. 2020, Astronomy & Astrophysics, 643, A115
- Breuval et al. (2021) Breuval, L., Kervella, P., Wielgórski, P., et al. 2021, The Astrophysical Journal, 913, 38
- Breuval et al. (2022) Breuval, L., Riess, A. G., Kervella, P., Anderson, R. I., & Romaniello, M. 2022, ApJ, 939, 89
- Cantat-Gaudin & Anders (2020) Cantat-Gaudin, T. & Anders, F. 2020, Astronomy & Astrophysics, 633, A99
- Cantat-Gaudin et al. (2020) Cantat-Gaudin, T., Anders, F., Castro-Ginard, A., et al. 2020, A&A, 640, A1
- Cantat-Gaudin et al. (2018) Cantat-Gaudin, T., Jordi, C., Vallenari, A., et al. 2018, Astronomy & Astrophysics, 618, A93
- Castelli & Kurucz (2003) Castelli, F. & Kurucz, R. L. 2003, in Modelling of Stellar Atmospheres, ed. N. Piskunov, W. W. Weiss, & D. F. Gray, Vol. 210, A20
- Castro-Ginard et al. (2022) Castro-Ginard, A., Jordi, C., Luri, X., et al. 2022, A&A, 661, A118
- Castro-Ginard et al. (2018) Castro-Ginard, A., Jordi, C., Luri, X., et al. 2018, Astronomy & Astrophysics, 618, A59
- Chen et al. (2015) Chen, X., de Grijs, R., & Deng, L. 2015, Monthly Notices of the Royal Astronomical Society, 446, 1268
- Coulson & Caldwell (1985) Coulson, I. M. & Caldwell, J. A. R. 1985, South African Astronomical Observatory Circular, 9, 5
- Dinnbier et al. (2022) Dinnbier, F., Anderson, R. I., & Kroupa, P. 2022, A&A, 659, A169
- El-Badry et al. (2021) El-Badry, K., Rix, H.-W., & Heintz, T. M. 2021, Monthly Notices of the Royal Astronomical Society
- Elsanhoury & Amin (2019) Elsanhoury, W. & Amin, M. Y. 2019, Serbian Astronomical Journal, 45
- Evans et al. (2022) Evans, D. W., Eyer, L., Busso, G., et al. 2022, arXiv e-prints, arXiv:2206.05591
- Evans et al. (2014) Evans, N. R., Pillitteri, I., Wolk, S., et al. 2014, ApJ, 785, L25
- Eyer et al. (2022) Eyer, L., Audard, M., Holl, B., et al. 2022, arXiv e-prints, arXiv:2206.06416
- Fabricius et al. (2021) Fabricius, C., Luri, X., Arenou, F., et al. 2021, Astronomy & Astrophysics, 649, A5
- Fernie et al. (1995) Fernie, J., Beattie, B., Evans, N., & Seager, S. 1995, IBVS No, 4148
- Fitzpatrick (1999) Fitzpatrick, E. L. 1999, Publications of the Astronomical Society of the Pacific, 111, 63
- Flynn et al. (2022) Flynn, C., Sekhri, R., Venville, T., et al. 2022, MNRAS, 509, 4276
- Genovali et al. (2014) Genovali, K., Lemasle, B., Bono, G., et al. 2014, Astronomy & Astrophysics, 566, A37
- Genovali et al. (2015) Genovali, K., Lemasle, B., Da Silva, R., et al. 2015, Astronomy & Astrophysics, 580, A17
- Gieren et al. (2018) Gieren, W., Storm, J., Konorski, P., et al. 2018, Astronomy & Astrophysics, 620, A99
- Gieren et al. (1997) Gieren, W. P., Fouqué, P., & Gómez, M. 1997, The Astrophysical Journal, 488, 74
- Gorynya et al. (1992) Gorynya, N. A., Irsmambetova, T. R., Rastorgouev, A. S., & Samus, N. N. 1992, Soviet Astronomy Letters, 18, 316
- Grevesse & Sauval (1998) Grevesse, N. & Sauval, A. J. 1998, Space Sci. Rev., 85, 161
- Groenewegen (2018) Groenewegen, M. 2018, Astronomy & Astrophysics, 619, A8
- He et al. (2022) He, Z., Li, C., Zhong, J., et al. 2022, ApJS, 260, 8
- Heinze et al. (2018) Heinze, A., Tonry, J. L., Denneau, L., et al. 2018, The Astronomical Journal, 156, 241
- Huang et al. (2021) Huang, Y., Yuan, H., Beers, T. C., & Zhang, H. 2021, The Astrophysical Journal Letters, 910, L5
- Hunt & Reffert (2021) Hunt, E. L. & Reffert, S. 2021, Astronomy & Astrophysics, 646, A104
- Imbert (1999) Imbert, M. 1999, A&AS, 140, 79
- Jacyszyn-Dobrzeniecka et al. (2016) Jacyszyn-Dobrzeniecka, A. M., Skowron, D. M., Mróz, P., et al. 2016, Acta Astron., 66, 149
- Jerabkova et al. (2021) Jerabkova, T., Boffin, H. M. J., Beccari, G., et al. 2021, A&A, 647, A137
- Katz et al. (2022) Katz, D., Sartoretti, P., Guerrier, A., et al. 2022, arXiv e-prints, arXiv:2206.05902
- Kervella et al. (2019) Kervella, P., Gallenne, A., Evans, N. R., et al. 2019, Astronomy & Astrophysics, 623, A117
- Khan et al. (2019) Khan, S., Miglio, A., Mosser, B., et al. 2019, Astronomy & Astrophysics, 628, A35
- Kharchenko (2001) Kharchenko, N. 2001, Kinematika i Fizika Nebesnykh Tel, 17, 409
- Kharchenko et al. (2005) Kharchenko, N., Piskunov, A., Röser, S., Schilbach, E., & Scholz, R.-D. 2005, Astronomy & Astrophysics, 438, 1163
- Kharchenko et al. (2013) Kharchenko, N., Piskunov, A., Schilbach, E., Röser, S., & Scholz, R.-D. 2013, Astronomy & Astrophysics, 558, A53
- Kodric et al. (2018) Kodric, M., Riffeser, A., Hopp, U., et al. 2018, AJ, 156, 130
- Kovtyukh et al. (2016) Kovtyukh, V., Lemasle, B., Chekhonadskikh, F., et al. 2016, Monthly Notices of the Royal Astronomical Society, 460, 2077
- Laney & Stobie (1992) Laney, C. & Stobie, R. 1992, Astronomy and Astrophysics Supplement Series, 93, 93
- Leavitt & Pickering (1912) Leavitt, H. S. & Pickering, E. C. 1912, Harvard College Observatory Circular, 173, 1
- Lemasle et al. (2007) Lemasle, B., François, P., Bono, G., et al. 2007, Astronomy & Astrophysics, 467, 283
- Lindegren et al. (2021) Lindegren, L., Bastian, U., Biermann, M., et al. 2021, Astronomy & Astrophysics, 649, A4
- Luck et al. (2011) Luck, R., Andrievsky, S., Kovtyukh, V., Gieren, W., & Graczyk, D. 2011, The Astronomical Journal, 142, 51
- Luck & Lambert (2011) Luck, R. E. & Lambert, D. L. 2011, The Astronomical Journal, 142, 136
- Madore (1982) Madore, B. F. 1982, ApJ, 253, 575
- Maíz Apellániz (2022) Maíz Apellániz, J. 2022, A&A, 657, A130
- McInnes et al. (2017) McInnes, L., Healy, J., & Astels, S. 2017, The Journal of Open Source Software, 2
- Medina et al. (2021) Medina, G. E., Lemasle, B., & Grebel, E. K. 2021, Monthly Notices of the Royal Astronomical Society, 505, 1342
- Mel’nik et al. (2015) Mel’nik, A. M., Rautiainen, P., Berdnikov, L. N., Dambis, A. K., & Rastorguev, A. S. 2015, Astronomische Nachrichten, 336, 70
- Metzger et al. (1991) Metzger, M. R., Caldwell, J. A. R., McCarthy, J. K., & Schechter, P. J. 1991, ApJS, 76, 803
- Metzger et al. (1992) Metzger, M. R., Caldwell, J. A. R., & Schechter, P. L. 1992, AJ, 103, 529
- Monson & Pierce (2011) Monson, A. & Pierce, M. 2011, VizieR Online Data Catalog, J
- Negueruela et al. (2020) Negueruela, I., Dorda, R., & Marco, A. 2020, Monthly Notices of the Royal Astronomical Society, 494, 3028
- Owens et al. (2022) Owens, K. A., Freedman, W. L., Madore, B. F., & Lee, A. J. 2022, The Astrophysical Journal, 927, 8
- Pietrukowicz et al. (2021) Pietrukowicz, P., Soszyński, I., & Udalski, A. 2021, Acta Astron., 71, 205
- Pietrzyński et al. (2019) Pietrzyński, G., Graczyk, D., Gallenne, A., et al. 2019, Nature, 567, 200
- Planck Collaboration et al. (2020) Planck Collaboration, Aghanim, N., Akrami, Y., et al. 2020, A&A, 641, A6
- Pont et al. (1994) Pont, F., Burki, G., & Mayor, M. 1994, A&AS, 105, 165
- Price-Whelan et al. (2018) Price-Whelan, A. M., Sipőcz, B., Günther, H., et al. 2018, The Astronomical Journal, 156, 123
- Ren et al. (2021) Ren, F., Chen, X., Zhang, H., et al. 2021, ApJ, 911, L20
- Riello et al. (2021) Riello, M., De Angeli, F., Evans, D. W., et al. 2021, A&A, 649, A3
- Riess et al. (2022a) Riess, A. G., Breuval, L., Yuan, W., et al. 2022a, ApJ, 938, 36
- Riess et al. (2021) Riess, A. G., Casertano, S., Yuan, W., et al. 2021, The Astrophysical Journal Letters, 908, L6
- Riess et al. (2018) Riess, A. G., Casertano, S., Yuan, W., et al. 2018, The Astrophysical Journal, 855, 136
- Riess et al. (2018) Riess, A. G., Casertano, S., Yuan, W., et al. 2018, ApJ, 861, 126
- Riess et al. (2019) Riess, A. G., Casertano, S., Yuan, W., Macri, L. M., & Scolnic, D. 2019, The Astrophysical Journal, 876, 85
- Riess et al. (2016) Riess, A. G., Macri, L. M., Hoffmann, S. L., et al. 2016, ApJ, 826, 56
- Riess et al. (2019) Riess, A. G., Narayan, G., & Calamida, A. 2019, Calibration of the WFC3-IR Count-rate Nonlinearity, Sub-percent Accuracy for a Factor of a Million in Flux, Instrument Science Report WFC3 2019-1, 13 pages
- Riess et al. (2022b) Riess, A. G., Yuan, W., Macri, L. M., et al. 2022b, ApJ, 934, L7
- Ripepi et al. (2022a) Ripepi, V., Catanzaro, G., Clementini, G., et al. 2022a, A&A, 659, A167
- Ripepi et al. (2022b) Ripepi, V., Clementini, G., Molinaro, R., et al. 2022b, arXiv e-prints, arXiv:2206.06212
- Ripepi et al. (2022c) Ripepi, V., Clementini, G., Molinaro, R., et al. 2022c, arXiv e-prints, arXiv:2206.06212
- Ripepi et al. (2019) Ripepi, V., Molinaro, R., Musella, I., et al. 2019, A&A, 625, A14
- Robitaille et al. (2013) Robitaille, T. P., Tollerud, E. J., Greenfield, P., et al. 2013, Astronomy & Astrophysics, 558, A33
- Romaniello et al. (2008) Romaniello, M., Primas, F., Mottini, M., et al. 2008, Astronomy & Astrophysics, 488, 731
- Romaniello et al. (2022) Romaniello, M., Riess, A., Mancino, S., et al. 2022, Astronomy and Astrophysics, 658, A29
- Schönrich et al. (2019) Schönrich, R., McMillan, P., & Eyer, L. 2019, MNRAS, 487, 3568
- Skowron et al. (2021) Skowron, D. M., Skowron, J., Udalski, A., et al. 2021, ApJS, 252, 23
- Soszyński et al. (2017) Soszyński, I., Udalski, A., Szymański, M. K., et al. 2017, Acta Astron., 67, 103
- Stassun & Torres (2021) Stassun, K. G. & Torres, G. 2021, ApJ, 907, L33
- Storm et al. (2004) Storm, J., Carney, B. W., Gieren, W. P., et al. 2004, A&A, 415, 531
- Taylor (2005) Taylor, M. B. 2005, in Astronomical Society of the Pacific Conference Series, Vol. 347, Astronomical Data Analysis Software and Systems XIV, ed. P. Shopbell, M. Britton, & R. Ebert, 29
- The Gaia collaboration et al. (2021) The Gaia collaboration, Brown, A., Vallenari, A., et al. 2021, Astronomy & Astrophysics, 650, C3
- The Gaia collaboration et al. (2016) The Gaia collaboration, Prusti, T., De Bruijne, J., et al. 2016, Astronomy & astrophysics, 595, A1
- Turner (1998) Turner, D. G. 1998, The Astronomical Journal, 116, 274
- Usenko et al. (2019) Usenko, I., Kniazev, A. Y., Katkov, I. Y., et al. 2019, Odessa Astronomical Publications
- Vasiliev & Baumgardt (2021) Vasiliev, E. & Baumgardt, H. 2021, Monthly Notices of the Royal Astronomical Society
- Wang et al. (2022) Wang, C., Yuan, H., & Huang, Y. 2022, AJ, 163, 149
- Zhou & Chen (2021) Zhou, X. & Chen, X. 2021, Monthly Notices of the Royal Astronomical Society, 504, 4768
- Zinn (2021) Zinn, J. C. 2021, AJ, 161, 214
- Zinn (2021) Zinn, J. C. 2021, The Astronomical Journal, 161, 214
- Zinn et al. (2019) Zinn, J. C., Pinsonneault, M. H., Huber, D., & Stello, D. 2019, The Astrophysical Journal, 878, 136