Detecting Environmental Violations with Satellite Imagery in Near Real Time: Land Application under the Clean Water Act
Abstract.
This paper introduces a new, highly consequential setting for the use of computer vision for environmental sustainability. Concentrated Animal Feeding Operations (CAFOs) (aka intensive livestock farms or “factory farms”) produce significant manure and pollution. Dumping manure in the winter months poses significant environmental risks and violates environmental law in many states. Yet the federal Environmental Protection Agency (EPA) and state agencies have relied primarily on self-reporting to monitor such instances of “land application.” Our paper makes four contributions. First, we introduce the environmental, policy, and agricultural setting of CAFOs and land application. Second, we provide a new dataset of high-cadence (daily to weekly) 3m/pixel satellite imagery from 2018-20 for 330 CAFOs in Wisconsin with hand labeled instances of land application (n=57,697). Third, we develop an object detection model to predict land application and a system to perform inference in near real-time. We show that this system effectively appears to detect land application (PR AUC = 0.93) and we uncover several outlier facilities which appear to apply regularly and excessively. Last, we estimate the population prevalence of land application events in Winter 2021/22. We show that the prevalence of land application is much higher than what is self-reported by facilities. The system can be used by environmental regulators and interest groups, one of which piloted field visits based on this system this past winter. Overall, our application demonstrates the potential for AI-based computer vision systems to solve major problems in environmental compliance with near-daily imagery.
1. Introduction
How can advances in machine learning be used to transform environmental sustainability? We illustrate its potential in agriculture, which is the leading contributor to water pollution in the United States (USEPA, 2003). Of particular concern are Concentrated Animal Feeding Operations (CAFOs) (aka intensive livestock farms or “factory farms”), industrial-scale livestock operations that raise large volumes of animals in close confinement. In 2008, CAFOs were responsible for more than 50% of the total livestock production in the U.S. (Gurian-Sherman, 2008), a number that has continued to grow in recent years (Hribar, 2010), both nationally and internationally (Liu et al., 2018).
CAFOs produce substantial amounts of manure and manure-contaminated wastewater. The U.S. Government Accountability Office (GAO) notes that a large hog farm can produce more than 1.6M tons of manure annually, more than 1.5 times the amount produced by Philadelphia (1.5M residents) (Mittal, 2009). A large cattle farm can produce more than 2M tons of manure (Mittal, 2009). In 1998, CAFOs produced more than 133M tons of solid manure overall each year, more than 13 times the annual amount of human waste across the United States (Burkholder et al., 2007). Unfortunately, more up-to-date estimates are difficult to obtain because, according to the GAO, “[n]o federal agency collects accurate and consistent data on the number, size, and location of CAFOs” (Mittal, 2009). However, the increase in the number of CAFOs tell us that the amount of waste is likely to have increased proportionally. Given the amount of waste produced by CAFOs, ensuring it is handled appropriately is of the utmost importance.
CAFO waste can be a useful natural fertilizer. When applied injudiciously, however, it can lead to severe environmental and public health problems (Bradford et al., 2008). Waste products have high concentrations of nitrogen and phosphorus, leakage of which into waterways causes eutrophication, i.e., deoxygenation and the resulting death of animal life from excessive vegetation growth (Mallin and Cahoon, 2003). Even at recommended application rates, nearby streams can be contaminated by fecal matter (Mallin et al., 2015). Other contaminants detected in both nearby groundwater and bodies of water include heavy metals (e.g., arsenic) (Liu et al., 2015; Nachman et al., 2005), antibiotics (Campagnolo et al., 2002), microbial pathogens (Gerba and Smith, 2005), and endocrine disrupting hormones (e.g., steroidal estrogen) (Raman et al., 2004; Hanselman et al., 2003). The effects are not limited to waterways. Application results in air emissions of ammonia, hydrogen sulfide, and methane (Merkel, 2002). The former are associated with health risks such as bronchitis, inflammation, and burns to the respiratory tract, while the latter increase greenhouse gas concentrations (Hribar, 2010).
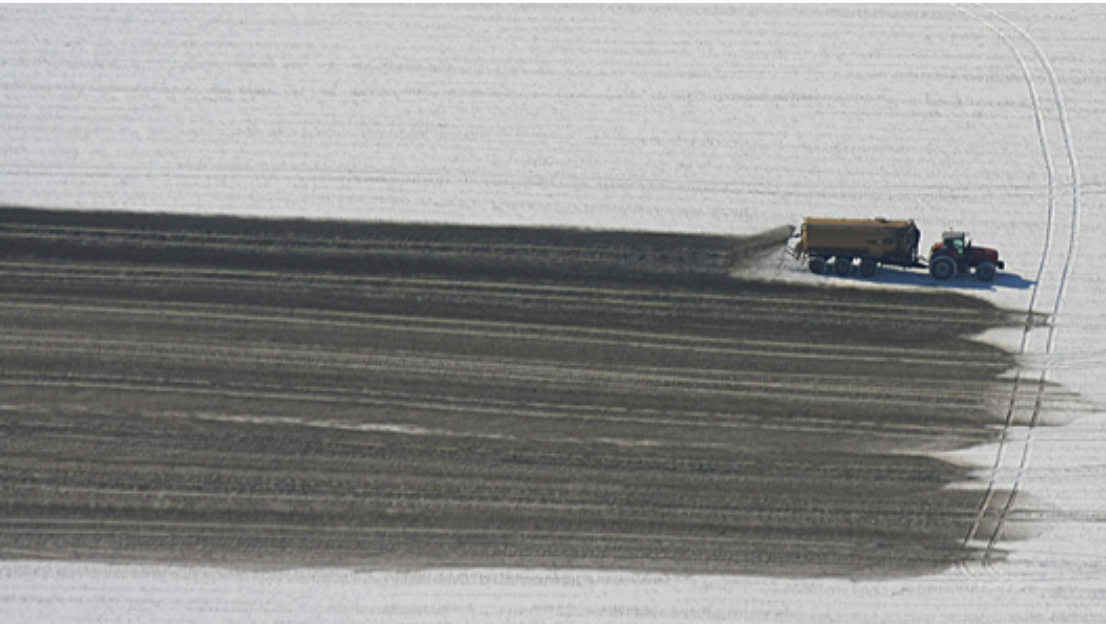
Of acute policy concern has been land application (i.e., the distribution of manure on land) in the winter time (Liu et al., 2018; Srinivasan et al., 2006). Figure 1 illustrates the common technique for land application to a snow covered field, namely by use of a tractor-drawn tank spreader. Such winter land application poses distinct risks. Frozen and wet ground and the dearth of crops (which can take up manure nutrients) are believed to exacerbate nutrient runoff, thereby heightening the risk of ground and surface water pollution (Klausner et al., 1976; Lewis and Makarewicz, 2009; Srinivasan et al., 2006; Williams et al., 2011). The issue has been particularly contentious in Northern parts of the United States and Canada (Srinivasan et al., 2006). The International Joint Commission by the Great Lakes Water Quality Board suggested that land application in the presence of snow and heavy rain be banned in order to keep algal blooms under control (International Joint Commission, 2019).
1.1. Policy Setting
Due to the risks associated with winter land application, many efforts have been focused on how to regulate practices and monitor violations (Liu et al., 2018). Transporting or storing waste is expensive and facilities are often limited in their storage capacity (Bradford et al., 2008), such that some degree of winter application is likely.
Most developed countries regulate or ban winter manure application (Liu et al., 2018). The federal Environmental Protection Agency (EPA) requires that permitted CAFOs follow a nutrient management plan (NMP) which determines where and how often they can apply. The specifics of the NMP are determined at a state level and there is significant heterogeneity in whether and how states regulate winter land application (Liu et al., 2018). In Wisconsin, where this project is focused, application of waste is restricted in the winter time. In February and March, liquid waste may generally not be applied and solid waste may not be applied to any field that contains snow or is frozen § NR 243.14(6)(c). Outside of February and March, liquid waste remains prohibited on frozen ground absent emergencies (§ NR 243.14(7)(a)) and application of solid manure remains restricted based on the amount of snow and slope of the field (§§ NR 243.14(6)(c) & 243.14(7)(c)).
Wisconsin law also provides for “emergency application” for liquid manure in cases of “unusual weather conditions, equipment failure or other unforeseen circumstances beyond the control of the permittee.” Such emergency land applications require prior verbal approval from the Wisconsin Department of Natural Resources (DNR), followed by a written description of the event to the department within five days of its occurrence (§§ NR 243.14(7)(d)(1)(c)-(d)).
All instances of land application are also required to be reported in detail. Facilities must file annual spreading reports, which include dates of application, field information, and nutrient information. Such reporting applies to “surface applications on frozen or snow-covered ground,” which must also report “whether any applied manure or process wastewater ran off the application site” (§ NR 243.19(3)(c)(5)).
While such self-reporting is required in principle, many have critiqued existing requirements as lacking teeth. One article described EPA’s then-rules as “an exercise in unsupervised self-monitoring” (Jerger, 2004). Verifying and ascertaining the extent of winter application – throughout February and March specifically – is difficult. Nor is it easy to understand the volume of approval for emergency applications. In response to a Freedom of Information Act request, the Wisconsin DNR indicated that it was not possible to release a complete list of authorized instances of land applications, as such information was not available in any database format. In the few disclosed instances of email authorizations, such land application events were not included in annual spreading reports. Moreover, while some reports include addenda that indicate winter land application, insufficient detail is provided to determine the volume, location, and dates of application. In short, very little is known about compliance with, and emergency exemptions from, prohibitions of winter land application.
As a result, local environmental interest groups and motivated residents have taken the initiative to report suspected instances of application by physical visits and documentation (see, e.g., (Group, 2016)). But the information asymmetry has made enforcement of the Clean Water Act – and NMP permit terms specifically – difficult. CAFO winter land application raises acute challenges for environmental regulation, as we do not understand basic questions: how often does winter land application occur? How many facilities engage in such practices? How compliant are CAFO operators with state law and guidelines?
1.2. Our contribution
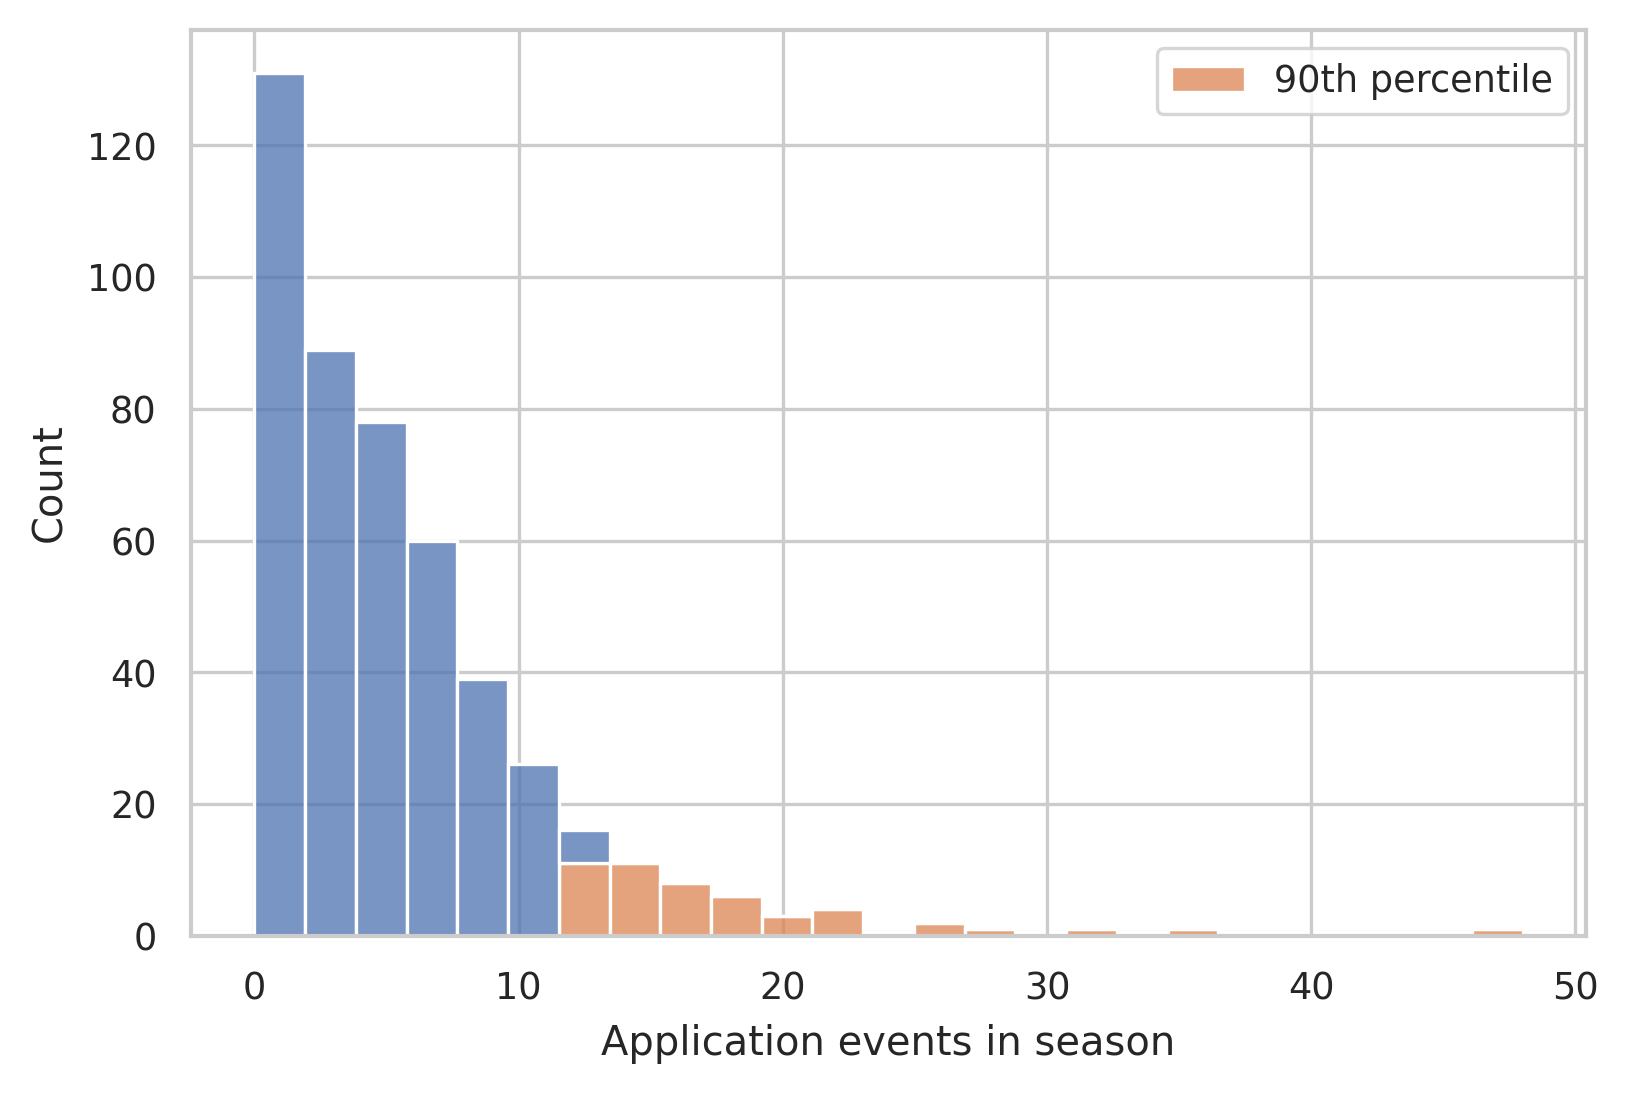
To help determine the extent of winter application, we build a real-time detection system which pulls daily 3m/pixel satellite imagery at known CAFO locations and detects land application using convolutional neural networks (CNNs). We analyze our approach on 330 CAFOs across the state of Wisconsin, where land application in violation of permit terms has long been suspected. We also use our method to gain insights into how and when application occurs, as well as variation between facilities. For instance, we find facilities which increase the number of winter application by over 150% in Winter 2020 compared to 2018 and 2019. We also discover that some facilities have some application on the ground nearly half of the winter season, and that a significant number of application events (20%), occur within one day of each other. Our model also determines that a substantial number of application events occur within a short time frame of one another.
In sum, our contributions are fivefold. First, we introduce the highly consequential environmental, policy, and agricultural setting of CAFOs and land application. Second, we provide a new dataset consisting of time series of satellite imagery at 330 verified CAFO locations across Wisconsin from 2018-2020 (n=57,697), with 1,813 instances of application identified across 96 of these facilities. Third, we develop an automated system to download satellite imagery on a daily or weekly basis and conduct inference on each image for likelihood of land application. Fourth, we prototype a method to convert image-by-image predictions into predictions of application events (which may span more than one image). Fifth, we conduct a retrospective estimate of the prevalence of land application events when presumptively prohibited (February - March 2022) and show that the rate of land application remains alarmingly high during these months.
Our land application detection system was used in partnership with the Environmental Law and Policy Center (ELPC) at the end of the 2021/22 winter Season to investigate several possible instances of application. The partnership is set to continue throughout the 2022/23 winter season, when the system will be used to dispatch volunteers on a weekly basis to identify possible land application.


1.3. Related Work
Our work relates to four bodies of research. First, the environmental risks posed by CAFOs have given rise to recent work on automating their detection and analysis. Computer vision techniques have been used to classify CAFOs by type in North Carolina (Handan-Nader and Ho, 2019), and to detect poultry CAFOs nationwide (Robinson et al., 2022; Maroney et al., 2020; Patyk et al., 2020). Approaches have also been developed to detect when a given CAFO shed was built (Montefiore et al., 2022; Robinson et al., 2021) and whether a facility has expanded over time (Chugg et al., 2021). This prior work is an important starting point for using computer vision in environmental sustainability. Prior work, however, has not utilized near real-time satellite imagery to detect likely violations of permit terms, as we do here.
Second, our work relates more broadly to the literature on satellite detection for the environment. Examples include forest fire detection (Yu et al., 2005), mapping crop cycles (Gao and Zhang, 2021), and detecting droughts (Verbesselt et al., 2012). In general, there is an increasing awareness as to how modern computer vision techniques, and deep learning in particular, can be applied to satellite imagery to tackle environmental and regulatory challenges (Handan-Nader et al., 2021). Our paper also bears some relationship to previous work in anomaly detection in aerial imagery, such as detecting failures in power plants (Vlaminck et al., 2022) and building damage detection (Tilon et al., 2020). Indeed, it is straightforward to cast our problem in terms of anomaly detection. Application events themselves may considered anomalies, as they appear suddenly from one image to the next. But behavior at the facility level may also be anomalous. For example, there may be a drastic increase in the number of application events from one year to the next. See Section 5.2 for results on this front.
Third, on the technical side, our work builds off the rapid evolution of and progress in deep learning for computer vision. Both objection detection and image classification have been increasingly utilized with satellite and aerial imagery, see Cheng and Han (2016) and Dhingra and Kumar (2019) for excellent surveys. Our method is based off of the You-Only-Look-Once (YOLO) family of object detection models (Redmon et al., 2016; Bochkovskiy et al., 2020; Redmon and Farhadi, 2018).
Last, our introduction of this setting of high environmental consequence contributes to the machine learning community. Many scholars have critiqued existing machine learning work as being too fixated on a narrow set of technical benchmarks, without sufficient engagement with real-world problems (Church and Kordoni, 2022; Koch et al., 2021; Wagstaff, 2012). There is growing recognition that while pursuing state-of-the-art on well-defined and rigorously curated benchmark tasks can create better models, such progress does not necessarily translate to real world impact (Raji et al., 2021). Part of the reason lies in the significant barriers to collecting, ground truthing, and releasing meaningful real-world machine learning problems (Handan-Nader et al., 2021; Sambasivan et al., 2021). We release this CAFO land application dataset and all accompanying code 111https://github.com/reglab/land-application-detection. Our contribution here illustrates the possibility of substantial impact of machine learning in environmental sustainability and governance and we hope to inspire the community to help solve these challenging problems (Engstrom et al., 2020; Hino et al., 2018).
2. Data
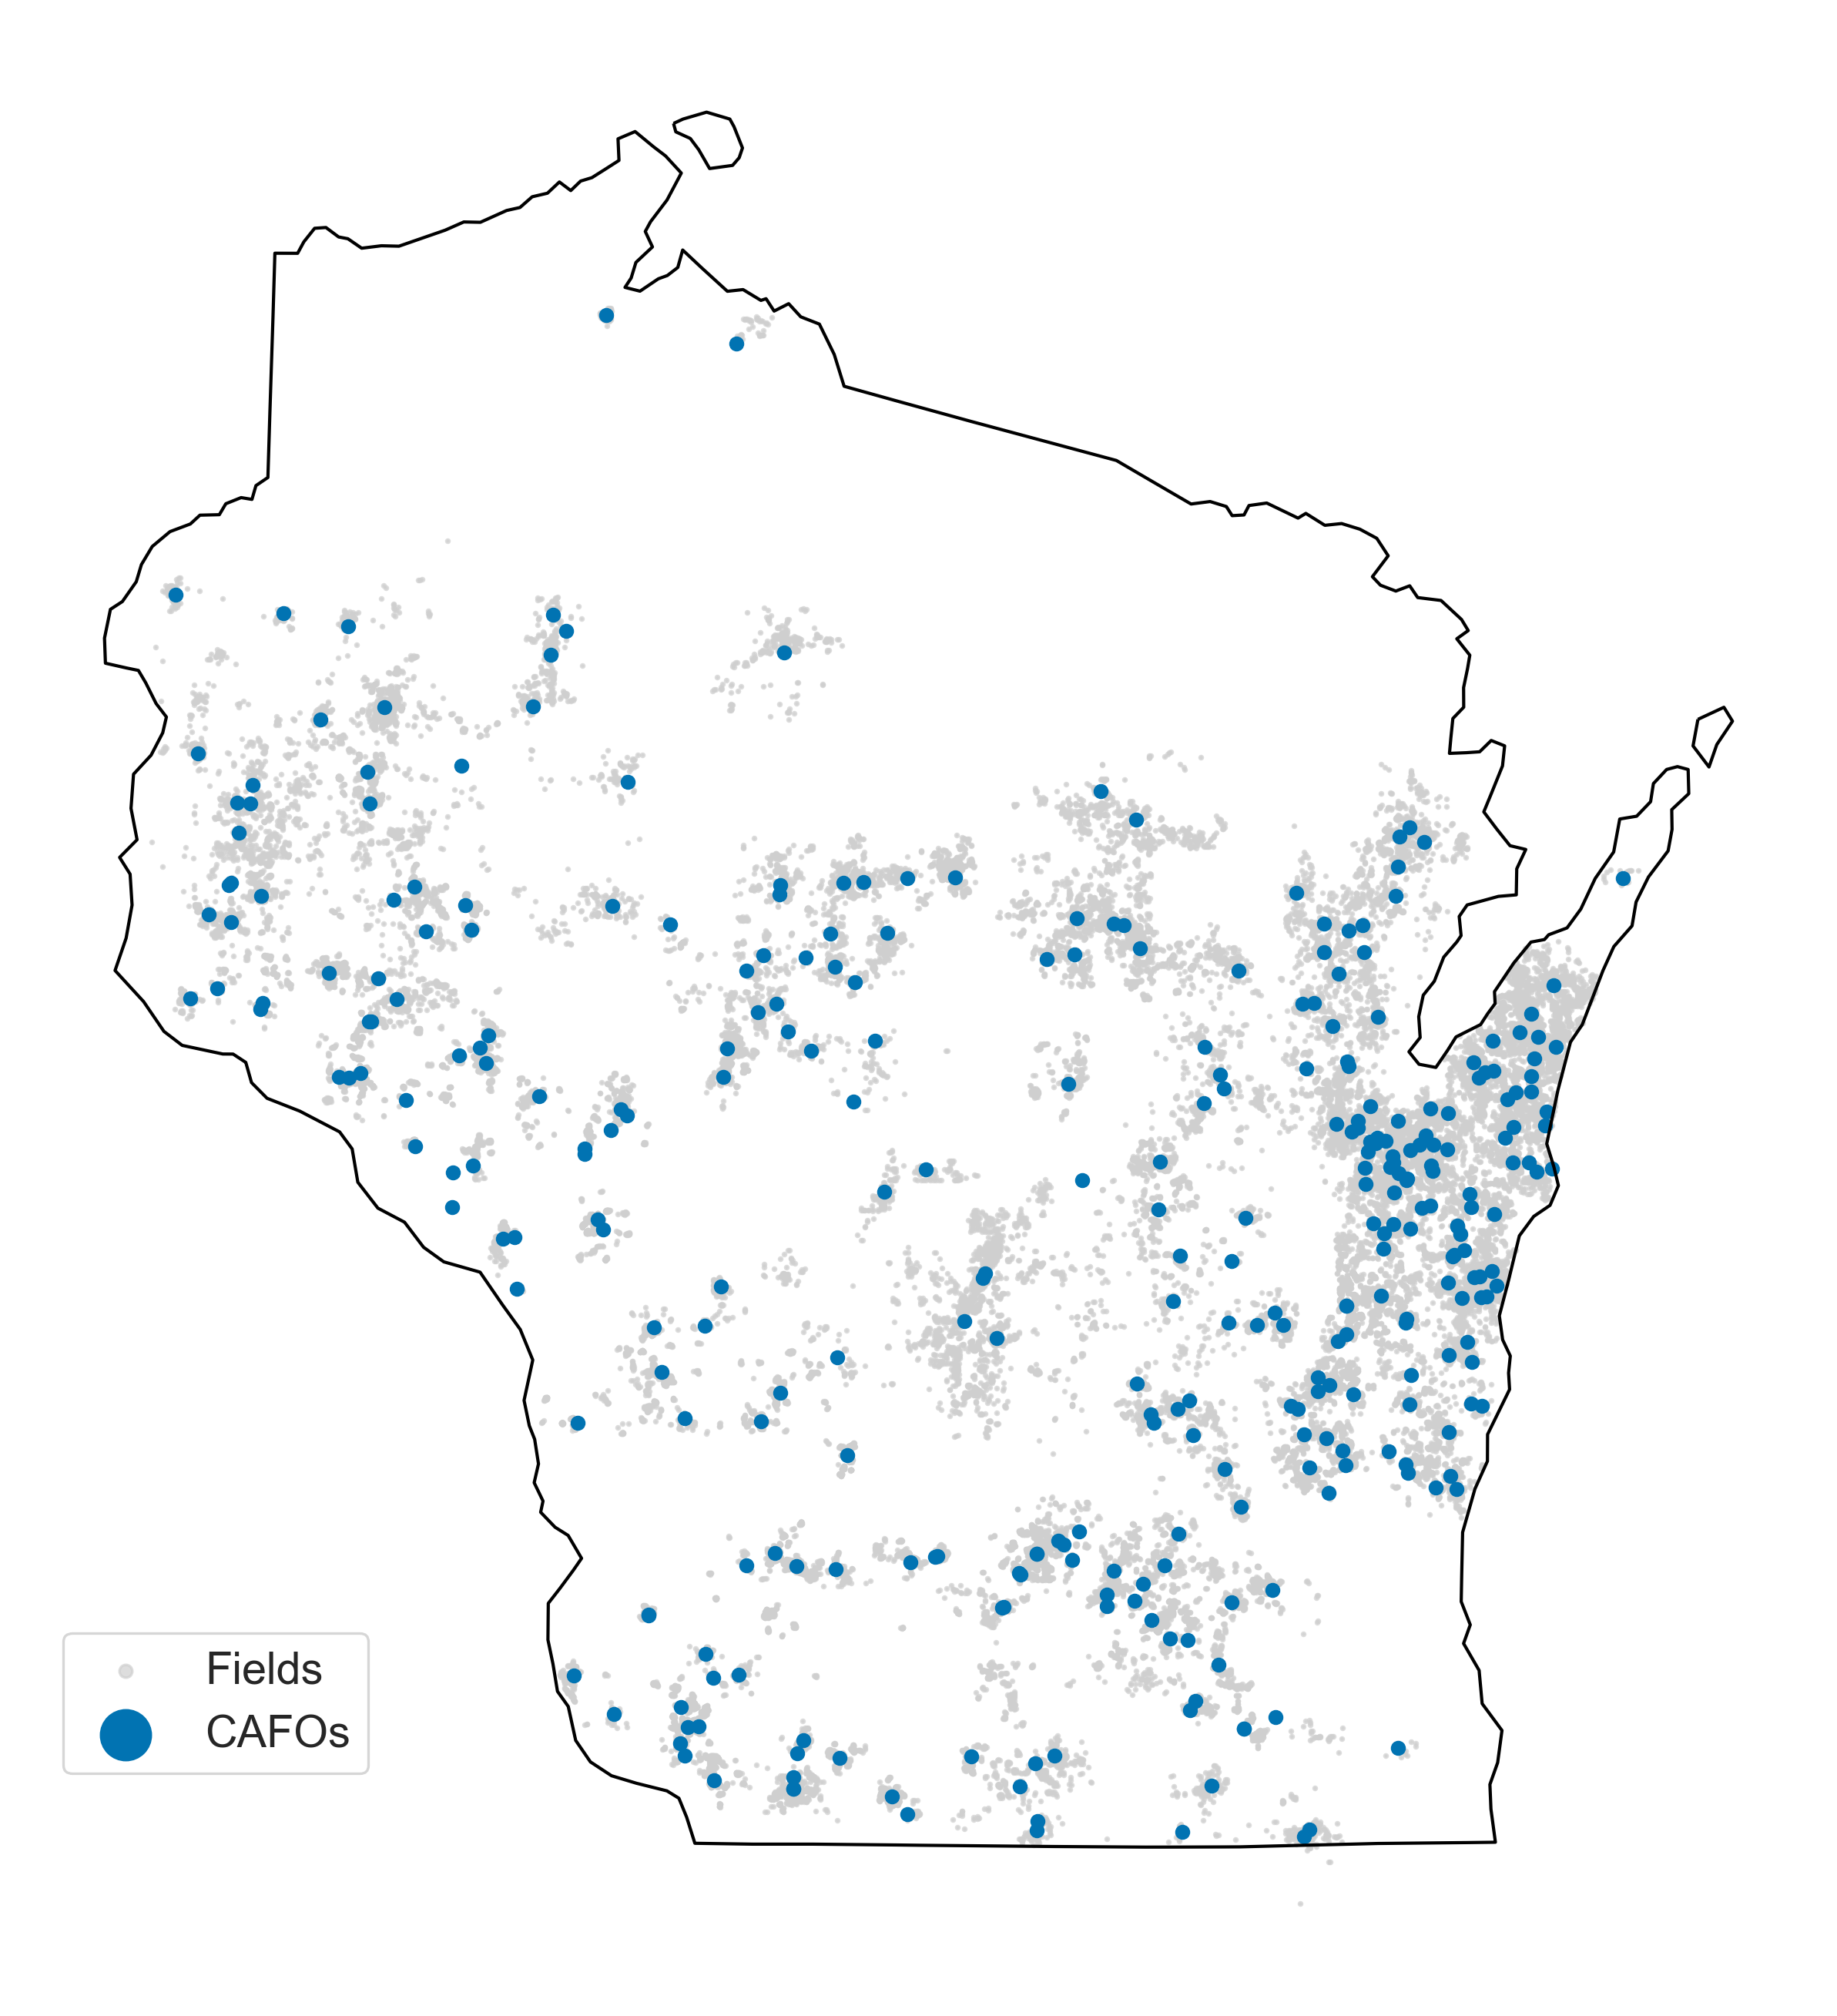
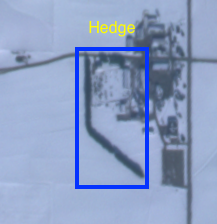
We now describe how we created a new ground truth dataset on land application. First, we obtained the location of 330 CAFOs in Wisconsin from the Environmental Working Group (EWG), which spent many months manually scanning satellite imagery to identify CAFO locations. Through a Freedom of Information Act request with WI DNR, we also obtained shape files for permitted land application areas. Figure 3 plots the CAFO locations and permitted land application areas. Because transportation of waste is expensive, most land application occurs proximate to the CAFO facility.
Second, we acquired daily satellite imagery at 3m/pixel resolution through a subscription with PlanetLabs (Team, 2017). For each CAFO location, we pulled imagery from the 2018, 2019, and 2020 winter seasons (i.e., from November 1 of the given year to March 1 of the subsequent year). The principal rationale is that land application both poses greater environmental harm in the wintertime and is restricted, particularly in February - March, under Wisconsin law (see Subsection 1.1). In addition, detecting land application from 3m/pixel resolution is a hard task, but it is much easier to train humans to determine such instances under snow cover and dates outside that range rarely contained snow. We downloaded images that were 1km by 1km squares, centered on the CAFO locations.
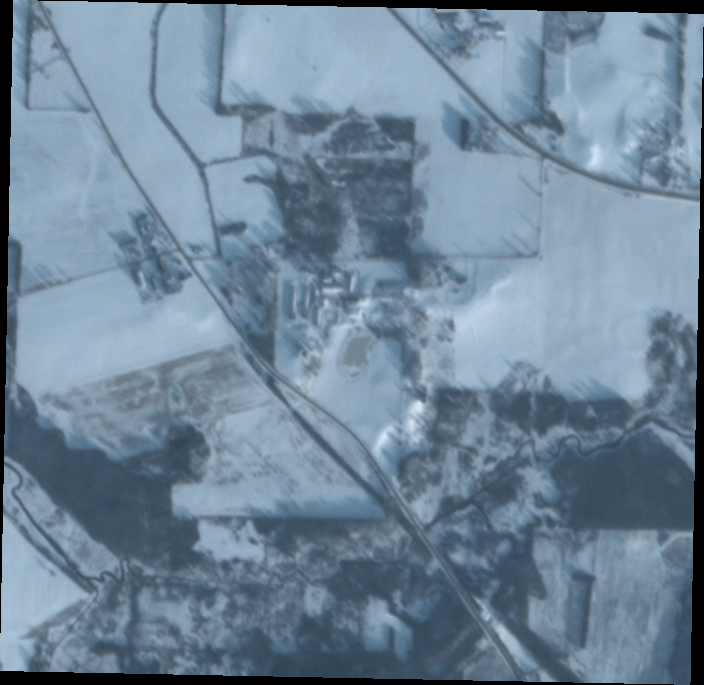
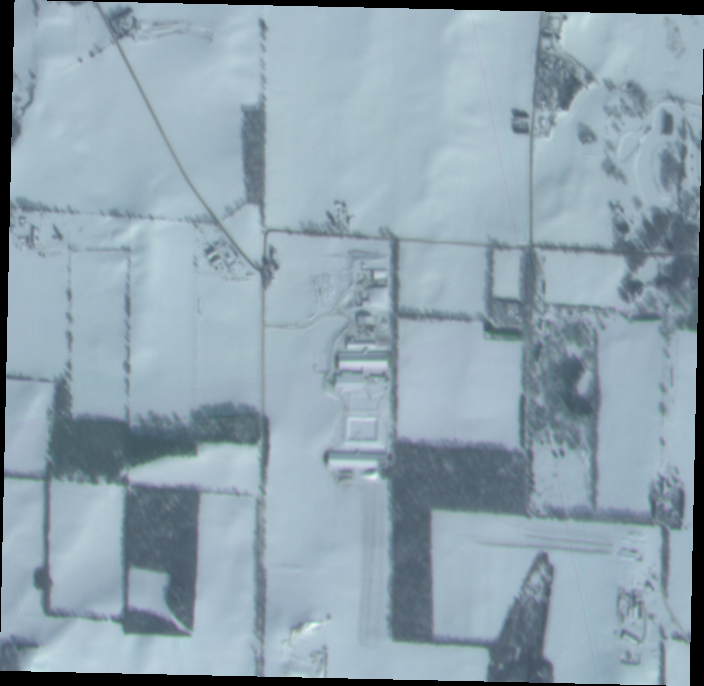
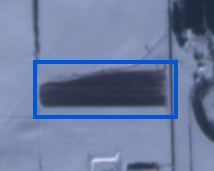
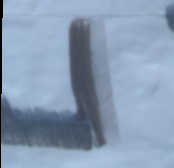
Figure 2 provides examples of the Planet Imagery. The left column presents CAFO locations and surroundings before land application. The right column presents those same facilities with land application events, which resemble the kind of tractor-drawn spreading events depicted in Figure 1. We filtered the images by cloud cover, clarity, existence of image artifacts, and snow cover. This process left us with approximately one image per week per location.
Third, based on a sample of images provided by subject matter experts, we trained a team of undergraduate students and staff researchers to label imagery for instances of land application. This training involved extensive consultation and learning about agricultural practices over the course of a summer, drawing on experts at the Socially Responsible Agriculture Project and the Environmental Law and Policy Center (ELPC). Land application areas within images were labeled with a bounding box, resulting in a positive label for every instance where an application event is captured within a Planet satellite image. To ensure label quality, each image was labeled by at least two members of the research team. This resulted in the identification of 1,061 images containing application and 1,813 total instances of application across 96 locations.22244% of positive images had multiple instances of land application. Although there are strong reasons to believe that reports are incomplete – particularly with respect to winter – we also examined a small sample of annual spreading reports and confirmed that over 40% of the reported events were visible in our data.333A major reason why other reported instances may not be available stems from the filtering for high quality satellite imagery.
Fourth, to construct application events from the image-level bounding boxes, we consider a single event to be a series of application boxes which have non-zero intersection across an unbroken series of images ordered by time. This leaves us with 151 distinct land application events.
3. Problem Formulation
Given a series of images of the same location over time (described in Section 2), our goal is to (i) predict whether each image contains an instance of land application, and (ii) identify the unique application events in the series. Note that an event may (and probably does) persist across images, since application does not fade immediately.
Formally, we have a set of locations and years . For each location-year pair , we have a series of 3-band images and events . An event is a tuple where is the index of the image in which the event starts, the index at which it ends, and is a bounding box enclosing the application event in the images (it is the same for each image since each image has the same coordinates). Of course, a location-year pair might have no events.
As noted before, we consider to be an event of images containing overlapping labeled application boxes, and do not have such boxes (if they exist). Then we set to be the union of all the application boxes across . Our three tasks are:
-
T1.
(Task 1 – Image classification) For each image , determine whether it contains one or more instances of land application (image classification).
-
T2.
(Task 2 – Object Detection) For each image , draw a bounding box around any application.
-
T3.
(Task 3 – Event Detection) Detect the application events .
Task 1 is useful for real-time detection of application, and prioritization of enforcement resources on a daily or weekly basis. Task 2 is useful for identifying precisely where in the image the application lies, and for aggregating image-level predictions into event detections (Task 3). Task 3 is useful for gathering descriptive statistics on past data. For instance, to estimate the total amount of application, we typically care about the number of distinct application events, not merely the number of images containing application. The latter can be influenced by exogenous factors such as a fresh snow fall or cloud cover and is thus not a good proxy for the total amount of application. Moreover, as demonstrated by Figure 2, there can be multiple instances of application in a single image. Thus, classification can undercount the true number of application events.
4. Methods
We consider four distinct models: Two image classification methods (for Task 1), and two object detection methods (for all three tasks), all of which use CNNs. Recall the distinction: image classification methods predict a label for the image as a whole (in our case a binary label, application/no-application), while object detection predicts bounding boxes enclosing predicted classes within each image. Even though the image classification methods cannot be applied to Tasks 2 or 3, we consider them useful baselines. In principle, environmental regulators and interest groups may want to have separate models for different tasks since CNNs designed specifically for image classification may perform better on Task 1 than object detection methods.
4.1. Evaluation
The image classification methods are built for Task 1. However, we also evaluate the object detection models on Task 1. To do so, we need to extract image level classification results from bounding boxes. We do this in the natural way: For any image in which the object detection methods predicted a bounding box, we set the predicted label to True. We set the model score for that image to be the maximum confidence over all detections in the image. If the image contained no detections, we set the predicted label to False, and the model score to be 0. In this way we can evaluate the precision and recall for Task 1.
To evaluate the object detection methods on Task 3 (event detection), we aggregate image-level bounding box predictions into event predictions by considering an event to be any series of detections in an unbroken sequence of images whose bounding boxes all overlap. We compare these predictions to the true predictions as follows. For each true event we ask whether there is a predicted event , any of whose bounding boxes intersect with and whose dates intersect those of . That is, cannot have begun after ended or vice versa.
We train the four models with a 70%/10%/20% train/validation/test split. We split the data by location because the dataset contains multiple images per location per year. A random split would thus likely lead to images of the same location in both the train and test sets, potentially overfitting and/or inflating model performance based on idiosyncrasies of specific locations.
4.2. Image Classification Models
We consider two baselines for Task 1, both employing pretrained CNNs trained to predict whether there exists application in an image, i.e., as a binary classifier for each image. We use an Xception (Chollet, 2017) CNN backbone pretrained on ImageNet and fine-tuned on our data. During training, we allow the layers of the pretrained network to be optimized. Optimization was performed with the SGD optimizer with learning rate 0.0005. We activate all nodes using the ReLU function and use a dropout rate of 0.5 for all layers. The best model was selected based on performance on a validation set of 10% of the labeled locations. Both baseline models were implemented in Keras (Chollet et al., 2015).
Single CNN
The first baseline is a single Xception model with a single convolutional layer added before the pretrained layers. The outputs are run through max pooling to match the size of the input layer of Xception. The outputs from the Xception convolutional layers are flattened to one dimension using global average pooling. We remove the fully connected layers of Xception and replace them with a single fully connected hidden layer and an output layer with one node. The logistic scores from that layer are passed through a sigmoid activation to make the predicted confidence of the input image containing application.
For the single CNN model, the training data was down sampled so that positives and negatives made up equal proportions of the training set. The best model was trained for 146 epochs.
| Image Classification | Event and Object Detection | ||||||
|---|---|---|---|---|---|---|---|
| Model | PR AUC | ROC AUC | @0.5 | @0.5 | @0.5 | PR AUC | mAP@0.5 |
| Single CNN | 0.84 | 0.87 | 0.65 | 0.56 | 0.78 | - | - |
| Dual CNN | 0.71 | 0.74 | 0.12 | 0.09 | 0.27 | - | - |
| Faster R-CNN | 0.92 | 0.92 | 0.77 | 0.88 | 0.67 | 0.63 | 0.57 |
| YOLOv5 | 0.94 | 0.93 | 0.76 | 0.68 | 0.87 | 0.63 | 0.57 |
Dual CNN
The second baseline compares pairs of images, attempting to detect whether application is present in the latter. This baseline is motivated by the observation that, for humans labelers, time-series information was often helpful. Separating application from other features (e.g., trees, dark sheds, roads) is easier if one can see whether purported application is a consistent feature across time. The dual CNN approach is inspired by several successful applications of this methodology to a wide range of tasks, such as fracture detection (Choi et al., 2020), optometry (Repala and Dubey, 2019), and analyzing EEG (Cai et al., 2020).
The dual input model uses a single Xception backbone that is applied to both images at the same time. The model uses a similar input architecture to the single CNN (a CNN layer with max pooling). The two Xception global average pooled outputs are concatenated into one flat vector which is passed into a fully connected network with one hidden layer and a single output node. The logistic scores from that output node are passed through a sigmoid function to make the predicted confidence of the second of the input images containing application.
For the dual input model, the training samples labeled as positives were upsampled by three times and the negatives were downsampled so that the negatives and positives would compose equal proportions of the training set. The resulting best model was trained for 48 epochs.
4.3. Object Detection Models
For both object detection models we perform lightweight hyperparameter optimization via a grid search across the learning rates. We try rates of 1e-4, 2.5e-4, 5e-4, 0.001, 0.005, and 0.01. Beyond that, we engage in limited hyperparameter tuning in an attempt to demonstrate that environmental interest groups and regulators can employ off-the-shelf methods to great effect.
YOLOv5
Our object detection model is the You Only Look Once (YOLO) (Redmon et al., 2016) network, trained on ImageNet and fine-tuned on our single class application dataset. We use Ultralytics implementation of YOLOv5. We use a learning rate of 0.01, momentum 0.937, and weight decay of 0.0005. We ensure the anchor boxes are well-fit to the data before training. The network was trained for 100 epochs.
Faster R-CNN
For Task 2, we use faster R-CNN as a baseline (Ren et al., 2015). We use the Detectron2 implementation (Wu et al., 2019), pretrained on ImageNet and fine tuned on our single class application dataset. The convolutional backbone we use is ResNet-50 (He et al., 2015) with a fully connected faster R-CNN head for object detection. During fine-tuning, we use momentum 0.9, weight decay 0.0001, learning rate 0.000025 with a linear learning rate warm up over the first 1000 iterations. The best model was trained for 10,000 iterations.
5. Results
5.1. Accuracy
Table 1 summarizes the performance statistics across models and tasks. Regarding image classification (Task 1), we find that both object detection methods (YOLOv5 and Faster R-CNN) outperform both of the networks designed specifically with classification in mind. The areas under the precision-recall (PR) and receiver operating characteristic (ROC) curves for YOLOv5 and Faster R-CNN are 0.94, 0.93 and 0.92, 0.92 respectively. This is compared to 0.84 and 0.87 for the Single CNN model, and 0.71 and 0.74 for the dual CNN. Somewhat surprisingly, the dual CNN fairs worse than the single CNN, implying the extra temporal information did not help.
We also report the scores for at a classification threshold of 0.5. We note that the parameter determines how much weight is placed on recall relative to precision. We report all three since environmental interest groups and regulators may weigh objectives differently. For instance, some might prefer to detect as much application as possible (weighting recall higher than precision), while others may want to ensure that field visits or inspections are successful (weighting precision higher than recall). While Faster R-CNN and YOLOv5 have similar scores (0.77 and 0.76 respectively), they differ in the others. Faster R-CNN has an score of 0.88 and score of 0.67, while the performance of YOLOv5 is nearly reversed: 0.68 score and . YOLOv5 thus trades off recall for higher precision relative to Faster R-CNN.
For Task 2 (object detection), the mean average precision (mAP) (equivalent, average precision, since there is a single class) for both object detection methods at an Intersection over Union (IoU) threshold of 0.5 is the same at 0.57. For Task 3 (event detection) both YOLOv5 and Faster R-CNN achieve a AUC of 0.63 on the PR Curve, demonstrating that this task is indeed more difficult than Task 1. We do not give ROC statistics for this task because the number of true negatives is not well-defined.
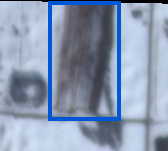
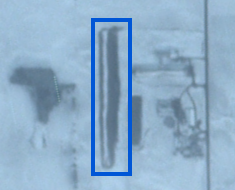
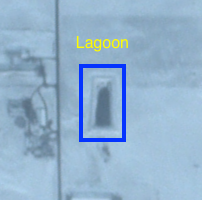
Overall, we find that YOLOv5 and Faster R-CNN perform very similarly, and one can be justified in using either for both Tasks 1 and 2. We use YOLOv5 for the results in the remainder of the paper. Figure 4 gives several example of YOLO’s predictions – three true positives, two false positives, and one false negative (at varying classification thresholds).
5.2. Trends and Outliers
While the previous section lends insight as to how the model performs as a real-time detection mechanism, we are also interested if it can be used to gather insights into application trends over the past few years. Consequently, we run our model over 130 CAFO locations for the 2018, 2019, and 2020 winter seasons that were not in our training or testing sets when developing the model. We restrict our analysis in this section to these unlabeled images to ensure findings are not driven by knowledge of the training data.

Number of events per facility
Figure 5 (left) plots the number of events detected per facility per season. The power law relationship suggests that some facilities are applying at much higher rates than the average. This allows us to identify outliers, which likely pose greater environmental risk: Looking at a facility in the right tail, we find a facility which applied 15 times in Winter 2018, 42 times in Winter 2019, and 16 times in Winter 2020, when the average number of events across all facilities is 5.444We note that while repeated land application is likely a high risk factor, it is also possible that such practices reflect attempts to apply in lower risk conditions (e.g., after snow has melted, in areas distant from waterways). As a policy matter, the results suggest that the permit terms for such a facility may not support to intensity of livestock production, requiring larger manure storage systems, reduction in animal count, or larger land application area. Identifying such outliers using this approach can help to allocate scarce compliance resources where needed most.
Timing of application events
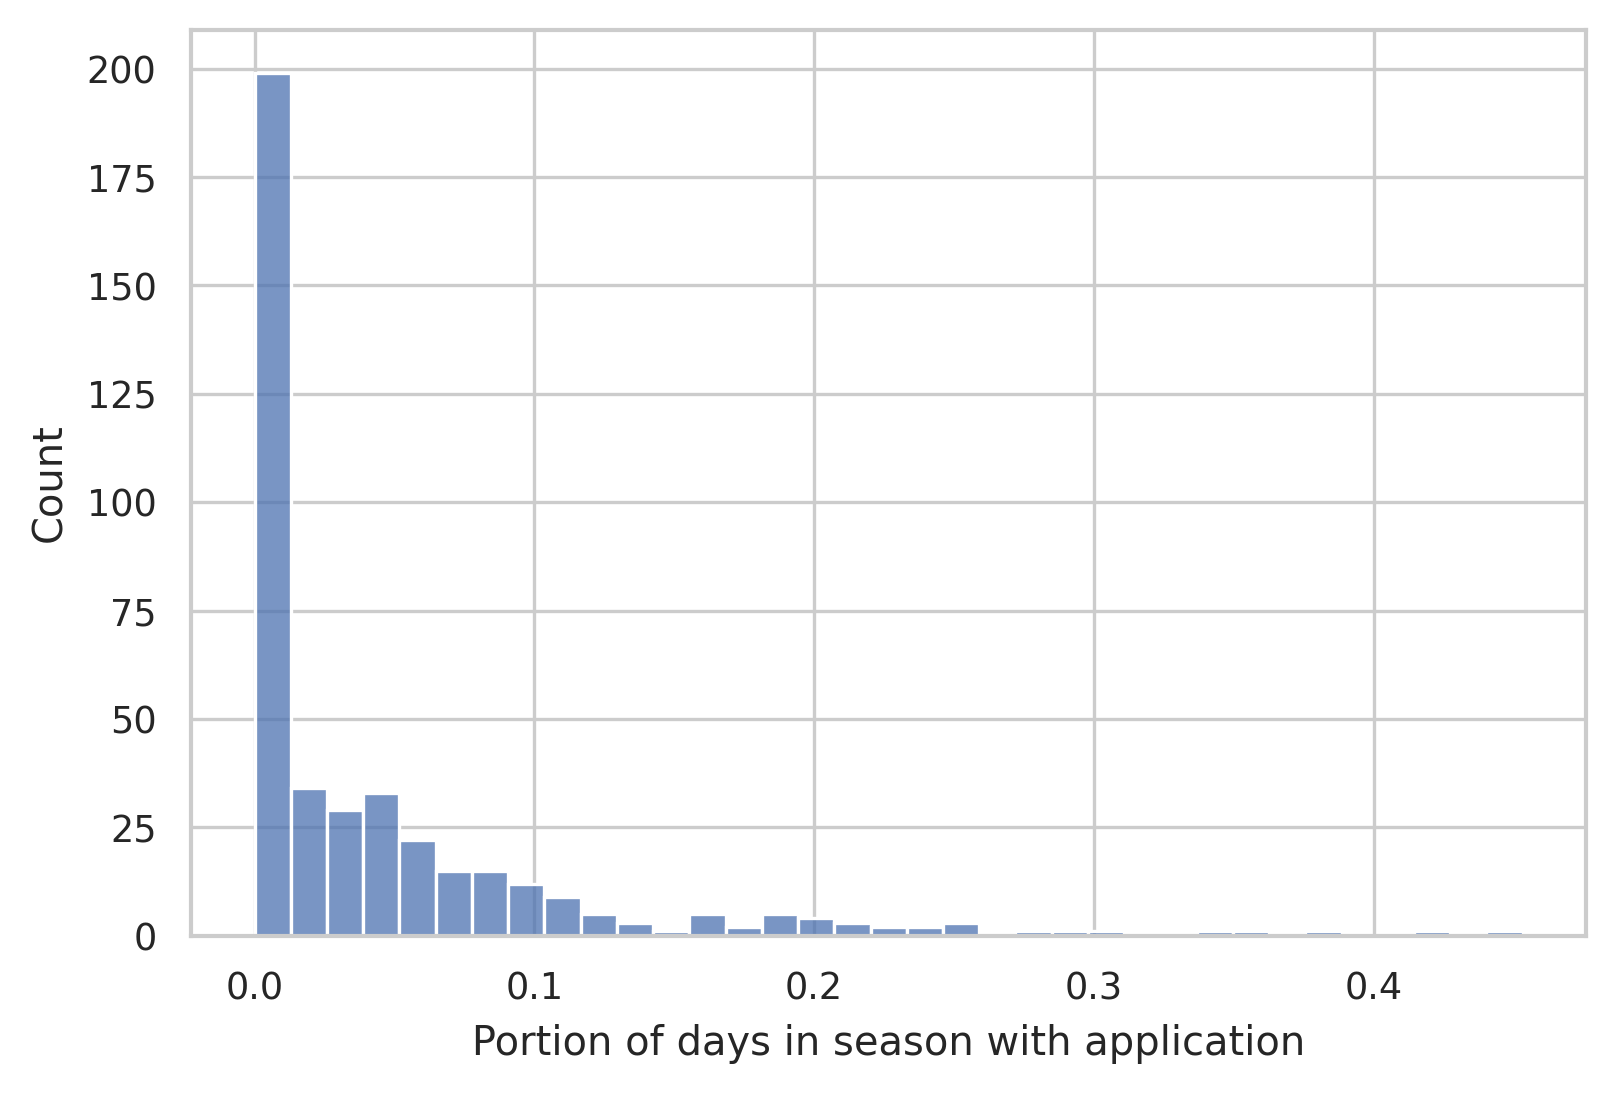
Figure 5 (center) demonstrates how many days after one application event the next event occurs. Interestingly, 30% of applications occur within the first day following a previous application event. In such instances, multiple instances of land application occurred in close proximity, as can be seen in Figure 2. 55% of subsequent events occur within the first week of the first event. If we examine the percentage of the season that will have an application event visible, it is clear that the vast majority of locations spend much of the season without applying. In some locations, however, visible application exists in surrounding fields for 20-45% of the Winter months.
Number of events per month
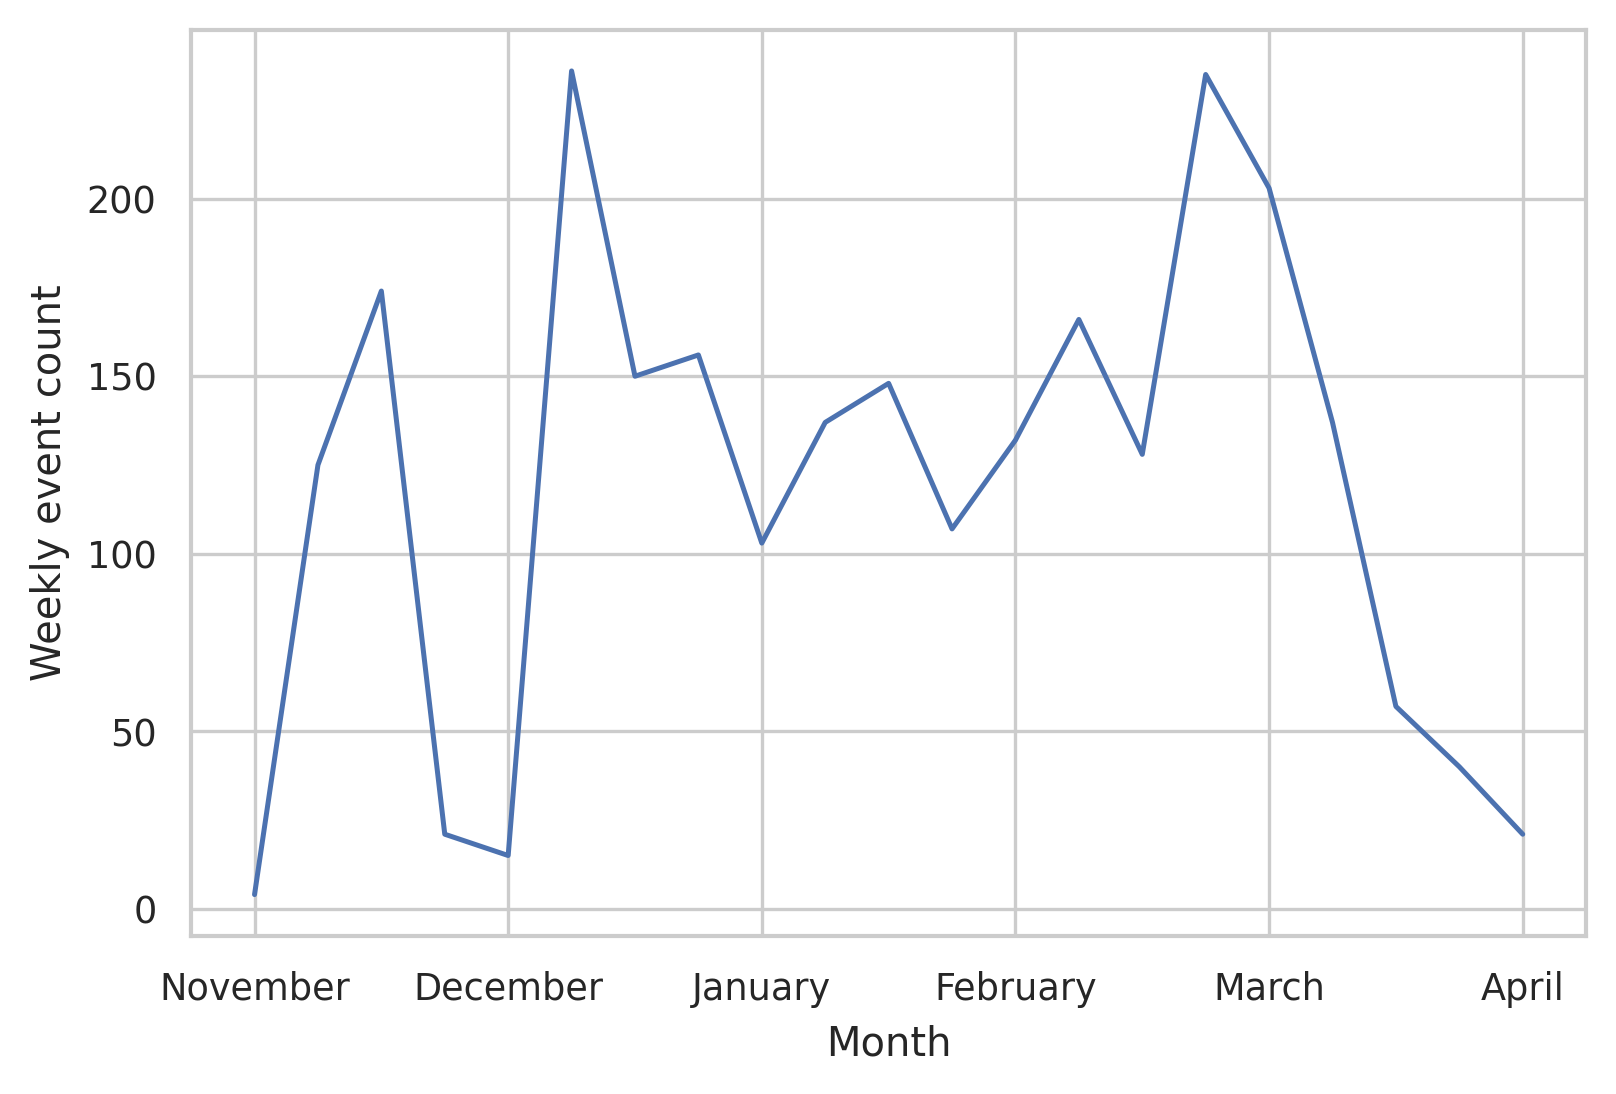
In 2008, Wisconsin introduced the sharp prohibition on winter land application for February-March. We hence assess whether this sharper restriction in fact reduces application rates. Figure 6 (right) plots the time series of land application events, showing that the time series exhibits no reduction in application rates for those months. This suggests that the 2008 restriction, absent stronger enforcement measures, did little to reduce winter land application.
5.3. Prevalence Estimation, February-March 2022
We now use our model to estimate the total number of application events at the 330 CAFO locations in our dataset in February and March 2022. Our dataset restricts us to detecting application within a distance of 500m of each CAFO, and thus our prevalence estimates should be taken as lower bounds on the total amount of application.
To obtain the prevalence estimate we run our model over each location throughout February and March and aggregate the image-level predictions into event predictions as per Section 4. Instead of selecting an arbitrary confidence threshold and tallying the resulting event detections, we take advantage of the gradient of confidence scores to obtain a more reliable estimate. Additionally, this supplies us with more fine-grained insight into the calibration of our model.
We stratify detections according to their confidence in bins , with the detections in having lower confidence than those in . Additionally, we let contain those images with no detections. If we sample items from bin and find true instances of application among those examples, then the estimate for the total prevalence is
| (1) |
i.e., the sum of empirical probabilities multiplied by the size of each bin. The stratification of images by confidence further enables us to examine how the model’s confidences compare to the obtained empirical probabilities.
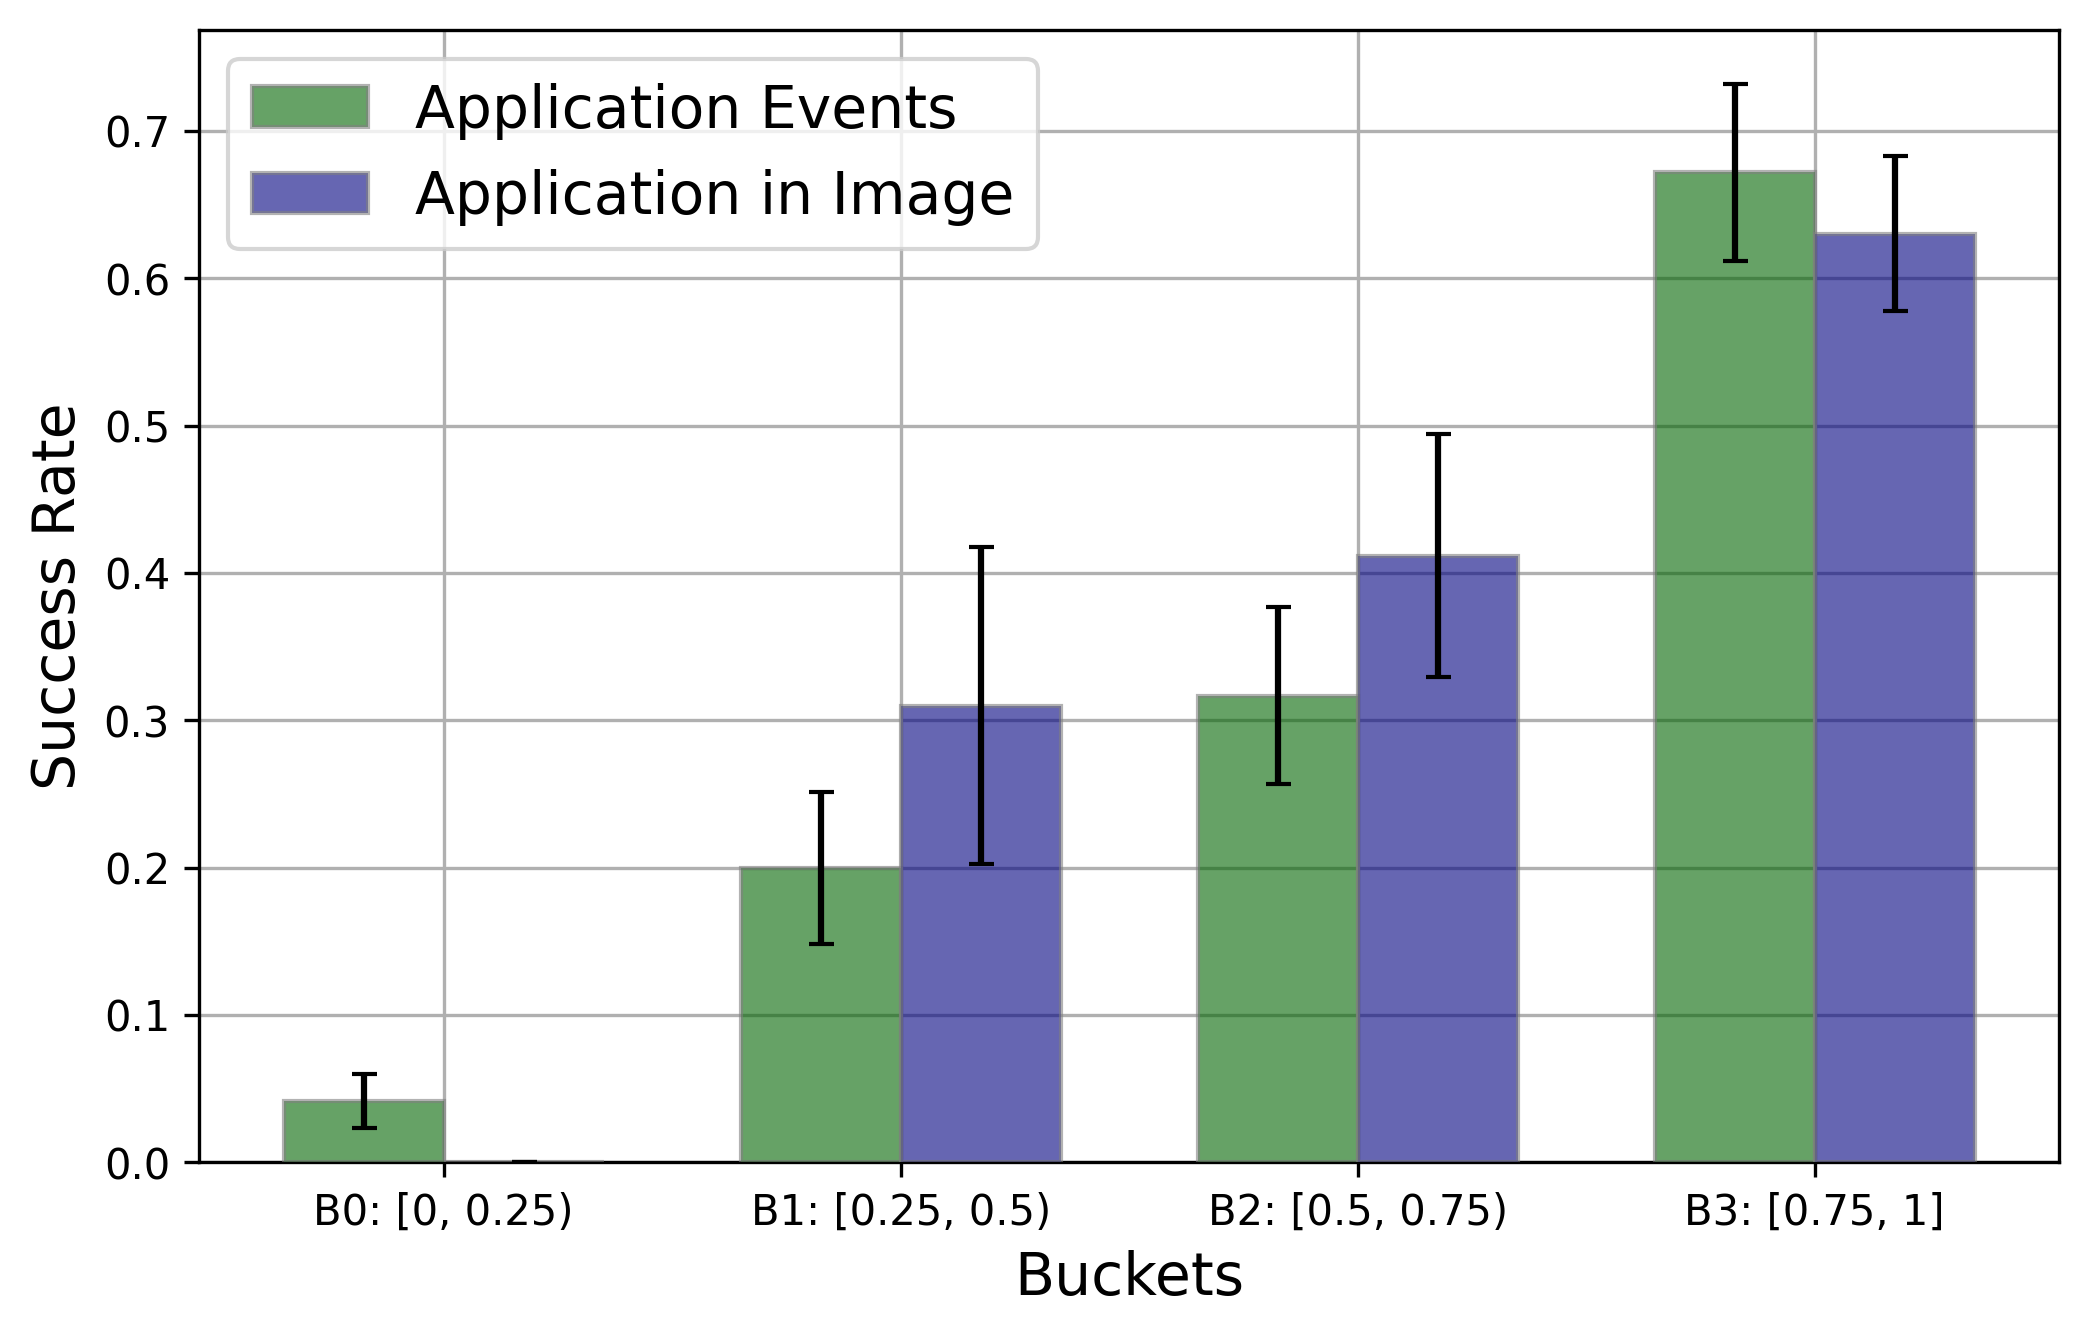
We run the model with a prediction threshold of 0.25, removing all detections with confidence score below this value. We cluster the image level predictions into events and then cluster into four bins: indicating images with no predictions; and , , and indicating predicted events with confidence in , , and , respectively.
We sample 120 times and 60 times each. For each detected event, we check whether it was a true positive (i.e., a true event). To qualify as a true positive, it must (i) overlap with a true event, and (b) be the first detected event to do so. For example, if a true event is 10 days long, the first four days of which are detected as a single event by the model, and the last four as another, the second detected event is not counted as a positive. We also check how many images of the detected event contained application (e.g., image classification accuracy). In the previous example, while the second detected event is not counted as a novel event, all four images contain application.
6. Discussion and Implications
Our findings have substantial implications for environmental regulation.
First, we have found that despite its significant risks and presumptive ban in Wisconsin, the prevalence of winter application of manure is high. It is precisely because such activity has historically been difficult to monitor that it has engendered widespread concerns. Our work should also enable greater scientific study about runoff risks to winter land application, given some existing uncertainties in the evidence base around, for instance, nutrient loss (Srinivasan et al., 2006)
Second, the prevalence of land application does not seem consistent with what is publicly reported about exemptions that facilities can seek from WI DNR. Given the opacity of how such exemptions are administered, there are two potential interpretations. The first is that the rate of granting exemptions is very high, which would suggest that the formal ban does not functionally restrict land application by CAFOs. If so, this suggests much needed reform, such as the expansion of manure storage requirements in permit terms. The second is that many CAFOs may be engaging in land application in violation of their permits. These would be direct violations of the Clean Water Act. Based on qualitative study of annual spreading reports, it appears that there may be significant under-reporting. From a random sample of more than 30 land application events, only 13 had publicly available spreading reports. Of those, only four had reported the event. Either way, our evidence suggests that laxness of enforcement and monitoring has resulted in widespread winter land application, in spite of the nominal presumptive ban in winter months.
Third, one of our aims is to provide information that can readily be used by environmental interest groups or regulators to prioritize scarce resources. Our outputs may be used to develop facility-level risk scores to prioritize field visits and inspections. Currently, the volume of inspections is extremely low: major facilities permitted under the Clean Water Act are required to be visited once every two years; minor facilities are required to be visited once every five years; and in fact, many facilities are never visited at all (Environmental Protection Agency, 2014; Rechtschaffen, 2003). Our model output can hence be exceptionally valuable in risk prioritization. Our detected land application risk can be combined with readily available information about proximity to surface water, size of the CAFO, plant cover, and permit terms to prioritize field visits.
Fourth, the challenges of WI DNR in providing machine readable information about land application self-reports illustrates a broader challenge across government that impedes innovation and accountability: severe fragmentation of data (Engstrom et al., 2020; Government Accountability Office, 2021). Such fragmentation poses severe challenges to the use of machine learning in areas where the social benefits may be large (Glaze et al., 2021). Recent policy proposals have focused on public investments for providing improved, secure, and privacy-protecting access and integrating such administrative datasets (O’Hara, 2018; Ho et al., ming), which would enable far more innovation.
Fifth, methodologically, our study yields interesting implications about the complementarities of human and machine cognition. In training our team to label instances of land application, humans found it exceptionally helpful to be able to examine the time series of images. This makes sense, as it enables humans to determine whether the appearance of a potential land application area was sudden. Our early experiments, such as the dual CNN, focused on enabling a network to draw such intertemporal inferences. Yet our experiments revealed the static computer vision models outperformed models that had access to the time series of imagery. This suggests that object detection models can drastically cut down on the domain expertise humans require for detecting the subtleties of land application events (e.g., the streaks in snow that are indicative of sequential truck driving paths). At the same time, it also suggests that more work can be done to incorporate temporal methods into computer vision models.
7. Limitations
We note several limitations to our approach. First, while our study provides the first image dataset of land application events, it took significant time to train a team of five students and staff researchers to recognize such events in satellite imagery. We relied on environmental experts to provide input, but expert input time was necessarily limited. It remains hard to validate such imagery externally, precisely because there are few other sources of ground truth. As a result, our ground truth imagery may miss some instances of land application, particularly when the application technique may have been distinct from the most common methods,555Ground injection and spray application via hose, for instance, are common techniques that may have other imagery signatures than tractor-drawn spreading. We believe these techniques may be less prevalent in the winter, but our application will still be valuable for the most common land application method. or erroneously classify some instances of land application. We piloted potential human validation by sending environmental interest group volunteers to sites, and will be scaling that in the upcoming winter season to provide more robust external validation. While the dataset may seem small for deep learning, many public sector settings will face such constraints, as physical inspections can be costly. Our application hence demonstrates the utility of transfer learning when labels are necessarily sparse and our approach can also be conceived of as a “weak supervision” approach to generate higher fidelity data when combined with in-person validation.
Second, despite Planet Labs providing near daily imagery, after removing those images which are cropped, obscured by cloud, or have clarity issues, we are left with approximately one image a week. Thus, while our system can indeed act as a real-time monitoring system, its efficacy is dependent on the quality of images received. The need to filter out low quality imagery hence also means that we may have missed a number of land application events. Future work might try to lower the image quality standards so that a wider variety of imagery is useful. That said, the availability of satellite imagery is improving rapidly, both in terms of cadence, spatial resolution, and bands, so our demonstration here is likely to improve going forward.
Third, our application currently only searches for land application in images centered on CAFOs. This choice was made for a number of reasons. One is that there were constraints on the number of images we could label. As such, we chose to focus on the regions near CAFOs, because such regions are the most likely to contain application, thus yielding the highest ratio of positives per image examined. The other is a practical reason to reduce the absolute number of false positives, since the contemplated use case is to prioritize field and inspection visits. As emphasized in Section 5.3, this means we are not catching all application events performed by all 330 CAFOs. That said, one of the main constraints for manure disposal lies in transportation costs, so most land application events are expected to be close to the actual CAFO facility (see Figure 3). It would, however, be possible to expand the search radius based on prior knowledge about the economies of waste transportation.
Fourth, we have used an admittedly simple method to group image-level detections into events. The AUC score of 0.63 for both YOLOv5 and Faster R-CNN suggests that there is room for improvement. While we are currently grouping overlapping bounding boxes across images into an event, more sophisticated methods might take into account the amount of overlap between the boxes and the variance in their scores. In general, a potential avenue for future research would be to more formally develop time series event detection methods to model the information directly. Last, it is worth discussing the potential ethical concerns around the potential for surveillance. We emphasize that our method is a tool for resource allocation to be used in conjunction with humans on the ground. That is, all predictions made the model are validated by humans (which must respect local law, such as access rights, when checking for application). The system augments, but does not substitute for the procedural protections of environmental enforcement. Further mitigating such concerns are the fact that (a) 3m/pixel satellite imagery is only capable of detecting fairly large-scale events, and (b) CAFO operators are already mandated to report land application events. Thus, there is no legitimate claim for privacy with respect to manure application.
8. Conclusion
We have introduced the problem CAFO land-application detection from aerial imagery, a consequential setting at the intersection of regulatory policy and computer vision. Our main contribution is a real-time system for the detection of winter land application by CAFOs using high-cadence, medium resolution satellite imagery. This was used to allocate field inspectors to suspected application sites at the of the 2021/22 Winter season, with plans to be used throughout the 2022/23 season. We also demonstrated our system’s capacity to provide useful retrospective analysis of application events, and detect outlier facilities which apply well above the average. Further, performing stratified sampling of our model predictions, we provide an estimate of 951 application events across 330 CAFO locations in Wisconsin throughout February and March, 2022. Our results suggest that winter land application is pervasive in spite of winter restrictions, but that machine learning coupled with satellite imagery could improve accountability in this environmentally important area.
Acknowledgements.
We thank Hannah Kim for excellent research assistance, Sarfaraz Alam, Brandon Anderson, Katie Garvey, John Klein, Lynn Henning, Rob Michaels, John Petoskey, Christine Tsang, the Socially Responsible Agriculture Project, and the Environmental Law and Policy Center for input, the Environmental Working Group for data, and the Stanford Institute for Economic Policy Research, Stanford Impact Labs, Schmidt Futures, the Chicago Community Trust, the Chicago Community Foundation, and Sarena Snider (Snider Foundation) for supporting this work.References
- (1)
- Bochkovskiy et al. (2020) Alexey Bochkovskiy, Chien-Yao Wang, and Hong-Yuan Mark Liao. 2020. Yolov4: Optimal speed and accuracy of object detection. arXiv preprint arXiv:2004.10934 (2020).
- Bradford et al. (2008) Scott A Bradford, Eran Segal, Wei Zheng, Qiquan Wang, and Stephen R Hutchins. 2008. Reuse of concentrated animal feeding operation wastewater on agricultural lands. Journal of Environmental Quality 37, S5 (2008), S–97.
- Burkholder et al. (2007) JoAnn Burkholder, Bob Libra, Peter Weyer, Susan Heathcote, Dana Kolpin, Peter S Thorne, and Michael Wichman. 2007. Impacts of waste from concentrated animal feeding operations on water quality. Environmental health perspectives 115, 2 (2007), 308–312.
- Cai et al. (2020) Qing Cai, Zhongke Gao, Jianpeng An, Shuang Gao, and Celso Grebogi. 2020. A graph-temporal fused dual-input convolutional neural network for detecting sleep stages from EEG signals. IEEE Transactions on Circuits and Systems II: Express Briefs 68, 2 (2020), 777–781.
- Campagnolo et al. (2002) Enzo R Campagnolo, Kammy R Johnson, Adam Karpati, Carol S Rubin, Dana W Kolpin, Michael T Meyer, J Emilio Esteban, Russell W Currier, Kathleen Smith, Kendall M Thu, et al. 2002. Antimicrobial residues in animal waste and water resources proximal to large-scale swine and poultry feeding operations. Science of the Total Environment 299, 1-3 (2002), 89–95.
- Cheng and Han (2016) Gong Cheng and Junwei Han. 2016. A survey on object detection in optical remote sensing images. ISPRS Journal of Photogrammetry and Remote Sensing 117 (2016), 11–28.
- Choi et al. (2020) Jae Won Choi, Yeon Jin Cho, Seowoo Lee, Jihyuk Lee, Seunghyun Lee, Young Hun Choi, Jung-Eun Cheon, and Ji Young Ha. 2020. Using a dual-input convolutional neural network for automated detection of pediatric supracondylar fracture on conventional radiography. Investigative radiology 55, 2 (2020), 101–110.
- Chollet (2017) François Chollet. 2017. Xception: Deep Learning with Depthwise Separable Convolutions. In 2017 IEEE Conference on Computer Vision and Pattern Recognition (CVPR). 1800–1807. https://doi.org/10.1109/CVPR.2017.195
- Chollet et al. (2015) François Chollet et al. 2015. Keras. https://keras.io.
- Chugg et al. (2021) Ben Chugg, Brandon Anderson, Seiji Eicher, Sandy Lee, and Daniel E Ho. 2021. Enhancing environmental enforcement with near real-time monitoring: Likelihood-based detection of structural expansion of intensive livestock farms. International Journal of Applied Earth Observation and Geoinformation 103 (2021), 102463.
- Church and Kordoni (2022) Kenneth Ward Church and Valia Kordoni. 2022. Emerging Trends: SOTA-Chasing. Natural Language Engineering 28, 2 (2022), 249–269. https://doi.org/10.1017/S1351324922000043
- Dhingra and Kumar (2019) Sakshi Dhingra and Dharminder Kumar. 2019. A review of remotely sensed satellite image classification. International Journal of Electrical & Computer Engineering (2088-8708) 9, 3 (2019).
- Engstrom et al. (2020) David Freeman Engstrom, Daniel E Ho, Catherine M Sharkey, and Mariano-Florentino Cuéllar. 2020. Government by algorithm: Artificial intelligence in federal administrative agencies. Report to the Administrative Conference of the United States (2020).
- Environmental Protection Agency (2014) Environmental Protection Agency. 2014. Clean Water Act National Pollutant Discharge Elimination System Compliance Monitoring Strategy. https://www.epa.gov/sites/default/files/2013-09/documents/npdescms.pdf. [Online, Accessed May 18, 2022].
- Gao and Zhang (2021) Feng Gao and Xiaoyang Zhang. 2021. Mapping crop phenology in near real-time using satellite remote sensing: Challenges and opportunities. Journal of Remote Sensing 2021 (2021).
- Gerba and Smith (2005) Charles P Gerba and James E Smith. 2005. Sources of pathogenic microorganisms and their fate during land application of wastes. Journal of environmental quality 34, 1 (2005), 42–48.
- Glaze et al. (2021) Kurt Glaze, Daniel E Ho, Gerald K Ray, and Christine Tsang. 2021. Artificial Intelligence for Adjudication: The Social Security Administration and AI Governance. (2021).
- Government Accountability Office (2021) Government Accountability Office. 2021. Clean Water Act: EPA Needs to Better Assess and Disclose Quality of Compliance and Enforcement Data.
- Group (2016) Environmental Working Group. 2016. Exposing Fields of Filth. https://www.ewg.org/research/exposing-fields-filth. []Online; Accessed May 11, 2022].
- Gurian-Sherman (2008) Doug Gurian-Sherman. 2008. CAFOs uncovered: The untold costs of confined animal feeding operations. Vol. 1. JSTOR.
- Handan-Nader and Ho (2019) Cassandra Handan-Nader and Daniel E Ho. 2019. Deep learning to map concentrated animal feeding operations. Nature Sustainability 2, 4 (2019), 298–306.
- Handan-Nader et al. (2021) Cassandra Handan-Nader, Daniel E Ho, and Larry Y Liu. 2021. Deep learning with satellite imagery to enhance environmental enforcement. In Data Science Applied to Sustainability Analysis. Elsevier, 205–228.
- Hanselman et al. (2003) Travis A Hanselman, Donald A Graetz, and Ann C Wilkie. 2003. Manure-borne estrogens as potential environmental contaminants: a review. Environmental science & technology 37, 24 (2003), 5471–5478.
- He et al. (2015) Kaiming He, Xiangyu Zhang, Shaoqing Ren, and Jian Sun. 2015. Deep Residual Learning for Image Recognition. arXiv preprint arXiv:1512.03385 (2015).
- Hino et al. (2018) Miyuki Hino, Elinor Benami, and Nina Brooks. 2018. Machine learning for environmental monitoring. Nature Sustainability 1, 10 (2018), 583–588.
- Ho et al. (ming) Daniel E Ho, Jennifer King, Russell C Wald, and Christopher Wan. 2022 (forthcoming). Building a National AI Research Resource. Notre Dame Journal on Emerging Technologies (2022 (forthcoming)).
- Hribar (2010) Carrie Hribar. 2010. Understanding concentrated animal feeding operations and their impact on communities. (2010).
- International Joint Commission (2019) International Joint Commission. 2019. Oversight of Animal Feeding Operations for Manure Management in the Great Lakes Basin. (2019).
- Jerger (2004) Scott Jerger. 2004. EPA’s New CAFO Land Application Requirements: An Exercise in Unsupervised Self-Monitoring. Stan. Envtl. LJ 23 (2004), 91.
- Klausner et al. (1976) S. D. Klausner, P. J. Zwerman, and D. F. Ellis. 1976. Nitrogen and Phosphorus Losses from Winter Disposal of Dairy Manure. Journal of Environmental Quality 5, 1 (1976), 47–49.
- Koch et al. (2021) Bernard Koch, Emily Denton, Alex Hanna, and Jacob Foster. 2021. Reduced, Reused and Recycled: The Life of a Dataset in Machine Learning Research.
- Lewis and Makarewicz (2009) Theodore W Lewis and Joseph C Makarewicz. 2009. Winter application of manure on an agricultural watershed and its impact on downstream nutrient fluxes. Journal of Great Lakes Research 35 (2009), 43–49.
- Liu et al. (2018) Jian Liu, Peter JA Kleinman, Helena Aronsson, Don Flaten, Richard W McDowell, Marianne Bechmann, Douglas B Beegle, Timothy P Robinson, Ray B Bryant, Hongbin Liu, et al. 2018. A review of regulations and guidelines related to winter manure application. Ambio 47, 6 (2018), 657–670.
- Liu et al. (2015) Xueping Liu, Wenfeng Zhang, Yuanan Hu, Erdan Hu, Xiande Xie, Lingling Wang, and Hefa Cheng. 2015. Arsenic pollution of agricultural soils by concentrated animal feeding operations (CAFOs). Chemosphere 119 (2015), 273–281.
- Mallin and Cahoon (2003) Michael A Mallin and Lawrence B Cahoon. 2003. Industrialized animal production—a major source of nutrient and microbial pollution to aquatic ecosystems. Population and Environment 24, 5 (2003), 369–385.
- Mallin et al. (2015) Michael A Mallin, Matthew R McIver, Anna R Robuck, and Amanda Kahn Dickens. 2015. Industrial swine and poultry production causes chronic nutrient and fecal microbial stream pollution. Water, Air, & Soil Pollution 226, 12 (2015), 1–13.
- Maroney et al. (2020) Susan Maroney, MaryJane McCool-Eye, Andrew Fox, and Christopher Burdett. 2020. Using object-based image analysis to map commercial poultry operations from high resolution imagery to support animal health outbreaks and events. Geospatial Health 15, 2 (2020).
- Merkel (2002) M Merkel. 2002. Raising a stink: Air emissions from factory farms. Environmental Integrity Project (2002).
- Mittal (2009) Anu Mittal. 2009. Concentrated animal feeding operations: EPA needs more information and a clearly defined strategy to protect air and water quality from pollutants of concern. DIANE Publishing.
- Montefiore et al. (2022) Lise R Montefiore, Natalie G Nelson, Amanda Dean, and Mahmoud Sharara. 2022. Reconstructing the historical expansion of industrial swine production from Landsat imagery. Scientific reports 12, 1 (2022), 1–12.
- Nachman et al. (2005) Keeve E Nachman, Jay P Graham, Lance B Price, and Ellen K Silbergeld. 2005. Arsenic: a roadblock to potential animal waste management solutions. Environmental Health Perspectives 113, 9 (2005), 1123–1124.
- O’Hara (2018) Amy O’Hara. 2018. US Data Access and the Commission for Evidence-based Policymaking. International Journal of Population Data Science 3, 4 (2018).
- Patyk et al. (2020) Kelly A Patyk, Mary J McCool-Eye, David D South, Christopher L Burdett, Susan A Maroney, Andrew Fox, Grace Kuiper, and Sheryl Magzamen. 2020. Modelling the domestic poultry population in the United States: A novel approach leveraging remote sensing and synthetic data methods. Geospatial Health 15, 2 (2020).
- Raji et al. (2021) Inioluwa Deborah Raji, Emily M Bender, Amandalynne Paullada, Emily Denton, and Alex Hanna. 2021. AI and the everything in the whole wide world benchmark. arXiv preprint arXiv:2111.15366 (2021).
- Raman et al. (2004) D Raj Raman, Elizabeth L Williams, Alice C Layton, Robert T Burns, James P Easter, Adam S Daugherty, Michael D Mullen, and Gary S Sayler. 2004. Estrogen content of dairy and swine wastes. Environmental Science & Technology 38, 13 (2004), 3567–3573.
- Rechtschaffen (2003) Clifford Rechtschaffen. 2003. Enforcing the Clean Water Act in the twenty-first century: Harnessing the power of the public spotlight. Ala. L. Rev. 55 (2003), 775.
- Redmon et al. (2016) Joseph Redmon, Santosh Divvala, Ross Girshick, and Ali Farhadi. 2016. You only look once: Unified, real-time object detection. In Proceedings of the IEEE conference on computer vision and pattern recognition. 779–788.
- Redmon and Farhadi (2018) Joseph Redmon and Ali Farhadi. 2018. Yolov3: An incremental improvement. arXiv preprint arXiv:1804.02767 (2018).
- Ren et al. (2015) Shaoqing Ren, Kaiming He, Ross Girshick, and Jian Sun. 2015. Faster r-cnn: Towards real-time object detection with region proposal networks. Advances in neural information processing systems 28 (2015).
- Repala and Dubey (2019) Vamshi Krishna Repala and Shiv Ram Dubey. 2019. Dual cnn models for unsupervised monocular depth estimation. In International Conference on Pattern Recognition and Machine Intelligence. Springer, 209–217.
- Robinson et al. (2022) Caleb Robinson, Ben Chugg, Brandon Anderson, Juan M Lavista Ferres, and Daniel E Ho. 2022. Mapping industrial poultry operations at scale with deep learning and aerial imagery. IEEE Journal of Selected Topics in Applied Earth Observations and Remote Sensing (2022).
- Robinson et al. (2021) Caleb Robinson, Anthony Ortiz, Juan M Lavista Ferres, Brandon Anderson, and Daniel E Ho. 2021. Temporal cluster matching for change detection of structures from satellite imagery. In ACM SIGCAS Conference on Computing and Sustainable Societies. 138–146.
- Sambasivan et al. (2021) Nithya Sambasivan, Shivani Kapania, Hannah Highfill, Diana Akrong, Praveen Paritosh, and Lora M Aroyo. 2021. “Everyone Wants to Do the Model Work, Not the Data Work”: Data Cascades in High-Stakes AI. In Proceedings of the 2021 CHI Conference on Human Factors in Computing Systems (Yokohama, Japan) (CHI ’21). Association for Computing Machinery, New York, NY, USA, Article 39, 15 pages. https://doi.org/10.1145/3411764.3445518
- Srinivasan et al. (2006) MS Srinivasan, Ray B Bryant, Michael P Callahan, and Jennifer L Weld. 2006. Manure management and nutrient loss under winter conditions: A literature review. Journal of soil and water conservation 61, 4 (2006), 200–209.
- Team (2017) Planet Team. 2017. Planet Application Program Interface: In Space for Life on Earth. https://api.planet.com.
- Tilon et al. (2020) Sofia Tilon, Francesco Nex, Norman Kerle, and George Vosselman. 2020. Post-disaster building damage detection from earth observation imagery using unsupervised and transferable anomaly detecting generative adversarial networks. Remote sensing 12, 24 (2020), 4193.
- USEPA (2003) USEPA. 2003. National Pollutant Discharge Elimination System permit regulation and effluent limitation guidelines and standards for concentrated animal feeding operations (CAFOs); final rule. Fed. Regist. 68, 29 (2003), 7176–7274.
- Verbesselt et al. (2012) Jan Verbesselt, Achim Zeileis, and Martin Herold. 2012. Near real-time disturbance detection using satellite image time series. Remote Sensing of Environment 123 (2012), 98–108.
- Vlaminck et al. (2022) Michiel Vlaminck, Rugen Heidbuchel, Wilfried Philips, and Hiep Luong. 2022. Region-Based CNN for Anomaly Detection in PV Power Plants Using Aerial Imagery. Sensors 22, 3 (2022), 1244.
- Wagstaff (2012) Kiri Wagstaff. 2012. Machine learning that matters. arXiv preprint arXiv:1206.4656 (2012).
- Williams et al. (2011) Mark R Williams, Gary W Feyereisen, Douglas B Beegle, Robert D Shannon, Gordon J Folmar, and Ray B Bryant. 2011. Manure application under winter conditions: Nutrient runoff and leaching losses. Transactions of the ASABE 54, 3 (2011), 891–899.
- Wu et al. (2019) Yuxin Wu, Alexander Kirillov, Francisco Massa, Wan-Yen Lo, and Ross Girshick. 2019. Detectron2. https://github.com/facebookresearch/detectron2.
- Yu et al. (2005) Liyang Yu, Neng Wang, and Xiaoqiao Meng. 2005. Real-time forest fire detection with wireless sensor networks. In Proceedings. 2005 International Conference on Wireless Communications, Networking and Mobile Computing, 2005., Vol. 2. Ieee, 1214–1217.