Optical spectroscopy of the extremely metal-deficient star-forming galaxy HSC J1631+4426: a test of the strong-line method
Abstract
Recently, Kojima and co-authors have reported a record low oxygen abundance, 12 + logO/H = 6.90 0.03, or 1.6% of solar metallicity, in the low-mass star-forming galaxy HSC J16314426. This exceptionally low oxygen abundance was obtained by the direct method, using the [O iii]4363Å emission line. However, using the strong-line method by Izotov et al. (2019b), these authors have derived a significantly higher metallicity 12 + logO/H = 7.175 0.005. To clarify the situation, we have obtained new observations of HSC J16314426 with the Large Binocular Telescope (LBT)/Multi-Object Dual Spectrograph (MODS). We have derived a higher oxygen abundance, 12 + logO/H = 7.14 0.03, using the direct method, a value similar to the oxygen abundance obtained by the strong-line method. Thus, HSC J16314426 has a metallicity close to that of the well known blue compact dwarf galaxy I Zw 18.
keywords:
galaxies: dwarf – galaxies: starburst – galaxies: ISM – galaxies: abundances.1 Introduction
Extremely metal-deficient (XMD) galaxies with active star formation constitute a rare and intriguing class of objects in the local Universe. We shall define here XMD galaxies as those having oxygen abundances 12 + logO/H 7.3, or 4% solar, taking the solar value to be 8.7 (Asplund et al., 2009). Despite the fact that these low- XMD galaxies have a gaseous content that is not quite as pristine as that of primordial galaxies, they do represent their best local counterparts and thus, can be used to compare with the high- primeval objects to be observed in the near-future by the James Webb Space Telescope (JWST) and the 30 m-class ground-based telescopes.
In the last few years, a number of nearby galaxies have been discovered with extremely low oxygen abundances 12 + logO/H 7.0 (or 2% solar). Thus, Hirschauer et al. (2016) have found 12 + logO/H = 7.02 0.03 for the galaxy AGC 198691, and the value of 7.13 0.08 has been derived by Hsyu et al. (2017) for the dwarf galaxy Little Cub. Izotov et al. (2018), Izotov et al. (2019a) and Izotov et al. (2021) have reported 12 + logO/H = 6.98 0.02, 7.035 0.026 and 7.085 0.031 for the galaxies J08114730, J12343901 and J22292725, respectively. Recently, Kojima et al. (2020) have derived a record low oxygen abundance of 6.90 0.03 in the XMD galaxy HSC J1631+4426.


Oxygen abundances in all these compact galaxies have been derived for the entire galaxy. On the other hand, there have also been cases where extremely low oxygen abundances have been derived for individual H ii regions in the same galaxy. Thus, oxygen abundances of 7.01 0.07, 6.98 0.06, 6.86 0.14 have been determined in three H ii regions of the XMD blue compact dwarf SBS 0335–052W (Izotov et al., 2009), while 6.96 0.09 has been found for one of the H ii regions in the dwarf irregular galaxy DDO 68 (Annibali et al., 2019).
The most reliable method for abundance determination is the so-called “direct method”. It requires the detection, with good accuracy, of the [O iii]4363 emission line which plays the role of an electron temperature indicator. For star-forming galaxies with a weak or undetected [O iii]4363 emission line, “strong-line methods” are used. As proposed originally by Pagel et al. (1979), these methods are based on combinations of strong emission-line intensities of various elements. The oxygen abundance indicator R23 = ([O iii]4959+5007 + [O ii]3727)/H suggested by Pagel et al. (1979) has met with widespread acceptance and use.
For the strong-line method, grids of photoionization models have been used to calibrate the relation between the line intensities of strong oxygen lines and the oxygen abundance. However, different models by different authors give divergent calibrations, so it is best to base the calibration on oxygen abundances derived from observations through the direct method. The earliest calibrations were one-dimensional (e.g., Edmunds & Pagel, 1984; McCall et al., 1985; Dopita & Evans, 1986), i.e., the oxygen abundance depends on an unique parameter, R23.
Further development in reducing the scatter and improving the accuracy of the strong-line method is to introduce a correction for the ionization state of H ii regions. Indeed, as pointed out by McGaugh (1991), the intensities of the oxygen emission lines depend not only on the metallicity of the H ii region, but also on its ionization state, which can be parameterized by the ratio O32 = [O iii]5007/[O ii]3727. This ratio is the observational proxy of the ionization parameter .
Many two-dimensional calibrations (the oxygen abundance depends on R23 and O32 or a parameter similar to O32) were derived for application to galaxies in a wide range of metallicities, typically at oxygen abundances 12 + log O/H 7.4 and O32 5, and often at the expense of the accuracy in the abundance determination at the lowest metallicities and high O32 (e.g., Pilyugin & Thuan, 2005; Nagao et al., 2006). Recently, Izotov et al. (2021) have proposed an improved modification of the empirical strong-line calibration by Izotov et al. (2019b), focussed on the oxygen abundance determination in very metal-poor galaxies, those in the XMD class with 12 + log O/H 7.3. It is found that all the XMD galaxies discussed above follow closely the statistical relation between oxygen abundance and strong line ratios, as derived by Izotov et al. (2021). There is nevertheless a striking exception, concerning the star-forming galaxy HSC J16314426 (Kojima et al., 2020). With its oxygen abundance of 6.90 0.03 derived by the direct method, it strongly deviates from the strong-line relation. On the other hand, Kojima et al. (2020, 2021) using the strong-line method by Izotov et al. (2019b), derived a much higher oxygen abundance of 7.175 0.005.
As the XMD galaxy HSC J16314426 has the lowest oxygen abundance ever reported for a star-forming object, it is crucial to resolve any possible inconsistency between the oxygen abundances derived by the direct and strong-line methods, especially when these are applied in the most extreme metallicity regime. To this end, we have obtained new spectroscopic observations of that galaxy with the LBT to detect the [O iii]4363 emission line with a high signal-to-noise ratio, use the direct method to derive an accurate oxygen abundance, and compare its value with the one derived by the strong-line method.
2 Observations and data reduction
We have obtained LBT long-slit spectrophotometric observations of HSC J16314426 on 1 May, 2022 in the twin binocular mode, using the MODS1 and MODS2 spectrographs. Spectra were obtained in the wavelength range 3200 – 10000Å with a 1.2 arcsec wide slit, resulting in a resolving power 2000. The seeing during the observations was 0.6 arcsec.
Eight subexposures of approximately 900 s were obtained in both the blue and red ranges separately with MODS1 and MODS2, resulting in a total exposure time of 14048 s in the blue range and of 12252 s in the red range, counting separate exposures with both spectrographs. The airmass during observations was small, equal to 1.05. Thus, the effect of atmospheric refraction is small for all subexposures (see Filippenko, 1982).
The spectrum of the spectrophotometric standard star BD+33 2642 was obtained with a 5 arcsec wide slit during the same night, for flux calibration and correction for telluric absorption in the red part.
Bias subtraction, flat field correction, wavelength and flux calibration were done with the MODS Basic CCD Reduction package modsccdred (Pogge, 2019) and iraf. After these reduction steps, MODS1 and MODS2 subexposures were co-added and one-dimensional spectra of HSC J16314426 in the blue and red ranges were extracted in a 1.2 arcsec aperture along the spatial axis. These spectra exhibit intense emission lines, including a strong [O iii]4363 emission line (see Fig. 1 and insets therein).
3 Heavy element abundances
The observed emission-line fluxes and their errors were measured using the iraf splot routine. They were corrected for extinction and underlying hydrogen stellar absorption, derived iteratively from the observed decrement of the hydrogen Balmer emission lines, following Izotov, Thuan & Lipovetsky (1994). In our iterative procedure, the equivalent widths of the underlying stellar Balmer absorption lines are assumed to be the same for all transitions. The extinction-corrected fluxes together with the extinction coefficient (H), the observed H emission-line flux (H), its rest-frame equivalent width EW(H), and the equivalent width of the Balmer absorption lines are shown in Table 1.
In the Table, we have also given similar data obtained by Kojima et al. (2021) for their spectrum of HSC J16314426. Comparison between the two sets of fluxes shows that there is general good agreement for the strong lines. For example, the flux differences in the [O iii]4959, 5007 lines are 5–8 per cent. The fluxes of all other lines are in agreement within the 1 errors. Exceptions are the H/H flux ratio of Kojima et al. (2021) which is lower than the recombination value, and their higher [O ii]3727 (by about 20 per cent), probably due to their adopted higher extinction. Most relevant to this work, our flux of the [O iii]4363 emission line is 30 per cent smaller than the one obtained by Kojima et al. (2021). This smaller flux value will have important consequences on the derived direct-method oxygen abundance.
| Line | HSC J16314426 | |
|---|---|---|
| this paper | Kojima et al. (2021) | |
| 3727.00 [O ii] | 46.341.69 | 50.122.66 |
| 3750.15 H12 | 4.191.28 | … |
| 3770.63 H11 | 6.221.08 | … |
| 3797.90 H10 | 6.341.00 | … |
| 3835.39 H9 | 8.650.84 | 4.681.17 |
| 3868.76 [Ne iii] | 15.890.75 | 21.731.11 |
| 3889.00 He i+H8 | 21.840.95 | … |
| 3968.00 [Ne iii]+H7 | 21.320.91 | 20.030.87 |
| 4101.74 H | 27.371.01 | 27.530.65 |
| 4340.47 H | 48.341.54 | 46.880.50 |
| 4363.21 [O iii] | 6.100.38 | 8.180.48 |
| 4471.48 He i | 3.250.37 | … |
| 4686.00 He ii | 1.490.29 | 2.320.38 |
| 4711.00 [Ar iv]+He i | 1.330.29 | 0.35 |
| 4740.00 [Ar iv] | 0.600.26 | 0.36 |
| 4861.33 H | 100.003.01 | 100.000.37 |
| 4921.93 He i | 1.230.29 | … |
| 4958.92 [O iii] | 59.521.81 | 55.760.34 |
| 4986.00 [Fe iii] | 1.300.36 | … |
| 5006.80 [O iii] | 176.395.24 | 170.920.38 |
| 5015.68 He i | 1.550.31 | … |
| 5875.60 He i | 9.240.60 | 9.120.60 |
| 6300.00 [O i] | 1.360.40 | … |
| 6312.00 [S iii] | 0.960.36 | 0.55 |
| 6562.80 H | 274.988.75 | 229.461.00 |
| 6583.40 [N ii] | 1.040.47 | 0.48 |
| 6678.10 He i | 2.620.52 | 2.070.59 |
| 6716.40 [S ii] | 4.170.55 | … |
| 6730.80 [S ii] | 3.000.52 | … |
| 7065.30 He i | 1.650.57 | … |
| 7135.80 [Ar iii] | 0.830.46 | … |
| 7320.00 [O ii] | 0.580.43 | 0.48 |
| 7330.00 [O ii] | 0.870.43 | 0.54 |
| 8750.47 P12 | 0.760.19 | … |
| 8862.79 P11 | 1.720.37 | … |
| 9014.91 P11 | 2.010.43 | … |
| 9069.00 [S iii] | 3.530.68 | … |
| 9530.60 [S iii] | 6.861.18 | … |
| (H)† | 0.1450.038 | 0.280.04 |
| (H)‡ | 3.850.03 | 1.310.04 |
| EW(H)∗∗ | 155.31.0 | 123.53.2 |
| EW(abs)∗∗ | 1.80.2 | … |
Notes: ∗in units 100/(H). †Extinction coefficient, derived from the observed hydrogen Balmer decrement. ‡Observed flux in units of 10-16 erg s-1 cm-2. ∗∗Equivalent width in Å.
| Property | HSC J16314426 | |
|---|---|---|
| this paper | Kojima et al. (2021) | |
| (O iii), K | 20300800 | 255701100 |
| (O ii), K | 15600600 | … |
| (S iii), K | 18900700 | … |
| (S ii), cm-3 | 30220 | … |
| O+/H+105 | 0.3720.038 | … |
| O2+/H+105 | 0.9810.093 | … |
| O3+/H+106 | 0.2320.067 | |
| O/H105 | 1.3760.100 | … |
| 12+log(O/H) | 7.1390.032 | 6.900.03 |
| N+/H+107 | 0.7060.025 | … |
| ICF(N) | 3.654 | … |
| N/H107 | 2.5790.921 | … |
| log(N/O) | 1.7270.158 | 1.710 |
| Ne2+/H+106 | 1.9470.188 | … |
| ICF(Ne) | 1.121 | … |
| Ne/H106 | 2.1830.264 | … |
| log(Ne/O) | 0.8030.060 | 0.6410.020 |
| S+/H+107 | 0.6430.077 | … |
| S2+/H+107 | 2.5610.967 | … |
| ICF(S) | 1.140 | … |
| S/H107 | 3.6531.109 | … |
| log(S/O) | 1.5760.136 | … |
| Ar2+/H+107 | 0.2290.125 | … |
| ICF(Ar) | 1.0999 | … |
| Ar/H107 | 0.2510.200 | … |
| log(Ar/O) | 2.7390.347 | … |
| Fe2+/H+106 | 0.2230.064 | … |
| ICF(Fe) | 4.9962 | … |
| Fe/H106 | 1.1130.321 | … |
| log(Fe/O) | 1.0920.125 | 1.2460.220 |
We follow the prescriptions of Izotov et al. (2006) to derive the electron temperature and density and heavy element abundances from extinction-corrected fluxes of emission lines in HSC J16314426. The electron temperature (O iii) is calculated from the [O iii]4363/(4959 + 5007) emission-line flux ratio. It is used to derive the abundances of O2+, O3+ and Ne2+. The abundances of O+, N+, S+ and Fe2+ are derived with the electron temperature (O ii), using the relations of Izotov et al. (2006) between (O ii) and (O iii). To derive abundances of S2+ and Ar2+ we adopt the relation between (S iii) and (O iii) by Izotov et al. (2006). The electron number density was derived from the [S ii]6717/6731 flux ratio. The electron temperatures (O iii), (O ii) and (S iii), and the electron number density (S ii) are shown in Table 2. We obtain an electron temperature (O iii) = 20300 800K, compared to the exceptionally high electron temperature (O iii) = 25570 1100K obtained by Kojima et al. (2020).
The ionic abundances, ionisation correction factors (s) and total O, N, Ne, S, Ar and Fe abundances are obtained using relations by Izotov et al. (2006). Using the direct method, we derive 12 + logO/H = 7.139 0.032 for HSC J16314426 (Table 2), significantly higher than the oxygen abundance 12 + logO/H = 6.90 0.03 obtained by Kojima et al. (2020, 2021). The N/O, Ne/O, S/O, Ar/O and Fe/O abundance ratios are similar to those in other star-forming dwarf galaxies.
To derive element abundances, we have used the prescriptions of Izotov et al. (2006) as they are based on fairly recent atomic data and photoionization models. We have compared our results with those obtained by using relations based on other models. There is nearly complete agreement between our results and those obtained with the Stasińska (1990) relations. For HSC J16314426, the difference in the electron temperature (O ii) would be only 25K, thus giving the same oxygen abundance. Kojima et al. (2020) used the empirical relation (O ii) = 0.7 (O iii) + 3000 of Campbell et al. (1986). With our derived (O iii) = 20300K, the latter relation would give (O ii) = 17210K. Then 12 + logO/H = 7.11, compared to 7.14 derived with the Izotov et al. (2006) relations.
In summary, the difference between the oxygen abundances of HSC J16314426 derived by Kojima et al. (2020) and our group comes almost solely from the flux difference measured for the [O iii]4363 emission line, and not from the particular relation used to derive (O ii). Because our measured [O iii]4363 flux is 30 per cent smaller than that of their group, our derived temperature is lower, and our oxygen abundance is higher.
Since there is a discrepancy between the [O iii]4363 fluxes measured by our two groups, we need to estimate the oxygen abundances in HSC J16314426 in another way, distinct from the direct method. We next discuss oxygen abundances derived by the strong-line method in XMD star-forming galaxies.
4 Strong-line method for oxygen abundance determination in XMD galaxies
The direct method is by far the most accurate method to determine oxygen abundances. However, in the case of galaxies with an undetected [O iii]4363 line, to determine oxygen abundances, one has to appeal to strong-line (or indirect) methods based on the fluxes of some of the brightest lines in the spectra of actively star-forming galaxies. The parameter R23 = ([O iii]4959+5007 + [O ii]3727)/H is often used. Nonetheless, even using only data with [O iii]4363Å measured with an accuracy better than 25% to calibrate the relation, there remains a rather large scatter in the relation 12 + logO/H vs. R23.
The next significant step in improving the accuracy of the indirect method for oxygen abundance determination is the introduction of a correction for the ionization state of H ii regions, as discussed by McGaugh (1991). That correction can be quantified by the line flux ratio O32 = [O iii]5007/[O ii]3727. The use of an ionization correction does indeed reduce the scatter in the relation by a factor of 2 (Izotov et al., 2019b). Calibrations of the strong-line method have been performed by many authors over the years (e.g., Pilyugin, 2000; Pilyugin & Thuan, 2005; Kewley & Dopita, 2002; Nagao et al., 2006; Curti et al., 2017).
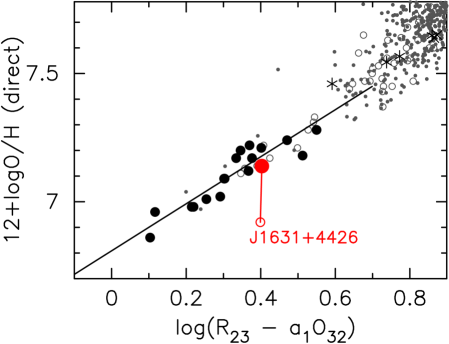
One of the most recent calibrations is that of Izotov et al. (2021) who derive a new empirical relation for the strong-line method, specifically tailored for XMD galaxies. It has the form 12 + logO/H = 0.950 log(R23 – 1 O32) + 6.805, where 1 = 0.080 – 0.00078 O32. The scatter of the data points about this relation, which gives an idea of the abundance uncertainties, is 0.07 dex (Fig. 2).
We now discuss the oxygen abundance of HSC J16314426, for which we present new observations here. If the oxygen abundance 12 + logO/H = 6.90 0.03 of Kojima et al. (2020), derived by the direct method, is used, then the galaxy is strongly deviant from the mean 12 + logO/H vs. log(R23 – 1 O32) relation (open red circle in Fig. 2). However the agreement is considerably better if the value derived by the direct method from our LBT observations, 12 + logO/H = 7.14 0.03, is adopted (filled red circle in Fig. 2). We note that the latter oxygen abundance is nearly the same as the values of 7.18 and 7.14 obtained respectively by using the strong-line calibration for XMD galaxies of Izotov et al. (2021), and the strong-line method of Pilyugin (2000) ( is a quantity related to O32).
The good agreement between the oxygen abundances derived by the direct and indirect methods gives us confidence both in the accuracy of our direct method of oxygen abundance determination and in the reliability of the strong-line method. If our measurement 12 + logO/H = 7.14 0.03 is correct, then the metallicity of HSC J16314426 is close to that of the well-known blue compact dwarf galaxy I Zw 18. The fact that intensive many-decades long searches for XMD star-forming galaxies have uncovered no object with a metallicity below 12 + logO/H 7.0, either in the ionized gas or neutral gas component (e.g. Thuan, Lecavelier des Etangs & Izotov, 2005) suggests a previous enrichment of the primordial gas to that oxygen abundance level, perhaps by Population III stars. This suggestion is supported by observations of Ly absorbers which show similar oxygen abundances, 12 + logO/H 7.0.
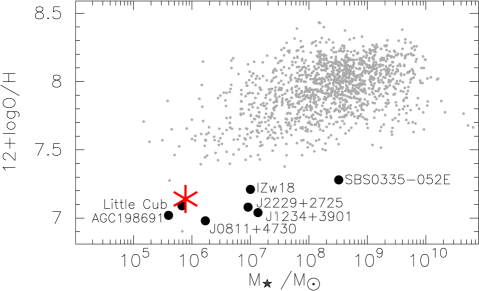
Fig. 3 displays the position of HSC J16314426 in the 12 + logO/H vs. plane for XMD galaxIes. The Figure shows that HSC J16314426 has properties similar to that of other XMD galaxies.
5 Summary
We have carried out spectroscopic observations of the low-mass star-forming galaxy HSC J16314426 with the Large Binocular Telescope (LBT)/Multi-Object Dual Spectrograph (MODS). Kojima et al. (2020) have reported a record lowest oxygen abundance 12 + logO/H = 6.90 0.03 for this galaxy, using the direct method. However, this value is considerably smaller than the one derived by the indirect strong-line method.
From our new observations, we have obtained a higher oxygen abundance, 12 + logO/H = 7.14 0.03 for HSC J16314426, using the direct method. This value is also the same as the one obtained by the strong-line method, suggesting it is likely to be the correct one.
Acknowledgements
N.G.G. and Y.I.I. acknowledge support from the National Academy of Sciences of Ukraine by its priority project No. 0122U002259. “Fundamental properties of the matter and its manifestation in micro world, astrophysics and cosmology”. The Large Binocular Telescope (LBT) is an international collaboration among institutions in the United States, Italy and Germany. This paper used data obtained with the LBT/MODS spectrographs built with funding from National Science Foundation (NSF) grant AST-9987045 and the NSF Telescope System Instrumentation Program (TSIP), with additional funds from the Ohio Board of Regents and the Ohio State University Office of Research. iraf is distributed by the National Optical Astronomy Observatories, which are operated by the Association of Universities for Research in Astronomy, Inc., under cooperative agreement with the National Science Foundation.
Data availability
The data underlying this article will be shared on reasonable request to the corresponding author.
References
- Annibali et al. (2019) Annibali F. et al., 2019, MNRAS, 482, 3892
- Asplund et al. (2009) Asplund M., Grevesse N., Sauval A. J., 2009, Ann.Rev.Astron.Astrophys., 47, 481
- Campbell et al. (1986) Campbell A., Terlevich R., Melnick J., 1986, MNRAS, 223, 811
- Curti et al. (2017) Curti M., Cresci G., Mannucci F., Marconi A., Maiolino R., Esposito S., 2017, MNRAS, 465, 1384
- Dopita & Evans (1986) Dopita M. A., Evans I. N., 1986, ApJ, 311, 45
- Edmunds & Pagel (1984) Edmunds M. S., Pagel B. E.J., 1984, MNRAS, 211, 507
- Filippenko (1982) Filippenko A. V., 1982, PASP, 94, 715
- Hirschauer et al. (2016) Hirschauer A. S. et al., 2016, ApJ, 822, 108
- Hsyu et al. (2017) Hsyu T., Cooke R. J., Prochaska J. X., Bolte M., 2017, ApJ, 845, L22
- Izotov et al. (1994) Izotov Y. I., Thuan T. X., Lipovetsky V. A., 1994, ApJ, 435, 647
- Izotov et al. (2006) Izotov Y. I., Stasińska G., Meynet G., Guseva N. G., Thuan T. X., 2006, A&A, 448, 955
- Izotov et al. (2009) Izotov Y. I., Guseva N. G., Fricke K. J., Papaderos P., 2009, A&A, 503, 61
- Izotov et al. (2018) Izotov Y. I., Thuan T. X., Guseva N. G., Liss S. E., 2018, MNRAS, 473, 1956
- Izotov et al. (2019a) Izotov Y. I., Thuan T. X., Guseva N. G., 2019a, MNRAS, 483, 5491
- Izotov et al. (2019b) Izotov Y. I., Guseva N. G., Fricke K. J., Henkel C., 2019b, A&A, 623, 40
- Izotov et al. (2021) Izotov Y. I., Thuan T. X., Guseva N. G., 2021, MNRAS, 504, 3996
- Kewley & Dopita (2002) Kewley L. J., Dopita M. A., 2002, ApJS, 142, 35
- Kojima et al. (2020) Kojima T. et al., 2020, ApJ, 898, 142
- Kojima et al. (2021) Kojima T. et al., 2021, ApJ, 913, 22
- McCall et al. (1985) McCall M. L., Rybski P. M., Shields G. A., 1985, ApJS, 57, 1
- McGaugh (1991) McGaugh S. S., 1991, ApJ, 380, 140
- Nagao et al. (2006) Nagao T., Maiolino R., Marconi A., 2006, A&A, 459, 85
- Pagel et al. (1979) Pagel B. E. J., Edmunds M. G., Blackwell D. E., Chin M. S., Smith G., 1979, MNRAS, 189, 95
- Pilyugin (2000) Pilyugin L. S., 2000, A&A, 362, 325
- Pilyugin & Thuan (2005) Pilyugin L., Thuan T. X., 2005, ApJ, 631, 231
- Pogge (2019) Pogge R., 2019, https://doi.org/10.5281/zenodo.2550741
- Stasińska (1990) Stasińska G., 1990, A&AS, 83, 501
- Thuan et al. (2005) Thuan T. X., Lecavelier des Etangs A., Izotov Y. I., 2005, ApJ, 621, 269