9 Av. du colonel Roche, 31028 Toulouse Cedex 04, France
11email: olivier.berne@irap.omp.eu
Contribution of polycyclic aromatic hydrocarbon ionization to neutral gas heating in galaxies: model versus observations††thanks: The python code for the full model is available at https://gitlab.irap.omp.eu/COSMIC-PAH/photoelectric-heating/tree/master
The ionization of polycyclic aromatic hydocarbons (PAHs), by ultraviolet (UV) photons from massive stars is expected to account for a large fraction of the heating of neutral gas in galaxies. Evaluation of this proposal, however, has been limited by our ability to directly compare observational diagnostics to the results of a molecular model describing PAH ionization. The objective of this article is to take advantage of the most recent values of molecular parameters derived from laboratory experiments and quantum chemical calculations on PAHs and provide a detailed comparison between modeled values and observational diagnostics for the PAH charge state and the heating efficiency for PAHs. Despite the use of a simple analytical model, we obtain a good agreement between model results and observational diagnostics over a wide range of radiation fields and physical conditions, in environments such as star-forming regions, galaxies, and protoplanetary disks. In addition, we found that the modeled photoelectric heating rates by PAHs are close to the observed cooling rates given by the gas emission. These results show that PAH ionization is the main source of neutral gas heating in these environments. The results of our photoelectric heating model by PAHs can thus be used to assess the contribution of UV radiative heating in galaxies (vs e.g. shock). We conclude on the importance of implementing the physics of PAH ionization in astrophysical codes, which are developed, for example, for the evaporating surfaces of protoplanetary disks, the diffuse interstellar medium, and the photodissociation regions associated with star-forming regions in the local and distant universe. We provide the empirical formulas to calculate the heating rates and heating efficiencies for PAHs in this article.
1 Introduction
In a seminal paper on the temperature of interstellar gas, it was proposed by Spitzer Jr (1948) that the photoelectric (PE) effect on dust grains provides an important source of heating of the neutral gas in galaxies. The central idea behind this PE heating mechanism is that the interaction with dust of ultraviolet (UV) photons from young stars, with energies up to the Lyman limit ( eV), releases electrons that can carry a couple eV of kinetic energy and thermalize with the gas, resulting in gas heating. Following the initial proposal of Spitzer, other authors proposed more detailed models of this mechanism (Jura, 1976; de Jong, 1977; Draine, 1978). After the discovery that large molecules of the family of polycyclic aromatic hydrocarbons (PAHs) are ubiquitous in space (Leger & Puget, 1984; Allamandola et al., 1985), it was proposed that these large molecules could contribute to the heating of the HI gas (d’Hendecourt & Léger, 1987; Lepp & Dalgarno, 1988). Verstraete et al. (1990) measured the photoionization yield of the PAH coronene, and estimated the contribution of a PAH population with a typical size of 80 carbons to the PE heating. They concluded that PE effect on PAHs represents a major contribution to the gas heating in cold diffuse clouds and a significant contribution in the warm phase. Bakes & Tielens (1994) and Weingartner & Draine (2001) (respectively BT94 and WD01 hereafter) developed models that take into account grain size distributions from classical dust sizes (up to typically 0.1 m) down to the molecular (PAH) domain. BT94 concluded that about half of the gas heating is due to grains containing less than 1500 C atoms. While a proper description of PE heating in dust models is central to a number of astrophysical models and analysis, its implementation has only been benchmarked against observations in a limited number of studies. Deriving values of the PE heating efficiency for dust, , from observations requires quantifying dust emission but also the total neutral gas cooling power from all relevant infrared (IR) cooling lines in particular from atomic oxygen and ionized carbon. Several studies have used observations from Herschel, SOFIA, and Spitzer to derive the cooling budget of the neutral gas (Bernard-Salas et al., 2015; Pabst et al., 2021; Joblin et al., 2018). Recent studies of Galactic photodissociation regions (PDRs) associated with star-forming regions have compared observationally derived values with those calculated with the model of BT94 (Salgado et al., 2016; Salas et al., 2019; Pabst et al., 2021). There is a good qualitative agreement in terms of the shape of the curves but the calculated values are found to be larger than the observed ones by at least a factor of three. Since the earlier proposal that PAHs may provide a major contribution to the PE heating (d’Hendecourt & Léger, 1987; Lepp & Dalgarno, 1988; Verstraete et al., 1990), a number of observations have revealed a tight correlation between the [CII] flux and the PAH emission flux, which is in agreement with this proposal (Helou et al., 2001; Joblin et al., 2010; Lebouteiller et al., 2012). Joblin et al. (2010) mentioned that the PAH charge varies over the NGC 7023 nebula (Rapacioli et al., 2005; Berné et al., 2007) and this is expected to affect the contribution of PAHs to PE heating. Following this idea, Okada et al. (2013) provided the first study attempting to assess the connection between PAH charge and PE heating combining Spitzer and Herschel observations. The authors derived values of the ratio of gas emission to the sum of gas and PAH emission in several PDRs, and showed that its variation with the ionization parameter can be rationalized with a simple prescription based on previous modeling works (Tielens, 2005; Weingartner & Draine, 2001). This study concluded that PAHs provide a dominant contribution to the PE heating. However, it was conducted on unresolved sources which provided limited accuracy on the derived values and did not include any modeling of PAH ionization to support the conclusions. Modeling the charge state of PAHs and their contribution to the PE heating of the gas relies on the knowledge of the molecular properties of these species. Part of the relevant data have been gathered into models that describe the variation of the charge state of PAHs (e.g. Montillaud et al., 2013; Andrews et al., 2016). In addition, key molecular parameters that are needed to model the PE heating rate by PAHs of relevant sizes (i.e. ¿ 30 carbon atoms), both in neutral and cationic forms, are the photo-absorption cross sections , the ionization yields , and the ionization potentials (IPs). The earlier values of obtained for neutral PAHs (Verstraete et al., 1990; Jochims et al., 1996) are now completed with values for cations (Wenzel et al., 2020). An additional fundamental parameter is the partition coefficient (d’Hendecourt & Léger, 1987; Verstraete et al., 1990), here written , which determines, upon ionization by a photon of energy , the fraction of the energy that is carried away in kinetic energy by the photoelectron relative to the available energy . In this regard, photoelectron spectral images upon UV ionization of coronene have been reported by Bréchignac et al. (2014).
In this article we present a study in which we evaluate in detail the importance of the ionization of PAHs as a source of neutral gas heating in galaxies. We first derive in Sect. 2 the observational diagnostics on the PAH charge state and the gas heating efficiency for PAHs. In Sect. 3, we present a simple analytical model of PAH ionization and gas heating by the PE effect on PAHs, which includes state-of-the-art data for molecular parameters as provided by laboratory measurements and quantum chemical calculations. In Sect. 4 we present the model results and comparisons to the models of WD01 and BT94. In Sect. 5, we compare the observational diagnostics with results obtained with our PAH model. In Sect. 6, we discuss the dominant role of PAH ionization as a source of gas heating, before concluding in Sect. 7.
2 Observational diagnostics of PAH charge state and efficiency of gas heating
In order to characterize the contribution of PE effect on PAHs to the gas heating, we derive two diagnostics from observations. The first diagnostic we are interested in is the ionization fraction of PAHs as derived from observations, , which is determined by:
| (1) |
where and are the IR emission intensities attributed to cationic and neutral PAHs, respectively. In this study, we use the generic tool called PAHTAT (Pilleri et al., 2012) that allows one to derive and from spectroscopic IR observations111PAHTAT is available on the Cosmic PAH portal at https://cosmic-pah.irap.omp.eu/.
The second diagnostic we derive, following Okada et al. (2013), is the ratio of gas emission to the sum of gas and PAH emission:
| (2) |
with the intensity of PAH emission and the intensity of neutral gas cooling lines (dominated by the far-infrared [CII] and [OI] lines, see Sect. A.3). When , .
In addition to the two observational diagnostics described above, we derive the value of the ionization parameter:
| (3) |
where is the gas temperature in K, and is the electron density in cm-3. quantifies the intensity of the UV radiation field:
| (4) |
where is the intensity of the radiation field in the Solar neighborhood as given by Habing (1968) (here in W m-1 sr-1 ), is the solid angle of this radiation field and W m-2 is the normalization factor. This definition of is equivalent to that of Le Petit et al. (2006). The interval of integration over wavelengths of Eq. 4 corresponds to an energy range between 13.6 and 5.17 eV. The two observational diagnostics ( and ) and are derived for the NGC 7023 nebula in spatially resolved observations, and for a sample of Galactic and extragalatic sources described in the following sections.
2.1 The spatially resolved NGC 7023 NW PDR
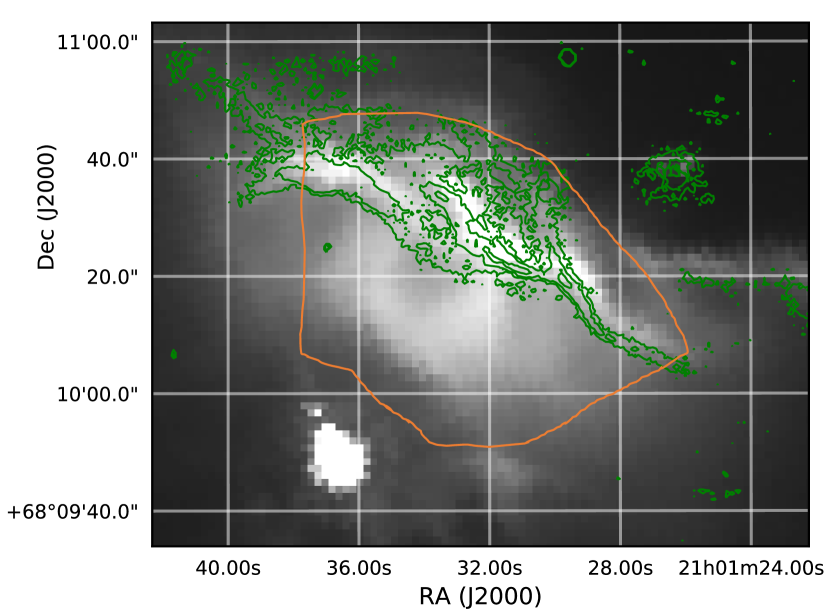
NGC 7023 is a reflection nebula illuminated by the HD 200775 double system of spectral types B3V and B5 (Finkenzeller, 1985; Racine, 1968) situated at 320 pc from the Sun (Benisty et al., 2013). We are interested in the PDR which is located at 42” north west (NW) of the star. NGC 7023 NW PDR is the most studied PDR and is seen almost edge-on. The dissociation front (i.e. the interface where H2 is dissociated to 2 H atoms) is well seen (Fig. 1) through bright emission in the H (1-0) line at 2.12 m, showing dense filamentary structures (cm-3) embedded in a more diffuse gas (cm-3) (Joblin et al., 2018; Lemaire et al., 1996; Fuente et al., 1996; Chokshi et al., 1988). Several estimates point to a UV radiation field intensity at the dissociation front of G0=2600 (Pilleri et al., 2012; Joblin et al., 2018; Chokshi et al., 1988). We derive the values of in NGC 7023 as a function of the distance to the star (see Appendix A.1) and summarize these values in Table 1. We extract the values of and (see Appendix A.2 and Appendix A.3, respectively), over the area delimited in Fig. 1.
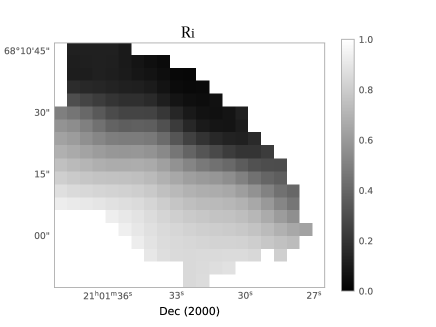
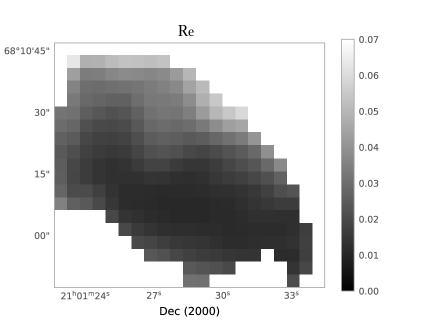
The resulting maps are presented in Fig. 2. The derived ionization fraction for PAHs is found to decrease from regions near HD 200775 to regions beyond the dissociation front as the radiation field intensity decreases, as expected. This result is consistent with earlier studies (e.g., Pilleri et al., 2012; Boersma et al., 2016). follows the opposite trend, that is it increases with distance to the star. This is in line with the trend observed by Okada et al. (2013) for three position in NGC 7023. Since PAH emission is directly related to the intensity of the radiation field, this variation of is indicative of a better coupling between the radiation field and the gas heating in regions far from the star, where is low and PAHs are mainly neutral.
| d (”) | 20 | 25 | 30 | 35 | 40 | 45 | 50 | 55 |
|---|---|---|---|---|---|---|---|---|
| 11004 | 7042 | 4890 | 3593 | 2751 | 2173 | 1760 | 733 | |
| T (K) | 750 | 750 | 750 | 750 | 750 | 750 | 350 | 150 |
| (cm-3) | 1.5 | 1.5 | 1.5 | 1.5 | 2 | 2 | 2 | 2 |
| (K1/2cm | 125567 | 80363 | 55807 | 41001 | 23543 | 18602 | 10293 | 2807 |
2.2 Sample of Galactic and extragalactic sources
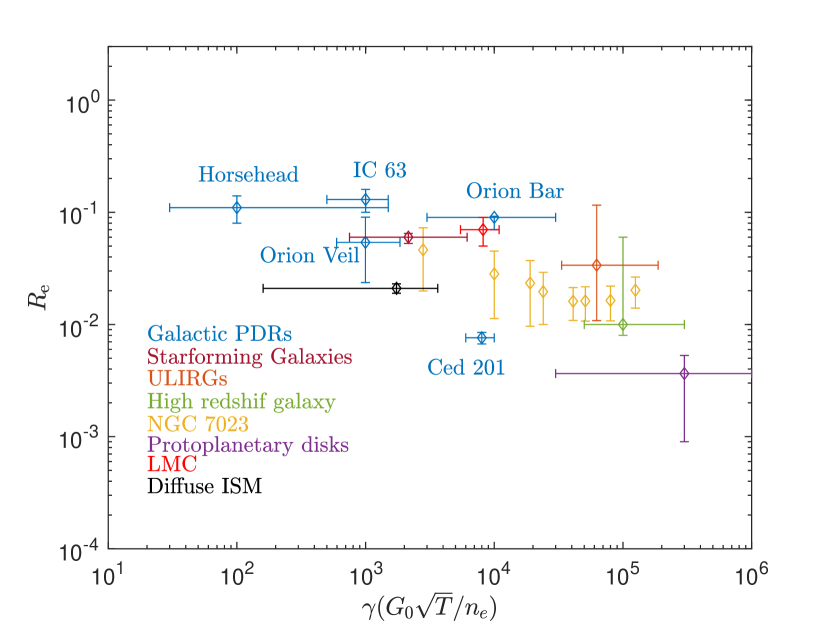
Values for are derived from observations for a number of astrophysical environments for which we expect the PE effect on PAHs to be a major contributor to gas heating. These include star-forming regions, protoplanetary disks, star-forming galaxies, ultra luminous infrared galaxies, and a high-redshift galaxy. The methodology to derive these parameters is detailed in Appendix B. All derived values are summarized in Table 2 together with associated values, and are shown in Fig. 3. Similar to the trend observed in NGC 7023 NW, values are found to be lower in sources with high values, such as protoplanetary disks or galaxies that actively form stars. However, the trend is also highly variable. For example, the Orion Bar and Ced 201 have similar values but their values of differ by an order of magnitude.
| Object | ||
| Galactic photodissociation regions | ||
| Orion Veil | 0.054 (0.024,0.091) | 997 (595,1850) |
| Orion Bar | [0.07-0.11] | |
| IC 63 | 0.14 (0.11,0.17) | [500-1500] |
| Ced 201 | 0.018 (0.012,0.024) | [6000 - 10 000] |
| Horsehead | 0.11 (0.08,0.14) | [30-1400] |
| Other environments | ||
| Disks around HAeBe stars | 0.0037 () | |
| Diffuse ISM | [1580 - 1900] | |
| LMC | [0.05-0.1] | [5460 - 10 900] |
| Star-forming Galaxies | [0.0048 - 0.0073] | |
| ULIRGs | 0.034 (0.011, 0.12) | |
| High Galaxy | [0.008-0.022] | |
3 Molecular model of the charge state and photoelectric emission from PAHs
Here we present a simple molecular model, whose objective is to compute the PAH ionization fraction, the heating efficiency for PAHs, and the heating rates by PAHs. This model is based on the photophysics of isolated interstellar PAHs and includes the latest results from laboratory experiments for PAH molecular parameters. Upon absorption of a UV photon, three main processes are expected to be in competition to relax the energy: ionization, dissociation, and radiative cooling (see, e.g., Joblin et al., 2020). Photoelectric heating is related to ionization, and therefore we focus on this process in the following.
3.1 Selection of species and molecular parameters
A first step consists in selecting species for which molecular data is available. Here we rely on information given by the Theoretical spectral database of PAHs333 http://astrochemistry.oa-cagliari.inaf.it/database/pahs.html (Malloci et al., 2007). The chosen molecules are listed in Table 3, having compact shapes and different characteristic sizes relevant for interstellar PAHs (Leger & Puget, 1984; Leger et al., 1989; Allamandola et al., 1985; Montillaud et al., 2013; Andrews et al., 2016).
| Name | Chemical formula |
|---|---|
| Ovalene | C32H14 |
| Tetrabenzocoronene | C36H16 |
| Circumbiphenyl | C38H16 |
| Circumanthracene | C40H16 |
| Circumpyrene | C42H16 |
| Hexabenzocoronene | C42H18 |
| Dicoronylene | C48H20 |
| Circumcoronene | C54H18 |
| Circumovalene | C66H20 |
In the present model, we consider four charge states that is ). Although there is no clear spectroscopic evidence for the presence of anions () in the ISM, we include them because they could play a role in gas heating in environments with low values. Cations () and neutrals () have long been proposed to exist in PDRs (see review in Tielens, 2008). Theoretical (Malloci et al., 2007) and experimental (Wenzel et al., 2020) data have shown that the dication stage () is accessible in PDRs for the considered species (Table 3), because their ionization potential IP2 is lower than the Lyman limit of 13.6 eV. Data for IP3 values for PAHs are scarce, but Zhen et al. (2016) have shown that they are greater than 13.6 eV for small PAHs, and Wenzel et al. (2020) demonstrate that this is probably the case up to a typical size of . Therefore, we do not consider trications in our model.
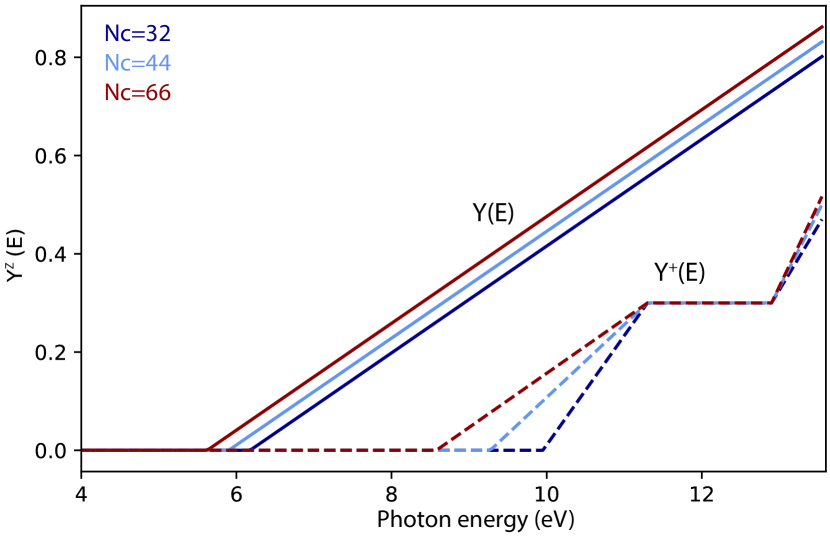
Values of the ionization potentials of a PAH with a given size , are obtained using the empirical formalism of WD01, with updated parameters from Wenzel et al. (2020) as given in Appendix C.1. Several studies provide measurements of the ionization yields of neutral (Jochims et al., 1996; Verstraete et al., 1990) and cationic (Zhen et al., 2016; Wenzel et al., 2020) PAHs. From these measurements, Jochims et al. (1996) and Wenzel et al. (2020) derived empirical laws for the ionization yields of neutral and cationic PAHs, respectively, which are used in this work (see Appendix C.2). The ionization yield curves are shown as a function of incident photon energy in Fig. 4 for three PAH sizes. Similarly to Visser et al. (2007), we use . The threshold in energy for the detachment of the electron on anions is given by the electron affinity (e.g., Tschurl & Boesl, 2006). The latter is very variable with the molecule but remains below 2 eV (see Theoretical spectral database of PAHs; Malloci et al., 2005; Wahab et al., 2022). We therefore assumed, as an approximation, that at all energies. We present another case in Appendix C.3.
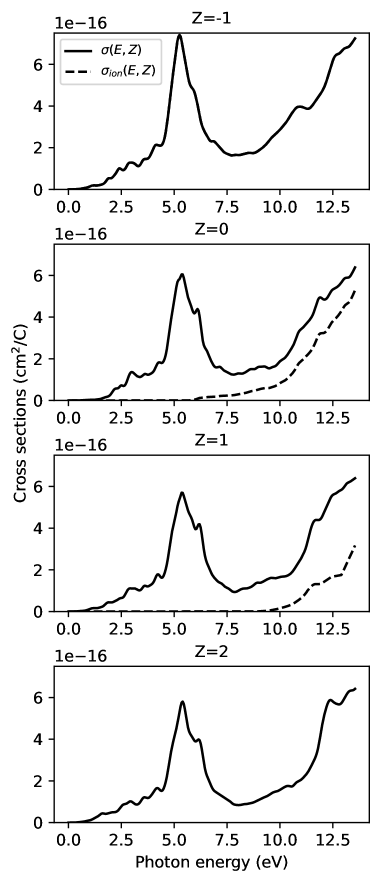
Finally, we use the photoabsorption cross sections given by the Theoretical spectral database of PAHs444https://www.dsf.unica.it/~gmalloci/pahs/ (see also Malloci et al., 2004). First, we retrieve the photoabsorption cross section for each molecule in Table 3 and for each value of and normalize it to the number of carbon atoms . Second, for each value of we compute the averaged normalized photoabsorption cross section. This yields an average photoabsorption cross section per carbon atom , from which the ionization cross section per carbon atom can be derived using:
| (5) |
Figure 5 represents the and curves as used in the model.
3.2 PAH charge states and ionization fraction
At equilibrium the fractions of each PAH population in a charge state is given by :
| (6) |
where k and k are respectively the ionization and recombination rates of PAHs in the charge state. We note that when is an exponent in the notation, it is written rather than , to avoid confusion. We also introduce the attachment rate of an electron to a neutral PAH, k, and the detachment rate of the electron from an anion, k. In addition, the values of should fulfill the condition:
| (7) |
| (8) |
| (9) |
| (10) |
| (11) |
The ionization rates are given by:
| (12) |
where , is the local intensity of the UV radiation field in W m2 eV-1 sr-1.
The values of have been defined above (Eq. 5, in particular). On the other hand, the recombination rate is calculated using Spitzer’s formalism (Spitzer, 2004), adapted for PAH cations by Verstraete et al. (1990):
| (13) |
where is the gas temperature, and
| (14) |
where e is the electron charge, U is the mean electrostatic potential evaluated at the radius of the PAH considered, defined by , k the Boltzmann constant and T the gas temperature.
Eq. 13 can be extended to include all charge states in the recombination rate:
| (15) |
For k, we use the work of Carelli et al. (2013) who provide an empirical fit to their quantum chemistry calculations that is
| (16) |
For the parameters we use the values determined by Carelli et al. (2013) for coronene, C24H12 which is
the largest molecule in this study, that is cm3s-1, , and .
We note however that for all the molecules studied by Carelli et al. (2013), the attachment rate is of
the order of cm3s-1 with only a small dependence on temperature. Hence
this choice is unlikely to affect the model results.
Finally, we write the ensemble of charge fractions:
| (17) |
and the modeled PAH positive ionization fraction is defined as:
| (18) |
3.3 Photoelectic heating efficiency for PAHs
The power injected into the gas via the photoelectrons, , is given by:
| (19) |
where , and are the fractions of anionic, neutral and cationic PAHs, derived from Eqs 8, 9 and 10, respectively. , and are the powers injected in the gas by photoelectrons ejected from anionic, neutral and cationic PAHs, respectively, which are defined by:
| (20) | ||||
where is the fraction of the energy that, after ionization, goes into kinetic energy of the photoelectron.
Energy conservation upon ionization requires:
| (21) |
where is the internal energy of the PAH and is its kinetic energy, which, due to the much higher mass of the PAH compared to the electron and due to conservation of momentum, is negligible compared to the kinetic energy of the electron, . Next, following d’Hendecourt & Léger (1987), we define the partition coefficient as the energy averaged :
| (22) |
We estimate the value of from photoelectron spectroscopy measurements performed using VUV synchrotron radiation and for the coronene molecule (Bréchignac et al., 2014). The derived value of (68 confidence interval) is found to be in agreement with the value of , which was used in a number of articles (e.g., Verstraete et al., 1990; Tielens, 2005; Bakes & Tielens, 1994) and derived from older measurements on benzene by Terenin & Vilessov (1964) (see Appendix C.4). For anionic PAHs, we assume that all energy available is taken by the electron. For , this means that all the energy of the photon is transformed into kinetic energy of the electron.
On the other hand, the power absorbed, mostly (but not only) in the UV, by each PAH charge state, , is given by:
| (23) |
The total radiative power absorbed by PAHs, , is then defined by:
| (24) |
We define the heating efficiency for PAHs, , as the ratio between the power injected in the gas via photoelectrons from PAHs to the total power of the radiation absorbed by PAHs, that is
| (25) |
We note that the derived values for the radiative power and heating efficiency depend on , through absorption and ionization cross sections, and through recombination rates with electrons. For the sake of simplicity this variable has, however, not been included in the notation. Also, our definition of the PE heating efficiency for PAHs is similar to that used by WD01 to compute their heating efficiency for grains, , but differs from the definition of by BT94, who considered only absorbed photons in the 6-13.6 eV range. Finally, the PE heating rate by PAHs can be derived using the following relation:
| (26) |
where is the fraction of cosmic carbon locked in PAHs, and is the cosmic abundance of carbon relative to hydrogen. The python code to compute and with the model described in this section is provided through the Cosmic PAH portal at https://cosmic-pah.irap.omp.eu/ or directly at https://gitlab.irap.omp.eu/COSMIC-PAH/photoelectric-heating/tree/master.
4 Model results and comparison with previous models
4.1 Charge balance
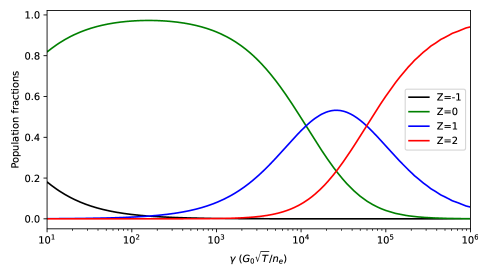
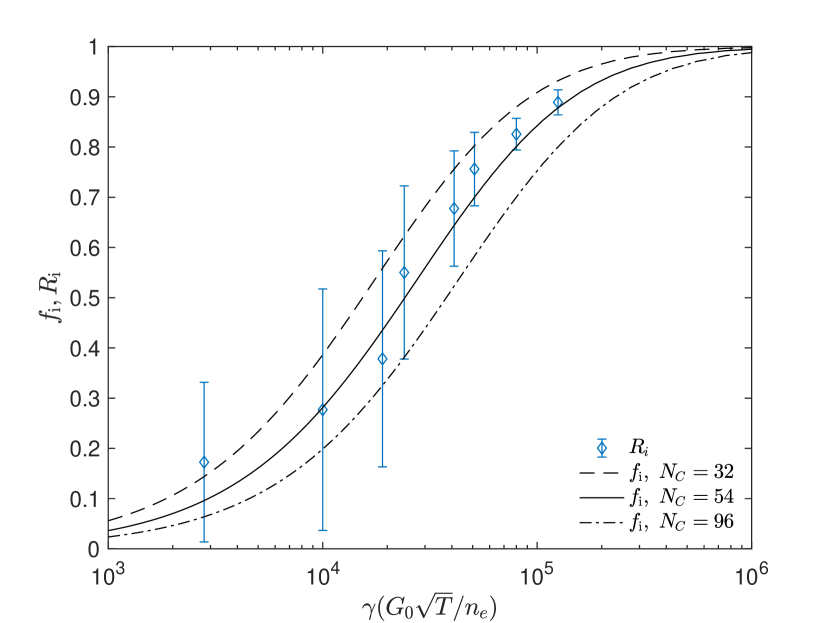
Figure 6 shows the variation of the population fractions of PAHs in charge state , as a function of , derived from the model, for K, , and stellar effective temperature of K using a Kurucz (1993) star model. For (e.g. diffuse ISM or dark clouds), the population is dominated by neutral PAHs, with an anionic contribution up to 20%. A comparable fraction of neutrals and anions was also derived at low values by both BT94 and WD01 for Å grains (comparable to PAHs of size ). Neutral PAHs dominate up to , followed by cations with a maximum at about . Finally, dications are the dominant species for . For and the same stellar effective temperature, WD01 find values for the charge fractions (Eq. 17) of . We infer comparable fractions but with less dications and more cations, (Fig. 6). The difference results from the higher ratio of ionization rate to recombination rate in WD01 compared to our model for high values. On the contrary, with the same stellar effective temperature and the same gas temperature, BT94 find at , and , for planar and spherical particles, respectively, resulting in lower ionized fractions compared to our model with (Fig. 6).
4.2 Heating efficiency
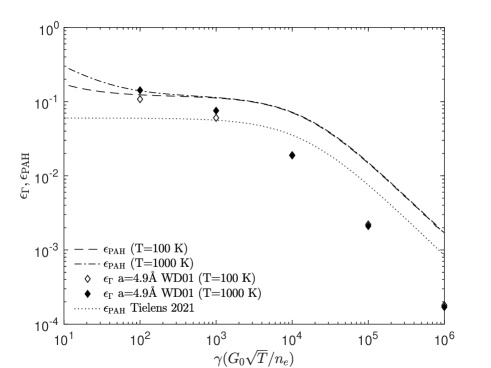
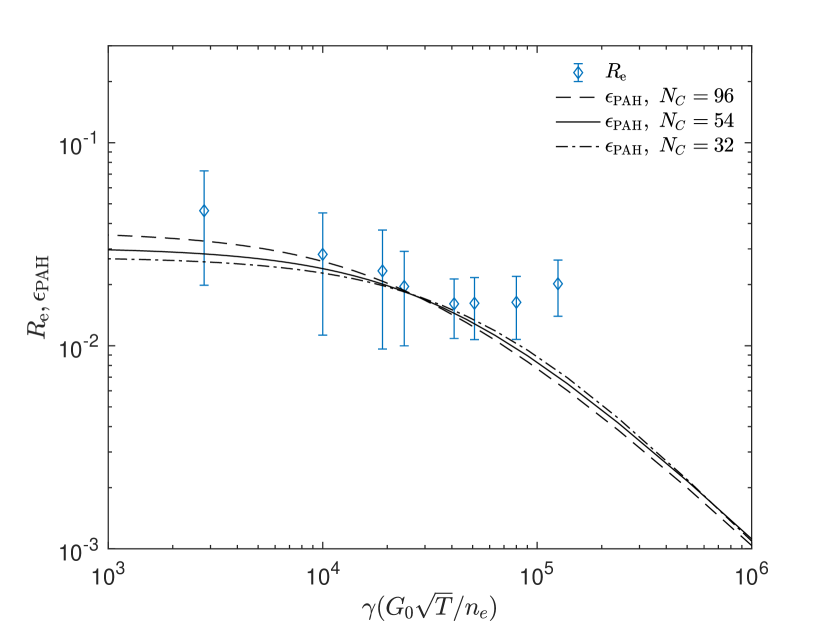
In Fig. 7, we present the results of the computation of with the PE heating model by PAHs for K, , and two values of the gas temperature, K and K. We compare with the efficiencies derived for the same physical conditions by WD01, for grains of size Å , corresponding to (Eq. 31). For we find a good agreement between the two models, for both gas temperatures. For higher values of , is systematically higher than . The difference increases with increasing , up to about an order of magnitude for values of . This can be rationalized by a slower decrease of the ionization to recombination rate ratio with in our model as compared to WD01 (see previous section). Tielens (2021) provides the following formula for the PAH heating efficiency:
| (27) |
which we also display in Fig. 7. This curve is also below the heating efficiency we infer for PAHs. At this is due to the the absence of photo-detachment in Eq. 27. For larger values of , the difference stems, notably, from the use of a photoelectron yield at 10 eV by Tielens (2021), while we use a value closer to (see Fig. 4). Since BT94 do not provide the photoelectric heating efficiency curves for different sizes, we cannot directly compare our results to their model.
4.3 Heating rates
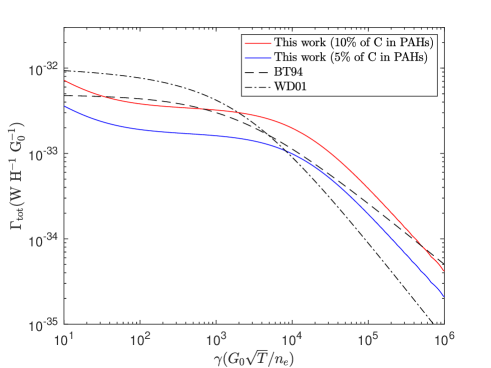
The PAH heating rate we derived as a function of is shown in Fig. 8 for K, , K, and two PAH abundances. We compare these values to the total heating rate of WD01 averaged over several dust size distributions (Fig. 15 of WD01) and that of BT94, obtained for the same physical conditions. Overall, the curves agree well. This implies that, with a purely molecular model, PAHs can produce a heating rate comparable to that of earlier models including a full size distribution of dust grains. We can also compare the results of our model with those of Verstraete et al. (1990) for the diffuse ISM. The physical conditions are with the Draine (1978) field, a gas temperature of K, and an electron density cm-3 yielding K1/2 cm-3. With a value of , as in Verstraete et al. (1990), our model yields W H-1 (Tab. 5). The latter authors find a value that is larger by a factor , that is W H-1. This is probably due to a combination of the following factors: 1) the higher ionization yield used by these authors, for example at 10 eV compared to in our model (Fig. 4), 2) their larger value for the partition coefficient compared to 0.46 in our model, 3) the fact that we include the ionization of cations in our model, which affects the charge balance and reduces the heating rate, because the dications do not heat the gas.
4.4 Empirical formulas for the heating efficiency and rate
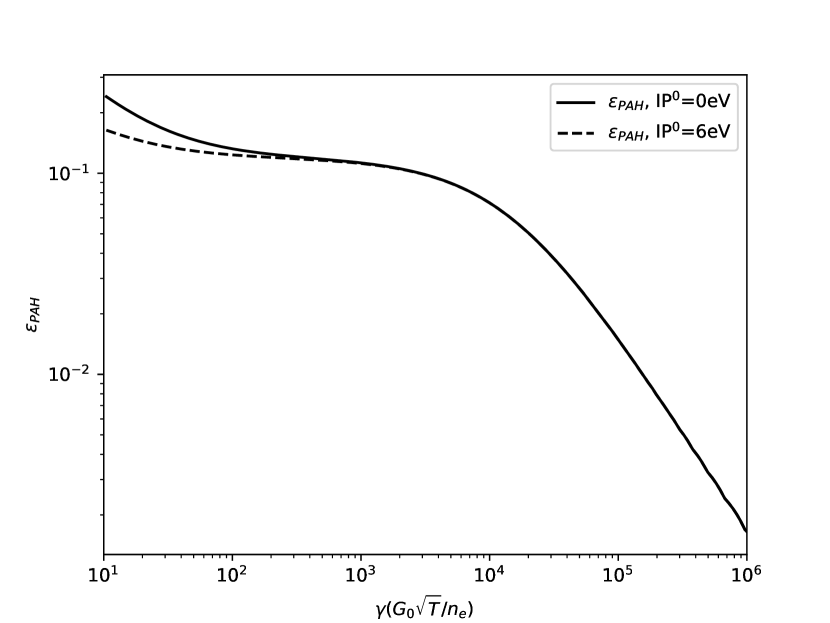
We computed using the molecular model presented in Sect. 3, for a fixed size (corresponding to cicumcoronene, see Table 3), and a gas temperature K, using radiation fields with stellar spectral types at various effective temperatures ( in the K range). For , we used stellar spectra from the Pollux database 666http://npollux.lupm.univ-montp2.fr (Palacios et al., 2010) computed with the CMFGEN code (Hillier & Miller, 1998). The lower temperature stellar spectra are from Kurucz (1993) database. The resulting PE efficiency curves for PAHs as a function of the ionization parameter are shown in Fig. 9. The values of can be fitted using the following empirical formula:
| (28) |
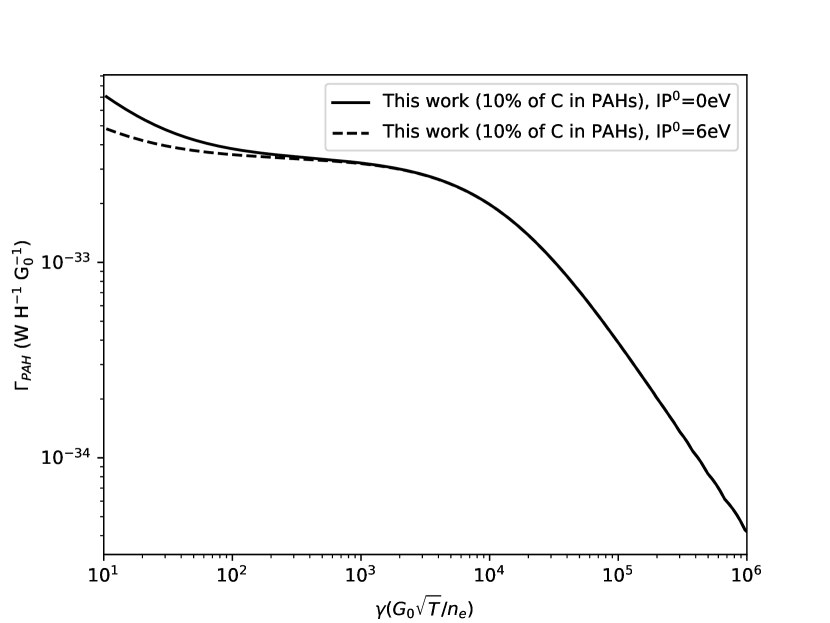
This is similar to the expression, proposed by Tielens (2005) (see Eq. 27) but includes an additional term to take into account photo-detachment at low values. We fit the analytical expression of Eq. 28 to the model derived values (Fig. 9) for all radiation fields, and provide the obtained values of the parameters in Table 5. Using Eq. 24 we computed for for K and between and K, as a function of . The result of this calculation, combined to Eq. 26 using , and per H atom (Tielens, 2021) yields an average heating rate for PAHs:
| (29) |
where the uncertainty on the numerical coefficient is the standard deviation among all numerical values obtained with the model.
| S. Type | |||||
|---|---|---|---|---|---|
| O8 | 0.949 | 0.641 | 0.130 | 7.45 | |
| O9.5 | 0.947 | 0.646 | 0.119 | 6.77 | |
| B0.5 | 0.948 | 0.645 | 0.108 | 6.20 | |
| B5 | 0.947 | 0.660 | 0.089 | 5.20 | |
| B2.5 | 0.947 | 0.732 | 0.0516 | 3.54 | |
| B5 | 0.968 | 0.880 | 0.0267 | 2.60 | |
| B9 | 0.985 | 1.08 | 0.015 | 2.18 | |
| A0 | 0.992 | 1.35 | 0.00889 | 1.91 |
5 Charge state and photo-electric heating of PAHs: Model vs observations
In this section we discuss the comparison between the observational results presented in Sect. 2 and the results of the molecular model described in Sect. 3. More specifically, for the case of NGC 7023, we compare , the ionization fraction of PAHs derived from the analysis of the mid-infrared spectra of the PDR (see Appendix A.2) to , the modeled PAH ionization fraction. We also compare the emission ratio, , to computed values of . If PAHs are the main source of gas heating, then the later two values and their variations should be in close agreement. We then extend this comparison to our sample of galactic and extragalactic sources. In addition, for NGC 7023, the Orion Bar, and the diffuse ISM, we compare the total gas cooling to the modeled heating rate by PAHs .
5.1 Comparison of model results with observations in NGC 7023
We first computed the model for three PAH sizes that is , using the physical parameters in Tab. 1. and the stellar spectrum of HD 200775 (see Appendix A.1). The gas temperature in NGC 7023 NW varies between 750 and 150 K. We therefore adopt a fixed value of K, since this parameter has only a small effect on the model results (Fig. 7). The comparison of model results with the observational diagnostics is provided for the eight positions listed in Table 1. In Fig. 10 we compare the ionization fraction obtained with the model, , to those derived from observations in NGC 7023, , as a function of . The obtained good agreement suggests that the model is able to quantify the evolution of the charge state of PAHs in NGC 7023. The PAH size plays a small role in the values of , but better results are obtained for PAHs with . In Fig. 11, we compare as measured in NGC 7023 with values of the heating efficiency, , derived from the model for three PAH sizes. The agreement in terms of curve shape and absolute values is good, with all observed values intersecting the model, except for the closest positions to the star. There are a number of parameters that could explain this discrepancy including less precise values for the physical conditions in this region, or a possible additional source of heating in this environment, such as shocks due to the expansion of a small HII region. This HII region could also contribute to some fraction of the [CII] emission that we include in the total cooling. Overall, however, compares well to . Finally, we can also compare the total photoelectric heating rate by PAHs to the total gas cooling rate , with the total hydrogen column density. Joblin et al. (2010) provide values for in the NGC 7023 PDR, which are and cm-2, at 50, 48 and 47” from the star, respectively. We thus adopt cm-2. At distances 45 - 50” from the star, we derive W m-2 sr-1. This yields a cooling rate W H-1 for this range of distances. The heating rates by PAHs derived from the model for the physical conditions at 45 and 50” (Table 1) and a value are, for both positions, W H-1, in agreement with the cooling rates derived from the observations.
5.2 Comparison of model results with observations for the sample of Galactic and extragalactic regions
5.2.1 Photoelectric heating efficiency
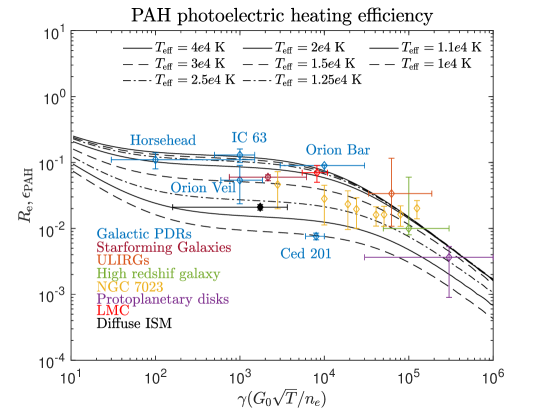
Figure 9 compares the variation with of the observational diagnostic to the modeled values of for the set of objects listed in Table 2. Here we adopt in the model, and a gas temperature K, but we note that the choice of values for these parameters has a limited effect on the model results for (see Figs. 10, 11, and 7), applicable to most sources. In contrast, since the effective temperature of the radiation field has strong effects on the value of (see Spaans et al. 1994), we compute the models with appropriate effective temperatures. Figure 9 shows that, in general, there is a good agreement between and , in terms of curve shape but also of absolute values. The upper part of Fig. 9 presents the comparison between and for interstellar regions irradiated by the most massive stars with K. In the Orion Veil, is somewhat lower than the predicted , for a star with K (which is appropriate for Orionis C). This lower value can be explained by the fact that the radiation field impinging on the Veil is likely softer than that of Orionis C, because of the UV absorption by dust and PAHs situated in between the Veil and the massive star. The Orion Bar which is much closer to Orionis C has a value of which is in good agreement with that of for K. The other nebulae illuminated by O or early B stars in the sample, that is the Horsehead and IC 63 also have values of in good agreement with modeled values of for K. For the LMC, is in good agreement with the curve for the most massive stars (K). This is compatible with the fact that the values we use to derive from Rubin et al. (2009) and Lebouteiller et al. (2012) concern star-forming regions. in star-forming galaxies falls within the range of the models with K, implying an average radiation field which is softer than that of O stars and dominated by B-type stars. for ULIRGs is also in good agreement with the model. ULIRGs have a lower heating efficiency as compared to star-forming galaxies of the local universe, which is well explained in the model by the higher value of the ionization parameter in these galaxies due to intense massive star formation, increasing the average integrated intensity of the radiation field (Díaz-Santos et al., 2017; McKinney et al., 2021). The value of the high redshift galaxy GS IRS20 is also in good agreement with the model. Figure 9 also presents the comparison between and for interstellar regions irradiated by intermediate-mass stars with K. This include NGC 7023 which was presented in detail in Sect. 5.1. The case of Ced 201 is particularly interesting, because it has a low PAH heating efficiency, which is well explained by the fact that this nebula is illuminated by a B 9.5 star, whose cooler spectrum is less efficient to ionize PAHs (see Sect. C.4). The value of for Ced 201 indeed falls close to the model value of for a K, while a B 9.5 spectral type has K. The lowest efficiencies are observed in protoplanetary disks (Fig. 9). In this case too there is a good agreement between and the modeled value of , which are low due to both the high values and cool spectral types (A and B) for these sources. Table 5 gives the values derived for for diffuse ISM conditions, that is and cm-3 for three classical radiation fields. Observations yield (Table 2 and Appendix B), close but about a factor of 2-3 lower than the model values, that is and for the interstellar radiation fields of Draine (1978), Mathis et al. (1983) and Habing (1968), respectively.
5.2.2 Heating rates
We compute the heating rates in sources for which there is a good estimate of the column density of the cooling gas, that is the Orion Bar (Salgado et al., 2016) and a diffuse ISM line of sight (Boulanger et al., 1996). For the Orion bar, with W m-2 (AppendixB) and cm-2 (Salgado et al., 2016), W H-1. This is close to the modeled gas heating rate by PAHs, that is W H-1, considering (Joblin et al., 2018) and (Castellanos et al., 2014) and the range of values in Table 2. For the diffuse ISM, Boulanger et al. (1998) find a cooling rate of W H-1 from FIRAS observations, in good agreement with the model values of presented in Table 5.
6 Discussion
6.1 The role of PAHs in neutral gas heating
The comparison presented in Sect. 5 shows that there is a good agreement between the values of derived from the PAH heating model and the values of the observational diagnostics , for a wide range of physical conditions and environments. In addition, there is an excellent agreement in terms of the spatial variations of the charge state of PAHs in NGC 7023. The agreement between the modeled heating rates by PAHs and the gas cooling rates derived from the observations is also good for NGC 7023, the Orion Bar, and the diffuse ISM. Overall, this suggests that photoelectric heating by PAHs alone can explain the neutral gas heating in a number of environments. While this has been suggested by several studies (see Introduction), a direct assessment comparing the results from a molecular model including state-of-the-art molecular parameters for PAHs to observational diagnostics, had not been conducted before. BT94 pointed out the importance of PAHs, however of the gas heating in their model is due to grains larger than , while the present PAH model contains only PAHs of C atoms. This stresses the central role that PAHs play in the physics of the gas heating of galaxies.
6.2 Heating by dust vs heating by PAHs
Pabst et al. (2021) and earlier works have compared the theoretical photoelectric heating efficiency of dust from BT94, , to , where is the total power radiated by dust in the far infrared. They found that by a factor or more. This discrepancy is likely due to the fact that cannot easily be compared to , for two reasons. The first one is that, in the definition of BT94, is computed by integrating the power absorbed (emitted) by dust in the 6-13.6 eV range, while some fraction of the observed radiated power is in reality due to absorption of UV photons with energies below 6 eV, and therefore overestimates the denominator value. Still, it appears unlikely that this effect only can explain this factor of 3 difference, because most of the energy absorbed by dust does lie above 6 eV. A most likely reason is that includes an important fraction of emission from dust grains which do not contribute at all to photoelectric heating.
6.3 PAH heating vs X-rays, cosmic rays, shocks, and turbulence in neutral gas.
Since the gas heating rate by PAHs depends on their abundance (Eq. 29), in regions where they are depleted, such as dense molecular clouds where PAHs are in condensed form (Rapacioli et al., 2006), other mechanisms are likely to take over, such as heating by cosmic rays (e.g. Padovani et al. 2009). In regions where the UV radiation field is weak compared to other sources of radiation such as X-rays (e.g. in the inner regions of protoplanetary disks near T-Tauri stars, or near active galactic nuclei), heating by PAHs may also become negligible. In PDRs, heating by PAHs is likely to dominate, but heating by H2 can also become important in dense regions near the dissociation front (Bron, 2014). In some regions, shocks may become an important source of neutral gas heating. The competition between heating by PAHs and other sources of gas heating can be tested using : when this ratio is larger than the values predicted by the model, this is indicative that some other processes are at play. For instance, shock heating of neutral gas at the scale of galaxies results in extreme values of (e.g. ¿0.3, Appleton et al. 2013, Table 1), well above the maximum efficiencies derived with our model (, see Table 5). This illustrates how the PAH model efficiencies can be used as a diagnostic of UV radiative feedback vs other sources of heating in galaxies.
7 Conclusion
In this article, we re-evaluate the contribution of PAHs to the photoelectric heating of neutral gas in astrophysical environments, using a simple analytical model in which state-of-the-art molecular parameters from laboratory measurements and quantum chemical calculations are included. We find that, for standard abundances of PAHs, the heating rates resulting from photoelectric heating by PAHs alone is comparable to those produced using a full size distribution of dust grains in the classical models of Bakes & Tielens (1994) and Weingartner & Draine (2001). The modeled and observed charge states of PAHs and their variation with physical conditions in NGC 7023 are in excellent agreement. The values of the photoeletric heating efficiency derived for PAHs from the model for a wide range of Galactic and extragalatic regions are in good agreement with the values of the observational diagnostics , that is the ratio of gas emission to the sum of gas + PAH emission. The values of the heating rate by PAHs derived from the model are also in good agreement with the observed gas cooling rates for the NGC 7023 nebula, the Orion Bar, and the diffuse ISM. Overall, this allows us to conclude that PAHs can explain most of the heating of the neutral gas in a variety of astrophysical environments, ranging from protoplanetary disks around young intermediate-mass stars to starburst galaxies in the early Universe. Our study highlights the importance to implement a robust description of the PE heating by PAHs in astrophysical codes computing the thermal balance of neutral gas, such as PDR models. The formalism presented here is included in a simple analytical model but it relies on our knowledge of the molecular properties of PAHs. This knowledge is crucial and laboratory studies (experiments and quantum chemical calculations must be guided by astronomical observations. In particular, the coming spectroscopic data obtained from the MIRI and NIRspec spectrometers on board the James Webb Space Telescope will provide unprecedented details on the PAH populations (Berné, Habart, Peeters, & the PDRs4All Team, 2022).
Acknowledgements.
OB acknowledges C. Pabst and J. R. Goicoechea for providing the data on the PE heating efficiency in Orion, J. Mc Kinney for providing the data regarding the PE heating efficiency in galaxies, F. Boulanger for fruitful discussions on the heating and cooling of the diffuse ISM, E. Josselin and A. Palacios for their help on extracting the stellar spectra used in this paper, and I. Schroetter for support on the writing of the code. The authors wish to thank L. Verstraete and V. Guillet for their comments on an early version of this work. We are grateful to the anonymous referee for his detailed report which greatly improved the manuscript. Finally, the research leading to these results has received funding from the European Research Council under the European Union’s Seventh Framework Programme (FP/2007-2013) ERC-2013-SyG, Grant agreement No610256 NANOCOSMOS. It has also been supported by the Programme National “Physique et Chimie du Milieu Interstellaire” (PCMI) of CNRS/INSU with INC/INP co-funded by CEA and CNES, and through an APR grant provided by CNES.References
- Acke & van den Ancker (2004) Acke, B. & van den Ancker, M. E. 2004, A&A, 426, 151
- Alecian et al. (2008) Alecian, E., Catala, C., Wade, G., et al. 2008, Monthly Notices of the Royal Astronomical Society, 385, 391
- Allamandola et al. (1985) Allamandola, L. J., Tielens, A. G. G. M., & Barker, J. R. 1985, ApJ, 290, L25
- Andrews et al. (2016) Andrews, H., Candian, A., & Tielens, A. G. G. M. 2016, A&A, 595, A23
- Andrews et al. (2018) Andrews, H., Peeters, E., Tielens, A., & Okada, Y. 2018, A&A, 619, A170
- Appleton et al. (2013) Appleton, P. N., Guillard, P., Boulanger, F., et al. 2013, ApJ, 777, 66
- Bakes & Tielens (1994) Bakes, E. L. O. & Tielens, A. G. G. M. 1994, ApJ, 427, 822
- Bauschlicher et al. (2018) Bauschlicher, C. W., Ricca, A., Boersma, C., & Allamandola, L. J. 2018, ApJS, 234, 32
- Benisty et al. (2013) Benisty, M., Perraut, K., Mourard, D., et al. 2013, A&A, 555, A113
- Bernard-Salas et al. (2012) Bernard-Salas, J., Habart, E., Arab, H., et al. 2012, A&A, 538, A37
- Bernard-Salas et al. (2015) Bernard-Salas, J., Habart, E., Köhler, M., et al. 2015, A&A, 574, A97
- Berné et al. (2022) Berné, O., Habart, É., Peeters, E., & the PDRs4All Team. 2022, Publications of the Astronomical Society of the Pacific, 134, 054301
- Berné et al. (2015) Berné, O., Montillaud, J., & Joblin, C. 2015, A&A, 577, A133
- Berné et al. (2013) Berné, O., Mulas, G., & Joblin, C. 2013, A&A, 550, L4
- Berné et al. (2007) Berné, O., Joblin, C., Deville, Y., et al. 2007, A&A, 469, 575
- Boersma et al. (2016) Boersma, C., Bregman, J., & Allamandola, L. J. 2016, ApJ, 832, 51
- Boersma et al. (2013) Boersma, C., Bregman, J. D., & Allamandola, L. J. 2013, ApJ, 769, 117
- Boulais (2013) Boulais, A. 2013, Méthodes de séparation aveugle de source et application à l’imagerie hyperspectrale en astrophysique
- Boulanger (1999) Boulanger, F. 1999, in Solid Interstellar Matter: The ISO Revolution, 20
- Boulanger et al. (1996) Boulanger, F., Abergel, A., Bernard, J.-P., et al. 1996, A&A, 312, 256
- Boulanger et al. (1998) Boulanger, F., Boisssel, P., Cesarsky, D., & Ryter, C. 1998, A&A, 339, 194
- Bron (2014) Bron, E. 2014, PhD thesis, Université Paris Diderot
- Bréchignac et al. (2014) Bréchignac, P., Garcia, G. A., Falvo, C., et al. 2014, The Journal of Chemical Physics, 141, 164325
- Carelli et al. (2013) Carelli, F., Grassi, T., & Gianturco, F. 2013, Astronomy & Astrophysics, 549, A103
- Castellanos et al. (2014) Castellanos, P., Berné, O., Sheffer, Y., Wolfire, M. G., & Tielens, A. G. 2014, ApJ, 794, 83
- Chokshi et al. (1988) Chokshi, A., Tielens, A. G. G. M., Werner, M. W., & Castelaz, M. W. 1988, ApJ, 334, 803
- Compiègne et al. (2011) Compiègne, M., Verstraete, L., Jones, A., et al. 2011, A&A, 525, A103
- de Jong (1977) de Jong, T. 1977, A&A, 55, 137
- Díaz-Santos et al. (2017) Díaz-Santos, T., Armus, L., Charmandaris, V., et al. 2017, ApJ, 846, 32
- Draine (1978) Draine, B. T. 1978, ApJS, 36, 595
- Draine (1978) Draine, B. T. 1978, ApJS, 36, 595
- d’Hendecourt & Léger (1987) d’Hendecourt, L. & Léger, A. 1987, Astron. Astrophys, 180, L9
- Finkenzeller (1985) Finkenzeller, U. 1985, A&A, 151, 340
- Fuente et al. (1996) Fuente, A., Martin-Pintado, J., Neri, R., Rogers, C., & Moriarty-Schieven, G. 1996, A&A, 310, 286
- Habart et al. (2005) Habart, E., Abergel, A., Walmsley, C., Teyssier, D., & Pety, J. 2005, A&A, 437, 177
- Habing (1968) Habing, H. J. 1968, Bull. Astron. Inst. Netherlands, 19, 421
- Helou et al. (2001) Helou, G., Malhotra, S., Hollenbach, D. J., Dale, D. A., & Contursi, A. 2001, ApJLetters, 548, L73
- Hillier & Miller (1998) Hillier, D. J. & Miller, D. L. 1998, ApJ, 496, 407
- Iida et al. (2021) Iida, S., Kuma, S., Kuriyama, M., et al. 2021, Phys. Rev. A, 104, 043114
- Joblin et al. (2018) Joblin, C., Bron, E., Pinto, C., et al. 2018, A&A, 615, A129
- Joblin et al. (2010) Joblin, C., Pilleri, P., Montillaud, J., et al. 2010, A&A, 521, L25
- Joblin et al. (2020) Joblin, C., Wenzel, G., Castillo, S. R., et al. 2020, J. Phys. Conf. Ser., 1412, 062002
- Jochims et al. (1996) Jochims, H. W., Baumgaertel, H., & Leach, S. 1996, A&A, 314, 1003
- Jura (1976) Jura, M. 1976, ApJ, 204, 12
- Kurucz (1993) Kurucz, R. L. 1993, VizieR Online Data Catalog, VI/39
- Le Petit et al. (2006) Le Petit, F., Nehme, C., Le Bourlot, J., & Roueff, E. 2006, ApJS, 164, 506
- Lebouteiller et al. (2012) Lebouteiller, V., Cormier, D., Madden, S. C., et al. 2012, A&A, 548, A91
- Leger et al. (1989) Leger, A., D’Hendecourt, L., & Defourneau, D. 1989, A&A, 216, 148
- Leger & Puget (1984) Leger, A. & Puget, J. L. 1984, A&A, 500, 279
- Lemaire et al. (1996) Lemaire, J. L., Field, D., & Maillard, J. P. 1996, 6
- Lepp & Dalgarno (1988) Lepp, S. & Dalgarno, A. 1988, ApJ, 335, 769
- Malloci et al. (2007) Malloci, G., Joblin, C., & Mulas, G. 2007, Chemical Physics, 332, 353
- Malloci et al. (2005) Malloci, G., Mulas, G., Cappellini, G., Fiorentini, V., & Porceddu, I. 2005, A&A, 432, 585
- Malloci et al. (2004) Malloci, G., Mulas, G., & Joblin, C. 2004, A&A, 426, 105
- Mathis et al. (1983) Mathis, J. S., Mezger, P. G., & Panagia, N. 1983, A&A, 500, 259
- McKinney et al. (2021) McKinney, J., Armus, L., Diaz-Santos, T., et al. 2021, arXiv preprint arXiv:2101.01182
- McKinney et al. (2020) McKinney, J., Pope, A., Armus, L., et al. 2020, ApJ, 892, 119
- Meeus et al. (2012) Meeus, G., Montesinos, B., Mendigutía, I., et al. 2012, A&A, 544, A78
- Megeath et al. (2015) Megeath, S. T., Gutermuth, R., Muzerolle, J., et al. 2015, 151, 5
- Montillaud et al. (2013) Montillaud, J., Joblin, C., & Toublanc, D. 2013, A&A, 552, A15
- Mulas et al. (2006) Mulas, G., Malloci, G., Joblin, C., & Toublanc, D. 2006, A&A, 456, 161
- Okada et al. (2013) Okada, Y., Pilleri, P., Berné, O., et al. 2013, A&A, 553, A2
- Pabst et al. (2021) Pabst, C., Goicoechea, J., Hacar, A., et al. 2021, arXiv preprint arXiv:2111.12363
- Padovani et al. (2009) Padovani, M., Galli, D., & Glassgold, A. E. 2009, A&A, 501, 619
- Palacios et al. (2010) Palacios, A., Gebran, M., Josselin, E., et al. 2010, A&A, 516, A13
- Pilleri et al. (2012) Pilleri, P., Montillaud, J., Berné, O., & Joblin, C. 2012, A&A, 542, A69
- Racine (1968) Racine, R. 1968, AJ, 73, 233
- Rapacioli et al. (2006) Rapacioli, M., Calvo, F., Joblin, C., et al. 2006, A&A, 460, 519
- Rapacioli et al. (2005) Rapacioli, M., Joblin, C., & Boissel, P. 2005, A&A, 429, 193
- Ricca et al. (2012) Ricca, A., Bauschlicher, C. W., Boersma, C., Tielens, A. G. G. M., & Allamandola, L. J. 2012, The Astrophysical Journal, 754, 75
- Rubin et al. (2009) Rubin, D., Hony, S., Madden, S., et al. 2009, A&A, 494, 647
- Salas et al. (2019) Salas, P., Oonk, J., Emig, K., et al. 2019, A&A, 626, A70
- Salgado et al. (2016) Salgado, F., Berné, O., Adams, J. D., et al. 2016, ApJ, 830, 118
- Smith et al. (2007a) Smith, J. D. T., Armus, L., Dale, D. A., et al. 2007a, PASP, 119, 1133
- Smith et al. (2007b) Smith, J. D. T., Draine, B. T., Dale, D. A., et al. 2007b, ApJ, 656, 770
- Spaans et al. (1994) Spaans, M., Tielens, A. G. G. M., van Dishoeck, E. F., & Bakes, E. L. O. 1994, ApJ, 437, 270
- Spitzer (2004) Spitzer, L. 2004, Physical processes in the interstellar medium, Physics textbook (Wiley)
- Spitzer Jr (1948) Spitzer Jr, L. 1948, ApJ, 107, 6
- Terenin & Vilessov (1964) Terenin, A. & Vilessov, F. 1964, Advances in Photochemistry, 2, 385
- Tielens (2005) Tielens, A. 2005, The Physics and Chemistry of the Interstellar Medium
- Tielens (2021) Tielens, A. G. 2021, Molecular astrophysics (Cambridge University Press)
- Tielens (2008) Tielens, A. G. G. M. 2008, Annual Review of A&A, 46, 289
- Tschurl & Boesl (2006) Tschurl, M. & Boesl, U. 2006, International Journal of Mass Spectrometry, 249-250, 364, chava Lifshitz Memorial Issue
- Verstraete et al. (1990) Verstraete, L., Leger, A., D’Hendecourt, L., Defourneau, D., & Dutuit, O. 1990, A&A, 237, 436
- Visser et al. (2007) Visser, R., Geers, V., Dullemond, C., et al. 2007, A&A, 466, 229
- Wahab et al. (2022) Wahab, A., Pfuderer, L., Paenurk, E., & Gershoni-Poranne, R. 2022, Journal of Chemical Information and Modeling, 62, 3704, pMID: 35881922
- Weingartner & Draine (2001) Weingartner, J. C. & Draine, B. T. 2001, ApJ, 548, 296
- Weingartner & Draine (2001) Weingartner, J. C. & Draine, B. T. 2001, ApJS, 134, 263
- Wenzel et al. (2020) Wenzel, G., Joblin, C., Giuliani, A., et al. 2020, A&A, 641, A98
- Werner et al. (2004) Werner, M. W., Uchida, K. I., Sellgren, K., et al. 2004, ApJS, 154, 309
- Zhen et al. (2016) Zhen, J., Castillo, S. R., Joblin, C., et al. 2016, ApJ, 822, 113
Appendix A Derivation of and in NGC 7023
A.1 Derivation of in the NGC 7023 NW PDR
In the following, we describe how we derived values for the physical conditions, that is , and , necessary to determine in NGC 7023, for 8 angular distances ranging from 20 to 60” from the star. To derive the radiation field intensity, we used the procedure described in Pilleri et al. (2012) and adopted in Joblin et al. (2018). Briefly, this consists in using the sum of two identical synthetic spectra with effective temperatures 1.5 K from the Kurucz (1993) library and a radius of 10 for the HD 200775 stars (Alecian et al. 2008). An additional extinction of was applied to account for the presence of dust in the immediate surrounding of the stars. The radiation field intensity as a function of distance, in units of the Habing field, is derived assuming that the star-to-PDR inclination is of 63 degrees, which is necessary to reconcile the sky projected distance to the modeled star-to-PDR distance of 0.143 pc (Joblin et al. 2018). For angular distances from the star above 45”, the effect of dust absorption in the PDR is taken into account using a factor where , with the total hydrogen column density along the axis between the PDR and the star. With a constant density in the PDR of cm-3 (Pilleri et al. 2012), the estimated values for at positions situated 50”, 55” et 60” from the star are , , and cm-2, respectively. This corresponds to extinction values of , and mag, respectively. The resulting radiation field intensities are computed by integrating the specific intensities in the 5.17 to 13.6 eV range, and are reported in Table 1. The gas temperature values for the positions up to 45” from HD 200775 are taken from the study of Boulais (2013) who modeled the spatial profile of the [C ii] 158 m line emission using an LTE radiative transfer model to determine a stable temperature of K. The values adopted inside the PDR, that is above 45”, are from the models of Montillaud et al. (2013). Gas densities in the cavity region up to 25” from the star are from Berné et al. (2015). The authors provided a value of cm-3 at ”, which we assume to be constant up to the PDR dissociation front from which we use a value of cm-3 (Pilleri et al. 2012). The gas temperature and density for all studied positions are reported in Table 1. The electron density is derived from the gas density by considering that all electrons originate from the ionization of carbon, that is cm-3. The gas temperature and the electron density can then be used to derive the ionization parameter (see values in Table 1). Andrews et al. (2016) used K1/2cm3 at the border of the PDR, ( from HD 200775), which is consistent with the values derived in the present study.
A.2 Derivation of in the NGC 7023 NW PDR
We limit the study to the field of view (FoV) presented in Fig. 1, which excludes the parts of the nebula that are closer than 20” from the star, and farther than 60”. The former have to be excluded because other features attributed to species such as C60 and C (Berné et al. 2013), and a strong thermal continuum due to hot dust grains (Berné et al. 2007) are present in the spectra. This contamination makes a clean analysis of the PAH emission with PAHTAT difficult. Similarly, at distances above 60”, the signal-to-noise ratio in the spectra becomes too low to use PAHTAT. In addition, regions too far from the star become optically thick in the mid IR (see Fig. 4 in Pilleri et al. 2012), which is also a challenge when using PAHTAT. We used the dataset obtained by Werner et al. (2004) with the IRS instrument aboard Spitzer. The data were previously analyzed by Berné et al. (2007) and Boersma et al. (2013), notably. The cube was obtained at a spatial resolution of 3.6” with a sampling of pixels of 1.8” and a spectral resolution of 80, over a spectral range ranging from 5.5 to 15 m. We applied the PAHTAT tool (Pilleri et al. 2012), which adjusts spectral templates of PAHs (notably cationic and neutral PAHs) to observations, to all spectra in the mid-IR cube to derive the integrated intensities of the PAH+ and PAH0 components (respectively and ) as well as their sum . The map is then obtained using and following Eq. 1.
A.3 Derivation of in the NGC 7023 NW PDR
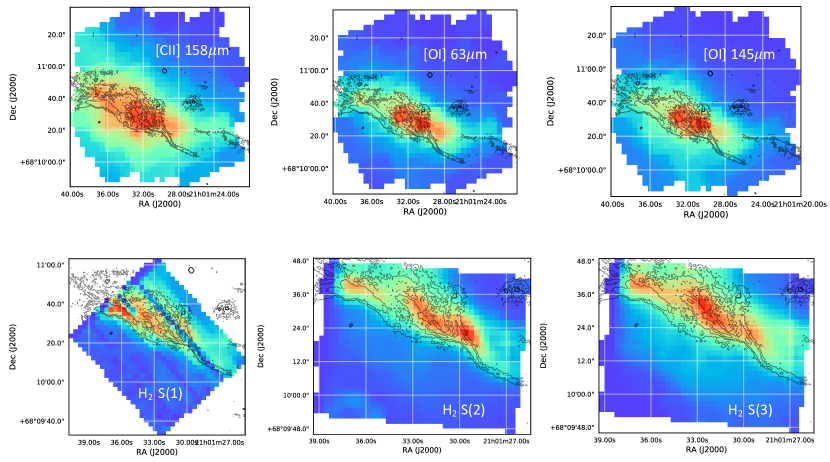
Gas cooling in the neutral ISM of galaxies is dominated by emission in fine-structure lines of [C ii] at 158 m, and of [O i] at 63 m and 145 m. In addition, emission in the rotational lines of H2, in the mid-IR, and emission in CO lines and other molecular species in the far IR can contribute. Bernard-Salas et al. (2015) provided a detailed study of gas cooling in the far IR in NGC 7023 with Herschel-PACS and SPIRE. We use their data for the [C ii] line at 158 m, and the [O i] lines at 63 and 145m (Fig. 12). We complement them with the 0-0 S(1), S(2), and S(3) rotational lines of H2 at 17.0, 12.3, and 9.7 m derived from Spitzer observations (Fig. 12). The emission maps for the S(2) and S(3) H2 lines were derived using PAHTAT (Pilleri et al. 2012) on the Spitzer-IRS SL data cube of the NGC 7023 NW PDR obtained by Werner et al. (2004). The map of the S(1) line integrated intensity was extracted using the CUBISM software (Smith et al. 2007a) on the LL data cube obtained by Werner et al. (2004). Overall, the gas line emission is largely dominated by the [O i] and [C ii] lines. H2 emission is important only at the dissociation front (up to 30 maximum of the total line emission), but overall it represents less than 10% of the gas cooling. In addition, cooling by H2 emission occurs in regions where gas heating is not dominated by PE heating, but rather by the formation of H2, and the collisional de-excitation of vibrationally pumped H2. Hence, we do not include H2 emission in the gas cooling budget, being then the sum of [O i] and [C ii] lines emission. As for the derivation of the map of , we limit the study to the FoV presented in Fig. 1, which excludes the parts of the nebula that are closer than 20” from the star, and farther than 60”. The map is then obtained from (Sect. A.2) and following Eq. 2.
Appendix B Derivation of and in a sample of sources.
B.1 Galactic photodissociation regions
We include data for the Orion Veil, which is the extended nebular region in front and south of the M42 region of Orion A, illuminated by the O6 star Ori-C . It is a diffuse nebula where cooling is largely dominated by [CII] emission (Pabst et al. 2021). All the data used here were kindly provided by C. Pabst. It consists in the table of values of obtained for this region totaling over 11 000 pixels, as well as the values of the [CII] line intensities derived from SOFIA observations. In addition, we use the Spitzer-IRAC m maps of the region provided by Megeath et al. (2015). Emission in this IRAC filter () is largely dominated by PAH emission, hence, in the absence of spectroscopic measurements, it can be used to evaluate . We have used the data of NGC 7023, where is obtained from spectroscopic analysis (Sect. A.2) as well as the IRAC maps, and found , with in W m-2 sr-1 and in MJy sr-1. This is used to derive from the IRAC data, and is then given by . The values presented in Fig. 3 and summarized in Table 2 are obtained by determining the median and first and 99th percentiles for , and median and 25th and 75th percentiles for . The used interval for is smaller than for because of the presence of a larger number of outlier values of .
We include data for the Orion Bar (also illuminated by Ori-C) from Bernard-Salas et al. (2012) for the cooling lines ([OII], [CII]) at position ( = 5:35:19.778, = -5:25:30.65). We derive a total intensity for the cooling lines (dominated by [OI] at 63 m) of W m-2 sr-1. We extract the value of at this position both from the IRAC data and available IRS spectroscopy, which respectively yields and MJy sr-1, which gives W m-2 sr-1. is found to fall in the range [0.07-0.11]. The range of values is derived from model results for the Orion Bar presented in Joblin et al. (2018), and corresponding to the range of AV, for which the calculated [OI] and [CII] emissions are the dominant cooling lines. Values of and for the Orion Bar are summarized in Table 2.
We include the IC 63 nebula, which is illuminated by the B0.5 star -Cas, and for this source is taken from Table 3 in Pilleri et al. (2012). The values for the cooling lines are taken from Andrews et al. (2018). The error on absolute intensities of the cooling lines is 30, including uncertainty on beam filling factor and instrumental error. The values of are from Pabst et al. (2021).
Ced 201 is a nebula formed by a runaway B9.5 star penetrating a molecular cloud in Cepheus. For this source, is also taken from Pilleri et al. (2012). The values for the cooling lines intensities are directly taken from the observations available in the Herschel Science Archive and extracted on the central spaxel of the PACS instrument. The same error as for IC 63 on the intensity, that is 30%, is considered. The values of are from Pabst et al. (2021).
The Horsehead is illuminated by the -Ori AB stars of spectral type O9.5V and B0.5V. The values for are also taken from Pilleri et al. (2012), and the values for the cooling lines are also from the observations available in the Herschel Science Archive and extracted in the central spaxel of PACS (error = 30%). To estimate the values of we use a FUV radiation field of , a temperature of K, and a gas density of cm-3 (Habart et al. 2005). This yields values in the range [30-1400].
B.2 The diffuse interstellar medium
For the diffuse interstellar medium, we use the IR emission intensity for PAHs deduced by Compiègne et al. (2011), that is and the cooling measured for the [CII] line from Boulanger et al. (1996), that is , which yields . We neglect the cooling from [OI] which is marginal for this low density medium. The average gas density ranges between 50 and 60 cm-3 (Boulanger 1999), and the gas temperature is K. The radiation field in the diffuse ISM is . With , this yields .
B.3 The Large Magellanic Cloud
B.4 Star-forming galaxies
For star-forming galaxies in the local Universe, we use the ratio of the [CII] emission to the integrated flux in the 5 to 10 m range provided in Helou et al. (2001). Following McKinney et al. (2021), we apply a factor 0.4 to this ratio to obtain , to account for the fact that PAH emission is responsible for only about 40 of the mid-IR emission of galaxies (Helou et al. 2001). The range of values of for the galaxies are taken from McKinney et al. (2021) using the same approach as for ULIRGs, which is based on the relationship of Díaz-Santos et al. (2017) and presented in the following section.
B.5 Ultra luminous infrared galaxies
McKinney et al. (2021) present measurements of the ratio between the PAH to [CII] emissions, which we adopt to derive . These authors also provide the values of in a large sample of ultra luminous infrared galaxies (ULIRGs). Using these data, kindly provided in electronic format by the authors, we derive the median values of and and 25th and confidence intervals (see values in Table 2). We compute from considering a temperature of 100 K, in agreement with estimated values for in these galaxies (Díaz-Santos et al. 2017), and using .
B.6 High-redshift galaxy GS IRS20
McKinney et al. (2020) provide a measurement of the ratio of the [CII] cooling line to the intensity of the PAH 6.2 m band in the GS IRS20 galaxy at a redshift . This value and associated error bar can be converted to using the calibration factor of 0.11 obtained by Smith et al. (2007b) on a large sample of nearby galaxies for the ratio of the 6.2 m band to total PAH emission. Additional uncertainty stems from the lack of precise measurement of the 11.2 m feature which implies a possible overestimation of the total PAH emission, of a factor of (McKinney priv. com.), which we include to obtain the maximum value of . The range of values for is obtained by using the observed value of the IR surface density of this galaxy given in McKinney et al. (2020), that is L☉kpc-2, converted to a value of using the law calibrated on ULIRGs by Díaz-Santos et al. (2017), and finally to a value of using a temperature of 100 K and .
B.7 Protoplanetary Disks
The disks for which we derived are Herbig Ae/Be objects, which show prominent PAH emission. Amongst the disks observed by ISO and presented in Acke & van den Ancker (2004), we selected those for which there are Herschel measurements of the gas cooling lines (Meeus et al. 2012). This represents a total of 10 objects, which are listed in Table 8. For some objects the [OI] 145 m and [CII] lines were not detected. However this is not an issue since the [OI] 63 m line is by far the most important cooling line in these objects, where the gas is dense and highly irradiated. The point presented in Fig. 3 represents the median value of from Table 8 and the 25th and 75th percentiles. The range of values for can only be obtained indirectly. We used the results of the detailed model for PAHs in Herbig Ae/Be stars developed by Visser et al. (2007). In particular, these authors show that over 80 of the PAH emission arises from regions beyond the inner 100 AU of the disk, and their Fig. 5 provides the values for , which range between and 104 in this region of the disk. For a gas temperature of K, this implies values for in the range . The used temperature value is a rough estimate, however this choice is not critical since depends only on .
| Object Name | [OI] 63 m | [OI] 145 m | [CII] 158 m | PAHs | |
|---|---|---|---|---|---|
| AB AUR | 851.2 | 44.60 | 51.00 | 17.9 | 0.0053 |
| HD 97048 | 1592.0 | 65.6 | 106.8 | 55.9 | 0.0029 |
| HD 100453 | 66.10 | - | - | 7.10 | 0.0009 |
| HD 100546 | 6043.0 | 194.7 | 203.8 | 92.2 | 0.0070 |
| HD 135344 | 47.90 | - | - | 1.09 | 0.0044 |
| HD 141569 | 245.3 | 24.90 | 11.40 | 2.60 | 0.0108 |
| HD 139614 | 44.50 | - | - | 10.4 | 0.0004 |
| HD 142527 | 53.80 | - | - | 2.80 | 0.0019 |
| HD 163296 | 208.4 | - | - | 4.10 | 0.0051 |
| HD 169142 | 91.50 | - | - | 10.16 | 0.0009 |
Appendix C Derivation of the ionization potentials, ionization yields and partition coefficient.
C.1 Ionization potentials
Following Wenzel et al. (2020), the values of the ionization potentials as a function of the charge Z, for , are given by:
| (30) |
where is the vacuum permittivity, e the elementary charge, and a the diameter of the molecule. The change of variable between a and the number of carbon atoms is given by (WD01):
| (31) |
For , we use (but see Appendix C.3).
C.2 Ionization yields
Several studies provide measurements of ionization yields for neutral PAHs (Jochims et al. 1996; Verstraete et al. 1990) and cationic PAHs (Zhen et al. 2016; Wenzel et al. 2020). From these studies, empirical laws have been derived to model the ionization yields. For neutral species (Z=0), we use the law derived by Jochims et al. (1996) (energy values in eV):
| (32) |
For the second ionization (), we use the law provided by Wenzel et al. (2020) :
| (33) |
where and is given by :
| (34) |
Finally, for anions (Z=-1), we use following Visser et al. (2007).
C.3 Threshold energy for electron detachment
In Sect. 3.1, we have assumed that at all energies. This approximation can be justified by the low values of both the electronic affinity and the effective photoabsorption cross section at low energies (see Fig. 5). Recently, Iida et al. (2021) have shown that electron detachment from the pentacene anion, (C22H), does not occur at the energy given by the electron affinity but is shifted to higher energies due to competition with radiative cooling. The authors estimated the survival rate of C22H to be 50% for an internal energy of 2.5 eV and 0% above 2.8 eV. We calculated the corresponding microcanonical temperature to be 775 and 824 K for 2.5 and 2.8 eV, respectively. The calculations use the density of states derived from a modified version of the Beyer-Swinehart algorithm (Mulas et al. 2006) and the harmonic vibrational frequencies from the Theoretical PAH Spectral Database. The electron affinity of cirumcoronene is calculated to be similar to that of pentacene (see Theoretical PAH Spectral Database). We therefore assumed that efficient electron detachment would occur for temperatures higher than 800 K, which correspond to internal energies higher than 6 eV for C54H. The calculations were performed with the same method as for C22H and using the harmonic frequencies from the NASA Ames PAH IR Spectroscopic Database (Bauschlicher et al. 2018; Ricca et al. 2012).
In Fig. 13, we compare the model results for the PAH heating rate and the photoelectric heating efficiency of as a function of the ionization parameter , which were obtained using for eV (and for E ¡ 6 eV) compared to the case in which for all energies. The values of the heating rate and efficiencies are lower by a factor at , by a few percent at , and are not affected at and above. This indicates that the choice of threshold for does not have a significant effect on the results of the model, especially for the large values of that correspond to the objects studied in this paper (Fig. 9).
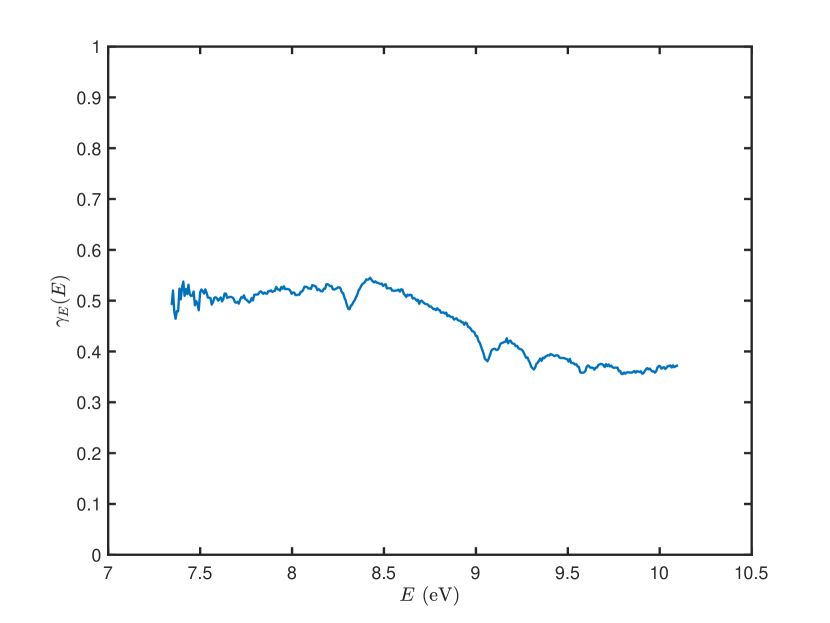
C.4 Partition coefficient
A value of has been adopted in the literature (Verstraete et al. 1990; Tielens 2005; Bakes & Tielens 1994), based on the photoelectron kinetic spectra obtained for specific incident photon energies on benzene by Terenin & Vilessov (1964). We provide a revised estimate for this parameter based on the photoelectron spectroscopy measurements presented for the coronene molecule in Bréchignac et al. (2014). In particular, these authors provide (see their Fig. 2), for a given photon energy absorbed in the range from 7.3 eV (IP of coronene) to 10.5 eV, the probability density function of kinetic energy of the photoelectrons , from which can be derived. Figure 14 shows the values of for coronene, from which is obtained by averaging over energies, yielding (68 confidence interval), in agreement with the classical value of 0.5.