Transient radio emission from low-redshift galaxies at revealed by VLASS and FIRST surveys
Abstract
We present the discovery of a sample of 18 low-redshift () galaxies with transient nuclear radio emission. These galaxies are not or weakly detected in the Faint Images of the Radio Sky at Twenty cm survey performed on 1993-2009, but have brightened significantly in the radio flux (by a factor of 5) in the epoch I (2017-2019) observations of Very Large Array Sky Survey (VLASS). All the 18 galaxies have been detected in the epoch II VLASS observations in 2020-2021, for which the radio flux is found to evolve slowly (by a factor of 40%) over a period of about three years. 15 galaxies have been observed in the Rapid ASKAP Continuum Survey, and a flat or inverted spectral slope between 888 MHz and 3 GHz is found. Based on the Sloan Digital Sky Survey spectra taken before the radio brightening, 14 out of 18 can be classified to be LINERs or normal galaxies with weak or no nuclear activity. Most galaxies are red and massive, with more than half having central black hole masses above M⊙. We find that only one galaxy in our sample displays optical flare lasting for at least two months, and a long decay in the infrared light curve that can be explained as the dust-heated echo emission of central optical flare, such as a stellar tidal disruption event. We discuss several possibilities for the transient radio emission and conclude that it is likely associated with a new-born radio jet triggered by short sporadic fueling of supermassive black hole. Such a scenario can be tested with further multi-frequency radio observations of these sources through measuring their radio flux variability and spectral evolution.
1 Introduction
Relativistic jets have been observed from stellar-mass black holes (10 M⊙) in Galactic X-ray binaries (XRBs), to supermassive black holes (SMBHs, M⊙) in the centers of most galaxies (Blandford et al., 2019). It has been established that the form of jet in an XRB is determined by the accretion state. During the low/hard state a steady, compact radio jet is produced, which is however significantly quenched in the high/soft state where disk thermal emission is dominant (Fender et al., 2004). As sources transition from low to high accretion state, isolated radio flares associated with the launch of relativistic ejecta have also been observed (Hjellming & Rupen, 1995; Bright et al., 2020). However, such a ubiquitous feature of jet production and quenching regulated by accretion states has rarely been seen in active galactic nuclei (AGN). This is because several criteria must be met by the source at once, and such AGNs are not common. First, the X-ray variability should be large enough in order to identify the accretion model transition (e.g., Liu et al., 2020; Ricci et al., 2021). Second, there must be a well-measured radio emission at different accretion states so that its evolution can be used to constrain the jet formation and quenching. Although “changing-look” AGN are ideal targets for such studies owing to large changes in accretion rates, no jet-related transient radio emission has been convincingly detected so far (Gezari et al., 2017; Yang et al., 2021). Furthermore, it remains mysterious why only a small fraction of AGNs (10%) are radio-loud associated with relativistic jets (e.g., Kellermann et al., 2016; Blandford et al., 2019). While Moravec et al. (2022) recently show that different radio AGN populations may follow an evolutionary track in the X-ray hardness-luminosity diagram similar to XRBs, it is difficult to directly correlate them with specific accretion state transitions, as their X-ray spectra are still dominated by coronal emission.
| Name | R.A. | Decl. | Obs. Date | Peak Flux | Int. Flux | log() | Obs. Date | Int. Flux | ||
|---|---|---|---|---|---|---|---|---|---|---|
| (VLASS) | (mJy/beam) | (mJy) | (erg ) | (FIRST) | (mJy) | |||||
| J0040+0823 | 10.1845 | 8.3978 | 0.214 | 2017-11-27 | 40.33 | 2009-04 | ||||
| 2020-09-19 | 40.43 | |||||||||
| J0154-0111 | 28.5486 | -1.1971 | 0.046 | 2017-09-27 | 38.95 | 1995-11 | ||||
| 2020-08-15 | 38.99 | |||||||||
| J0800+2928 | 120.0671 | 29.4714 | 0.045 | 2019-04-13 | 39.17 | 1993-05 | 0.44 | |||
| 2021-11-29 | 39.33 | |||||||||
| J0950+5128 | 147.6532 | 51.4772 | 0.211 | 2019-04-18 | 40.51 | 1997-04 | 0.41 | |||
| 2021-11-22 | 40.63 | |||||||||
| J0951+3703 | 147.9234 | 37.0596 | 0.236 | 2019-04-26 | 40.69 | 1994-07 | 0.42 | |||
| 2021-12-06 | 40.73 | |||||||||
| J1029+0436 | 157.4603 | 4.6161 | 0.085 | 2017-11-26 | 39.49 | 2000-02 | 0.44 | |||
| 2020-08-08 | 39.65 | |||||||||
| J1129+3900 | 172.4168 | 39.0129 | 0.287 | 2019-05-04 | 40.94 | 1994-08 | ||||
| 2021-12-06 | 40.92 | |||||||||
| J1217+2750 | 184.3733 | 27.8413 | 0.184 | 2017-11-24 | 40.36 | 1995-11 | ||||
| 2020-09-06 | 40.23 | |||||||||
| J1301+2127 | 195.3815 | 21.4636 | 0.087 | 2017-09-25 | 39.67 | 1998-10 | 0.43 | |||
| 2020-07-16 | 39.62 | |||||||||
| J1337+3857 | 204.4213 | 38.9587 | 0.243 | 2017-10-14 | 40.36 | 1994-08 | 0.68 | |||
| 2020-09-17 | 40.21 | |||||||||
| J1407+1247 | 211.9427 | 12.7889 | 0.126 | 2019-04-17 | 39.91 | 1999-12 | ||||
| 2021-10-01 | 39.91 | |||||||||
| J1409+5420 | 212.4675 | 54.3485 | 0.174 | 2017-12-01 | 40.17 | 1997-05 | 0.42 | |||
| 2020-09-01 | 40.16 | |||||||||
| J1437-0033 | 219.3984 | -0.5567 | 0.180 | 2019-05-01 | 40.25 | 1998-08 | 0.43 | |||
| 2021-10-24 | 40.28 | |||||||||
| J1558+1412 | 239.6987 | 14.2037 | 0.034 | 2019-04-11 | 39.38 | 2000-01 | 0.40 | |||
| 2021-11-15 | 39.35 | |||||||||
| J1610+0606 | 242.5899 | 6.1162 | 0.156 | 2019-03-18 | 40.05 | 2000-02 | 0.45 | |||
| 2021-10-17 | 39.96 | |||||||||
| J1642+3346 | 250.6908 | 33.7777 | 0.136 | 2017-10-06 | 40.02 | 1994-06 | ||||
| 2021-09-16 | 39.83 | |||||||||
| J1646+4227 | 251.5293 | 42.4604 | 0.050 | 2019-05-04 | 39.22 | 1995-10 | 0.40 | |||
| 2021-11-14 | 39.18 | |||||||||
| J2301+0544 | 345.4323 | 5.7387 | 0.140 | 2017-10-23 | 40.08 | 1995-10 | ||||
| 2020-08-12 | 40.07 |
In the past two decade, time-domain surveys have led to the discovery of a population of energetic nuclear transients in otherwise quiescent galaxies. They are mostly due to the stellar tidal disruption events (TDEs) by SMBHs. As the stellar debris gets accreted effectively, a fraction of accretion power could be converted into outflow, and under certain conditions producing a relativistic jet, which can be detected at radio wavelengths (e.g., van Velzen et al., 2011; Zauderer et al., 2011). Sw J1644+57 is the first and prototype TDE displaying a relativistic jet (Burrows et al., 2011), from which a luminous and variable radio emission is readily detected after the stellar disruption (Berger et al., 2012), presenting a natural SMBH analogy with state changes of XRBs. However, despite extensive searches, radio observations of other TDEs have not yet produced conclusive detections of powerful jet as that in Sw J1644+57 (Bower et al., 2013; van Velzen et al., 2013; van Velzen et al., 2016; Dai et al., 2020; Alexander et al., 2020). It is suggested that the non-relativistic outflows may be more ubiquitous than jets in TDEs (Alexander et al., 2016, 2017; Anderson et al., 2020; Mohan et al., 2021), but due to insufficient sensitivity of radio observations, most of them cannot be detected (van Velzen et al., 2016). The current lack of detections can also be explained by the delayed onset of the radio emission (Horesh et al., 2021a; Horesh et al., 2021b).
Recent radio surveys such as Caltech-NRAO Stripe 82 Survey (CNSS, Mooley et al., 2016) and Very Large Array Sky Survey (VLASS, Lacy et al., 2020) have opened a new window to select TDE candidates as well as other types of nuclear radio transients. Using the CNSS data, Anderson et al. (2020) presented the discovery of the TDE candidate CNSS J0019+00, through the detection of its transient radio emission, possibly originating from the interaction of the non-relativistic outflow with the surrounding medium. Ravi et al. (2021) reported the discovery of the fading radio transient FIRST J1533+2727, which can be described as the long-lasting radio afterglow of a TDE. On the other hand, brightened radio emission has been found in a sample of galaxies and quasars, by crossmatching the data taken from the Faint Images of the Radio Sky at Twenty cm survey (FIRST, Becker et al., 1995; Helfand et al., 2015) with either CNSS (Kunert-Bajraszewska et al., 2020; Wołowska et al., 2021) or VLASS (Nyland et al., 2020). Since the hosts for most of these radio transients show powerful AGN activities in the preflare optical spectra, their transient radio emission has been explained as the transition from radio-quiet to radio-loud state, possibly associated with a new-born jet. Follow-up multi-frequency VLA observations suggested that the radio emission is compact with a typical source size less than 01 (1 kpc), and characterized by a curved radio spectral energy distribution (SED) peaking at 5-10 GHz (Nyland et al., 2020; Wołowska et al., 2021), making these sources to be consistent with the population of young radio AGNs (O’Dea & Saikia, 2021, and references therein).
In this paper, we report the identification of a sample of nearby galaxies ( ) with nuclear radio transients using the VLASS data. Section 2 describes observations and data, and Section 3 presents the selection of radio transients. The host galaxies and variability properties at optical and mid-infrared (MIR) bands are analyzed in Section 4. In Section 5, we present the discussion on the possible origins of transient radio emission. Section 6 is the summary of our findings.
2 Observation and Data
The FIRST survey was conducted at a frequency of 1.4 GHz, with an angular resolution of 5 and imaging rms down to 130 Jy/beam in the deepest footprint. It covers 10,575 , approximately 25 of the total sky area. The first epoch FIRST survey was carried out during the period of 1993-2004, and extended to cover larger sky region with observations performed between 2009 and 2011. Given the coordinates of sources of interest, the image cutouts can be extracted from the FIRST data archive111http://sundog.stsci.edu/.
VLASS is a S-band (2–4 GHz) multi-epoch legacy survey aiming at to detect various types of extragalactic radio transients, such as TDEs, accretion state changing AGNs, and afterglows of off-axis -ray bursts and core-collapse supernova (Lacy et al., 2020). The angular resolution of VLASS is about 25, and it is currently surveying the entire northern sky with Dec - (33,885 ). VLASS observations are designed to map the same survey area three times, each separated by approximately a period of 32 months. Each VLASS epoch achieves an 1 sensitivity of 120 Jy/beam, which is comparable to the depth of FIRST. The combination of images taken from three-epoch VLASS observations will achieve an 1 sensitivity of 70 Jy/beam, making it the deepest wide-field survey at 3 GHz after the final implementation of survey plan. The VLASS program has began in 2017 and recently completed its first epoch observations in 2019 (epoch I). The preliminary “QuickLook” images have been publicly released on the NRAO website222https://archive-new.nrao.edu/vlass/quicklook/, in order to help the scientific community to timely access the VLASS data. Gordon et al. (2021) have produced the source catalog from the epoch I VLASS “QuickLook” images using the Python Blob Detector and Source Finder (PyBDSF, Mohan & Rafferty, 2015), consisting of individual radio sources with a peak flux of mJy/beam. The catalog and an associated User Guide are available at the CIRADA website333https://cirada.ca/catalogues..
3 Selection of radio transients
The main goal of present study is to select galaxies that have recently brightened in radio, i.e., bright radio transient sources (RTS) in VLASS but without counterparts in the previous FIRST catalog (mJy). We first cross-matched the FIRST and epoch I VLASS catalog (Gordon et al., 2021) to search for VLASS sources that are not detected in FIRST, within a matching radius of 5. We restricted the sample to include only sources that have a 3 GHz flux of 5 mJy in the VLASS catalog. This ensures that the variability amplitude is at least by a factor of 5 in comparison with the FIRST upper limits, and also helps to eliminate spurious sources. Gordon et al. (2021) suggested that the detected radio components with a peak flux above 5 mJy/beam tend to be more reliable in the VLASS “QuickLook” images (Quality_flag == 0 in the catalog). Then we cross-matched the sample with the SDSS spectroscopic catalog, and required all objects to be nearby at in order to give efficient classifications of sources using the Baldwin, Philips and Terlevich (BPT) diagram if emission lines are detected. VLASS sources have been inspected visually to ensure that they are not artifacts such as extended emission from brighter foreground galaxies, image artifacts, and side lobes due to imperfect complex gain solutions. This leaves a total of 20 VLASS sources.
Since the present work aims to investigate the transient radio emission that is likely associated with SMBH accretion, we need to exclude known supernova explosions. We cross-correlated with the open supernovae (SNe) catalogue compiled by Guillochon et al. (2017)444The catalog is constructed by the data presented in the SNe literature as well as other web-based catalogs, and available on the website https://sne.space, and updated to include all supernovae (and candidates) reported up to Jan 2022. which includes 36,000+ supernovae and related candidates. The cross-match results in two known supernovae, J122247.59+053624.3 (SN 2012ab, Bilinski et al., 2018) and J131341.47+471756.7 (PTF11qcj, Palliyaguru et al., 2019). Note that the VLASS epoch I data for the latter SNe J131341.47+471756.7 has been reported in Stroh et al. (2021). After removing the two known supernovae, our final sample consists of a total of 18 galaxies with transient radio emission, for which detailed analysis will be presented in this paper.
We used IMFIT task in the CASA software (version 5.3.0, McMullin et al., 2007) to measure the integrated and peak flux for each galaxy. The ratio of integrated flux to peak flux is in the range 0.93–1.25, with a median value of 1.02, suggesting that most, if not all, radio emission is unresolved and compact at the resolution of 25. We checked that the positional offsets of radio sources relative to the optical centers obtained from the SDSS photometry are in the range 008–041, with a median offset of 02, Note that the positional offsets are comparable to the astrometric accuracy of VLASS (04, Lacy et al., 2020) and that of SDSS (015, York et al., 2000), implying that the radio emission originates from a region close to the galactic center. Although the 18 sources are not listed in the FIRST catalog, in order to secure their radio faintness during the FRIST observations, we used the CASA software to measure the flux of each source in the FIRST images. Given the positions of radio components detected by VLASS, we found that 7 sources are detectable at with a flux in the range 0.46–0.97 mJy555Note that the CLEAN bias correction (White et al., 1997) was not considered in calculating the source detection significance. , while only upper limits can be obtained for the remaining 11 sources, i.e., the detection significance is . This confirms that the selected VLASS sources are indeed faint (1 mJy) during the FIRST observations. All the 18 sources have also been detected in the VLASS epoch II observations. Considering the flux errors (including the 5% uncertainty in the flux calibration, Lacy et al., 2020), the flux densities between the two VLASS observations are consistent with each other for 10 sources (Figure 1). The radio flux has been found to increase moderately (within a factor of 50%) in four galaxies, while it declines in four galaxies with the variability amplitude in the range . The source name, radio coordinate, redshift, VLASS observation date(s) and radio flux measurements, FIRST observation date and flux measurements are reported in Table 1. The FIRST, VLASS epoch I and epoch II images are shown in Appendix A. Note that the amount of radio flux variations between the two VLASS observations is consistent with other samples of radio transient sources (Nyland et al., 2020; Wołowska et al., 2021), as shown in Appendix B.
| Name | Peak Flux | Int. Flux | Rms | |
| (mJy/beam) | (mJy) | (mJy/beam) | ||
| J0040+0823 | 1.78 | 1.71 | 0.64 | 0.88 0.37 |
| J0154-0111 | 2.42 | 2.84 | 0.33 | 0.74 0.12 |
| J0800+2928 | 5.23 | 4.99 | 0.22 | 0.54 0.05 |
| J0951+3703 | 0.57 | 0.19 | 2.31 | |
| J1029+0436 | 4.96 | 6.02 | 0.38 | 0.11 0.08 |
| J1129+3900 | 1.07 | 1.07 | 0.34 | 1.93 0.30 |
| J1217+2750 | 2.88 | 2.93 | 0.35 | 0.82 0.11 |
| J1301+2127 | 1.57 | 1.75 | 0.38 | 1.35 0.22 |
| J1337+3857 | 3.67 | 6.43 | 0.53 | 0.11 0.14 |
| J1407+1247 | 2.20 | 2.17 | 0.25 | 0.87 0.10 |
| J1437-0033 | 2.40 | 3.74 | 0.46 | 0.80 0.17 |
| J1558+1412 | 1.50 | 2.67 | 0.36 | 2.43 0.22 |
| J1610+0606 | 1.29 | 0.43 | 1.19 | |
| J1642+3346 | 1.95 | 2.78 | 0.36 | 1.03 0.17 |
| J2301+0544 | 2.73 | 3.86 | 0.49 | 0.84 0.16 |
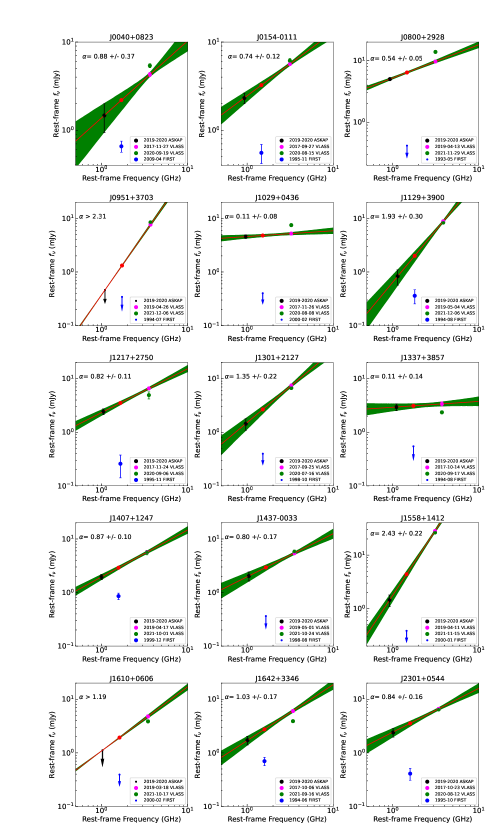
We also searched for archival data at 888 MHz from the Rapid ASKAP Continuum Survey (RACS, McConnell et al., 2020). The first epoch RACS observations were performed between 2019 April 21 and 2020 June 21. We found 15 out of 18 sources were observed at 888 MHz, whose ASKAP images are shown in Appendix C. We then measured the integrated and peak flux, following the same procedures described above, and found 13/15 sources are detected. For two non-detections, we report the 3 upper limit on the flux, based on the map rms at the off-source position, which is in the range 190–430 Jy/beam. Considering that the 3 GHz fluxes between the two epoch VLASS observations did not vary dramatically, the radio SED was likely evolving slowly. Therefore, the RACS data at 888 MHz can be considered quasi-simultaneously as the VLASS ones, which can be used to quantify radio spectral slopes below 3 GHz. We used the VLASS data that are close to the RACS observing date for each source to determine the rest-frame radio slope between 888 MHz and 3 GHz. The results are shown in Figure 2. We found that the radio spectral index () is in the range 0.11–2.43, with a median of 0.87. With the radio spectral index, we extrapolated the 3 GHz flux to that at 1.4 GHz for 15 galaxies, and found it is a factor of higher than the FIRST flux, confirming the transient nature of radio emission. Details on the RACS flux measurements and derived radio spectral index () can be found in Table 2.
| Name | log | log | Lick | EW(Hα) | log([N ii]/) | log([O iii]/) | log | log (/) | Type | |
| () | () | [Å] | [Å] | |||||||
| J0040+0823 | 11.84 | 9.086 | 2.865 | 2.649 | 1.237 | 0.121 | 0.272 | -3.71 | -0.61 | LINER |
| J0154-0111 | 10.83 | 8.761 | 2.687 | -1.858 | 3.376 | 0.117 | -0.157 | -3.97 | -1.10 | LINER |
| J0800+2928 | 10.05 | 5.619 | 1.940 | 4.678 | 1.717 | 0.102 | 0.922 | -0.51 | -1.24 | Seyfert |
| J0951+3703 | 11.50 | 8.500 | 3.790 | -1.919 | 5.349 | -0.345 | -0.068 | -2.34 | -1.75 | Composite |
| J1029+0436 | 10.95 | 8.035 | 2.809 | -2.970 | 2.879 | -0.025 | 0.047 | -3.05 | -0.63 | LINER |
| J1129+3900 | 11.72 | 8.277 | 3.524 | -0.873 | 2.478 | 0.166 | 0.428 | -1.25 | -2.21 | LINER |
| J1217+2750 | 11.16 | 8.026 | 2.791 | -1.466 | 2.136 | Passive | ||||
| J1301+2127 | 10.16 | 6.098 | 1.519 | 2.522 | 20.505 | -0.406 | -0.252 | -0.89 | -1.14 | Starforming |
| J1337+3857 | 11.71 | 8.253 | 2.443 | 0.075 | 0.919 | Passive | ||||
| J1407+1247 | 11.37 | 7.671 | 2.727 | -2.290 | 1.223 | 0.160 | 0.396 | -1.76 | -1.57 | LINER |
| J1409+5420 | 11.11 | 7.893 | 2.906 | -1.855 | 2.624 | 0.023 | 0.208 | -2.69 | - | LINER |
| J1437-0033 | 11.79 | 8.418 | 3.156 | -0.868 | 0.752 | 0.031 | 0.161 | -4.20 | 0.43 | LINER |
| J1558+1412 | 11.03 | 7.842 | 2.405 | -0.517 | 2.381 | -0.038 | 0.252 | -2.62 | -1.55 | LINER |
| J1610+0606 | 11.22 | 7.724 | 3.195 | -0.425 | 1.693 | 0.081 | 0.554 | -1.29 | -2.06 | Seyfert |
| J1642+3346 | 11.52 | 7.618 | 2.680 | -0.303 | 5.463 | -0.196 | -0.036 | -1.59 | -1.63 | Composite |
| J1646+4227 | 9.95 | 6.415 | 2.043 | 1.846 | 11.077 | -0.393 | -0.351 | -1.38 | - | Starforming |
| J2301+0544 | 11.55 | 8.433 | 2.839 | 0.072 | 4.526 | 0.284 | 0.773 | -0.77 | -3.16 | Seyfert |
Note- †The two sources are not covered by ASKAP observations, so we used the median value of to derive the rest-frame 1.4 GHz flux hence jet power (e.g., Equation (4), Wołowska et al., 2021, see also Section 5.4).
4 Results
4.1 Host galaxy properties
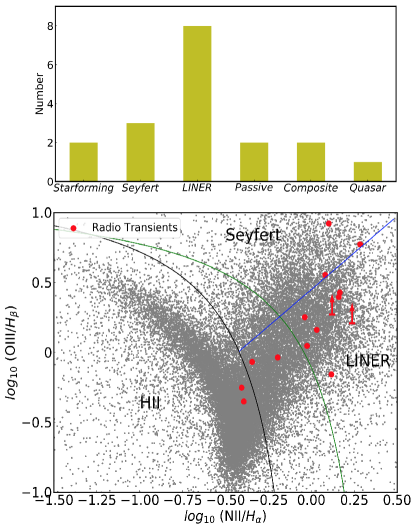
In order to understand the nature of the VLASS RTS, it is useful to assess the nuclear activity of these galaxies prior to the radio brightening detected by VLASS. Along with the SDSS data release, there are several works to provide value-added catalogs of the galaxy intrinsic properties666https://www.sdss.org/dr12/spectro/galaxy_portsmouth, and https://www.sdss.org/dr12/spectro/galaxy_mpajhu. We used the MPA-JHU SDSS spectroscopic catalog for our following analysis. After cross-matching with the catalog, we found that there are 15 out of 18 galaxies with emission-line flux measurements (or upper limits). The remaining three are not listed in the MPA-JHU catalog, likely because the emission lines are too weak to be detected. We carried out detailed spectral fittings to measure any emission lines if present, and the results are shown in Appendix D. Two sources, J1217+2750 and J1337+3857, have no detectable emission lines, while only upper limits can be obtained on the H lines for J0040+0823 and J1409+5420. The line ratios of [N ii]/ and [O iii]/ are listed in Table 3. Note that one object, J0950+5128, shows clearly the spectral features of quasars (Figure A1 in Appendix A), and is listed in the quasar sample that have transitioned from radio-quiet to radio-loud (Nyland et al., 2020). Since the optical spectrum of J0950+5128 is dominated by quasar emission, making it a challenge to study the host galaxy and its stellar population, we do not consider it in our following analysis relevant to the host properties (Figures 4, 7 and 9). Using the emission-line flux ratios, we performed a diagnosis of the nuclear activity by classifying the sample into different subclasses according to their location on the BPT diagram (Kewley et al., 2001), as shown in Figure 3 (lower panel). Among 15 galaxies with emission-line measurements, three are classified as Seyfert 2 galaxies, two as star-forming galaxies, eight as low-ionization nuclear emission regions (LINERs), and two as composites. For the remaining two objects with non-detections of emission lines, we consider them to be passive galaxies. It should be noted that a fraction of LINERs may actually be ionized by evolved stars or radiative shocks rather than by AGNs, as LINER-like spectra often appear in off-nucleus regions of normal galaxies as well (e.g., Cid Fernandes et al., 2011; Zhang et al., 2017). In summary, in addition to one quasar, only 3 out of 17 galaxies in our sample (16%) display Seyfert-like narrow emission-line ratios, indicating that most, if not all, have no strong nuclear activities in the SDSS optical spectra (Figure 3, upper panel). Since the narrow emission-lines are expected to originate from regions at kpc scales, the AGN classification in principle is not biased against obscured type 2 sources (e.g., Kauffmann et al., 2003).
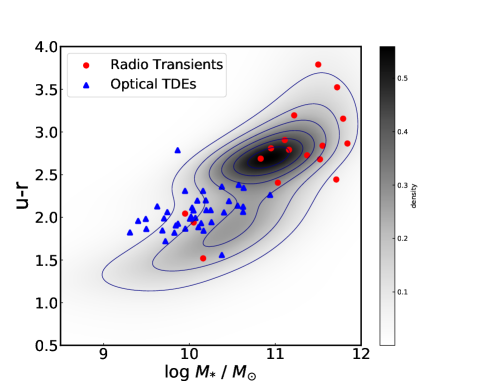
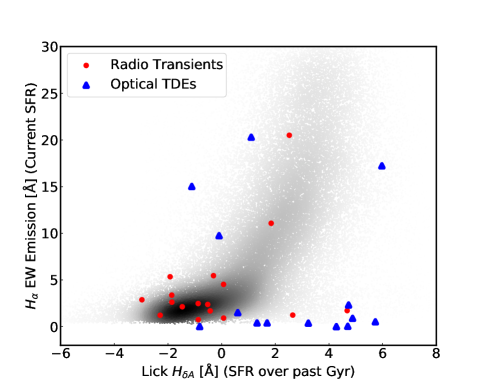
Having established that most of the RTS in our sample have a weak AGN component, we now investigate the host galaxy properties (excluding J0950+5128) in order to further understand the origin of the radio emission. The MPA-JHU catalog has also provided the measurements of stellar mass () through SED fitting with stellar population models. However, their fittings only used the SDSS optical photometry (up to 9000Å), and may introduce bias in estimating stellar masses. Hence, we used the publicly released catalog with the SED fitting results by combining the SDSS and WISE photometry (Chang et al., 2015), covering a broader wavelength range of m. We calculated the colors based on the rest-frame -band and -band luminosity, for which the dust extinction and correction have been taken into account from the best-fit SED for each galaxy. For three galaxies that are not presented in the catalog of Chang et al. (2015), we derived their host stellar masses by fitting the SDSS and WISE photometry using the CIGALE code (Appendix D). It is well known that galaxies show a bimodal distribution in the color-magnitude diagram, which are mainly divided into a red sequence and blue cloud according to the colors, with a green valley in between (e.g., Strateva et al., 2001; Bell et al., 2004). Figure 4 (left) shows the extinction-corrected, rest-frame color versus total stellar mass for our galaxies (filled red circles). The SDSS spectroscopic sample from Chang et al. (2015) are overlaid in contours for comparison. It can be seen that the RTS host galaxies are dominated by the red and massive galaxies, with the majority (14/17) falling into the locus of red sequence.
Since the colors of galaxies are affected by both the current star-formation rate (SFR) and star formation history, it has been proposed that the H equivalent width (EW) and Lick H index are useful to quantify the host properties according to the star-formation history (French et al., 2016). The H EW can be used as a tracer for the current star-formation history on timescales of 10 Myr, while the H index can probe star-formation on much longer timescales of 1 Gyr. Figure 4 (right) shows the H EW versus Lick H index for SDSS galaxies from the MPA-JHU catalog, and RTS in our sample. Apparently, the majority sources in our sample (13/17) fall into the region with little-to-no H emission and low H. To encompass the 13 sources, we defined the selection cut H and H EWÅ. This cut includes 242249 SDSS galaxies, or a fraction of 32%. This indicates that the host galaxies for the majority of RTS are characterized by low recent specific star formation rate with relatively old stellar population, consistent with normal massive galaxies in the red sequence. In comparison, the host galaxies of optically-selected TDEs (filled blue triangles in Figure 4) appears to show different stellar properties, and we will discuss the implications in detail in Section 5.2.
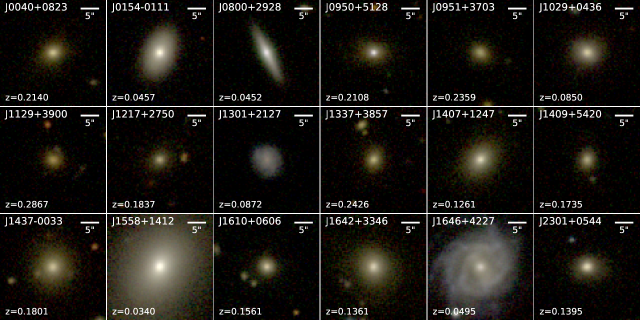
In Figure 5 we show cut-outs of the SDSS color gri images for the 18 RTS galaxy hosts. We include the quasar J0950+5128 for the morphology analysis, as it is resolved in the SDSS imaging. Galaxies can be classified as elliptical-like or disk-like based on the concentration index , where and is the radii containing 90% and 50% of the Petrosian flux for a given band, respectively, and the likelihood ratio of the de Vaucouleurs’ model fit to that of the exponential model. Elliptical-like early-type galaxies can be selected with in band, and the likelihood ratio 1.03 (Bernardi et al., 2003). Using the measurements derived with the SDSS pipeline, we found 16 out of 18 galaxies (88%) meet the criterion for early-type galaxies, which can also be better fitted by a de Vaucouleurs profile. On the other hand, we cross-matched with the Galaxy Zoo DR1 catalog (Lintott et al., 2011) and found 14 matched galaxies. Among the 14 galaxies, 10 are more likely elliptical (debiased probability ) based on visual classifications, two are spiral galaxies and two are ambiguous. Thus, we conclude that more than 70% of the sample are early-type galaxies, consistent with the results of stellar population analysis.
4.2 Variability properties at optical and MIR bands
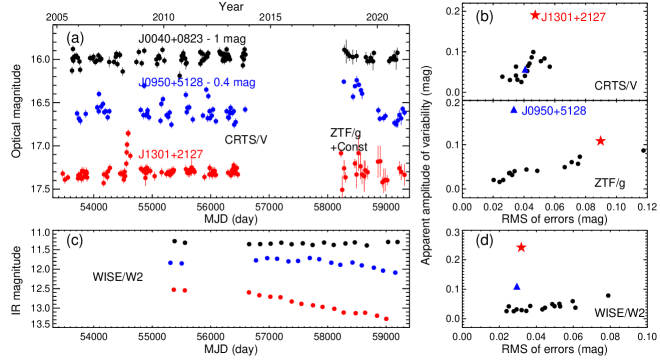
We now check if there are optical flares associated with these radio transients. We collected optical light-curve (LC) data from Catalina Real-time Transient Survey (Drake et al., 2009, CRTS) and Zwicky Transient Facility (Bellm et al., 2019, ZTF). Among the 18 objects in the sample, 16 were observed by both CRTS and ZTF, and one (J1029+0436) was only observed by CRTS. The remaining one (J1646+4227) was not observed by either CRTS or ZTF. For the CRTS data, the V-band LCs observed from 2005 to 2013 are public777Data can be obtained from Catalina survey data releases 2 (http://nesssi.cacr.caltech.edu/DataRelease/). And for ZTF, the LCs in g, r and i bands from 2018 are public888Data can be obtained from NASA/IPAC InfRared Science Archive (https://irsa.ipac.caltech.edu/applications/Gator/). As can be seen in Figure 6(a), the quasar J0950+5128 shows stochastic variability with amplitude of 0.2 magnitude, which is consistent with typical variability amplitude found in AGN (Caplar et al., 2017). By visually inspecting the optical LCs, we found that for most of the non-quasar galaxies, the LCs are roughly consistent with flat lines with noise, and do not show flares with amplitude more than 0.2 magnitude. In Figure 6(a) we show the LC of the source J0040+0823 as an example. The only non-quasar galaxy that shows obvious variability is J1301+2127, whose LC is also displayed in Figure 6(a). J1301+2127 shows a flare between April and July 2008. The peak of the flare was recorded in May 2008, when the galaxy was brightened by 0.5 magnitude compared to the pre-flare level. In order to check the reliability of the variations, we calculated the “apparent” amplitude of variability for our sample, and compared it with the typical error level of optical photometry. Here the “apparent” amplitude of variability means that any variations caused by photometric errors has not been removed. For the ZTF data, the amplitude of variability is calculated as the standard deviation of the magnitudes from the monthly-binned g-band LC. For the CRTS data, it is calculated similarly in a two-years-long period with the greatest amplitude. The typical error level is estimated using the root mean square (RMS) value of the photometric errors. As shown in Figure 6(b), for most non-quasar galaxies the amplitudes of variability are comparable or less than the typical errors, except for J1301+2127. The analysis supports the results from visual inspection. J1301+2127 is classified as a star-forming galaxy in the preflare optical spectrum. The optical flare in J1301+2127 lasts for several months, which is similar to those of many TDEs (van Velzen et al., 2021). In summary, among the 18 galaxies with transient radio emission, only one shows unambiguous evidence of optical flare.
It is possible that optical flares (if present) could be missed occasionally due to the low cadence of optical photometric observations. We estimate the probability that a hypothetical TDE causing the radio flare is captured by the optical photometric observations. The observational cadence of the CRTS is: during the 9-year period from 2005 to 2013 (8 years for a few sources), monitoring lasted for 4–9 months in each year (the average value is 5.8 months for our sample); in each month there are 1–3 observing nights; in each night there are 4 exposures. By combining the data taken from the 4 exposures, the photometric error is 0.03–0.06 magnitude for our sample. As a TDE typically causes a brightening with 0.2–1 magnitude near the peak time (van Velzen et al., 2021), we estimated that a TDE would be detected as long as there are CRTS observations in the month when the TDE peaks. There are 15 non-quasar galaxies in our sample that were observed by CRTS. For each galaxy, there are 51 months on average covered by CRTS observations. If assuming that the TDE peak time is uniformly distributed between the FIRST and the epoch I VLASS observations, which have a time interval of 249 months on average, the probability of a TDE being captured by CRTS is 20.5%. The expected number of optical flares detected by CRTS in these 15 galaxies can be estimated to be 3.1. For the ZTF survey the observation cadence is: starting from March 2018, the monitoring lasted for 9–10 months in each year; in each month, there were 10–30 observational nights; and in each night there was one exposure in each band. The photometric error of each observation is 0.02–0.12 magnitude for our sample. Thus the cadence of single observation or observations in several consecutive nights is sufficient to detect a TDE peak lasting for one month. We then calculated the probability that the TDE peak is captured by ZTF survey as we did for the CRTS observations. There are 7 non-quasar galaxies in our sample which were observed during the period between ZTF and epoch I VLASS observations. The summed duration of the ZTF observations is 11 months on average. Thus the probability of a TDE being detected is 4.4% (11/249), and the expected number in these 7 galaxies is 0.3. By adding the detection probability in the CRTS and ZTF light curves, the expected number of optical flares recorded by the two surveys is 3.4. Note that the number is likely to be underestimated. This is because the optical flare of a TDE typically lasts for several months, and there is a possibility that its rising or falling phase can be recorded although the peak time is missed. In addition, if the radio emission lasts for less than 10 years, as expected for many optical TDEs (e.g., Alexander et al., 2020), the TDE occurrence time can be better constrained to be after 2004 for 0.3, a period with more overlap with the optical photometric observations. This will also increase the probability of TDE flares in our sample being detected by optical surveys. However, only one optical flare (J1301+2127) is actually detected. Therefore, the low detection rate of optical flares cannot simply be explained by the low cadence of the CRTS or ZTF observations.
An optical flare may also be missed due to dust obscuration. Fortunately, dust heated by a central UV/optical flare can reradiate in the infrared (IR), causing an IR flare as well as echo emission (e.g., Mattila et al., 2018; Jiang et al., 2021a). The IR flares caused by TDEs usually lasts for 1–10 years with amplitudes of 0.2–2 magnitudes (e.g., Jiang et al., 2016; Jiang et al., 2017; Jiang et al., 2019, 2021b; Dou et al., 2016, 2017). We searched for IR flares using the IR data in the WISE band (at 4.6 m). In a way similar to what we did for optical data, we calculated the variability amplitudes as well as the typical errors, as shown in Figure 6(c) and (d). For most of non-quasar object the amplitudes of variability are comparable or less than the errors, and the only galaxy with apparent IR variability amplitude larger than 0.2 magnitude is J1301+2127. The long decaying IR emission in J1301+2127 is similar to those of TDE candidates with extreme coronal emission lines (Dou et al., 2016). For those galaxies without an optical flare, there is also no significant IR variation as the amplitudes of variability are less than 0.1 magnitude. Note that the cadence of WISE observations is once every six months and the photometric errors are 0.02–0.08 magnitudes, which are sufficient to detect the IR echoes if it present. Therefore, we did not find evidence of the dust-heated IR echoes from central optical flares for most our galaxies.
5 Discussion
We have identified 18 galaxies at that display transient radio emission by comparing between the radio flux observed with VLASS and the upper limit with FIRST. It should be noted that the sample, by selection, is only sensitive to the long-term radio variability properties on time scales of years to decades, and the cadence of observations is very sparse. We have carefully inspected the radio components detected in the epoch I VLASS observations, and found that they are not spurious sources. The result is supported by the detections in the epoch II VLASS observations for all sources in the sample. Long-term radio variabilities could have different physical processes, such as a supernova (SNe) explosion, intrinsic variability of a radio-quiet AGN, sporadic accretion onto a SMBH due to instability in an accretion disk or tidal disruption of a star, or a recently launched young jet. We will discuss these scenarios in detail.
5.1 Stellar explosions
Radio emission has been detected in about 30 per cent of the nearby SNe sample ( Mpc) at a few days to several years since the explosion (Bietenholz et al., 2021). A recent study on the luminous late-time radio emission from SNe detected by VLASS has been presented in Stroh et al. (2021). As described in Section 3, we have cross-correlated with the open SNe catalogue compiled by Guillochon et al. (2017) and found two matches in our initial sample of 20 galaxies. After excluding the two known SNe, the radio luminosities of our sources are high, with erg , which are comparable to the most luminous Type IIn SNe (Stroh et al., 2021), for which the host galaxies are blue with active ongoing star-formation. This is not compatible with the fact that most of our galaxies have red colours and current star-formation rates are low. The high radio luminosities rule out the possibility of SNe for the transient radio emission. The contribution to the observed radio variability by gamma-ray bursts (GRBs) seems also unlikely, as typical variability timescale of radio emission for GRBs is around 1-2 weeks (Pietka et al., 2015). Long GRBs can have a radio luminosity as high as erg (Stroh et al., 2021), but decay by more than an order of magnitude within several years since explosion, which is inconsistent with lack of significant flux variability of our sources between two-epoch VLASS observations (50%, Figure 1). Furthermore, the effect of interstellar scintillation causing the radio variability can be ruled out either, as the flux variability due to interstellar scintillation is at a level of 30%–40% (Nyland et al., 2020), much lower than the radio brightening by a factor of 300% between FIRST and VLASS observations (Section 3).
5.2 Tidal Disruption Events
Recent time-domain surveys have discovered dozens of TDEs in the centers of otherwise quiescent galaxies (Gezari, 2021), but only 10% are accompanied by radio flares (Bower et al., 2013; van Velzen et al., 2013; Alexander et al., 2020), the nature of which is still poorly understood (Horesh et al., 2021a; Horesh et al., 2021b). So far there are two TDE candidates that have been solely identified at the radio wavelengths (Anderson et al., 2020; Ravi et al., 2021). It is possible that some of the RTS in our sample are associated with TDEs. However, as shown in Figure 4, we found the red colors and large host stellar masses for the host galaxies of RTS. Based on the TDE sample selected from the ZTF survey and known UV/optical-selected TDEs in literature, van Velzen et al. (2021) show that the TDE host galaxies are preferred to locate within the green valley region, where the galaxies are expected to be transitioning from star-forming to quiescent. A Kolmogorov–Smirnov (K-S) test for the stellar mass distribution between RTS and optical TDEs results in a value of , suggesting that they are not drawn from the same population999 The estimate on the true value might be affected due to the small sample sizes used.. A similar result can be obtained from the K-S test on the distribution in the rest-frame colors, with a value of . It has been found that UV/optical-selected TDEs are over-represented by post-starburst galaxies 101010The central concentration of A stars in post-starburst galaxies could serve to enhance the TDE rate (Yang et al., 2008; Stone & van Velzen, 2016).. Figure 4 (right) shows that only two RTS lie in the branch for the TDE hosts (quiescent Balmer-strong galaxies). There are two sources having a Lick H index consistent with TDE hosts but with enhanced H emission, possibly dominated by the current star-forming activity and/or AGN. The above analyses suggest that the host properties of RTS presented in this work may be different from that of TDEs, at least for those discovered in the optical surveys.
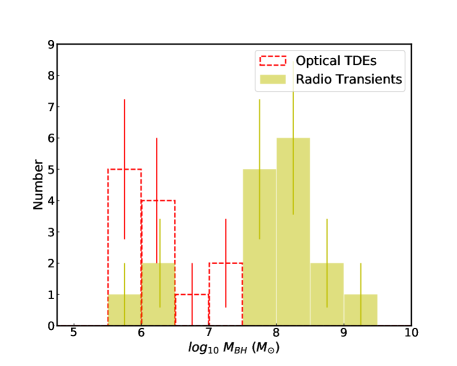
The red colors and large stellar masses suggest that RTS may possess larger SMBHs than known TDEs or TDE candidates. By using the velocity dispersion measurements provided in the MPA-JHU catalog, and adopting the relation used in Gültekin et al. (2009), we estimated their BH masses in the range M⊙, with a median of M⊙. Figure 7 shows the distribution of BH masses, and its comparison with the sample of 12 optical/UV selected TDEs with the BH masses measured by Wevers et al. (2017). It can be seen that our sample is much more spread out, with objects at either large or small masses, indicating the heterogeneity of the sample. A Kolmogorov-Smirnov (K-S) test on the mass distribution between our sample and optical TDEs results in a p-value of 2.9, suggesting that they are not drawn from the same population. While 10 of 12 optical TDEs have masses between and M⊙, only 3 out of 17 sources in our sample fall into this range. Among the three sources, two can be classified as star-forming galaxies, namely J1301+2127 and J1646+4227. As shown in Section 4.2 (and Figure 6), the clear optical flare and long-lasting IR echo suggest that J1301+2127 might be a TDE. J1646+4227 has no IR flux variations detected in the WISE light curves. The optical variability properties are not clear yet, as it is the only source in our sample without CRTS or ZTF observations. We note that very few optically-discovered TDEs are found in star-forming galaxies, and this could be a selection effect (Jiang et al., 2021b; Jiang et al., 2021a). If J1301+2127 and J1646+4227 were explained due to TDEs, it would suggest that radio observations are important to offer a complete view of TDE phenomenon. On the other hand, more than half sources in our sample (9/17=53%) have BH masses larger than M⊙, which is the upper limit for tidal disruption of a main-sequence star around a Schwarzschild black hole. In the TDE scenario, this suggests either the disruption of a post main-sequence star (Kochanek, 2016) or the black hole is spinning (Leloudas et al., 2016). However, such events are expected to be rare based on the current observations of TDE candidates. In addition, it is difficult to reconcile with the non-detections of optical and MIR flares in the historical CRTS, ZTF and WISE data sets. The analysis of long-term optical and MIR light curves, host properties and BH mass distribution suggest that most of RTS in our sample are likely not TDEs.
5.3 Intrinsic Variability of Radio-quiet AGN
As shown in Section 4.1, 4 out of 18 galaxies in our sample can be classified as AGNs (Seyfert or quasar) based on optical spectroscopy characteristics. However, the four AGNs are expected to be radio-quiet during the period of FIRST observations. In fact, all our sources have a low radio luminosity ( W Hz-1) based on the weak or non-detections in the FIRST survey. This is at least an order of magnitude lower than the luminosity thresholds of W Hz-1 for radio-loud AGNs (Miller et al., 1990; Goldschmidt et al., 1999). While radio variability has been observed in radio-quiet AGNs over months to years time-scales, the variability amplitude is typically a few tens per cent (Panessa et al., 2019). This contrasts with the large flux increases by a factor of 3–15 between the FIRST and VLASS observations. Considering that the majority of our sources (14/18) can be classified as LINERs or normal galaxies, the intrinsic AGN variability seems unable to explain the radio properties of our sources.
5.4 Recently Launched Young Radio Jets
We next consider the possibility that the central black hole is in a long quiescent level, and fed episodically for a relatively short time-scale, probably caused by instability within an accretion disk. The low-level accretion activity in the quiescent state may also explain the very common LINER optical spectra for most of our sources (Section 4.1). It has been hypothesized that the radio activity is an intermittent phenomenon lasting year, and an AGN may undergo many such short-term phases during its lifetime (e.g., Reynolds & Begelman, 1997; Czerny et al., 2009; An & Baan, 2012; Wołowska et al., 2017). Using the CNSS and VLASS data, recent works have identified a population of quasars with switched-on radio activities (Mooley et al., 2016; Kunert-Bajraszewska et al., 2020; Nyland et al., 2020; Wołowska et al., 2021). The transition from radio-quiet to radio-loud phase in these sources can be explained by the appearance of new-born and young radio jets.
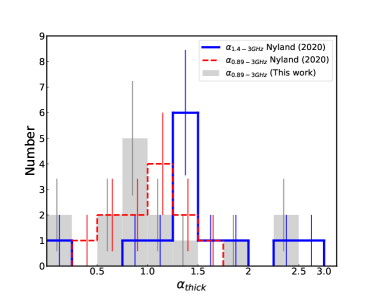
Young radio jets are characterized by curved radio SEDs peaking at 5–10 GHz (Nyland et al., 2020). The spectral turnover at frequencies below the peak is likely due to the synchrotron self-absorption and/or free-free absorption (O’Dea & Saikia, 2021). Figure 8 shows the distribution of the radio spectral index between 888 MHz and 3 GHz for our sources. Interestingly, all have a flat or inverted spectrum, with in the range 0.1–2.4. For comparison, we also show the optically thick spectral index values () below the turnover frequency for the sample presented in Nyland et al. (2020), which appear to be higher than ours. A K-S test for the two samples results in a value of 0.01. Such a difference could be due to the poor spatial resolution of the ASKAP observations (15″), which may contain the radio emission at a larger scale than the VLASS one. In addition, for the latter sample was derived between 1.4 GHz and 3 GHz, which has a different frequency coverage. Therefore, we retrieved the ASKAP data at 888 MHz and measured the for the sample of Nyland et al. (2020), whose distribution is also shown in Figure 8. In this case, a K-S test () suggests that it could be drawn the same population as ours. Although precise measurements of radio SEDs can not be done with current data for our sample, the flat or inverted spectral slopes between 888 MHz and 3 GHz implies that our sample might be similar in nature to that of Nyland et al. (2020), i.e., dominated by young radio jets. On the other hand, Wołowska et al. (2021) suggested small changes of the accretion rate (by 30%-40%) may be sufficient to trigger low-power radio activity that evolves on the time-scale of decades. This may explain why most our sources have not shown large amplitude variability in the optical and IR light curves (Figure 6). Such a scenario can be tested with future works by identifying larger samples of galaxies with switched-on radio emission, especially for those with no or weak AGN activities.
In the context of new-born radio jets, it is interesting to compare the jet production efficiency of our sources with the sample of Wołowska et al. (2021) and Nyland et al. (2020), as well as other galaxies with strong radio emission, which might be useful to understand the jet launching processes, and possibly the origin of the radio loudness of AGN activity. We first derived the jet kinetic power for our sample, , by using the extrapolated 1.4 GHz flux densities (Figure 2) and applying the scaling relation between the radio luminosity and jet power (e.g., Equation (4), Wołowska et al., 2021).111111 Jet power erg s-1, where is the rest-frame 1.4 GHz luminosity. Then the bolometric luminosity of the accretion disk, , was calculated based on the [O iii] luminosity with a correction factor of 3500 (Heckman et al., 2004). We considered the bolometric luminosity for the two star-forming galaxies in our sample as upper limit, as their [O iii] emission is dominated by the star-forming activities. The jet production efficiency can be expressed as
| (1) |
where is the mass accretion rate, and is the radiative efficiency of the accretion disk. We assumed the typical value of 10% in this paper when applicable. On the other hand, we parameterized the accretion rate using the Eddington ratio, , where is the Eddington luminosity. It is suggested that an AGN could be transitioning between a radiatively efficient state and a radiatively inefficient state, if its accretion rate changes across (Noda & Done, 2018; Ruan et al., 2019).
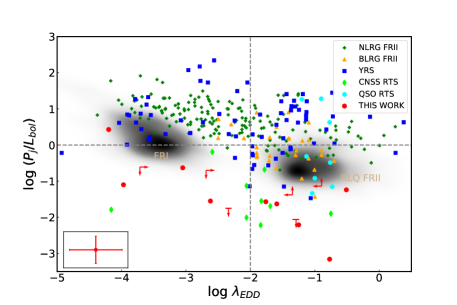
Figure 9 shows the distribution of our sources in the plane (red dots). Excluding six sources with either upper or lower limits, only one has the jet power in excess of the disk luminosity (), and the remaining sources are distributed within a range from log( up to . Furthermore, the accretion rate in the sample spans a relatively wide range between log( and , with 50% falling below . While the jet production efficiency and accretion rate is similar to the sample of Wołowska et al. (2021) (green dots), the distribution of the objects in the sample of Nyland et al. (2020) appears to be different (cyan dots). The latter sample occupies the locus with larger jet power and accretion rate, which overlaps with that of FR type II broad-line radio galaxies and radio quasars from the sample of Rusinek et al. (2017). This is possibly due to the selection effect, as the sample of Nyland et al. (2020) includes only powerful quasars with relatively high . In comparison to compact radio sources and GHz-peaked spectrum sources which are believed young radio galaxies, our sample tends to have a much lower jet production efficiency by at least an order of magnitude. For example, the median is 0.1 for our sample, while it is 4.3 for the young radio galaxies. On the other hand, there appears no dependence of jet production efficiency on the accretion rate.
There are several caveats for the above comparison of jet power between different populations, thus the results should be treated with caution. First, the bolometric correction to [O iii] luminosity is uncertain with a variance of 0.38 dex (Heckman et al., 2004), and the intrinsic scatter in the relation is 0.44 dex (Gültekin et al., 2009). These make difficult to robustly estimate the and in individual sources. As a result, we could only show the typical error bars of and in the left corner of Figure 9. Second, the jet powers were calculated using the 1.4 GHz monochromatic radio luminosity. However, the scaling relation was originally derived using the radio luminosity at 151 MHz in FR II radio galaxies (e.g., Willott et al., 1999). It is not clear how the calculation of jet powers is affected by the changes of radio spectral shapes, as the radio spectral index of between 151 MHz and 1.4 GHz () was assumed (Rusinek et al., 2017). In fact, jet power depends critically on the radio spectral index, as well as the upper and lower cut-off frequencies of the synchrotron spectrum (Equation (1), Willott et al., 1999). Third, since the [O iii] emission comes from much extended regions (kpc), it may not correspond to the same accretion power relevant to the brightened radio emission. The quasi-simultaneous X-ray observations such as that obtained with Swift X-ray Telescope (Burrows et al., 2005) might be useful to better constrain the accretion power related to the radio brightening, but such data are not available yet. Finally, although the RACS data at 888 MHz have been used to constrain the radio spectral shapes for our sources, it is still less accurate and insufficient to localize the peak frequencies. Quasi-simultaneous multi-frequency radio observations are highly encouraged for confirming the peaked radio spectrum, one of critical characteristics of young radio jets, which will help to further understand the nature of radio transients revealed in VLASS.
6 Conclusion
By analyzing the galaxies observed by FIRST and VLASS, we have identified a sample of 18 slow-evolving radio transients at , characterized by radio variability (brightening in VLASS epoch I observations) on decadal timescales. The location of the radio emission is consistent with the optical center of the galaxy from SDSS photometry, with positional offsets less than 041, indicating an origin from the nucleus, perhaps associated with the accreting SMBHs. All these galaxies are detected in the second epoch VLASS observations, and the 3 GHz radio emission does not show significant variations over 30-36 months (%). By checking for the archival RACS data, we find 15 out of 18 sources are observed and an inverted radio spectrum between 888 MHz and 3 GHz can be inferred, suggesting an origin from optically thick regions. Based on the SDSS spectroscopy data, the 18 galaxies can be classified as LINERs (8), star-forming galaxies (2), passive galaxies (2), composites (2), and AGNs (4). Most of the host galaxies are intrinsically red and massive, consistent with them being early-type galaxies from morphological analysis. Except for one source, we do not detect any optical and mid-IR flares in CRTS, ZTF, and WISE light curves spanning 8–12 yr before the start of the VLASS survey. The combination of radio luminosities, variability amplitude and timescales, spectral shapes, and host galaxy properties rules out the origins from stellar explosions such as SNe and GRBs, as well as intrinsic variability of radio-quiet AGN. Non-detections of optical and mid-IR flares, as well as their relatively large black hole masses ( M⊙) suggest that most sources in our sample are not TDEs. Young radio jet remains a likely scenario, which can be tested with further multi-frequency as well as high spatial resolution radio observations of galaxies in the sample.
References
- Alexander et al. (2016) Alexander K. D., Berger E., Guillochon J., Zauderer B. A., Williams P. K. G., 2016, ApJ, 819, L25
- Alexander et al. (2017) Alexander K. D., Wieringa M. H., Berger E., Saxton R. D., Komossa S., 2017, ApJ, 837, 153
- Alexander et al. (2020) Alexander K. D., van Velzen S., Horesh A., Zauderer B. A., 2020, Space Sci. Rev., 216, 81
- An & Baan (2012) An T., Baan W. A., 2012, ApJ, 760, 77
- Anderson et al. (2020) Anderson M. M., et al., 2020, ApJ, 903, 116
- Becker et al. (1995) Becker R. H., White R. L., Helfand D. J., 1995, ApJ, 450, 559
- Bell et al. (2004) Bell E. F., et al., 2004, ApJ, 608, 752
- Bellm et al. (2019) Bellm E. C., et al., 2019, PASP, 131, 018002
- Berger et al. (2012) Berger E., Zauderer A., Pooley G. G., Soderberg A. M., Sari R., Brunthaler A., Bietenholz M. F., 2012, ApJ, 748, 36
- Bernardi et al. (2003) Bernardi M., et al., 2003, AJ, 125, 1817
- Bietenholz et al. (2021) Bietenholz M. F., Bartel N., Argo M., Dua R., Ryder S., Soderberg A., 2021, ApJ, 908, 75
- Bilinski et al. (2018) Bilinski C., et al., 2018, MNRAS, 475, 1104
- Blandford et al. (2019) Blandford R., Meier D., Readhead A., 2019, ARA&A, 57, 467
- Boquien et al. (2019) Boquien M., Burgarella D., Roehlly Y., Buat V., Ciesla L., Corre D., Inoue A. K., Salas H., 2019, A&A, 622, A103
- Bower et al. (2013) Bower G. C., Metzger B. D., Cenko S. B., Silverman J. M., Bloom J. S., 2013, ApJ, 763, 84
- Bright et al. (2020) Bright J. S., et al., 2020, Nature Astronomy, 4, 697
- Bruzual & Charlot (2003) Bruzual G., Charlot S., 2003, MNRAS, 344, 1000
- Burrows et al. (2005) Burrows D. N., et al., 2005, Space Sci. Rev., 120, 165
- Burrows et al. (2011) Burrows D. N., et al., 2011, Nature, 476, 421
- Capetti et al. (2017) Capetti A., Massaro F., Baldi R. D., 2017, A&A, 598, A49
- Caplar et al. (2017) Caplar N., Lilly S. J., Trakhtenbrot B., 2017, ApJ, 834, 111
- Chang et al. (2015) Chang Y.-Y., van der Wel A., da Cunha E., Rix H.-W., 2015, ApJS, 219, 8
- Cid Fernandes et al. (2011) Cid Fernandes R., Stasińska G., Mateus A., Vale Asari N., 2011, MNRAS, 413, 1687
- Czerny et al. (2009) Czerny B., Siemiginowska A., Janiuk A., Nikiel-Wroczyński B., Stawarz Ł., 2009, ApJ, 698, 840
- Dai et al. (2020) Dai B. B., Shu X. W., Jiang N., Dou L. M., Liu D. Z., Yang C. W., Zhang F. B., Wang T. G., 2020, ApJ, 896, L27
- Dong et al. (2012) Dong X.-B., Ho L. C., Yuan W., Wang T.-G., Fan X., Zhou H., Jiang N., 2012, ApJ, 755, 167
- Dou et al. (2016) Dou L., Wang T.-g., Jiang N., Yang C., Lyu J., Zhou H., 2016, ApJ, 832, 188
- Dou et al. (2017) Dou L., Wang T., Yan L., Jiang N., Yang C., Cutri R. M., Mainzer A., Peng B., 2017, ApJ, 841, L8
- Drake et al. (2009) Drake A. J., et al., 2009, The Astronomer’s Telegram, 2210, 1
- Fender et al. (2004) Fender R. P., Belloni T. M., Gallo E., 2004, MNRAS, 355, 1105
- French et al. (2016) French K. D., Arcavi I., Zabludoff A., 2016, ApJ, 818, L21
- Gezari (2021) Gezari S., 2021, ARA&A, 59
- Gezari et al. (2017) Gezari S., Cenko S. B., Arcavi I., 2017, ApJ, 851, L47
- Goldschmidt et al. (1999) Goldschmidt P., Kukula M. J., Miller L., Dunlop J. S., 1999, ApJ, 511, 612
- Gordon et al. (2021) Gordon Y. A., et al., 2021, ApJS, 255, 30
- Guillochon et al. (2017) Guillochon J., Parrent J., Kelley L. Z., Margutti R., 2017, ApJ, 835, 64
- Gültekin et al. (2009) Gültekin K., et al., 2009, ApJ, 698, 198
- Heckman et al. (2004) Heckman T. M., Kauffmann G., Brinchmann J., Charlot S., Tremonti C., White S. D. M., 2004, ApJ, 613, 109
- Helfand et al. (2015) Helfand D. J., White R. L., Becker R. H., 2015, VizieR Online Data Catalog, p. VIII/92
- Hjellming & Rupen (1995) Hjellming R. M., Rupen M. P., 1995, Nature, 375, 464
- Horesh et al. (2021b) Horesh A., Sfaradi I., Fender R., Green D. A., Williams D. R. A., Bright J. S., 2021b, ApJ
- Horesh et al. (2021a) Horesh A., Cenko S. B., Arcavi I., 2021a, Nature Astronomy
- Jiang et al. (2016) Jiang N., Dou L., Wang T., Yang C., Lyu J., Zhou H., 2016, ApJ, 828, L14
- Jiang et al. (2017) Jiang N., et al., 2017, ApJ, 850, 63
- Jiang et al. (2019) Jiang N., Wang T., Mou G., Liu H., Dou L., Sheng Z., Wang Y., 2019, ApJ, 871, 15
- Jiang et al. (2021b) Jiang N., Wang T., Hu X., Sun L., Dou L., Xiao L., 2021b, ApJ
- Jiang et al. (2021a) Jiang N., et al., 2021a, ApJS
- Kauffmann et al. (2003) Kauffmann G., et al., 2003, MNRAS, 346, 1055
- Kellermann et al. (2016) Kellermann K. I., Condon J. J., Kimball A. E., Perley R. A., Ivezić Ž., 2016, ApJ, 831, 168
- Kewley et al. (2001) Kewley L. J., Dopita M. A., Sutherland R. S., Heisler C. A., Trevena J., 2001, ApJ, 556, 121
- Kochanek (2016) Kochanek C. S., 2016, MNRAS, 461, 371
- Kunert-Bajraszewska et al. (2020) Kunert-Bajraszewska M., Wołowska A., Mooley K., Kharb P., Hallinan G., 2020, ApJ, 897, 128
- Lacy et al. (2020) Lacy M., et al., 2020, PASP, 132, 035001
- Leloudas et al. (2016) Leloudas G., et al., 2016, Nature Astronomy, 1, 0002
- Liao & Gu (2020) Liao M., Gu M., 2020, MNRAS, 491, 92
- Lintott et al. (2011) Lintott C., et al., 2011, MNRAS, 410, 166
- Liu et al. (2020) Liu Z., Liu H.-Y., Cheng H., Qiao E., Yuan W., 2020, MNRAS, 492, 2335
- Mattila et al. (2018) Mattila S., et al., 2018, Science, 361, 482
- McConnell et al. (2020) McConnell D., et al., 2020, PASA, 37, e048
- McMullin et al. (2007) McMullin J. P., Waters B., Schiebel D., Young W., Golap K., 2007, in Shaw R. A., Hill F., Bell D. J., eds, Astronomical Society of the Pacific Conference Series Vol. 376, Astronomical Data Analysis Software and Systems XVI. p. 127
- Miller et al. (1990) Miller L., Peacock J. A., Mead A. R. G., 1990, MNRAS, 244, 207
- Mohan & Rafferty (2015) Mohan N., Rafferty D., 2015, PyBDSF: Python Blob Detection and Source Finder (ascl:1502.007)
- Mohan et al. (2021) Mohan P., An T., Zhang Y., Yang J., Yang X., Wang A., 2021, arXiv e-prints, p. arXiv:2106.15799
- Mooley et al. (2016) Mooley K. P., et al., 2016, ApJ, 818, 105
- Moravec et al. (2022) Moravec E., Svoboda J., Borkar A., Boorman P., Kynoch D., Panessa F., Mingo B., Guainazzi M., 2022, A&A, 662, A28
- Noda & Done (2018) Noda H., Done C., 2018, MNRAS, 480, 3898
- Nyland et al. (2020) Nyland K., et al., 2020, ApJ, 905, 74
- O’Dea & Saikia (2021) O’Dea C. P., Saikia D. J., 2021, A&A Rev., 29, 3
- Palliyaguru et al. (2019) Palliyaguru N. T., et al., 2019, ApJ, 872, 201
- Panessa et al. (2019) Panessa F., Baldi R. D., Laor A., Padovani P., Behar E., McHardy I., 2019, Nature Astronomy, 3, 387
- Pietka et al. (2015) Pietka M., Fender R. P., Keane E. F., 2015, MNRAS, 446, 3687
- Ravi et al. (2021) Ravi V., et al., 2021, arXiv e-prints, p. arXiv:2102.05795
- Reynolds & Begelman (1997) Reynolds C. S., Begelman M. C., 1997, ApJ, 487, L135
- Ricci et al. (2021) Ricci C., et al., 2021, ApJS, 255, 7
- Ruan et al. (2019) Ruan J. J., Anderson S. F., Eracleous M., Green P. J., Haggard D., MacLeod C. L., Runnoe J. C., Sobolewska M. A., 2019, ApJ, 883, 76
- Rusinek et al. (2017) Rusinek K., Sikora M., Kozieł-Wierzbowska D., Godfrey L., 2017, MNRAS, 466, 2294
- Schawinski et al. (2007) Schawinski K., Thomas D., Sarzi M., Maraston C., Kaviraj S., Joo S.-J., Yi S. K., Silk J., 2007, MNRAS, 382, 1415
- Stone & van Velzen (2016) Stone N. C., van Velzen S., 2016, ApJ, 825, L14
- Strateva et al. (2001) Strateva I., et al., 2001, AJ, 122, 1861
- Stroh et al. (2021) Stroh M. C., et al., 2021, ApJ, 923, L24
- Wevers et al. (2017) Wevers T., van Velzen S., Jonker P. G., Stone N. C., Hung T., Onori F., Gezari S., Blagorodnova N., 2017, MNRAS, 471, 1694
- White et al. (1997) White R. L., Becker R. H., Helfand D. J., Gregg M. D., 1997, ApJ, 475, 479
- Willott et al. (1999) Willott C. J., Rawlings S., Blundell K. M., Lacy M., 1999, MNRAS, 309, 1017
- Wójtowicz et al. (2020) Wójtowicz A., Stawarz ł., Cheung C. C., Ostorero L., Kosmaczewski E., Siemiginowska A., 2020, ApJ, 892, 116
- Wołowska et al. (2017) Wołowska A., Kunert-Bajraszewska M., Mooley K., Hallinan G., 2017, Frontiers in Astronomy and Space Sciences, 4, 38
- Wołowska et al. (2021) Wołowska A., et al., 2021, ApJ, 914, 22
- Yang et al. (2008) Yang Y., Zabludoff A. I., Zaritsky D., Mihos J. C., 2008, ApJ, 688, 945
- Yang et al. (2021) Yang J., et al., 2021, MNRAS, 503, 3886
- York et al. (2000) York D. G., et al., 2000, AJ, 120, 1579
- Zauderer et al. (2011) Zauderer B. A., et al., 2011, Nature, 476, 425
- Zhang et al. (2017) Zhang K., et al., 2017, MNRAS, 466, 3217
- van Velzen et al. (2011) van Velzen S., Körding E., Falcke H., 2011, MNRAS, 417, L51
- van Velzen et al. (2013) van Velzen S., Frail D. A., Körding E., Falcke H., 2013, A&A, 552, A5
- van Velzen et al. (2016) van Velzen S., et al., 2016, Science, 351, 62
- van Velzen et al. (2021) van Velzen S., et al., 2021, ApJ, 908, 4
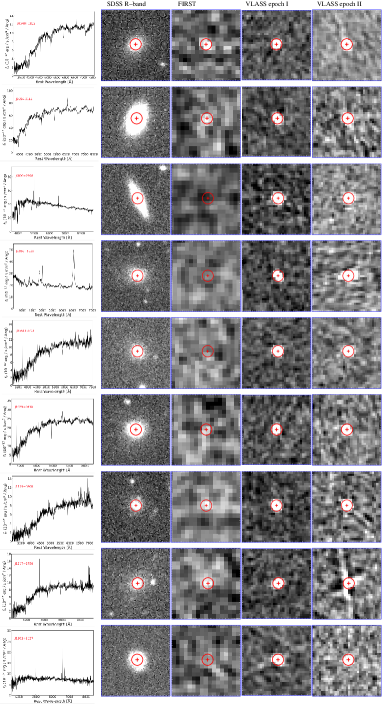
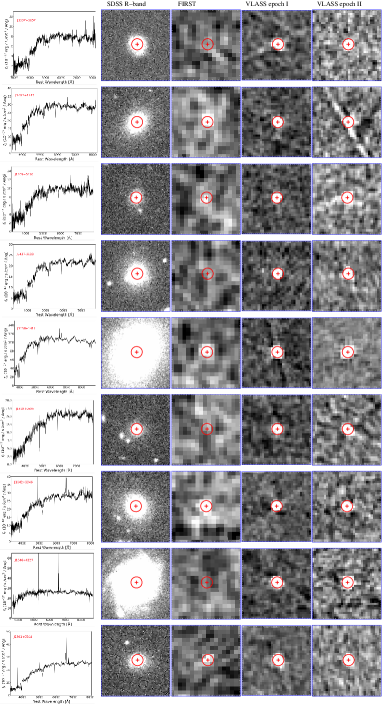
Appendix A optical spectrum and image cutouts for individual sources
In Figure A1, we present the SDSS optical spectrum of each galaxy in our sample, the SDSS r-band optical image, FIRST image, VLASS epoch I image and VLASS epoch II image.
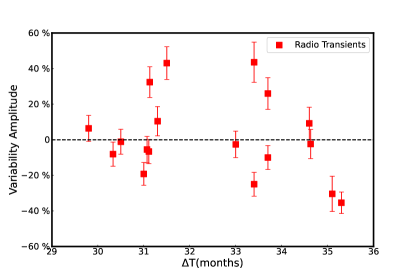
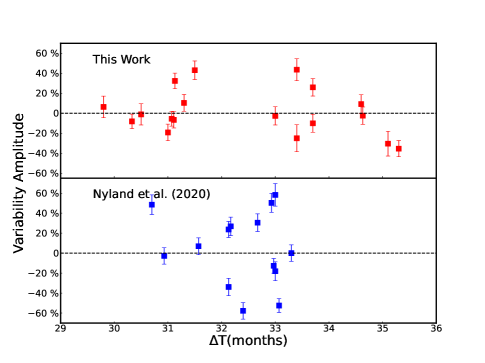
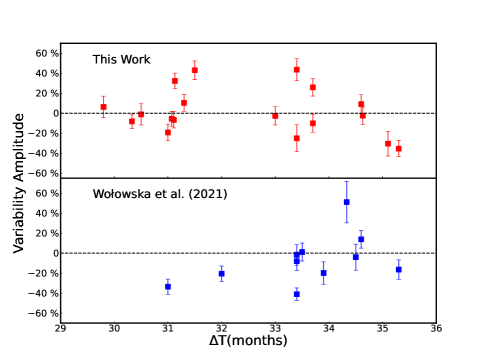
Appendix B Comparison of radio flux variations between different samples
Following the approaches presented in Section 3 (Figure 1), we retrieved the VLASS epoch I and II observations and measured the 3 GHz fluxes to compute the variability amplitudes for the sample of Nyland et al. (2020) and Wołowska et al. (2021). The former sample includes only quasars that may have transitioned from radio-quiet to radio-loud in VLASS, while the latter sample contains the galaxies with transient radio emission selected in the CNSS data. The constant or small flux variations at 3 GHz of our sample over timescales of 30-35 months are consistent with that presented in Nyland et al. (2020) and Wołowska et al. (2021), as shown in Figure B1. It should be noted that the two works either did not use the VLASS data or used only epoch I data. Our uniform analysis of the data from VLASS epoch I and II observations makes the above comparison fair.
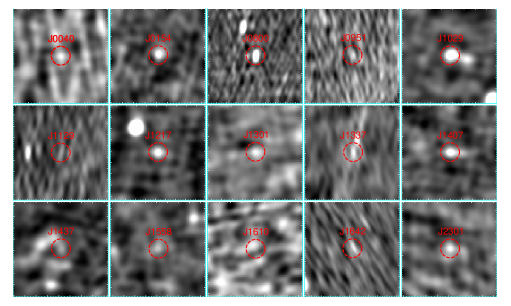
Appendix C RACS images at 888 MHz
Figure C1 shows the radio images at 888 MHz for 15 out 18 sources observed in the Rapid ASKAP Continuum Survey (RACS, McConnell et al., 2020). The remaining three sources (J0950, J1409, and J1646) are not covered by the RACS survey due to their too high declination (DEC+40).
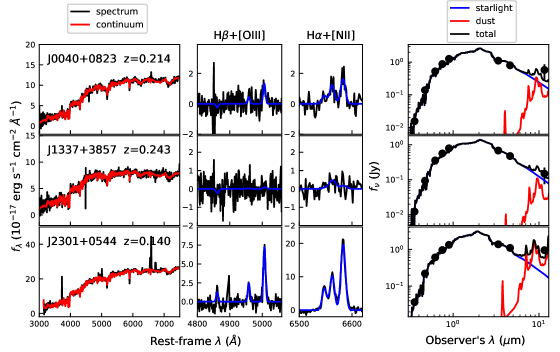
Appendix D optical spectral fittings and SED fittings to the SDSS and WISE photometry
Three objects in our sample, including J0040+0823, J1337+3857 and J2301+0544, are not listed in either the MPA-JHU catalog or combined SDSS and WISE photometric catalog (Chang et al., 2015), because their SDSS spectra were observed later than 2010. Thus, we measured the properties of their host galaxies by modeling their SDSS spectra and SEDs, as shown in Figure D1. We modeled the SDSS spectra following Dong et al. (2012). In brief, we modeled the continuum by fitting the spectra in regions unaffected by emission lines with a linear combination of simple stellar population templates from Bruzual & Charlot (2003). The templates were broadened with a Gaussian function, of which the value was used as the measurement of stellar velocity dispersion. The results are shown in the left column of Figure D1. After subtracting the continuum model, we then fitted the H, [OIII] 4959, 5007, H and [NII] 6548, 6583 emission lines with the following assumptions: (1) all the emission lines can be represented with single Gaussians with redshifts and width (in velocity) tied together; (2) the flux ratios of [O iii] and [N ii] doublets are fixed at 3. The results are shown in the middle two columns of Figure D1. To obtain the stellar mass, we constructed the SEDs of the galaxies using the photometric data from the SDSS and WISE surveys, and fitted the SED using the CIGALE code (Boquien et al., 2019). In the fittings we also assumed that the star-formation history is an exponential function and the Salpter’s initial mass function was adopted. The results are shown in the right column of Figure D1.