Precursors of Supernovae from Mass Eruption: Prospects for Early Warning of Nearby Core-collapse Supernovae
Abstract
Recent observations of a large fraction of Type II supernovae show traces of dense circumstellar medium (CSM) very close to the progenitor star. If this CSM is created by eruptive mass loss several months before core-collapse, the eruption itself may be visible as a precursor, helpful as an early warning of a near-future supernova. Using radiation hydrodynamical simulations based on the open-source code CHIPS, we theoretically model the emission from mass eruption of a red supergiant star. We find that for a modest mass eruption the luminosity is typically on the order of , can last as long as hundreds of days until the star explodes, and is mainly bright in the infrared (from to mag around peak). We discuss observational strategies to find these signatures from Galactic and local Type II supernovae.
1 Introduction
The detections of photons and neutrinos (Hirata et al., 1987; Bionta et al., 1987; Alexeyev et al., 1988) from SN 1987A was a landmark for multi-messenger astronomy. With current detectors of electromagnetic and gravitational waves as well as neutrinos, future Galactic/local supernovae (SNe) would dramatically deepen our understanding of stellar core-collapse (e.g., Andersson et al., 2013; Adams et al., 2013; Horiuchi & Kneller, 2018; Szczepańczyk et al., 2021).
Type II SNe, which are explosions of massive stars with a hydrogen-rich envelope, constitute a majority (–%; Li et al. 2011; Smith et al. 2011) of these core-collapse SNe. Recent studies based on the early phase light curves (Morozova et al., 2017; Das & Ray, 2017; Morozova et al., 2018; Förster et al., 2018) and spectra (Yaron et al., 2017; Boian & Groh, 2020; Bruch et al., 2021) of these SNe indicate a common presence of dense circumstellar medium (CSM) close to the star. The high density cannot be explained by standard wind mass-loss.
The origins of the dense CSM have been theoretically investigated by various works. Many of the proposed mechanisms, such as binary interaction (Chevalier, 2012), turbulent convection at the core (Smith & Arnett, 2014), and wave heating (e.g., Quataert & Shiode, 2012; Shiode & Quataert, 2014; Fuller, 2017; Wu & Fuller, 2021), involve energy injection in the stellar envelope that triggers eruptive mass loss (Dessart et al., 2010; Kuriyama & Shigeyama, 2020; Leung & Fuller, 2020; Matzner & Ro, 2021; Ko et al., 2022)111An alternative scenario to create overdense shell-like CSM by colliding-wind binaries was suggested by Kochanek (2019), but such systems may be too rare () to explain the entirety of Type II SNe (Pejcha et al., 2022)..
For Type IIn SNe that are believed to have extended massive CSM (Smith, 2014), such pre-SN eruptions are indeed observed months to years before the final explosion (Fraser et al., 2013; Ofek et al., 2014; Strotjohann et al., 2021). For Type II-P SNe that are more common, pre-SN eruptions are constrained by the monitoring of nearby red supergiants (RSGs). From the non-detection of strong variability from four Type II SN progenitors, Johnson et al. (2018) found that eruptions after oxygen ignition in the core (a few years before core-collapse) are not typical, with probability . However the limiting cadence still allows eruptions within months before core-collapse. Indeed a precursor event was recently observed from days before explosion for a Type II-P SN 2020tlf (Jacobson-Galán et al., 2022). Furthermore, from observations of Type II-P progenitors within 10 years of collapse, Davies et al. (2022) claims that such brief outbursts are favorable as origin of the dense CSM.
Though the first signal of a nearby core-collapse SN is usually presumed to be neutrinos, this may not be the case for hydrogen-rich SNe if such pre-SN eruptions are ubiquitous. In this work we consider emission from pre-SN eruption(s), and estimate the feasibility of this as an early warning of a near-future SN event. From simulations of mass eruptions from an RSG progenitor, we find that the emission is bright in the infrared with luminosity of , potentially lasting for hundreds of days until the SN explosion.
This paper is constructed as follows. In Section 2 we describe our formulations for calculating the mass eruption and the corresponding precursor emission. In Section 3 we present bolometric and multi-band light curves for various cases of energy injection. In Section 4 we compare our results to previous detections of precursor emission, and discuss strategies to find these events by optical/infrared surveys. We conclude in Section 5.
2 Methods
| Model name | Energy Injection | Parameters | Unbound mass [] | [erg] | [erg] |
|---|---|---|---|---|---|
| single-fid | |||||
| single-small | once | ||||
| single-large | |||||
| double-fid | 1.3 | ||||
| double-long | twice | 1.2 | |||
| double-large | 3.6 |
2.1 Model Setup
As a representative progenitor of Type II SN, we adopt a RSG model of initial mass and metallicity , generated by the stellar evolution code MESA (Paxton et al., 2011, 2013, 2015, 2018, 2019) revision 12778 222In Appendix A we consider eruptions of two other RSG progenitors, finding that the general characteristics of the precursor emission is similar.. We use the progenitor model at core-collapse, that has a radius of , mass of , luminosity of , and effective temperature of K. We inject thermal energy into the base of the progenitor’s hydrogen-rich envelope, and simulate the resulting mass eruption.
We consider two cases for the energy injection, where the injection occurs once and twice. This results in one and two mass eruptions, respectively. The latter possibility may be not only theoretically expected due to distinct phases of nuclear burning with significant energy transported to the envelope via e.g. waves (Shiode & Quataert, 2014; Wu & Fuller, 2021; Leung et al., 2021b), but also from observations of some Type IIn SNe, such as SN 2009ip (Mauerhan et al., 2013; Pastorello et al., 2013). In fact, the main motivation for considering multiple mass eruptions is that the emission following the second eruption can be potentially much brighter than the first. Collision between the second ejecta and the slower part of the first ejecta may efficiently convert the kinetic energy of the second ejecta to radiation, analogous to Type IIn SNe (e.g., Chugai, 1991; Aretxaga et al., 1999; van Marle et al., 2010; Chevalier & Irwin, 2011; Moriya et al., 2013; Murase et al., 2014; Tsuna et al., 2019; Kuriyama & Shigeyama, 2021).
The parameter sets we consider are summarized in Table 1. The key parameter is , the injected energy normalized by the initial binding energy of the hydrogen-rich envelope. The binding energy is for this RSG progenitor, and unbound material is ejected for energy injection of , or (Ko et al., 2022). We consider the range –, which results in an amount of CSM consistent with the range inferred from light curve modelling of Type II SNe (Morozova et al., 2018). For the models with two eruptions, we additionally introduce a parameter , the interval between two injections. For all cases, energy is injected impulsively in seconds with constant rate 333We study cases of longer injection duration in Appendix B, as the dynamics can be affected for duration comparable to the dynamical timescale of the envelope (Ko et al., 2022). The consequence of a longer duration is effectively similar to a lower ..
2.2 Mass Eruption Calculation
|
|
Our calculation of mass eruption is based on the one-dimensional radiation hydrodynamical simulation code from Kuriyama & Shigeyama (2020), that is public as part of the open-source code CHIPS (Takei et al., 2022). The simulation follows the hydrodynamical evolution of the hydrogen-rich envelope after energy injection assuming local thermodynamic equilibrium. Radiative transfer is included by flux-limited diffusion (Levermore & Pomraning, 1981) with a grey opacity , where and are respectively the gas density and temperature. For each model, we follow the evolution of the envelope for 600 days from energy injection.
We have made three important updates to the code. First, we have updated the analytical formula of used in Kuriyama & Shigeyama (2020) to a tabulated opacity covering a wide temperature range of K K. The analytical formula greatly simplifies the contribution from molecules and is generally overestimated at low temperatures of K, with differences of at most two orders of magnitude. This regime is relevant in the outer regions of RSGs and can significantly impact the emission as well as the location and temperature of the photosphere. We have thus updated the formulation to obtain by using two publicly available Rosseland-mean opacity tables, OPAL (Iglesias & Rogers, 1996) and ÆSOPUS 1.0 (Marigo & Aringer, 2009)444The ÆSOPUS table was recently updated to version 2.0 (Marigo et al., 2022). For a wide range of gas density, only the opacities at temperatures below K is affected, with differences within a factor of . As this is lower than the temperature range important for our work, using the updated tables affects our light curves by only a tiny amount ( near peak) with respect to version 1.0.. These cover temperature ranges of – K and – K, respectively. We first generate the two opacity tables for the mass-averaged abundance in the envelope of . Both of them tabulate by and in the range of –. We stitch the two tables at K, where the values of generally agree within 10% at all values of . In rare cases that values of or outside the table are requested in the simulation, we use the edge values.
Secondly, we treat ionization more rigorously than Kuriyama & Shigeyama (2020) by solving the Saha equations for the ionization degrees of hydrogen and helium (, , ) 555We neglect the ionization of metals. For our RSG model the metallicity is close to solar and the contribution of free electrons from metals is thus minor.. The equation of state is replaced by the following two equations from the HELMHOLTZ equation of state that assumes completely ionized gas (Timmes & Arnett, 1999; Timmes & Swesty, 2000)
| (1) | |||||
| (2) |
where is the mean molecular weight obtained from the Saha equations, is the pressure, is the specific internal energy, is the gas constant, and is the radiation constant. is the ionization energy defined as
| (3) |
where are the ionization energies of hydrogen and helium. The original code by Kuriyama & Shigeyama (2020) treats the gas as completely ionized, i.e. for solar composition and . As discussed later, this update results in substantial enhancement on the late phase emission, that is essentially powered by recombination of hydrogen in the ejecta.
Thirdly, we attached an atmosphere to the outer edge of the progenitor. We adopt the Eddington grey relation666https://docs.mesastar.org/en/latest/atm/t-tau.html to approximate the temperature structure. Here the opacity in the atmosphere is assumed to be constant, with a value at the outer edge of the MESA model. We use the hydrostatic equilibrium, the equation of state (equation 1), and the continuity equation to respectively solve for the remaining quantities and .
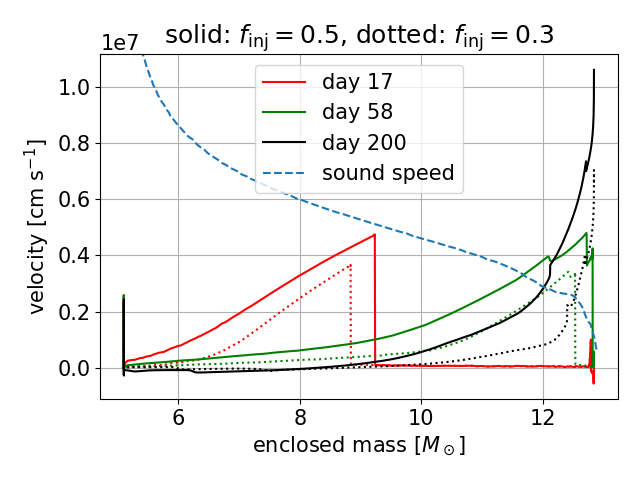
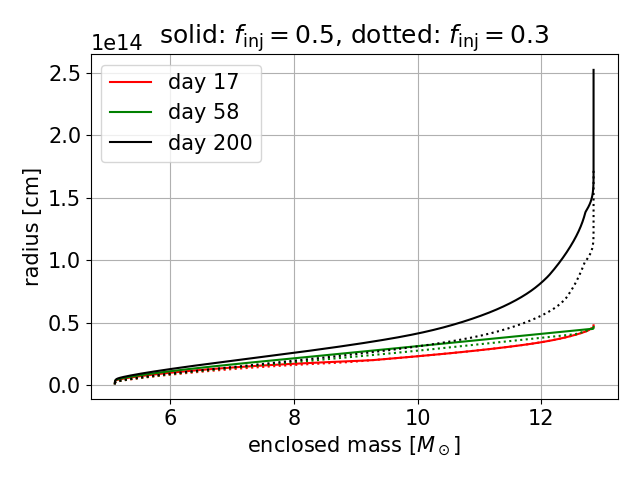
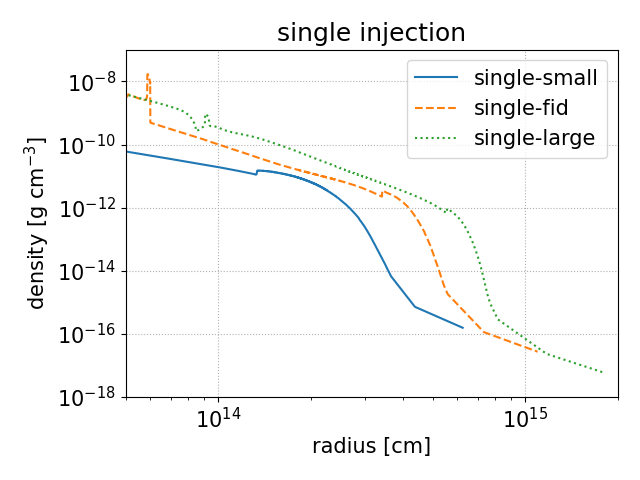
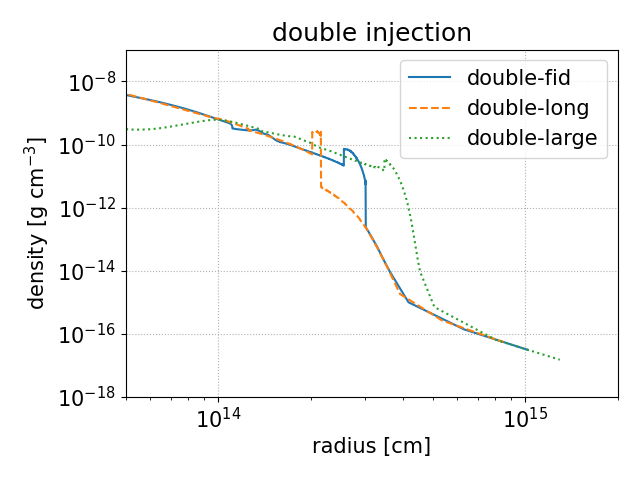
An example of mass eruption is shown in Figure 1. Once energy is injected a shock forms and propagates in the star. The shock runs for a few months until it reaches the surface and breaks out. After shock breakout, the outermost material is accelerated to and becomes unbound from the RSG progenitor. Some part of the ejected envelope is still bound to the envelope, and eventually falls back onto the star. The mass of the unbound CSM is sensitive to , as shown in Table 1.
The density profile of the erupted envelope is shown in the bottom panels of Figure 1. A notable point is that while the single injection models have a smooth double power-law profile, the double injection models display a high-density region at a few cm. This corresponds to the shocked region created by the interaction between the first and second ejecta (Chevalier, 1982), analogous to Type IIn SNe.
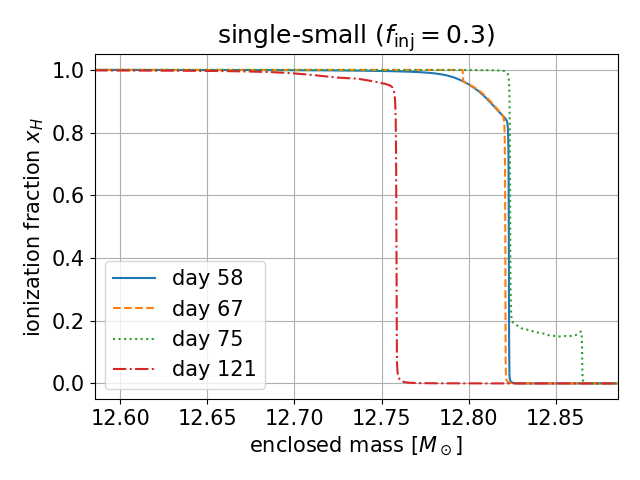
In Figure 2 we show the time evolution of at the outermost part of the envelope, focusing on around and after shock breakout for the case of . The shock heats and ionizes the envelope (day 58 to 67) until it breaks out. The escaping radiation after breakout also partially ionizes the upstream (day 75). The ejected envelope later cools down, and recombines from the outside.
2.3 Light Curve Calculation
We use the simulation results to calculate both bolometric light curves and the multi-band light curves. For the bolometric light curve, we simply extract the luminosity flowing through the outermost cell. Although the outermost cell moves at a finite velocity, it moves much slower than the speed of light and light-travel time effects can be neglected. The luminosity is extracted at intervals of day, which is roughly equivalent to the shock crossing time in the outermost cells.
To obtain the multi-band light curves, we first obtain the location of the photosphere from the equation
| (4) |
where is the Stefan-Boltzmann constant, and profiles and are extracted from our simulation. We assume that the emission is thermal, with temperature and luminosity at the photosphere. This assumption is reasonable because the temperature outside the photosphere is K, where absorption is a more dominant source of opacity than Thomson scattering. Thus we can approximate the effective temperature in equation (4) as the color temperature. Using the spectral synthesis code CLOUDY (Ferland et al., 2017), we have checked that the gas outside the photosphere does not affect the spectra, except at very long wavelengths of m.
We have used the public filter transmission functions by the Roman Space Telescope777https://roman.gsfc.nasa.gov/science/Roman_Reference_Information.html available from optical to near-infrared bands. The four bands we selected, F062, F106, F129, and F158, have central wavelengths similar to the R, Y, J, and H bands respectively. Finally, we focus only after the shock breaks out from the star, when the fluid can be assumed as steady state.
3 Results
3.1 Single Eruption Case
|
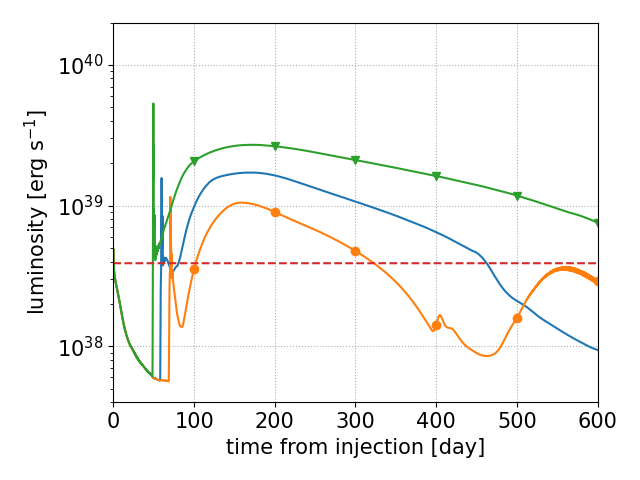
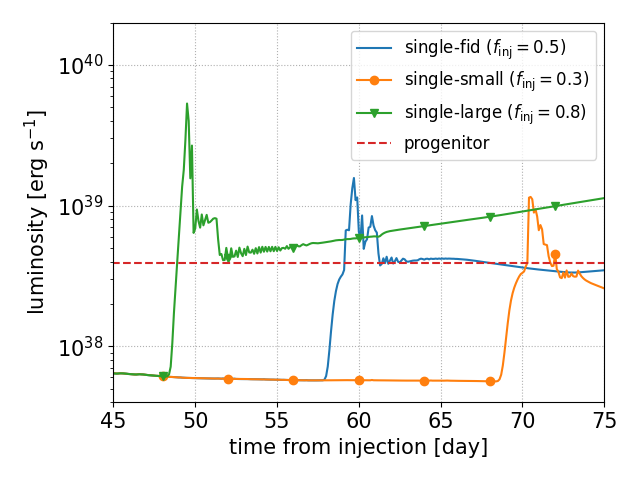
Figure 3 shows the bolometric light curves in the single injection case for different values of . Generally for large values of the overall emission is brighter. For all values of the light curve has two distinct peaks, the shock breakout emission of order days, and a subsequent cooling of the ejecta lasting for hundreds of days. For the model, we also find a peak at late phase that comes from fallback of the bound part of the envelope.
We note that the light curves are under the assumption that the SN has not yet occurred for the entire 600 days. However, monitoring of pre-SN RSGs (Johnson et al., 2018) find instead a quiescent progenitor up to – days before the SN. Although we present the entire light curve for completeness, we would thus likely not see the entire light curve, but instead only the first days after shock breakout.
The initial decline, also seen in model light curves of Kuriyama & Shigeyama (2020), is a numerical artifact due to the simulation omitting convective heat transport. Without energy being convected from the inner region, the outermost layer radiatively cools and its luminosity and temperature thus drop. The resulting loss of internal energy before breakout () is unlikely to affect the post-breakout emission, but the modified temperature distribution may affect the emission at breakout.
We pick up three characteristic aspects of a single eruption (the shock breakout, the role of recombination of hydrogen, and the fall back), and discuss them quantitatively in the following.
3.1.1 Shock breakout
A shock that propagates in the hydrogen-rich envelope heats the envelope and produces copious photons at the downstream. Initially the downstream photons are trapped there, but near the stellar surface photons can diffusively escape. This shock breakout (e.g., Falk, 1978; Matzner & McKee, 1999; Waxman & Katz, 2017) occurs at a radius that satisfies , where is the shock velocity, is the optical depth from the surface to , and is the speed of light. Because the optical depth quickly rises with depth from the surface, the width of the layer that radiation can efficiently escape is typically only a few % of (Ko et al., 2022).
The timescale of the breakout emission is the diffusion time of photons in this breakout layer
| (5) |
The total dissipated energy in this timescale can be crudely estimated as
| (6) | |||||
where refers to the velocity at breakout, and we adopted at the breakout radius (see also Ko et al. 2022). These estimates for the breakout radiation can be subject to several uncertainties. First, this estimation neglects the evolution of the diffusion velocity of photons after the breakout. Second, for breakouts of a very slow shock like our case, the dissipated energy may not be dominated by radiation. The upstream density at breakout typically found from the simulations is . The downstream temperature assuming adiabatic index of is
| (7) | |||||
The ratio of energy densities of radiation and gas is then
| (8) | |||||
Thus we may assume that a significant fraction of is converted to radiation by the shock. If this ratio was much smaller than 1, the temperature of thermal photons would be reduced from that assuming radiation-dominated gas. This is in contrast to shock breakouts in typical SNe of , where the downstream has an order of magnitude higher temperature and is radiation dominated. As gas and radiation are coupled at these densities, the internal energy initially carried by gas is eventually released as radiation within a diffusion time (), and thus still contribute to the breakout emission. These processes would be important when modelling the spectra, which would likely peak in the ultraviolet.
To summarize, for typical parameters of the shock the timescale and radiated energy of the breakout pulse are a few days and ergs, respectively. These rough estimates reasonably agree with the simulated light curves in the right panel of Figure 3.
After the first peak of the breakout, the light curve flattens for a few days before it drops. This phase appears when the photosphere enters the denser layer after the outermost layer that was heated upon breakout cools down. At this point a recombination front develops and the light curve transitions to a recombination-powered phase, which is explained in the next section.
3.1.2 Envelope Recombination
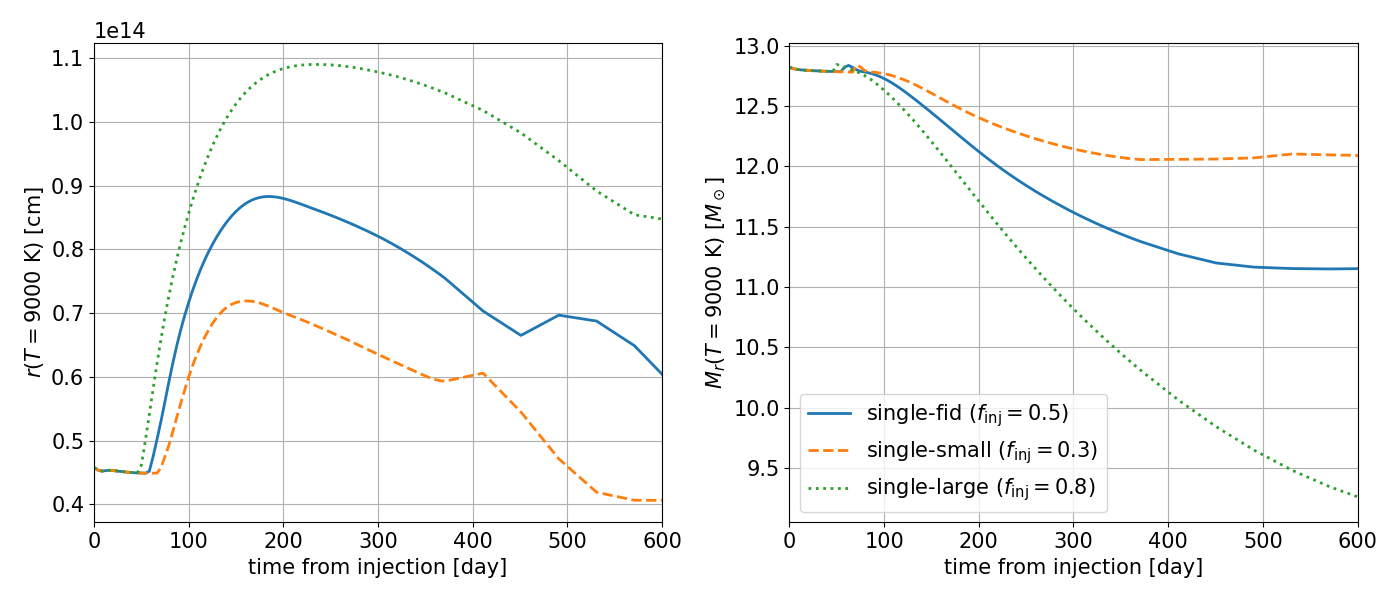
The second peak, close to a plateau, is powered by cooling of the expelled envelope. This peak was not seen in the original work by Kuriyama & Shigeyama (2020), and we can presume that this emission is powered by the recombination of hydrogen neglected in their work. For – the peak luminosity is –. This is as bright as the breakout pulse, but much longer and hence easier to detect.
Figure 4 shows the location where K, at which about half of hydrogen atoms recombine for a density of . This location is equivalent to the recombination front that exists in Type II SNe (e.g., Grassberg et al., 1971; Grassberg & Nadyozhin, 1976; Kasen & Woosley, 2009; Faran et al., 2019), except that the recombination temperature is higher due to the much higher gas density. Following shock breakout the recombination front first expands to cm, but starts to recede from day .
Recombination of hydrogen at the front supplies an internal energy of
| (9) |
where is the ejected mass. The right plot of Figure 3 shows the recession of the recombination front in mass coordinate. For – the slopes of these curves range as –/100 days, and from equation (9) this can power a luminosity of –. These values are overall consistent with the peaks of the simulated light curves. The light curve of model, with a large explosion energy (Table 1), probably has additional minor contribution from the internal energy of the envelope deposited by the shock. A much larger energy injection will enhance this contribution, but with a possible caveat that the entire hydrogen envelope may be expelled.
For the models of and , the recombination front settles (in Lagrangian sense) at 300 and 450 days respectively. This is presumably when all the ejecta has recombined, and is consistent with the epoch where the light curve starts to drop steeply.
In summary, hydrogen recombination can power a plateau emission of timescale – days and luminosity of up to a few . This emission, though much dimmer than the typical plateau observed in Type II SNe, is likely much easier to detect than the breakout pulse.
3.1.3 Envelope Fallback
For , a second dimmer bump that peaks at days is seen. This is due to the significant fallback in this model, as verified below.
The expanding envelope after mass eruption is gravitationally pulled by the central star. In a few dynamical timescales after mass eruption when internal energy becomes negligible, the acceleration is only by gravity,
| (10) |
For the case of , the slower part of the ejecta with velocity of (see Figure 1) thus stalls an order of days after eruption. This stalling occurs much later for larger values of , and thus does not appear in the light curve. After the envelope stalls, it falls back to the central star at a timescale
| (11) |
The fallback matter has a velocity of . The density of the fallback matter at is around the light curve peak888A similar value can also be obtained from the analytical modelling of Tsuna et al. (2021) (see their Appendix A). The collision between the fallback matter and the star creates a shock, that dissipates the fallback matter’s kinetic energy at a luminosity , which roughly agrees with the light curve. Afterwards this luminosity declines as the fallback rate drops as a function of time (Tsuna et al., 2021).
3.2 Double Eruption Case
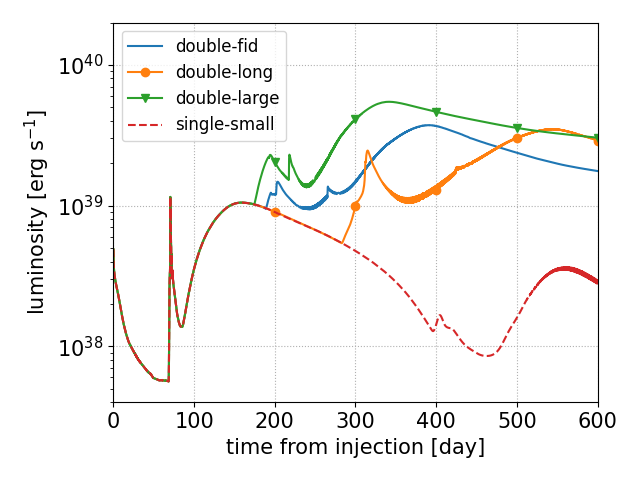
In Figure 5 we show the bolometric light curves for two injections, overlapped with the single injection case of . The second breakout occurs 50-100 days after the energy injection, followed by a rebrightening in the light curve.
In the second eruption, the shock sweeps through an inflated envelope with large radius and reduced density. Thus and are larger than the first shock breakout, and from equations (5) and (6) the emission has a longer duration and larger luminosity. This is more pronounced for larger which enables the first ejecta to expand farther. A larger also reduces the optical depth of the first ejecta, making photons easier to escape before suffering from adiabatic losses. These effects lead to the second breakout being much easier to observe than the first breakout.
The subsequent peak lasting for hundreds of days is again due to the cooling emission. For the double-fid and double-long models, the peak luminosity is both , slightly brighter than the single-large model that injected the same amount of total energy. For the double-large case with the largest energy injection, the peak luminosity is .
3.3 Multi-band Light Curves
|
|
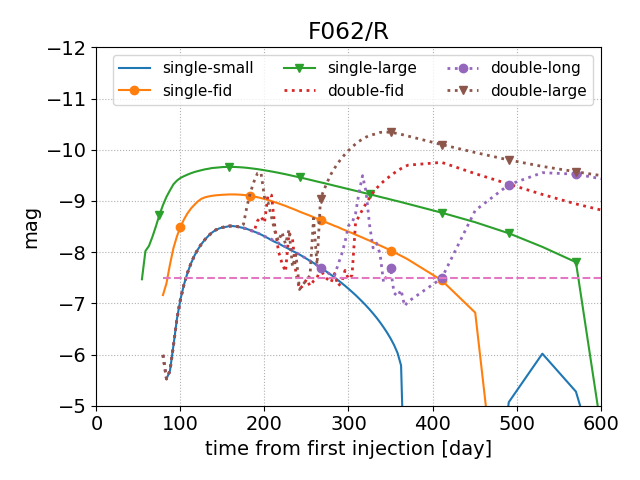
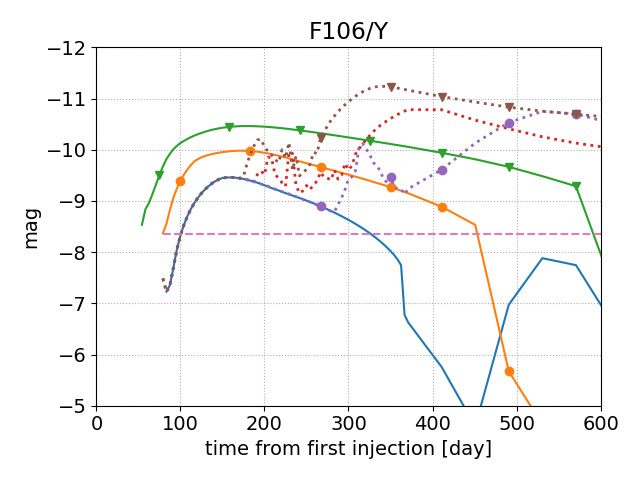
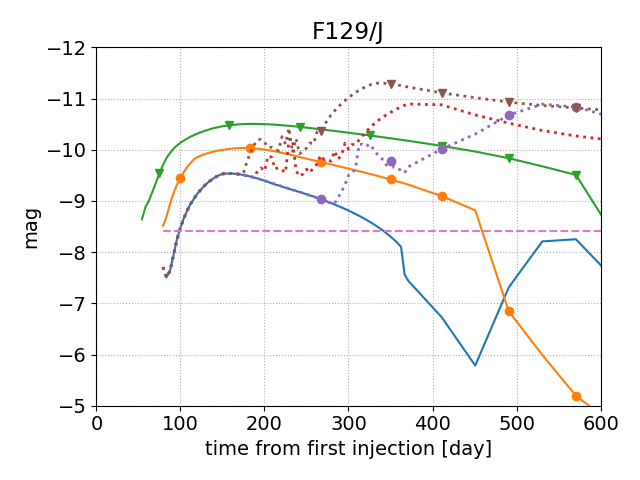
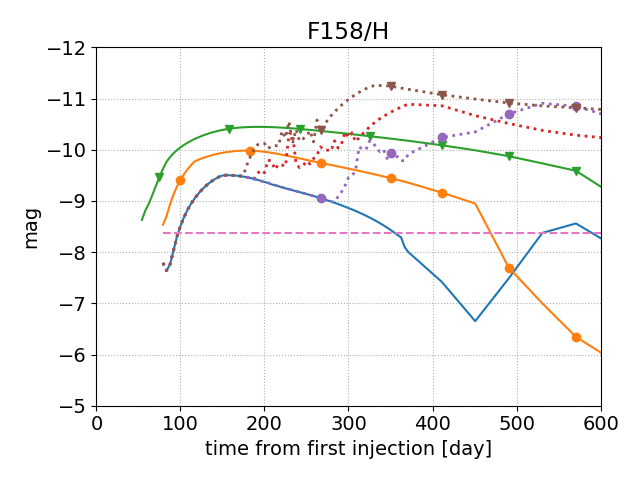
Figure 6 shows the absolute magnitudes in four bands covering from optical to near-infrared. The single eruption models display a plateau of mag in the R-band and mag in the infrared bands. The emission at peak is 1-2 mag brighter than the original progenitor, shown as horizontal dashed lines.
The double eruption models display two peaks that arise from the second eruption. The second peak is typically brighter, with mag in the infrared. Despite the peak bolometric luminosity is similar to the single-large model, the peak magnitude in the infrared bands is brighter by up to mag. This is due to the larger radius of the photosphere for the double eruption models.
4 Discussion
4.1 Comparison with Observations
Strotjohann et al. (2021) have done the most extensive observational study of precursors, using SNe detected by the Zwicky Transient Facility. They have found months-long precursor events brighter than -13 mag in of Type IIn SNe. While this is much brighter than our predictions, the sensitivity of their observations leave the emission dimmer than mag unconstrained.
In fact, we speculate that these precursor events are unrelated to the eruptions of RSGs like considered in this work. First, the identified progenitors of Type IIn SNe with precursors, such as SN 2009ip and 2015bh, are found to be luminous blue variables rather than RSGs (Smith et al., 2010; Mauerhan et al., 2013; Elias-Rosa et al., 2016; Boian & Groh, 2018). Second, the total radiated energy of these precursors are – erg, which require at least this much energy deposited into the envelope. Since RSG envelopes have a low gravitational binding energy of order , this deposition results in most (if not all) of the envelope being ejected. While this may not be in conflict with Type IIn SNe, the subsequent SNe will be much brighter than typical Type II SNe due to CSM interaction (e.g., Ouchi & Maeda, 2019).
From the above arguments we conclude that eruptions of RSGs are not responsible for the detected precursors, at least for the brightest ones. Instead, eruptive mass loss from blue supergiant progenitors may be able to explain the energetics of the observed precursors, without having to expel the entire hydrogen-rich envelope. We plan to explore such possibility in future work.
A mechanism not considered in this work is emission from a wind-like mass loss, where energy is continuously supplied to the envelope instead of instantaneously (Quataert et al., 2016). This is claimed to explain a fraction of the precursors, such as the Type II-P SN 2020tlf (Matsumoto & Metzger 2022; see also Chugai & Utrobin, 2022). Highly asymmetric energy injection by e.g. jets (Soker 2022 and references therein) may be another possibility to both realize the bright luminosity and retain most of the hydrogen-rich envelope. Our code assumes spherical symmetry, and studying these would require multi-dimensional simulations with radiation transfer.
A survey of nearby failed SNe observed an outburst of from a RSG, followed by an apparent vanish of the progenitor in optical (Gerke et al., 2015; Adams et al., 2017). In a failed SN, reduction of gravity by neutrino emission from the core can give an outward push to the envelope. This excess energy may expel the envelope (Nadezhin, 1980; Lovegrove & Woosley, 2013; Fernández et al., 2018; Tsuna et al., 2020; Ivanov & Fernández, 2021), with effectively the same physics as considered here. While the observed luminosity roughly agrees with theoretical predictions of failed SNe of RSGs (Lovegrove & Woosley, 2013; Fernández et al., 2018), recent work based on a more sophisticated treatment of the inner core physics finds a dimmer value (; Ivanov & Fernández 2021). This may imply the existence of a precursor event considered here, that can enhance the luminosity of the mass ejection.
4.2 Prospects for Future Detection
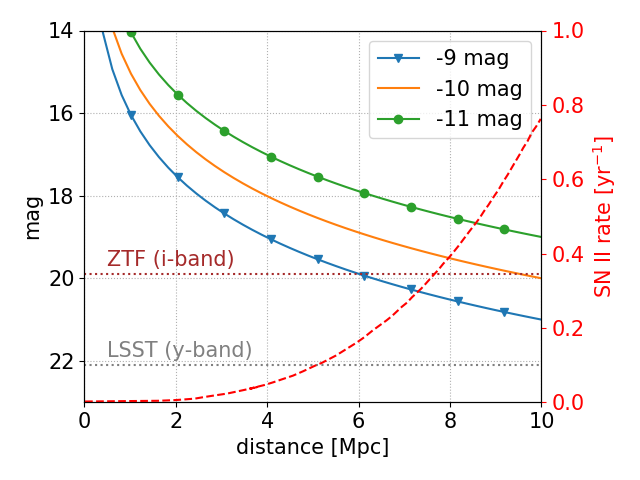
Given the sensitivity limit of current observations, we predict that there is a hidden population of dim precursors of Type II SNe that arise from eruptions of RSGs. Light curve modelling of Type II SNe constrain the extent of the dense CSM to be typically (Morozova et al., 2018), which implies a timescale of year from eruption to core-collapse. This is long enough to assume that the light curve of the precursor can reach around its peak before the progenitor collapses.
In this section we consider observational strategies to find these events, focusing on local (within Mpc) and Galactic Type II SNe. The former distance range is motivated by the detectability by future Megaton-class neutrino facilities (Ando et al., 2005; Kistler et al., 2011; Böser et al., 2015), and we can expect Type II SN per year within this volume (e.g., Horiuchi et al., 2013; Nakamura et al., 2016). Finding these precursors would enable detection of the (very brief) shock breakout of the following SN. This would help narrow down the temporal search window for neutrino and gravitational-waves, thus enhancing the sensitivity of these detectors.
For the local sources, a straightforward strategy is to monitor the nearby galaxies within 10 Mpc, preferentially in the near-infrared. Within 10 Mpc there are Milky Way-like galaxies that dominate the core-collapse SN rate. Given that outbursts occur order 100 days before the SN, monitoring these with a cadence of tens of days would realize early warning of the SN.
In Figure 7 we plot the observed magnitude for precursors of to mag, along with the SN II rate. The required sensitivity is – mag if one hopes to detect all of the precursors within 10 Mpc. This sensitivity is in fact expected to be achieved by the Rubin Observatory, with single-visit depths of and mag in the and bands respectively with cadence of 3 days (Ivezić et al., 2019).
For Galactic SN precursors, an infrared search is likely required due to the severe extinction by foreground dust. A precursor at kpc is expected to be visible by naked eye ( mag) without dust, but for a typical SN in the disk the emission will suffer extinction of up to 20–30 mag in the optical (Adams et al., 2013). A near-infrared survey in e.g. the J-band will reduce the extinction by a factor of (Cardelli et al., 1989), making searches more feasible. Adams et al. (2013) finds that most (92%) of the progenitor RSGs would have already been catalogued by 2MASS (Skrutskie et al., 2006), so confusion with other sources can thus be mitigated by inspection of archival images.
5 Conclusions
Using the open-source code CHIPS, we have simulated the optical and infrared light curves of eruptions from a RSG star. The light curves are powered by a brief shock breakout pulse of days, and a much longer cooling emission lasting for hundreds of days. For eruptions of lower energy, they are followed by a dim peak powered by fallback of the bound envelope.
The cooling emission can range from to mag in the near-infrared, and is brighter than the original RSG progenitor by several mag. We expect that precursors of local ( Mpc) and Galactic SNe can be found with surveys that have cadence of tens of days or shorter, preferably in the near infrared. We expect that these mass eruption events can serve as early warning of a near-future nearby SN, which will be important for multi-messenger studies of core-collapse SNe.
Monitoring of such eruptive events would also give us important clues for understanding the final moments of a massive star’s life. The observed infrared/optical signals will give us clues to constrain the proposed mechanisms for extreme mass loss. On the other hand, quantitative predictions for the energy injections are limited at present (but see e.g. Wu & Fuller 2021), and future work shall aim to determine the energy budget for progenitors of various masses.
Appendix A Dependence on Red Supergiant Progenitor Models
In this section we consider mass eruption from red supergiant progenitors with different zero-age main sequence (ZAMS) mass from the 15 model. Here we additionally construct two progenitors of ZAMS masses of and , which likely lie at the extremes in the mass range of RSGs. These masses are within the mass ranges where the energy injection due to wave-heating can be relatively stronger (Wu & Fuller, 2021).
The progenitors were constructed by the test suite “example_make_pre_ccsn” available in MESA revision 12778, similar to the model. The properties for the two new progenitors, along with our fiducial 15 progenitor, are shown in Table 2. For the model, the evolution halts after core oxygen burning, due to numerical problems arising from a spike in the density profile just interior to the helium core. We estimate the time to core-collapse by dividing the total binding energy in the CO core by the neutrino luminosity, to be about 1 year. This is much shorter than the envelope’s Kelvin-Helmholtz timescale years, where and are respectively the mass and surface luminosity of the star. Thus we can approximate that the envelope is not greatly altered until core-collapse, and use this model in the eruption simulations. On the other hand the model is successfully evolved up to core-collapse, and as in the model we use the progenitor model at core-collapse in our simulations.
| ZAMS mass [] | Radius [] | Effective temperature [K] | H-envelope mass [] | Helium-core mass [] |
| 15 | 670 | 4000 | 7.9 | 4.9 |
| 11 | 460 | 4100 | 7.0 | 3.2 |
| 24 | 830 | 4400 | 8.3 | 8.4 |
|
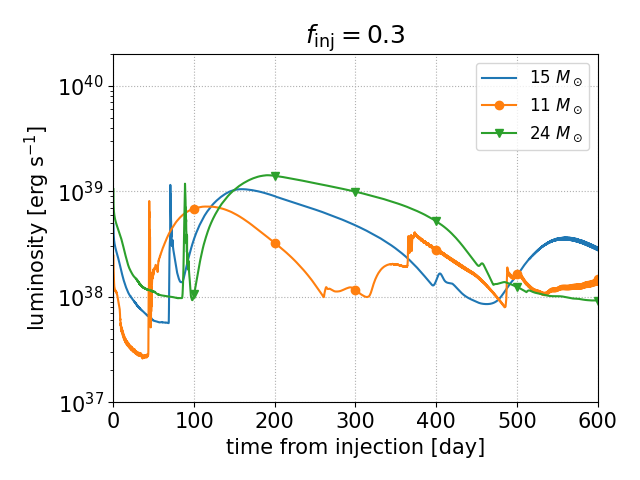
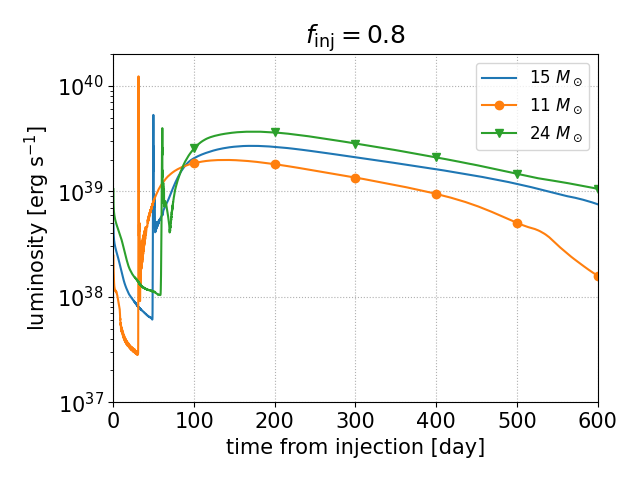
We model mass eruption with energy injection of and , which correspond to the single-small and single-large models respectively in the main text. The light curves are shown in Figure 8. We note that for the model with , there is some instability seen in the light curve at late phases of 400 days. This arises from the numerical instability caused by the large density discontinuity at the interface of the bound CSM and the star, after fallback of the bound CSM starts to dominate the emission. We thus focus the comparison on the shock breakout and the recombination-powered emission.
While the two components in the light curve of shock breakout and recombination emission are seen for all of the models, the light curves evolve generally faster and dimmer for a smaller ZAMS mass model. This is mainly found to be due to difference in the mass of the ejected envelope of around a factor 2 between the and models. The variation in both duration and peak luminosity of the recombination emission are both within a factor of 2. As these dependences appear to be degerate with the injected energy, the precursor light curves alone would be insufficient to infer both the progenitor and the injected energy. Independent information of the progenitor from archival data would be key to further understand the underlying energy injection processes. Images of massive stellar populations with sufficient resolution are available for sufficiently nearby galaxies within – Mpc (Smartt, 2009), which cover the typical distance of the supergiants we are targeting here.
Appendix B Dependence on Duration of Energy Injection
|
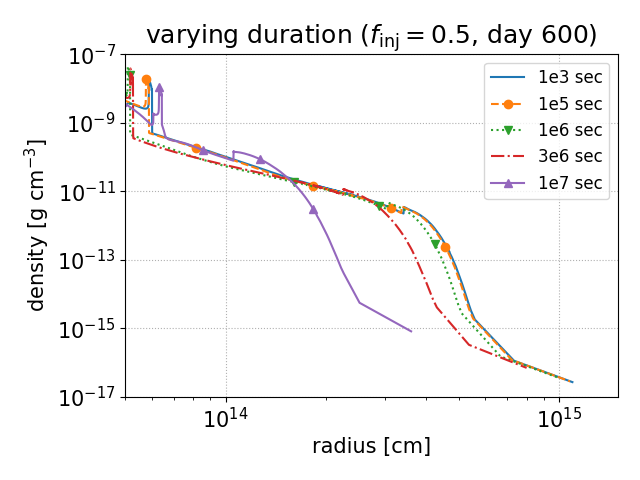
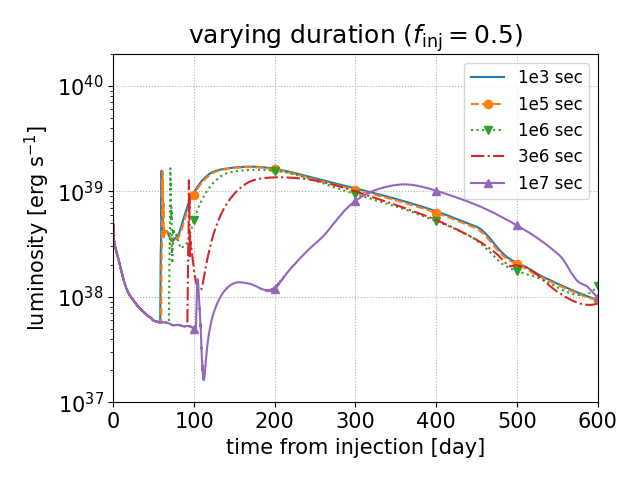
It is also important to check how our parameters would depend on the duration of the energy injection, which can be different for the various mechanisms proposed in the literature. Furthermore, Ko et al. (2022) found that mass eruption can become much weaker when this duration is comparable to the dynamical timescale of the envelope. Here we study how the luminosity and the final CSM formation would depend on the duration of the injection.
We adopt the progenitor as in the main text, and fix the total injected energy as . We consider injection durations longer than the nearly instantaneous case adopted in the main text ( sec), with values {, , , } sec. For all cases, injection is done with a constant luminosity, uniformly over the inner 10 cells.
The density profiles of the erupted material at the end of the simulations (600 days from energy injection) are shown in the left panel of Figure 9. The density profiles for durations of sec are nearly indistinguishable from that with the duration of sec. When the duration starts to become comparable to the dynamical timescale at the envelope sec, the eruption starts to be affected by the gravity of the central star and the reduced energy supplied to the propagating shock. The resulting eruption is much weaker for the cases with durations of sec. For these two cases, the unbound mass is drastically reduced to and respectively, from the for an instantaneous duration of sec. The drastic change of the unbound mass around this timescale qualitatively agrees with the results of Ko et al. (2022).
The corresponding light curves of the precursor emission are shown in the right panel of Figure 9. Similar to the density profile, for injection durations of sec the precursor emission is almost insensitive to the duration. Significant difference is again seen for durations of and sec, where the weaker energy of the shock results in a delayed and weaker breakout pulse and a delayed peak of the recombination emission. Interestingly the peak luminosity is found to be similar for all the models, implying that the amount of envelope contributing to the recombination emission is insensitive to the injection duration.
The dependence of the mass loss on the energy injection duration was also studied in Leung et al. (2021a), but for a helium star that lost all of its hydrogen envelope prior to energy injection. While they do not show the detailed light curve during the mass loss, in Figure 1 they obtain the luminosity profile at the end of the energy deposition phase (when they regard as core-collapse). For models that result in mass-loss the surface luminosity is inversely proportional to the injection duration. This hints that in contrast to our results with hydrogen-rich progenitors where hydrogen recombination powers the emission, for these stripped progenitors the precursor emission is powered by the energy injection itself and more directly reflects the injection history.
References
- Adams et al. (2013) Adams, S. M., Kochanek, C. S., Beacom, J. F., Vagins, M. R., & Stanek, K. Z. 2013, ApJ, 778, 164, doi: 10.1088/0004-637X/778/2/164
- Adams et al. (2017) Adams, S. M., Kochanek, C. S., Gerke, J. R., Stanek, K. Z., & Dai, X. 2017, MNRAS, 468, 4968, doi: 10.1093/mnras/stx816
- Alexeyev et al. (1988) Alexeyev, E. N., Alexeyeva, L. N., Krivosheina, I. V., & Volchenko, V. I. 1988, Physics Letters B, 205, 209, doi: 10.1016/0370-2693(88)91651-6
- Andersson et al. (2013) Andersson, N., Baker, J., Belczynski, K., et al. 2013, Classical and Quantum Gravity, 30, 193002, doi: 10.1088/0264-9381/30/19/193002
- Ando et al. (2005) Ando, S., Beacom, J. F., & Yüksel, H. 2005, Phys. Rev. Lett., 95, 171101, doi: 10.1103/PhysRevLett.95.171101
- Aretxaga et al. (1999) Aretxaga, I., Benetti, S., Terlevich, R. J., et al. 1999, MNRAS, 309, 343, doi: 10.1046/j.1365-8711.1999.02830.x
- Bellm et al. (2019) Bellm, E. C., Kulkarni, S. R., Graham, M. J., et al. 2019, PASP, 131, 018002, doi: 10.1088/1538-3873/aaecbe
- Bionta et al. (1987) Bionta, R. M., Blewitt, G., Bratton, C. B., et al. 1987, Phys. Rev. Lett., 58, 1494, doi: 10.1103/PhysRevLett.58.1494
- Boian & Groh (2018) Boian, I., & Groh, J. H. 2018, A&A, 617, A115, doi: 10.1051/0004-6361/201731794
- Boian & Groh (2020) —. 2020, MNRAS, 496, 1325, doi: 10.1093/mnras/staa1540
- Böser et al. (2015) Böser, S., Kowalski, M., Schulte, L., Strotjohann, N. L., & Voge, M. 2015, Astroparticle Physics, 62, 54, doi: 10.1016/j.astropartphys.2014.07.010
- Bruch et al. (2021) Bruch, R. J., Gal-Yam, A., Schulze, S., et al. 2021, ApJ, 912, 46, doi: 10.3847/1538-4357/abef05
- Cardelli et al. (1989) Cardelli, J. A., Clayton, G. C., & Mathis, J. S. 1989, ApJ, 345, 245, doi: 10.1086/167900
- Chevalier (1982) Chevalier, R. A. 1982, ApJ, 258, 790, doi: 10.1086/160126
- Chevalier (2012) —. 2012, ApJ, 752, L2, doi: 10.1088/2041-8205/752/1/L2
- Chevalier & Irwin (2011) Chevalier, R. A., & Irwin, C. M. 2011, ApJ, 729, L6, doi: 10.1088/2041-8205/729/1/L6
- Chugai & Utrobin (2022) Chugai, N., & Utrobin, V. 2022, arXiv e-prints, arXiv:2205.07749. https://arxiv.org/abs/2205.07749
- Chugai (1991) Chugai, N. N. 1991, MNRAS, 250, 513, doi: 10.1093/mnras/250.3.513
- Das & Ray (2017) Das, S., & Ray, A. 2017, ApJ, 851, 138, doi: 10.3847/1538-4357/aa97e1
- Davies et al. (2022) Davies, B., Plez, B., & Petrault, M. 2022, arXiv e-prints, arXiv:2208.10883. https://arxiv.org/abs/2208.10883
- Dessart et al. (2010) Dessart, L., Livne, E., & Waldman, R. 2010, MNRAS, 405, 2113, doi: 10.1111/j.1365-2966.2010.16626.x
- Elias-Rosa et al. (2016) Elias-Rosa, N., Pastorello, A., Benetti, S., et al. 2016, MNRAS, 463, 3894, doi: 10.1093/mnras/stw2253
- Falk (1978) Falk, S. W. 1978, ApJ, 225, L133, doi: 10.1086/182810
- Faran et al. (2019) Faran, T., Goldfriend, T., Nakar, E., & Sari, R. 2019, ApJ, 879, 20, doi: 10.3847/1538-4357/ab218a
- Ferland et al. (2017) Ferland, G. J., Chatzikos, M., Guzmán, F., et al. 2017, Rev. Mexicana Astron. Astrofis., 53, 385. https://arxiv.org/abs/1705.10877
- Fernández et al. (2018) Fernández, R., Quataert, E., Kashiyama, K., & Coughlin, E. R. 2018, MNRAS, 476, 2366, doi: 10.1093/mnras/sty306
- Förster et al. (2018) Förster, F., Moriya, T. J., Maureira, J. C., et al. 2018, Nature Astronomy, 2, 808, doi: 10.1038/s41550-018-0563-4
- Fraser et al. (2013) Fraser, M., Magee, M., Kotak, R., et al. 2013, ApJ, 779, L8, doi: 10.1088/2041-8205/779/1/L8
- Fuller (2017) Fuller, J. 2017, MNRAS, 470, 1642, doi: 10.1093/mnras/stx1314
- Gerke et al. (2015) Gerke, J. R., Kochanek, C. S., & Stanek, K. Z. 2015, MNRAS, 450, 3289, doi: 10.1093/mnras/stv776
- Grassberg et al. (1971) Grassberg, E. K., Imshennik, V. S., & Nadyozhin, D. K. 1971, Ap&SS, 10, 28, doi: 10.1007/BF00654604
- Grassberg & Nadyozhin (1976) Grassberg, E. K., & Nadyozhin, D. K. 1976, Ap&SS, 44, 429, doi: 10.1007/BF00642530
- Hirata et al. (1987) Hirata, K., Kajita, T., Koshiba, M., et al. 1987, Phys. Rev. Lett., 58, 1490, doi: 10.1103/PhysRevLett.58.1490
- Horiuchi et al. (2013) Horiuchi, S., Beacom, J. F., Bothwell, M. S., & Thompson, T. A. 2013, ApJ, 769, 113, doi: 10.1088/0004-637X/769/2/113
- Horiuchi & Kneller (2018) Horiuchi, S., & Kneller, J. P. 2018, Journal of Physics G Nuclear Physics, 45, 043002, doi: 10.1088/1361-6471/aaa90a
- Iglesias & Rogers (1996) Iglesias, C. A., & Rogers, F. J. 1996, ApJ, 464, 943, doi: 10.1086/177381
- Ivanov & Fernández (2021) Ivanov, M., & Fernández, R. 2021, ApJ, 911, 6, doi: 10.3847/1538-4357/abe59e
- Ivezić et al. (2019) Ivezić, Ž., Kahn, S. M., Tyson, J. A., et al. 2019, ApJ, 873, 111, doi: 10.3847/1538-4357/ab042c
- Jacobson-Galán et al. (2022) Jacobson-Galán, W. V., Dessart, L., Jones, D. O., et al. 2022, ApJ, 924, 15, doi: 10.3847/1538-4357/ac3f3a
- Johnson et al. (2018) Johnson, S. A., Kochanek, C. S., & Adams, S. M. 2018, MNRAS, 480, 1696, doi: 10.1093/mnras/sty1966
- Kasen & Woosley (2009) Kasen, D., & Woosley, S. E. 2009, ApJ, 703, 2205, doi: 10.1088/0004-637X/703/2/2205
- Kheirandish & Murase (2022) Kheirandish, A., & Murase, K. 2022, arXiv e-prints, arXiv:2204.08518. https://arxiv.org/abs/2204.08518
- Kistler et al. (2011) Kistler, M. D., Yüksel, H., Ando, S., Beacom, J. F., & Suzuki, Y. 2011, Phys. Rev. D, 83, 123008, doi: 10.1103/PhysRevD.83.123008
- Ko et al. (2022) Ko, T., Tsuna, D., Takei, Y., & Shigeyama, T. 2022, ApJ, 930, 168, doi: 10.3847/1538-4357/ac67e1
- Kochanek (2019) Kochanek, C. S. 2019, MNRAS, 483, 3762, doi: 10.1093/mnras/sty3363
- Kuriyama & Shigeyama (2020) Kuriyama, N., & Shigeyama, T. 2020, A&A, 635, A127, doi: 10.1051/0004-6361/201937226
- Kuriyama & Shigeyama (2021) —. 2021, A&A, 646, A118, doi: 10.1051/0004-6361/202038637
- Leung & Fuller (2020) Leung, S.-C., & Fuller, J. 2020, ApJ, 900, 99, doi: 10.3847/1538-4357/abac5d
- Leung et al. (2021a) Leung, S.-C., Fuller, J., & Nomoto, K. 2021a, ApJ, 915, 80, doi: 10.3847/1538-4357/abfcbe10.48550/arXiv.2103.06548
- Leung et al. (2021b) Leung, S.-C., Wu, S., & Fuller, J. 2021b, ApJ, 923, 41, doi: 10.3847/1538-4357/ac2c63
- Levermore & Pomraning (1981) Levermore, C. D., & Pomraning, G. C. 1981, ApJ, 248, 321, doi: 10.1086/159157
- Li et al. (2011) Li, W., Chornock, R., Leaman, J., et al. 2011, MNRAS, 412, 1473, doi: 10.1111/j.1365-2966.2011.18162.x
- Lovegrove & Woosley (2013) Lovegrove, E., & Woosley, S. E. 2013, ApJ, 769, 109, doi: 10.1088/0004-637X/769/2/109
- Marigo & Aringer (2009) Marigo, P., & Aringer, B. 2009, A&A, 508, 1539, doi: 10.1051/0004-6361/200912598
- Marigo et al. (2022) Marigo, P., Aringer, B., Girardi, L., & Bressan, A. 2022, ApJ, 940, 129, doi: 10.3847/1538-4357/ac9b40
- Matsumoto & Metzger (2022) Matsumoto, T., & Metzger, B. D. 2022, arXiv e-prints, arXiv:2206.08377. https://arxiv.org/abs/2206.08377
- Matzner & McKee (1999) Matzner, C. D., & McKee, C. F. 1999, ApJ, 510, 379, doi: 10.1086/306571
- Matzner & Ro (2021) Matzner, C. D., & Ro, S. 2021, ApJ, 908, 23, doi: 10.3847/1538-4357/abd03b
- Mauerhan et al. (2013) Mauerhan, J. C., Smith, N., Filippenko, A. V., et al. 2013, MNRAS, 430, 1801, doi: 10.1093/mnras/stt009
- Moriya et al. (2013) Moriya, T. J., Blinnikov, S. I., Tominaga, N., et al. 2013, MNRAS, 428, 1020, doi: 10.1093/mnras/sts075
- Morozova et al. (2017) Morozova, V., Piro, A. L., & Valenti, S. 2017, ApJ, 838, 28, doi: 10.3847/1538-4357/aa6251
- Morozova et al. (2018) —. 2018, ApJ, 858, 15, doi: 10.3847/1538-4357/aab9a6
- Murase et al. (2014) Murase, K., Thompson, T. A., & Ofek, E. O. 2014, MNRAS, 440, 2528, doi: 10.1093/mnras/stu384
- Nadezhin (1980) Nadezhin, D. K. 1980, Ap&SS, 69, 115, doi: 10.1007/BF00638971
- Nakamura et al. (2016) Nakamura, K., Horiuchi, S., Tanaka, M., et al. 2016, MNRAS, 461, 3296, doi: 10.1093/mnras/stw1453
- Ofek et al. (2014) Ofek, E. O., Sullivan, M., Shaviv, N. J., et al. 2014, ApJ, 789, 104, doi: 10.1088/0004-637X/789/2/104
- Ouchi & Maeda (2019) Ouchi, R., & Maeda, K. 2019, ApJ, 877, 92, doi: 10.3847/1538-4357/ab1a37
- Pastorello et al. (2013) Pastorello, A., Cappellaro, E., Inserra, C., et al. 2013, ApJ, 767, 1, doi: 10.1088/0004-637X/767/1/1
- Paxton et al. (2011) Paxton, B., Bildsten, L., Dotter, A., et al. 2011, ApJS, 192, 3, doi: 10.1088/0067-0049/192/1/3
- Paxton et al. (2013) Paxton, B., Cantiello, M., Arras, P., et al. 2013, ApJS, 208, 4, doi: 10.1088/0067-0049/208/1/4
- Paxton et al. (2015) Paxton, B., Marchant, P., Schwab, J., et al. 2015, ApJS, 220, 15, doi: 10.1088/0067-0049/220/1/15
- Paxton et al. (2018) Paxton, B., Schwab, J., Bauer, E. B., et al. 2018, ApJS, 234, 34, doi: 10.3847/1538-4365/aaa5a8
- Paxton et al. (2019) Paxton, B., Smolec, R., Schwab, J., et al. 2019, ApJS, 243, 10, doi: 10.3847/1538-4365/ab2241
- Pejcha et al. (2022) Pejcha, O., Calderón, D., & Kurfürst, P. 2022, MNRAS, 510, 3276, doi: 10.1093/mnras/stab3729
- Quataert et al. (2016) Quataert, E., Fernández, R., Kasen, D., Klion, H., & Paxton, B. 2016, MNRAS, 458, 1214, doi: 10.1093/mnras/stw365
- Quataert & Shiode (2012) Quataert, E., & Shiode, J. 2012, MNRAS, 423, L92, doi: 10.1111/j.1745-3933.2012.01264.x
- Shiode & Quataert (2014) Shiode, J. H., & Quataert, E. 2014, ApJ, 780, 96, doi: 10.1088/0004-637X/780/1/96
- Skrutskie et al. (2006) Skrutskie, M. F., Cutri, R. M., Stiening, R., et al. 2006, AJ, 131, 1163, doi: 10.1086/498708
- Smartt (2009) Smartt, S. J. 2009, ARA&A, 47, 63, doi: 10.1146/annurev-astro-082708-10173710.48550/arXiv.0908.0700
- Smith (2014) Smith, N. 2014, ARA&A, 52, 487, doi: 10.1146/annurev-astro-081913-040025
- Smith & Arnett (2014) Smith, N., & Arnett, W. D. 2014, ApJ, 785, 82, doi: 10.1088/0004-637X/785/2/82
- Smith et al. (2011) Smith, N., Li, W., Filippenko, A. V., & Chornock, R. 2011, MNRAS, 412, 1522, doi: 10.1111/j.1365-2966.2011.17229.x
- Smith et al. (2010) Smith, N., Miller, A., Li, W., et al. 2010, AJ, 139, 1451, doi: 10.1088/0004-6256/139/4/1451
- Soker (2022) Soker, N. 2022, arXiv e-prints, arXiv:2208.04875. https://arxiv.org/abs/2208.04875
- Strotjohann et al. (2021) Strotjohann, N. L., Ofek, E. O., Gal-Yam, A., et al. 2021, ApJ, 907, 99, doi: 10.3847/1538-4357/abd032
- Szczepańczyk et al. (2021) Szczepańczyk, M. J., Antelis, J. M., Benjamin, M., et al. 2021, Phys. Rev. D, 104, 102002, doi: 10.1103/PhysRevD.104.102002
- Takei et al. (2022) Takei, Y., Tsuna, D., Kuriyama, N., Ko, T., & Shigeyama, T. 2022, ApJ, 929, 177, doi: 10.3847/1538-4357/ac60fe
- Timmes & Arnett (1999) Timmes, F. X., & Arnett, D. 1999, ApJS, 125, 277, doi: 10.1086/313271
- Timmes & Swesty (2000) Timmes, F. X., & Swesty, F. D. 2000, ApJS, 126, 501, doi: 10.1086/313304
- Tsuna et al. (2020) Tsuna, D., Ishii, A., Kuriyama, N., Kashiyama, K., & Shigeyama, T. 2020, ApJ, 897, L44, doi: 10.3847/2041-8213/aba0ac
- Tsuna et al. (2019) Tsuna, D., Kashiyama, K., & Shigeyama, T. 2019, ApJ, 884, 87, doi: 10.3847/1538-4357/ab40ba
- Tsuna et al. (2021) Tsuna, D., Takei, Y., Kuriyama, N., & Shigeyama, T. 2021, PASJ, 73, 1128, doi: 10.1093/pasj/psab063
- van Marle et al. (2010) van Marle, A. J., Smith, N., Owocki, S. P., & van Veelen, B. 2010, MNRAS, 407, 2305, doi: 10.1111/j.1365-2966.2010.16851.x
- Waxman & Katz (2017) Waxman, E., & Katz, B. 2017, in Handbook of Supernovae, ed. A. W. Alsabti & P. Murdin, 967, doi: 10.1007/978-3-319-21846-5_33
- Wu & Fuller (2021) Wu, S., & Fuller, J. 2021, ApJ, 906, 3, doi: 10.3847/1538-4357/abc87c
- Yaron et al. (2017) Yaron, O., Perley, D. A., Gal-Yam, A., et al. 2017, Nature Physics, 13, 510, doi: 10.1038/nphys4025