Effective permeability of an immiscible fluid in porous media determined from its geometric state
Abstract
Based on the phenomenological extension of Darcy’s law, two-fluid flow is dependent on a relative permeability function of saturation only that is process/path dependent with an underlying dependency on pore structure and wettability. For applications, fuel cells to underground storage, it is imperative to determine the effective phase permeability relationships where the traditional approach is based on the inverse modelling of time-consuming experiments. The underlying reason is that the fundamental upscaling step from pore to Darcy scale, which links the pore structure of the porous medium to the continuum hydraulic conductivities, is not solved. Herein, we develop an Artificial Neural Network (ANN) that relies on fundamental geometrical relationships to determine the mechanical energy dissipation during creeping immiscible two-fluid flow. The developed ANN is based on a prescribed set of state variables based on physical insights that predicts the effective permeability of 4,500 unseen pore-scale geometrical states with .
I Introduction
Multiphase flow in porous media is common to various technological applications, including fuel cells [1], supercritical carbon dioxide storage [2], subsurface hydrogen storage [3], contaminant hydrology [4], recovery of transition fuels [5], and negative compressibility materials [6]. It is well-known that the constitutive relationship for relative permeability used in multiphase flow models is valid for only a specific process taking a specific saturation path [7, 8] and thus, the generality of such models are limited. Processes not captured in that limited experimental parameter space, such as nucleation of a gas phase, e.g., in electrolysis, rather than the co-injection of fluids, result in significantly different relative permeability for the same saturation [9, 10]. However, there is currently no satisfactory physics-based approach to encode the state space for a generalized relationship even though theoretical works have shown the importance of kinematic analysis beyond saturation only functions [11].
We take advantage of a recent discovery that the capillary state at quasi-equilibrium, which is process dependent in a manner similar to relative permeability, can be uniquely defined when a complete set of state variables are considered [12]. The approach was based on Hadwiger’s theorem that defines the four Minkowski functionals [13] as a complete set of geometrical measures [14]. A piecewise polynomial model (generalized additive model, GAM) can be used to parameterize the state function for quasi-static capillary pressure with the state variables: fluid saturation, surface area, and topology with [12]. The question now is whether this approach can also be extended to effective permeability being a dynamic property based on the viscous stress tensor and velocity field both of which are geometrically constrained by the flowing pathway. While the GAM approach was effective for the fitting of up to three state variables; however, to predict effective permeability, all four Minkowski functionals are presumably required with highly non-linear relationships, which is beyond the possibilities of simple polynomials. As an alternative, artificial neural networks (ANNs) are an attractive candidate for parametrization in higher dimensional space because they are known to be universal approximators [15].
The geometrical state of fluids in porous media has been extensively characterised through the utilization of X-ray microcomputed tomography (micro-CT) and microfluidic experiments [16, 17]. The earliest microfluidic observations of multiphase flow report different flow regimes from connected pathway flow to ganglion dynamics to drop traffic flow depending on Capillary number () and fluid saturation [18, 19]. being the dimensionless ratio between capillary and viscous forces. For approximately , fluids are expected to form connected pathways and provide a linear response between flow rate and pressure drop [20]. These pathways are geometrically and topologically complex with no analytical solution for the velocity field. This flow regime is the standard for experimental relative permeability measurements in special core analysis [21, 22]. At , the fluid pathways are commonly reported as being intermittent, resulting in the creation/destruction of interfacial area [23, 24]; in addition, a non-linear response between flow rate and pressure drop can be observed [20, 25]. The time derivative of the internal energy becomes complex due to additional energy dissipation during geometrical and topological changes and flow rate fluctuations [26]. At approximately , the fluids undergo ganglion dynamics whereby disconnected phases flow through the porous domain [19].
Presumably, under steady state connected pathway flow, the main contribution to energy dissipation, and thus effective permeability is defined by the viscous stress tensor [27]. The condition of steady state requires that all extensive variables are constant, such as interfacial energy and/or phase volume. Recent works have shown that a detailed balance is maintained under intermittent conditions when time-and-space averaging is considered [28]. Recent work by [29] observed red noise in the pressure signal even at very low , suggesting that intermittent filling events occur in a stochastic manner. However, the degree to which the bulk topology of the connected pathways is influenced under low is unclear. Herein, we assume that connected pathways are maintained under creeping flow conditions or at least to a degree at which the impact on relative permeability is negligible.
We hypothesize that under capillary dominated creeping flow the effective permeability of a phase can be predicted by an ANN when given a complete set of geometric measures, i.e., the Minkowski functionals. Our proposition is that each connected fluid pathway can be characterised by an ‘equivalent domain’ whereby effective permeability, related to total mechanical energy dissipation, is of geometric origin. The approach is inspired by other recent successes with ANN-based models, such as estimation of the stress distribution during finite element analysis [30], force field models to learn the relationship between chemical structure and potential energy [31, 32], and the identification of Koopman eigenfunctions [33].
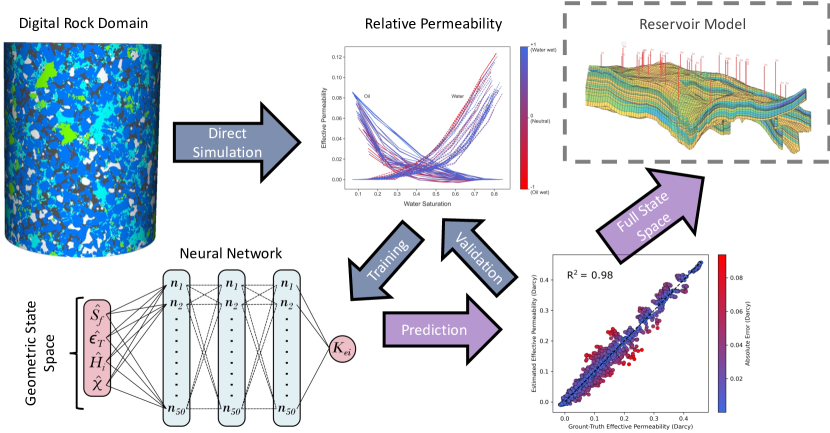
The traditional workflow for developing a reservoir model involves the collection of relative permeability data where a single curve represents a single set of parameters defined by Bond number, Capillary number, wettability, and viscosity ratio (or mobility number) and a single history dependence, e.g., imbibition or drainage [22]. The overall workflow proposed herein (Figure 1) circumvents these limitations by leveraging the wealth of information provided by pore-scale simulations and recent advances in ANNs to provide a predictive relative permeability for a wide range of operational parameters. The application of an ANN relative permeability model for reservoir simulation remains as future work. Yet the potential for an ANN to predict relative permeability based on the fluid geometrical state alone is the focus of the work presented herein. Our basic approach is to evaluate the impact that the geometrical state of a fluid body has on the relative permeability by using an ANN and pore-scale simulation data.
I.1 Equivalent Domain Model
To develop our physical insights and provide justification for the state variables, we examine the co-directional flow of two connected pathways through a porous domain. The flow conditions are immiscible, creeping, and capillary dominated. Each connected pathway is decomposed into an ‘equivalent domain’ that contains only the respective phase.
Consider a fluid flow that is subject to force balance such that Stokes’ equations are satisfied locally,
| (1) | |||||
| (2) |
where the deviatoric stress tensor is and the pressure is . The flow domain has cross-sectional area and length , and contains multiple fluid regions. Let be the region of space occupied by fluid , with an associated boundary . Each such boundary surface can be decomposed into three regions: the inlet , the outlet and the interior boundary ,
| (3) |
In a situation where the internal boundaries do not move, the pressure force must balance the contribution of the shear stresses when considered in the direction normal to the boundary, denoted by ,
| (4) |
However, this force balance does not hold at the inlet and outlet due to the net flow of fluid through each surface. The flow is oriented in the same direction as the normal vector , which will be oriented in a parallel direction for any cross-section. Within , the flow is Newtonian,
| (5) |
with the fluid viscosity. If the system is homogeneous, then the volumetric flow rate can be expressed as
| (6) |
where is the porosity and is the saturation of fluid . Since the fluids are incompressible, the superficial velocity for fluid will be constant for any cross-section ,
| (7) |
with .
Equivalently, the volumetric flow rate is independent of the height along the flow direction .
We now consider a force balance along the boundary of .
The force exerted on a boundary element includes contributions from the deviatoric stress tensor and the pressure. Considering the whole fluid region, a total force balance requires an equivalence between the
boundary pressure forces and the internal stresses.
This is stated microscopically by Eq. 1. Integrating this expression over the fluid region and applying the divergence theorem to the pressure term, the pressure difference between the inlet and outlet is linked with the net contribution of viscous forces
within the region ,
| (8) |
where
| (9) |
In general the contributions due to will include both interfacial and viscous stresses. In a capillary dominated system, the viscous stresses are of particular interest since their contribution will account for the quasi-static flow behavior. For a Newtonian fluid, the magnitude for these forces will be determined directly by the pore-scale velocity gradients. For porous media the hydraulic radius is commonly used to define a reference length scale as the ratio of cross sectional area to the wetting perimeter, . The standard definition of hydraulic radius () for an ‘equivalent’ domain is
| (10) |
where is particle (or grain) diameter and is porosity. Assuming a no-slip boundary condition, the flow velocity will go to zero at solid grain boundaries. The hydraulic radius thereby establishes the reference length scale for velocity gradients. Therefore, we consider the following non-dimensional representation,
| (11) |
For Stokes’ flow the structure of the velocity field will be entirely determined from the micro-structure of the porous material. Conceptually, let us assume that a non-dimensional shape function exists that can account for the net force that is due to the microscopic structure of the viscous stresses,
| (12) |
Inserting this into Eq. 8 and rearranging terms,
| (13) |
The objective of our artificial intelligence model is therefore to learn the structure of , which is expected to depend on invariant measures of the geometric structure for fluid .
Darcy’s law is commonly extended to represent the flow of two immiscible fluids in a porous domain [34, 35]. The extended relationship provides a linear relationship for the superficial velocity of phase as
| (14) |
where is the effective permeability of phase . Based on Equations 13 and 14,
| (15) |
Effective permeability is therefore based on geometry only. While the geometrical factors are unknown, we know that these parameters are dependent on the morphology of the connected pathway.
I.2 Geometrical State Function
The Minkowski functionals are geometric measures of size based on set theory [36]. By considering a connected fluid body (X) embedded in Euclidean space () with boundary surface , integral geometry provides functionals where is the dimension of . The first functional, , is the total volume of . The second functional, , is the integral measure of the surface area of . The third functional, , is the integral of mean curvature of . The fourth functional, , is the integral of Gaussian curvature of .
The Minkowski functionals can be normalized by the total system volume to provide a set of intensive parameters. The first parameter is simply fluid saturation, . The second parameter is the specific interfacial area of a fluid body, . For the third parameter, an approximation to replace the mean curvature of with the fluid pressure difference based on the capillary pressure () can be used [37]. The approximation is
| (16) |
where is the fluid/fluid interfacial area and is the fluid/solid interfacial area. Conveniently is already defined in multiphase flow models. The interfacial tension is usually a known parameter, and the grain Sauter diameter is directly measurable. The fourth parameter provides the degree of connectivity per volume, .
Hadwiger’s theorem states that any linear additive property () of an object can be represented by a linear combination of the Minkowski functionals. [14]
| (17) |
where is a coefficient that is independent of fluid body (X). Motion-invariant means that does not depend on the orientation of .
II Materials and Methods
II.1 Multiphase Flow Simulations
Simulations were conducted using a parallel implementation of the colour-gradient Lattice Boltzmann method (LBPM) [41]. The code has been documented, validated, and tested in numerous publications [42, 43, 38, 44, 12]. To obtain a diverse set of geometrical states under creeping flow conditions, we simulated a wide range of wetting conditions [45]. In total, the simulations took 12 hours of walltime using 48 NVIDIA V100 GPUs on the Summit Supercomputer.
We used a segmented micro-CT image of a North Sea sandstone where the mineral phases were identified on a per voxel basis. The details of the image processing workflow and mineralogy are provided in the Supporting Materials. For simplification, we grouped the mineral voxels into three groups - quartz (74%), clay (19%) and carbonate (6.3%). For initializing numerical simulations, the mineral groups were defined by various contact angles that represent a wide range of different fluid pairs. The wettability of these systems was defined as a summation of the cosine of the contact angles for each mineral/fluid/fluid combination, determined as
| (19) |
where , and are the solid voxel fractions of quartz, clay and carbonate, respectively. This metric provides a scale from strongly water-wet () to strongly oil-wet (). In addition, the squared variance, , of the contact angle values defines the spatial variability. In total 36 different wetting conditions were simulated. The wetting distribution was considered in three ways. (1) The mineral type is the only reason for the wetting affinity to vary. (2) Fluid history is the only reason for the wetting affinity; based on an initial morphological drainage of the image to 20 percent saturation. (3) Wetting affinity varies based on both fluid history and mineral type.
Further details on the image processing, wetting distributions, and contact angles (affinity values) used are provided in the Supporting Materials.
II.2 Artificial Neural Network
A simple ANN was tasked to find Equation 18 within the defined state space. The ANN had three hidden layers, each with 50 neurons and was trained for a total of 250 epochs using the stochastic gradient decent optimizer with an initial learning rate of 0.001, which was reduced by 10% after 10 and 150 epochs. Further details on the network optimization, training, and testing are provided in Supporting Materials.
III Results and Discussion
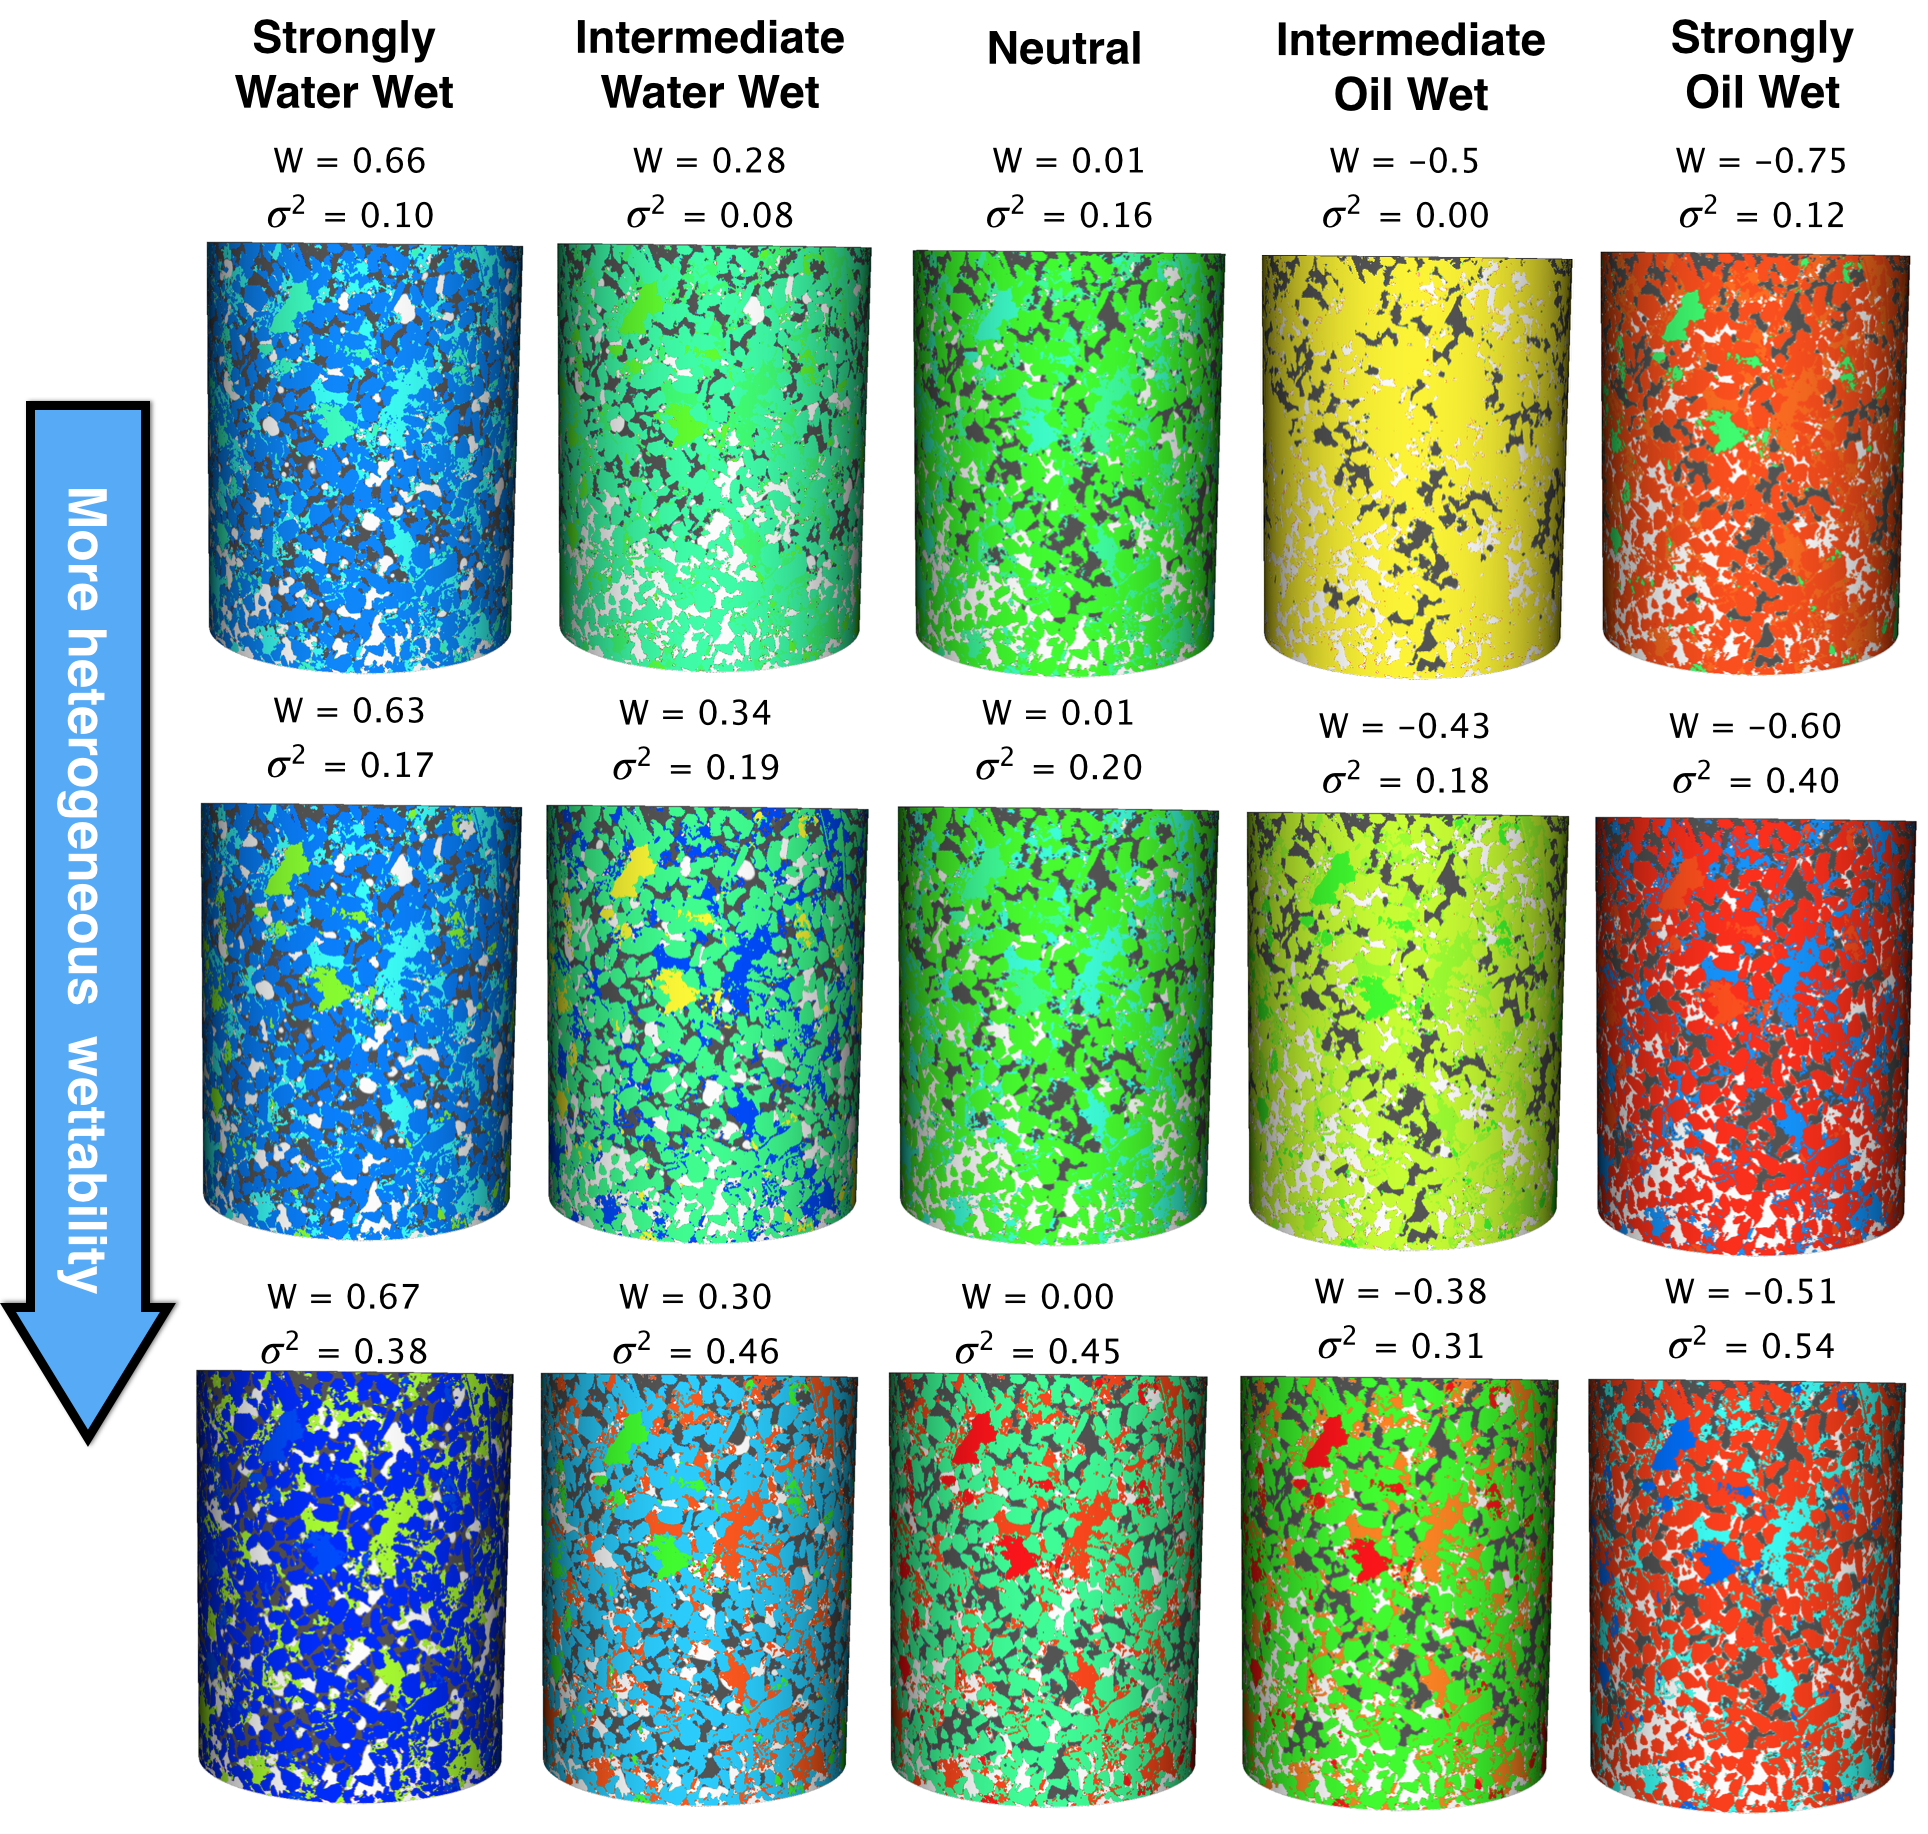
In Fig. 2 the steady state fluid distributions obtained for various wetting conditions are presented. The simulation conditions ranged from strongly water wet to strongly oil wet, which was quantified by the average wettability of the system () and mineral heterogeneity based on the squared variances () of the wettabilities assigned to these minerals. The solid material is colored based on the local range of wettability with water-wet solid being blue and oil-wet solid being red. The oil phase is white and water is black. It was observed that the distribution of fluids was dependent on both and . In particular, for similar (pick a column in Fig. 2) the distribution of fluids differs based on how wettability was assigned to the spatial distribution of the minerals. This result is well aligned with other recent studies; concluding that the spatial distribution of wetting is an important parameter for the simulation of multiphase flow in porous media [46, 47, 48]. This also suggests that pore space geometry alone is insufficient for the prediction of relative permeability.
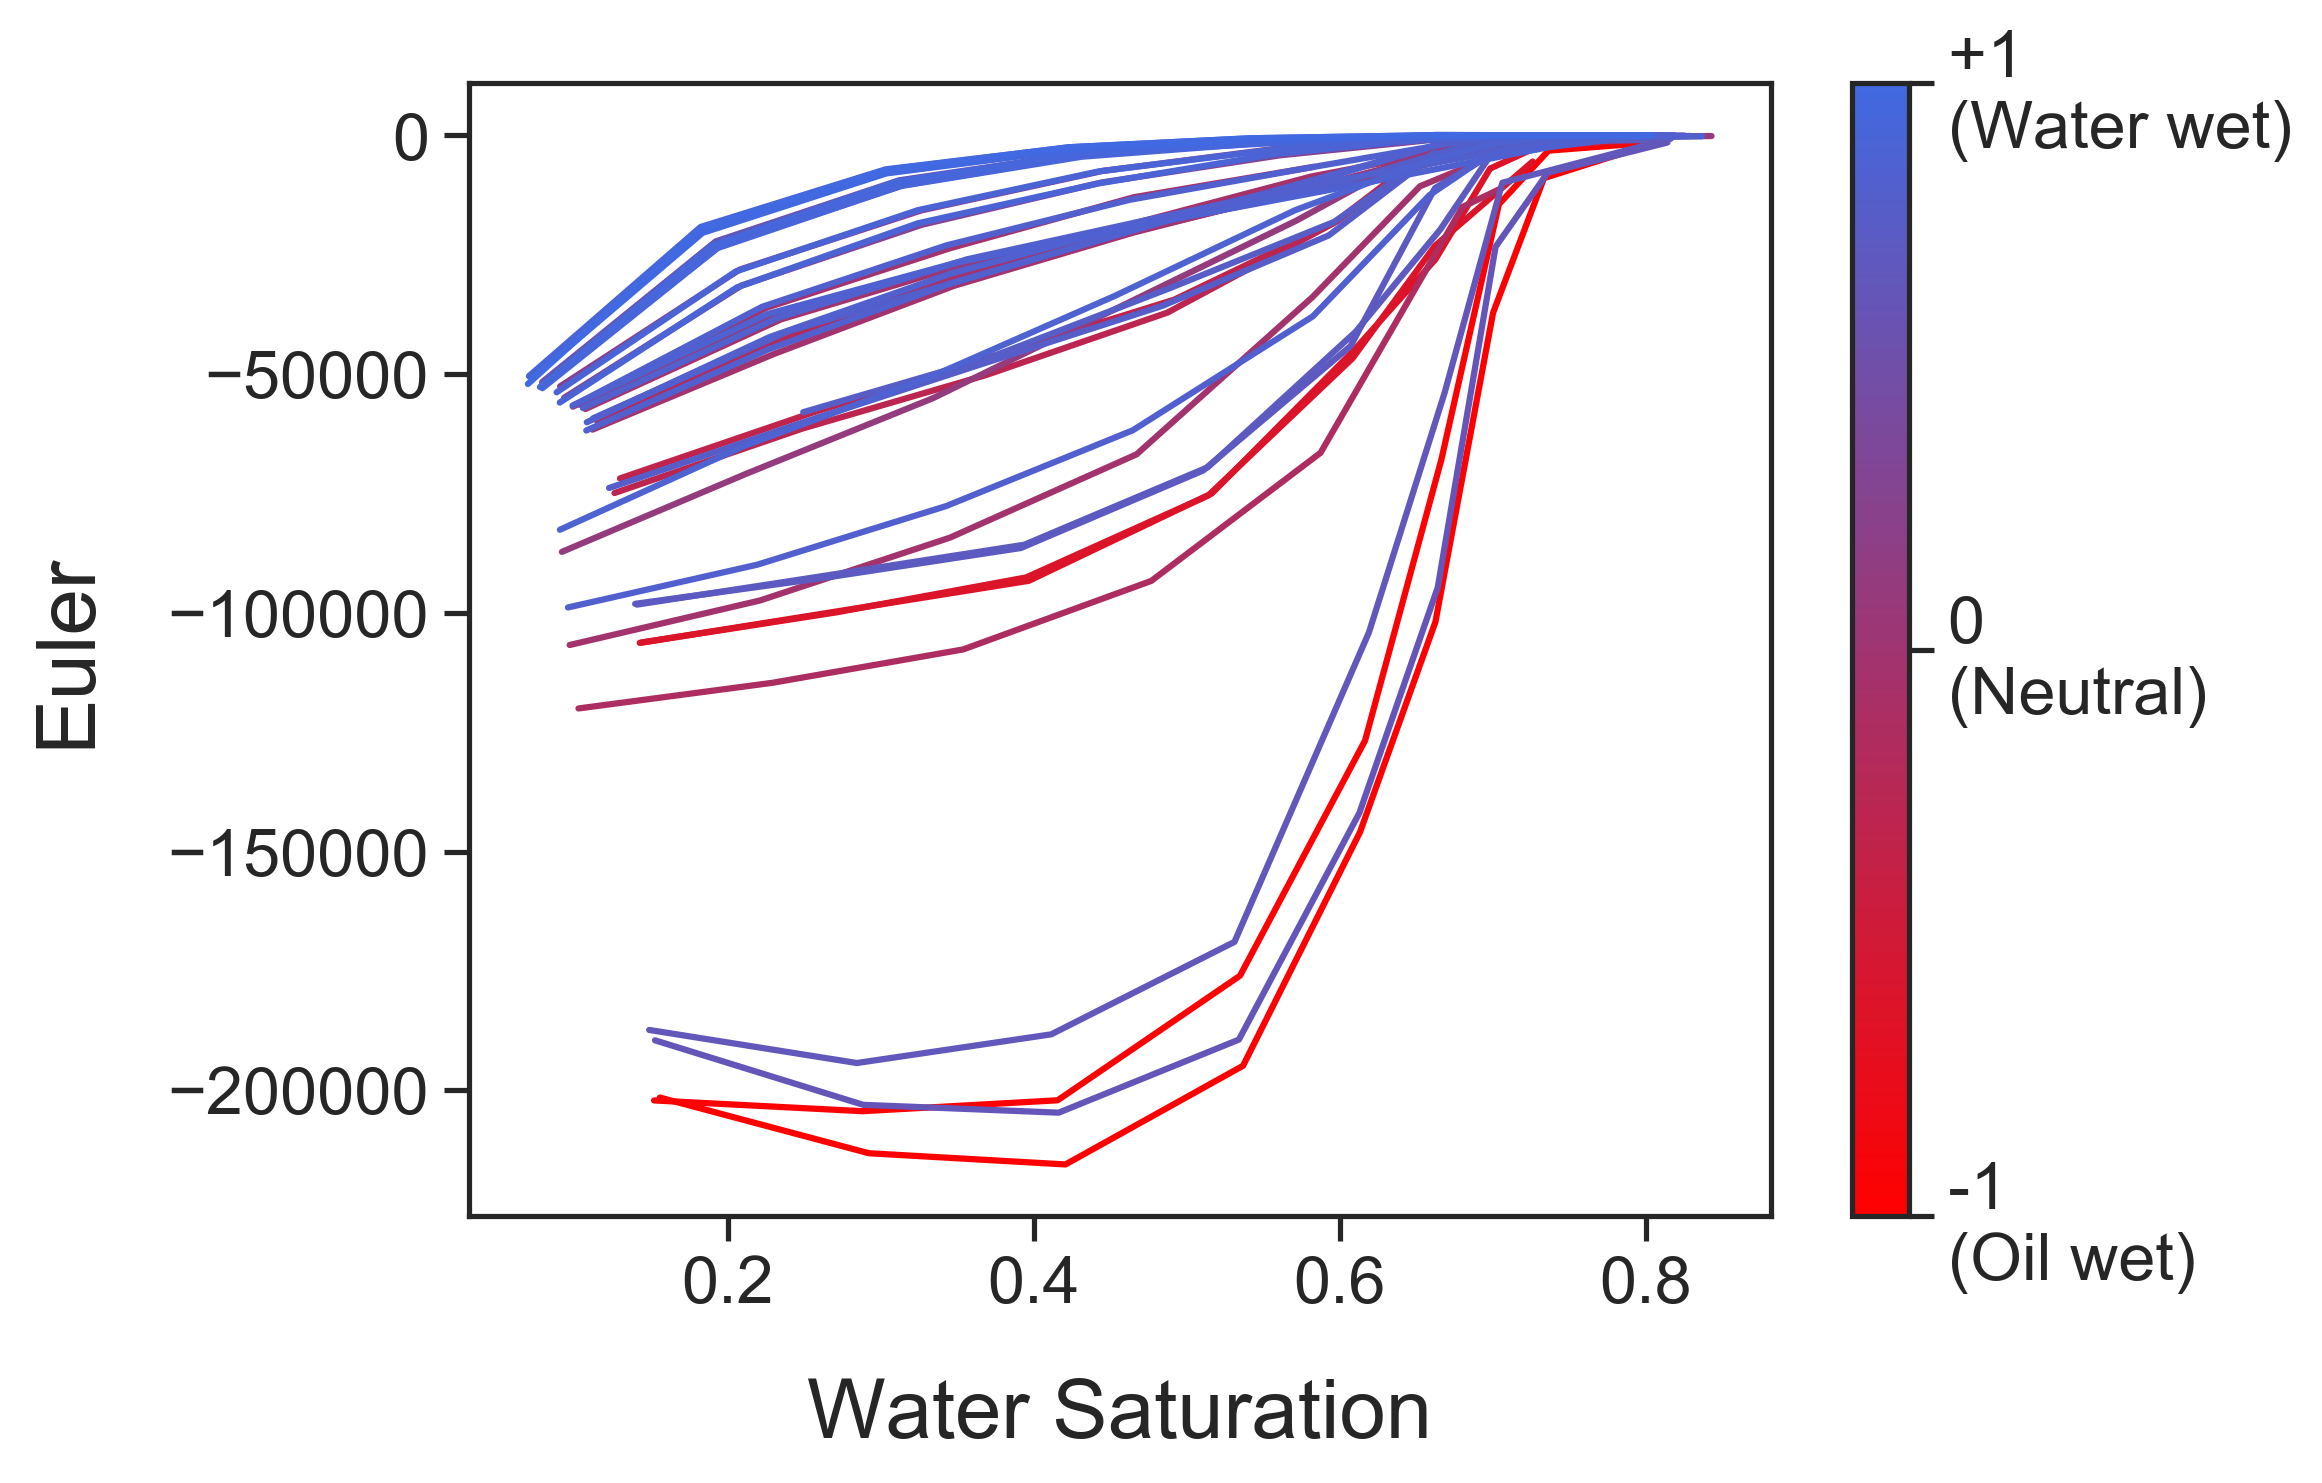
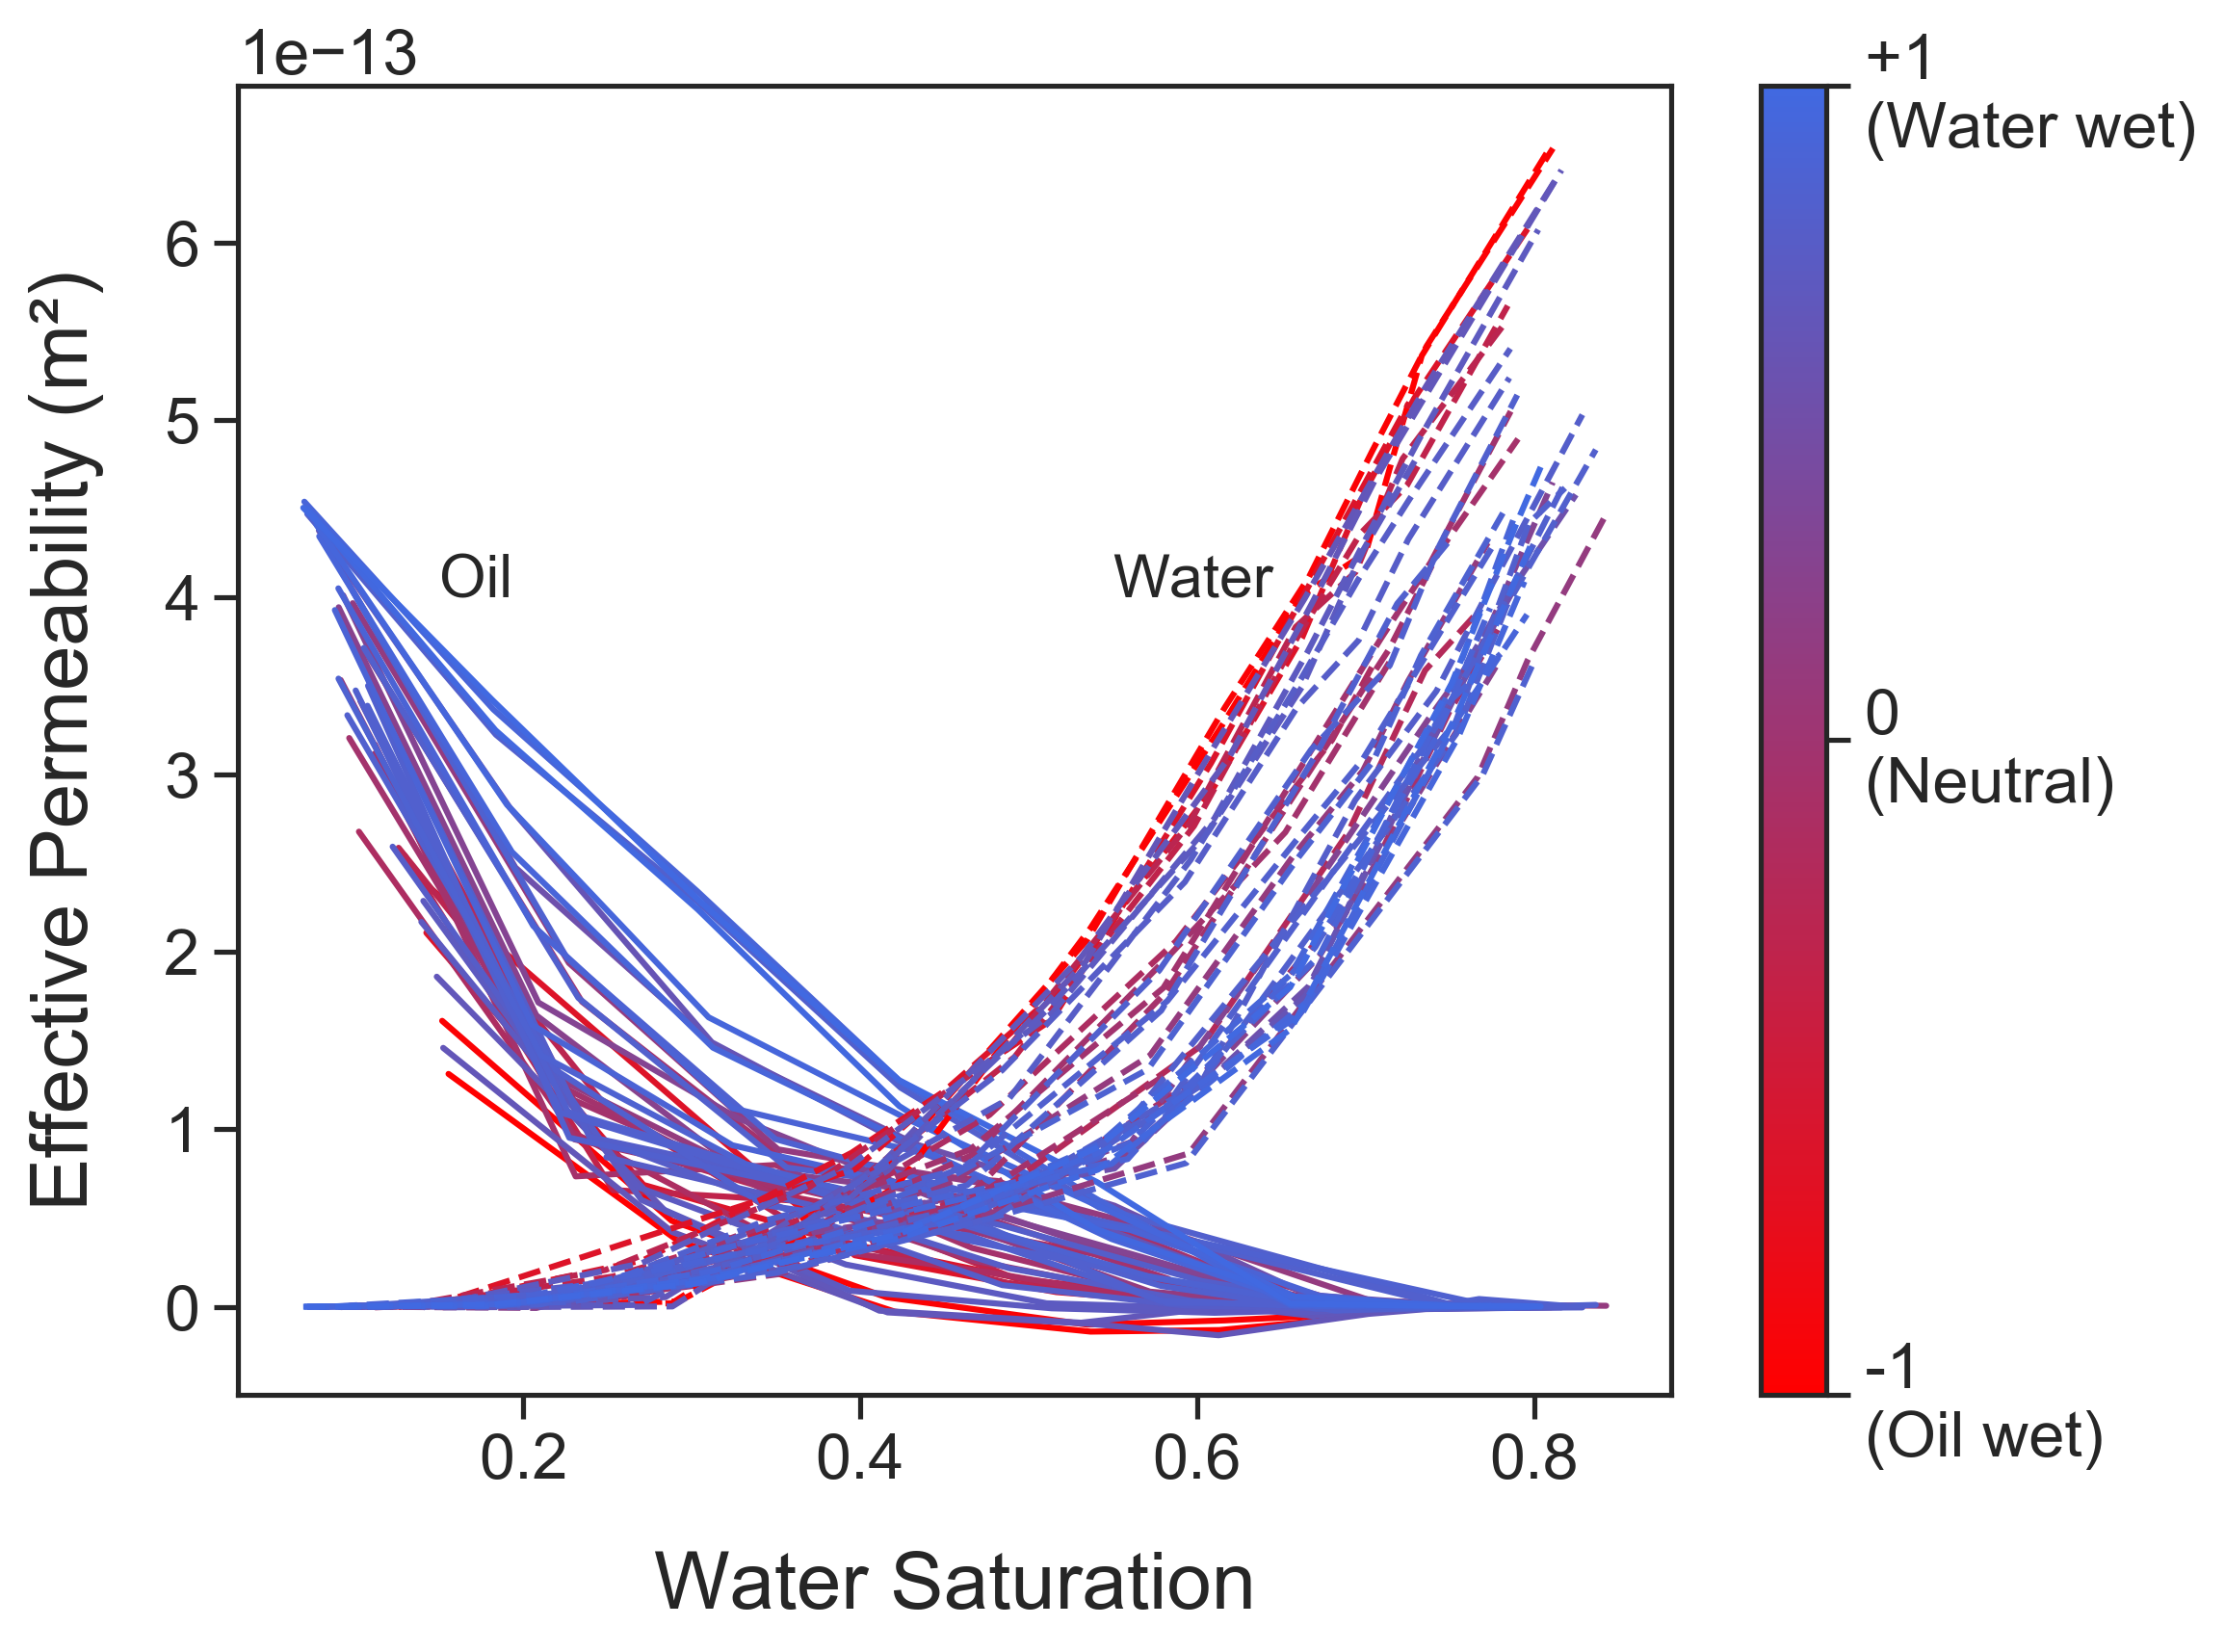
The LBPM simulations provided 25,906 unique morphological states. Euler characteristic for the (non-wetting phase) NWP followed the expected trend of increasing connectivity for more oil-wet conditions (Figure 3). The NWP stops percolating at high water saturation near Euler equal to one resulting in an effective permeability of approximately zero at the corresponding saturation. The constitutive relationship for relative permeability was well aligned with the expected behaviour based on wettability (Figure 4). The oil phase effective permeability increased under more water-wet conditions while the water phase relative permeability decreased resulting in a net effect of shifting the crossing point of the two curves to the right. As evident, no single constitutive relative permeability relationship would be sufficient to represent this data.
Based on the creeping flow assumption underpinning Equation 15, the effective permeability of a phase can be expressed as a function of geometry only. Our premise is that an ANN should be ably to find the mapping between Equation 15 and Equation 18, as suggested by Hadwiger’s theorem. The LBPM simulations provided a total of 25,906 data points. We found that representative points were obtained after the simulation convergence, which can be indicated by a convergence of . Therefore, by visualizing over simulation time in addition to the associated error for each point (see Figure 5), we have included points after time steps. The excluded points represent the earliest set recorded during the simulation at high , as data was recorded every steps to up to . The remaining data at low , which include 22,556 points, was used to develop and evaluate the ANN.
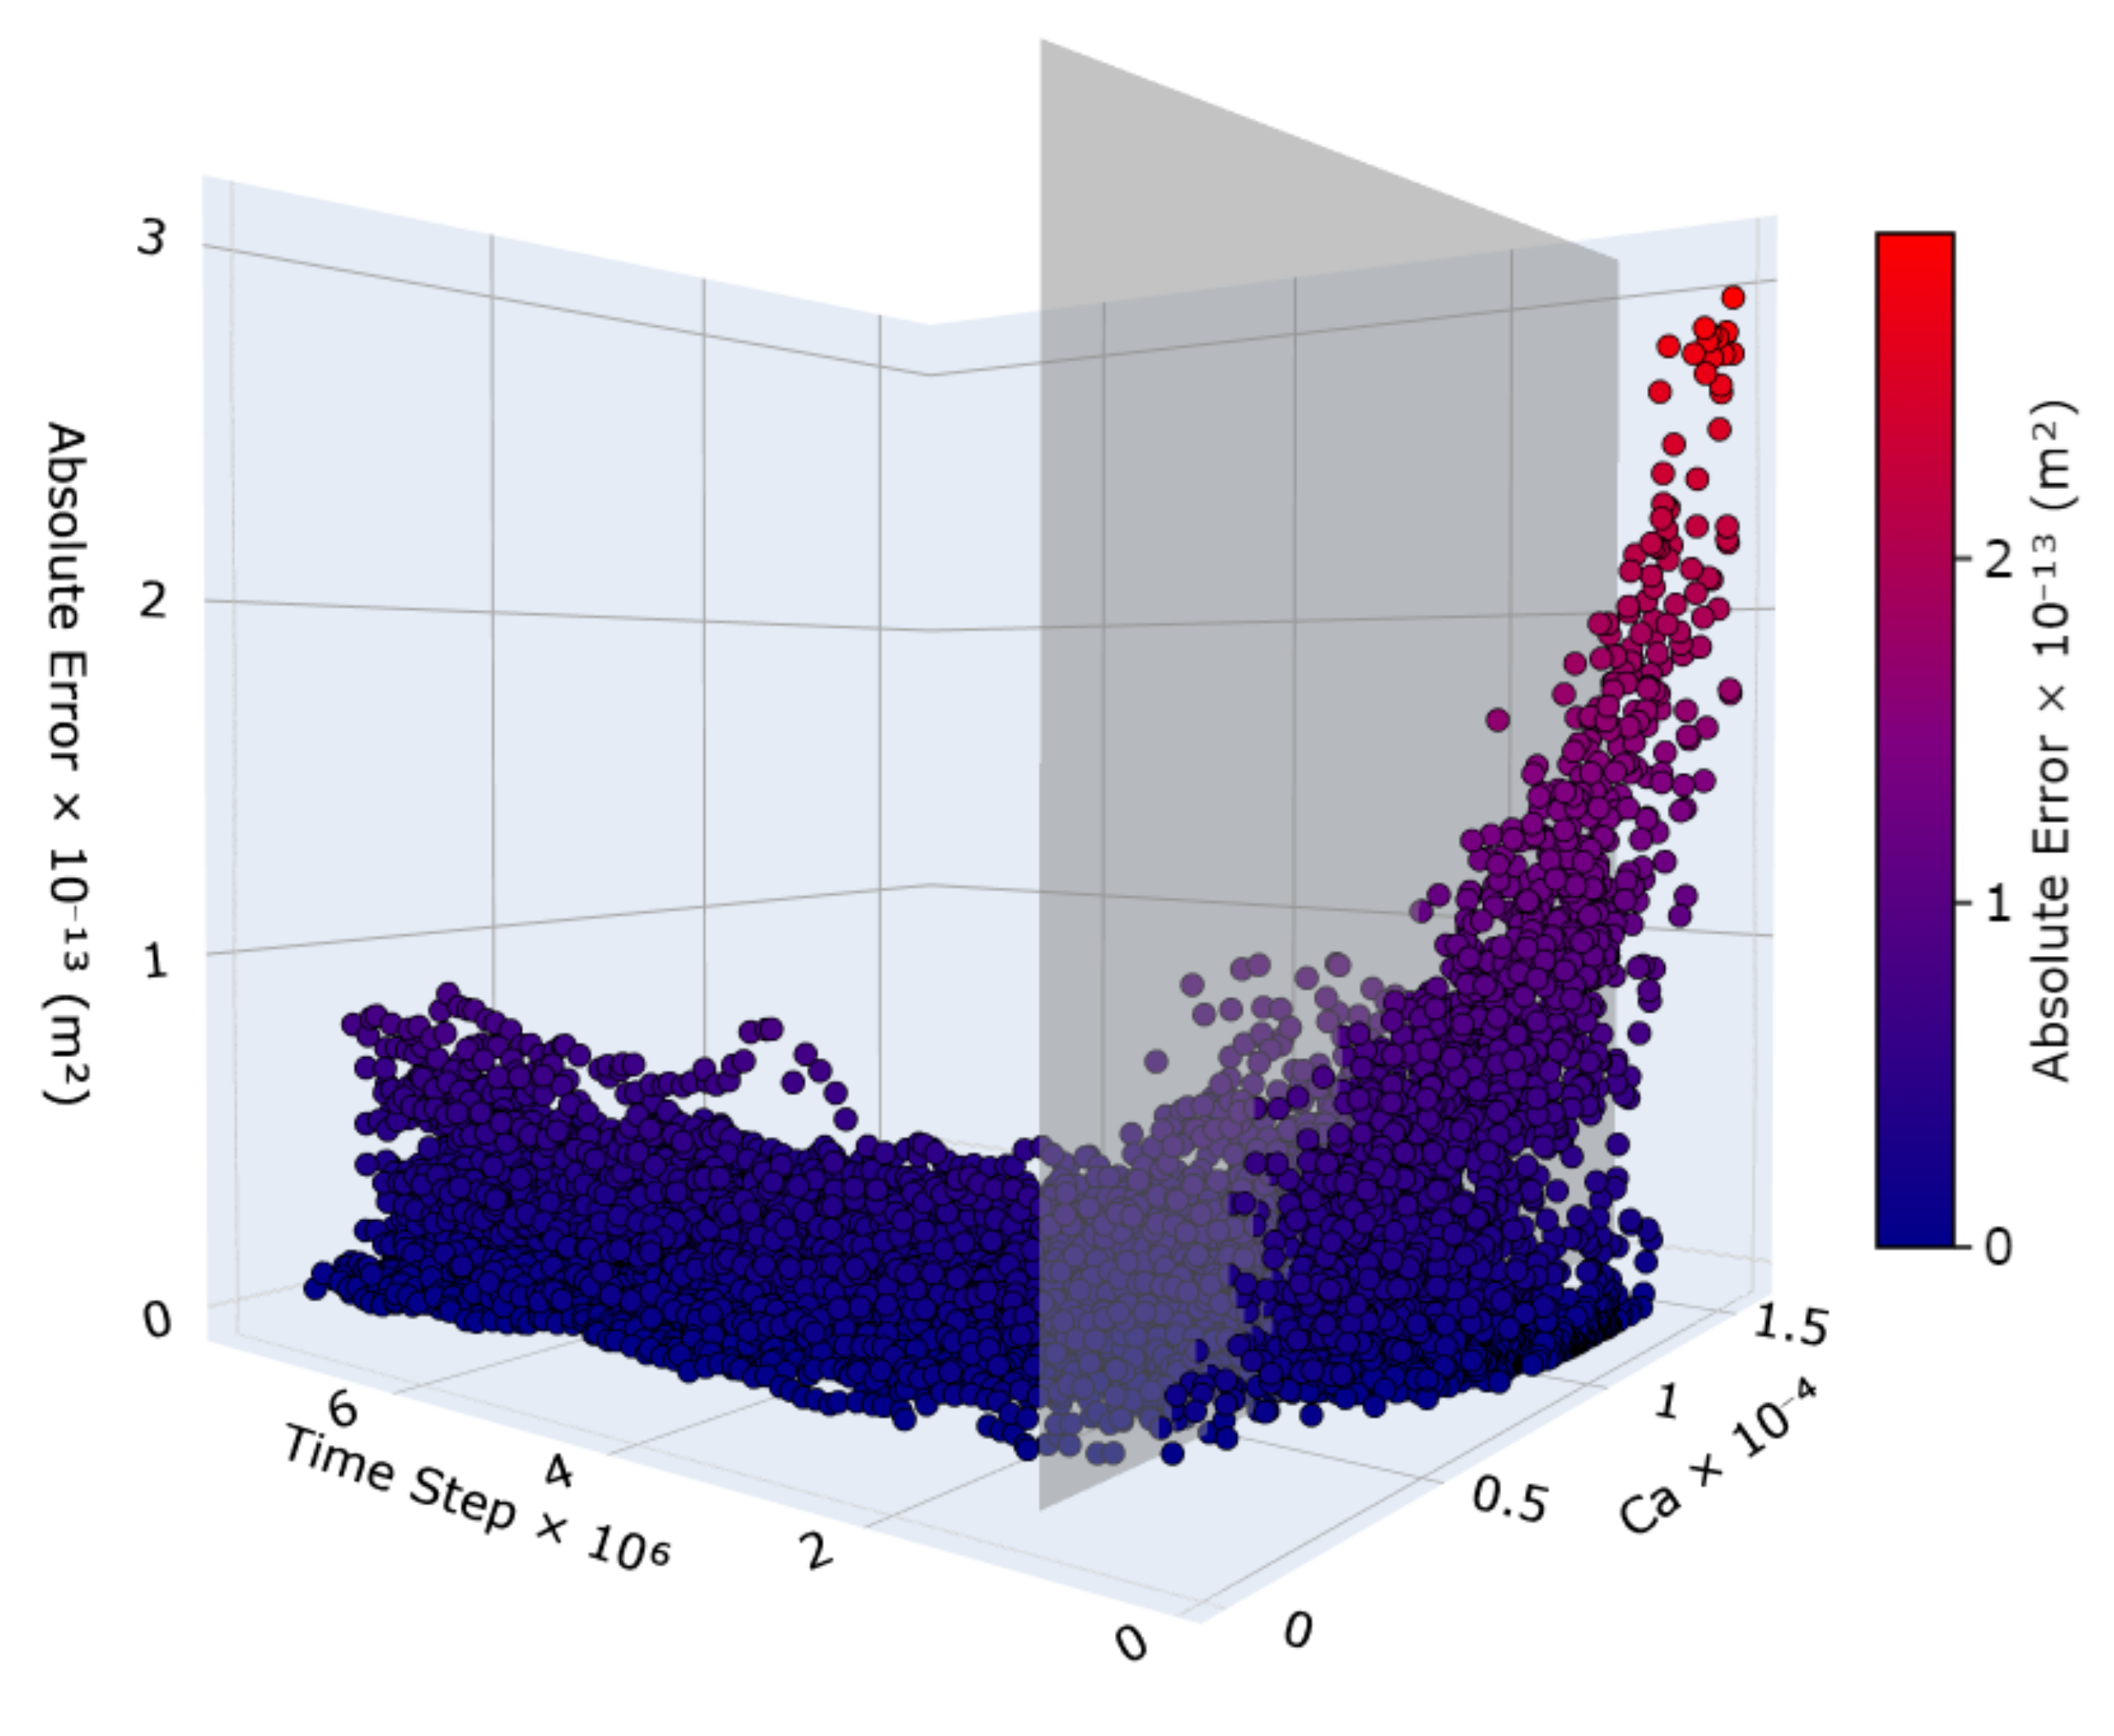
In Figure 5 the ANN absolute errors associate with all 25,906 geometric states are provided along with Capillary number, , and the simulation time step. Low is associated with creeping flow conditions as required for Equation 15. For an ANN to find the mapping between Equation 15 and 18, and thus predict effective permeability, the effective permeability must be based on the geometry of the connected pathway only, this situation is commonly refereed to as connected pathway flow [18]. As evident in Figure 5, earlier simulation time steps, associated with higher , resulted in higher absolute error suggesting that the under pinning assumptions no longer hold.
For higher flows, the time-dependent aspect of the phenomena cannot be captured by geometrical terms expressed in units of length only; the fluid pathways are intermittent with geometrical and topological changes [23], and thus energy dissipation depends on the geometric state and the fluctuation timescale [26], resulting in high ANN absolute error. While a unit of time can be introduced by , the addition of as an input parameter into the ANN did not improve the predictive capability of the ANN - see Supporting Materials. In addition, we do not present any theoretical reason as to why should be included.
To explore capillary dominated connected pathway flow, we included only simulation data after time steps, resulting in 22,556 geometric states. The results for 4,500 unseen geometric states from the testing set are provided in Figure 6(a). The network achieved an average absolute error of less than . Approximately 68% of the test points have an absolute error below the average while only 3% have an error of more than , up to a maximum error of approximately . The results indicated a valid relationship for the geometric state of the connected pathway flow and the effective permeability.
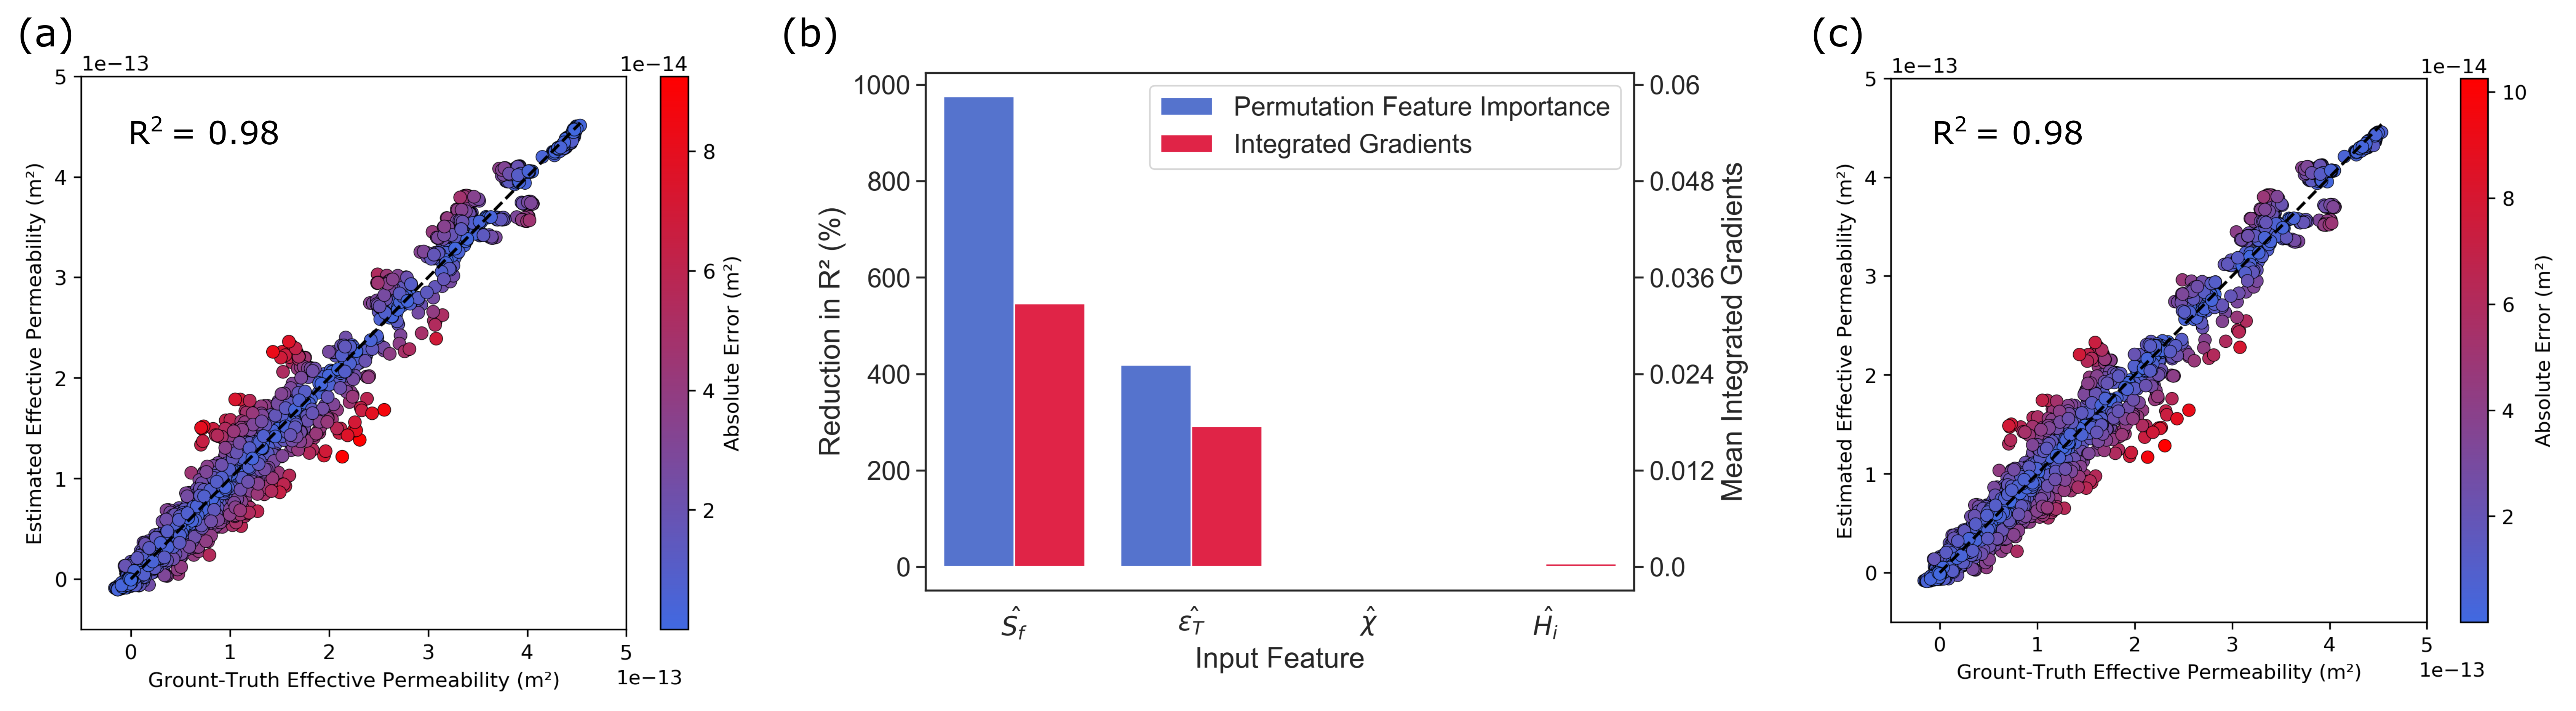
Feature importance was evaluated using the permutation feature importance and integrated gradients methods. The importance of each feature is presented in Figure 6(b) were the importance of the last two features were negligible. The permutation feature importance method [49] evaluates the change in the predictability of an ANN resulting from randomly rearranging the order of the measured feature and/or providing only the mean value for a given feature. As the accuracy of the model was measured using , the importance was evaluated as the percentage reduction in the baseline . The integrated gradients (IG) method [50] estimates feature importance for a trained model by accumulating the gradients along a path between the input and a baseline input. Only the absolute value of the IG has been shown in Figure 6(b) as a measure of importance. Based on these methods, the most important features were while had little to no influence on the the ANN predictability. Therefore, a reduced order model based on as presented in Figure 6(c) could be generated with the same predictability as the original model.
IV Conclusions
In principle, our previous works on capillary pressure [12, 37] were easier to deal with since capillary pressure is a quasi-static property where one can consider static snap-shots with no flow and fluid-fluid interfaces are near equilibrium conditions, and thus capillary pressure is related to the mean curvature of the fluid interfaces [51], which is one of the Minkowski functionals. Therefore, capillary pressure, is fundamentally a geometrical statement. With effective permeability (or relative permeability) we need to extend our concepts to flowing conditions. We therefore concentrated on the capillary-dominated regime, which is typically relevant for reservoir engineering and also covered by special core analysis (which does not extent above , see e.g. [21]). Our overall approach was to relate the mechanical energy dissipation (net force) to the geometric boundary of the connected pathway, or an ‘equivalent’ boundary with a given shape factor.
The determination of effective permeability from geometrical measures suggests that any two systems with the same effective permeability have the same total energy dissipation (net force) under stationary capillary dominated conditions. While the Minkowski functionals are a complete set they are not a unique set [14]. Therefore, our results suggest that the simulations provided structures for all wetting states where the flow field retained a degree of similarity near a critical percolation [40]. Therefore, within a given class of conditions effective permeability models can be linked to energy dissipation (or net force), which is additive, motion invariant, and smooth, as required by Hadwiger [14]. We should also emphasize anisotropic extensions for future work, since there are many more invariants when you consider direction-dependence [52]. Since relative permeability is a tensor in practice, the addition of directional dependencies should be an area of future work.
Our previous works have shown that the capillary pressure curve can be predicted from the Minkowski functionals with two geometric degrees of freedom when a non-dimensional form is constructed [12, 37]. For the van Genuchten relative permeability model the behaviour is parameterized based on the capillary pressure curve [53], which supports the reduced order model found herein. Other works have suggested the importance of phase connectivity [54, 39], however, these works were under strongly water-wet conditions while the current study is intermediate/mixed wet [46] with a high degree of connectivity and minimal surfaces [55]. Spatially varied wetting, , essentially provided a degenerate state whereby a limited set of geometrical measures were required, namely saturation and surface area only, which further supports the need for surface wettability characterisation [48] in pore-scale models as necessary input (initial conditions include the spatial wettability distribution, at least in a statistical manner).
A consequences of the phenomenological two-phase Darcy formulation is that effective permeability needs to be experimentally measured, which is often determined from inverse modelling that is ill-posed with non-uniqueness, correlation between matching parameters, and non-Gaussian errors [56]. The associated uncertainty by inverse modeling is greater than that determined by the presented ANN [56, 57]. In addition, the determination of end-point relative permeability is nebulous. Experimental methods for determining end-point relative permeability are based on ’Best Practices’ [22], and thus trends between end-point relative permeability and wetting index are often conflicting [58, 59]. End-point relative permeability prediction with an ANN is based on simulation data with difficulties similar to experimental data were a significant number of pore volumes (or time steps) at an increased flow rate are required to achieve residual saturation [41]. This is particularly the case for intermediate wet conditions under which thin wetting films remain connected with low hydraulic conductivity [45].
The proposed ANN approach requires a significant amount of pore-scale data for training, which is an upfront computational cost. Morphological data, however, is becoming readily available with recent developments in pore-scale modelling and experiments [16] and data repositories, such as the ’Digital Rocks Portal’. The presented ANN was able to predict the effective permeability for 36 unique wetting states. With traditional constitutive models, a steady state core flood would need to be conducted for each wetting state with each experiment taking approximately one week to conduct. Such an enormous parameter space (as that explored by the ANN) is not feasible with traditional experimental workflows and subsequent constitutive models.
Our ANN was able to predict effective permeability with for a wide range of different wetting states within the same rock. Corey and/or van Genuchten relative permeability models would require different parameterisation for each wetting case [60, 53]. The extrapolative power of an ANN is not without bounds. Analogous to how a Corey model is limited to a defined set of control parameters(experimental conditions), the ANN is limited to the features of the training data [61]. Application of the ANN to a wider set of control parameters would need to be explored in future work. Currently, the ANN provides excellent results for a single rock type under a wide range of wettabilities, which is a considerable improvement over traditional constitutive relationships since traditional models are limited to a single wetting condition.
Our ANN provides a physics-based approach to predict effective permeability by only geometrical descriptors providing new possibilities for experimental design and multiphase modelling. Typical multiphase models already include two of the parameters () proposed in Equation 18 while recent models include [62, 11] and the inclusion of is not far off [12]. ANNs as constitutive models are attractive because they will significantly benefit from hardware acceleration over the near future. An ANN could realistically be embedded into a reservoir simulator and used to model significantly more complex physics without having it dramatically slow things down. Similar approaches are already being used for collision operators in lattice Boltzmann models and molecular dynamics simulations [63].
Acknowledgements.
R. T. A. acknowledges Australian Research Council Future Fellowship (FT210100165) and Discovery (DP210102689). The authors thank Mehdi Shabaninejah for kindly sharing the micro-CT and QEMSCAN data.References
- Shojaei et al. [2022] M. J. Shojaei, B. Bijeljic, Y. Zhang, and M. J. Blunt, Minimal surfaces in porous materials: X-ray image-based measurement of the contact angle and curvature in gas diffusion layers to design optimal performance of fuel cells, ACS Applied Energy Materials 5, 4613 (2022).
- Krevor et al. [2012] S. C. Krevor, R. Pini, L. Zuo, and S. M. Benson, Relative permeability and trapping of co2 and water in sandstone rocks at reservoir conditions, Water resources research 48 (2012).
- van Rooijen et al. [2022] W. van Rooijen, L. Hashemi, M. Boon, R. Farajzadeh, and H. Hajibeygi, Microfluidics-based analysis of dynamic contact angles relevant for underground hydrogen storage, Advances in Water Resources , 104221 (2022).
- Falta et al. [2005] R. W. Falta, P. Suresh, and N. Basu, Assessing the impacts of partial mass depletion in DNAPL source zones: I. analytical modeling of source strength functions and plume response, Journal of Contaminant Hydrology 78, 259 (2005).
- Zhang et al. [2019] G. Zhang, P. Ranjith, B. Wu, M. Perera, A. Haque, and D. Li, Synchrotron x-ray tomographic characterization of microstructural evolution in coal due to supercritical co2 injection at in-situ conditions, Fuel 255, 115696 (2019).
- Tortora et al. [2021] M. Tortora, P. Zajdel, A. R. Lowe, M. Chorazewski, J. B. Leão, G. V. Jensen, M. Bleuel, A. Giacomello, C. M. Casciola, S. Meloni, et al., Giant negative compressibility by liquid intrusion into superhydrophobic flexible nanoporous frameworks, Nano Letters 21, 2848 (2021).
- Juanes et al. [2006] R. Juanes, E. Spiteri, F. Orr Jr, and M. Blunt, Impact of relative permeability hysteresis on geological co2 storage, Water resources research 42 (2006).
- Spiteri et al. [2008] E. J. Spiteri, R. Juanes, M. J. Blunt, and F. M. Orr, A new model of trapping and relative permeability hysteresis for all wettability characteristics, Spe Journal 13, 277 (2008).
- Gao et al. [2021] Y. Gao, A. Georgiadis, N. Brussee, A. Coorn, H. van der Linde, J. Dietderich, F. O. Alpak, D. Eriksen, M. Mooijer-van den Heuvel, M. Appel, T. Sorop, O. B. Wilson, and S. Berg, Capillarity and phase-mobility of a hydorcarbon gas-liquid system, Oil & Gas Science and Techynology – Rev. IFP Energies nouvelles 76, 43 (2021).
- Berg et al. [2020] S. Berg, Y. Gao, A. Georgiadis, N. Brussee, A. Coorn, H. van der Linde, J. Dietderich, F. O. Alpak, D. Eriksen, M. Mooijer-van den Heuvel, et al., Determination of critical gas saturation by micro-ct, Petrophysics-The SPWLA Journal of Formation Evaluation and Reservoir Description 61, 133 (2020).
- Gray et al. [2015] W. Gray, A. Dye, J. McClure, L. Pyrak-Nolte, and C. Miller, On the dynamics and kinematics of two-fluid-phase flow in porous media, Water Resources Research 51, 5365 (2015).
- McClure et al. [2018] J. E. McClure, R. T. Armstrong, M. A. Berrill, S. Schlüter, S. Berg, W. G. Gray, and C. T. Miller, A geometric state function for two-fluid flow in porous media, arXiv preprint arXiv:1805.11032 (2018).
- Klain [1995] D. A. Klain, A short proof of hadwigger’s theorem, Mathematika 42, 329 (1995).
- Hadwiger [1957] H. Hadwiger, Vorlesungen tiber inhalt, oberfl~ che und isoperirnetrie (1957).
- Hornik [1991] K. Hornik, Approximation capabilities of multilayer feedforward networks, Neural networks 4, 251 (1991).
- Blunt et al. [2013] M. J. Blunt, B. Bijeljic, H. Dong, O. Gharbi, S. Iglauer, P. Mostaghimi, A. Paluszny, and C. Pentland, Pore-scale imaging and modelling, Advances in Water Resources 51, 197 (2013).
- Anbari et al. [2018] A. Anbari, H.-T. Chien, S. S. Datta, W. Deng, D. A. Weitz, and J. Fan, Microfluidic model porous media: Fabrication and applications, Small 14, 1703575 (2018).
- Avraam and Payatakes [1995] D. Avraam and A. Payatakes, Flow regimes and relative permeabilities during steady-state two-phase flow in porous media, Journal of fluid mechanics 293, 207 (1995).
- Payatakes [1982] A. Payatakes, Dynamics of oil ganglia during immiscible displacement in water-wet porous media, Annual Review of Fluid Mechanics 14, 365 (1982).
- Zhang et al. [2021] Y. Zhang, B. Bijeljic, Y. Gao, Q. Lin, and M. J. Blunt, Quantification of nonlinear multiphase flow in porous media, Geophysical Research Letters 48, e2020GL090477 (2021).
- Masalmeh [2012] S. K. Masalmeh, Impact of capillary forces on residual oil saturation and flooding experiments for mixed to oil-wet carbonate reservoirs, in SCA, Vol. 11 (2012) pp. 27–30.
- McPhee et al. [2015] C. McPhee, J. Reed, and I. Zubizarreta, Core analysis: a best practice guide, Vol. 64 (Elsevier, 2015).
- Reynolds et al. [2017] C. A. Reynolds, H. Menke, M. Andrew, M. J. Blunt, and S. Krevor, Dynamic fluid connectivity during steady-state multiphase flow in a sandstone, Proceedings of the National Academy of Sciences 114, 8187 (2017).
- Rücker et al. [2015] M. Rücker, S. Berg, R. Armstrong, A. Georgiadis, H. Ott, A. Schwing, R. Neiteler, N. Brussee, A. Makurat, L. Leu, et al., From connected pathway flow to ganglion dynamics, Geophysical Research Letters 42, 3888 (2015).
- Tallakstad et al. [2009] K. T. Tallakstad, H. A. Knudsen, T. Ramstad, G. Løvoll, K. J. Måløy, R. Toussaint, and E. G. Flekkøy, Steady-state two-phase flow in porous media: statistics and transport properties, Physical review letters 102, 074502 (2009).
- McClure et al. [2021a] J. E. McClure, S. Berg, and R. T. Armstrong, Capillary fluctuations and energy dynamics for flow in porous media, Physics of Fluids 33, 083323 (2021a).
- Raeini et al. [2014] A. Q. Raeini, M. J. Blunt, and B. Bijeljic, Direct simulations of two-phase flow on micro-ct images of porous media and upscaling of pore-scale forces, Advances in water resources 74, 116 (2014).
- McClure et al. [2022] J. E. McClure, M. Fan, S. Berg, R. T. Armstrong, C. F. Berg, Z. Li, and T. Ramstad, Relative permeability as a stationary process: Energy fluctuations in immiscible displacement, Physics of Fluids 34, 092011 (2022).
- Spurin et al. [2022] C. Spurin, M. Rücker, M. Moura, T. Bultreys, G. Garfi, S. Berg, M. J. Blunt, and S. Krevor, Red noise in steady-state multiphase flow in porous media, Water Resources Research 58, e2022WR031947 (2022).
- Liang et al. [2018] L. Liang, M. Liu, C. Martin, and W. Sun, A deep learning approach to estimate stress distribution: a fast and accurate surrogate of finite-element analysis, Journal of The Royal Society Interface 15, 20170844 (2018).
- Unke et al. [2021] O. T. Unke, S. Chmiela, H. E. Sauceda, M. Gastegger, I. Poltavsky, K. T. Schutt, A. Tkatchenko, and K.-R. Muller, Machine learning force fields, Chemical Reviews 121, 10142 (2021).
- Senior et al. [2020] A. W. Senior, R. Evans, J. Jumper, J. Kirkpatrick, L. Sifre, T. Green, C. Qin, A. Žídek, A. W. Nelson, A. Bridgland, et al., Improved protein structure prediction using potentials from deep learning, Nature 577, 706 (2020).
- Lusch et al. [2018] B. Lusch, J. N. Kutz, and S. L. Brunton, Deep learning for universal linear embeddings of nonlinear dynamics, Nature communications 9, 1 (2018).
- Muskat and Meres [1936] M. Muskat and M. W. Meres, The Flow of Heterogeneous Fluids Through Porous Media, Physics 7, 346 (1936).
- Wyckoff and Botset [1936] R. D. Wyckoff and H. G. Botset, The Flow of Gas-Liquid Mixtures Through Unconsolidated Sands, Physics 7, 325 (1936).
- Serra [1983] J. Serra, Image analysis and mathematical morphology (Academic Press, Inc., 1983).
- McClure et al. [2020] J. E. McClure, T. Ramstad, Z. Li, R. T. Armstrong, and S. Berg, Modeling geometric state for fluids in porous media: Evolution of the euler characteristic, Transport in Porous Media 133, 229 (2020).
- Armstrong et al. [2016] R. T. Armstrong, J. E. McClure, M. A. Berrill, M. Rücker, S. Schlüter, and S. Berg, Beyond darcy’s law: The role of phase topology and ganglion dynamics for two-fluid flow, Physical Review E 94, 043113 (2016).
- Liu et al. [2017] Z. Liu, A. Herring, C. Arns, S. Berg, and R. T. Armstrong, Pore-scale characterization of two-phase flow using integral geometry, Transport in Porous Media 118, 99 (2017).
- Scholz et al. [2012] C. Scholz, F. Wirner, J. Götz, U. Rüde, G. E. Schröder-Turk, K. Mecke, and C. Bechinger, Permeability of porous materials determined from the euler characteristic, Physical review letters 109, 264504 (2012).
- McClure et al. [2021b] J. E. McClure, Z. Li, M. Berrill, and T. Ramstad, The lbpm software package for simulating multiphase flow on digital images of porous rocks, Computational Geosciences 25, 871 (2021b).
- [42] J. E. McClure, M. A. Berrill, W. G. Gray, and C. T. Miller, Tracking interface and common curve dynamics for two-fluid flow in porous media, Journal of Fluid Mechanics 796, 211.
- McClure et al. [2014] J. E. McClure, J. F. Prins, and C. T. Miller, A novel heterogeneous algorithm to simulate multiphase flow in porous media on multicore cpu–gpu systems, Computer Physics Communications 185, 1865 (2014).
- Liu et al. [2018] Z. Liu, J. E. McClure, and R. T. Armstrong, Influence of wettability on phase connectivity and electrical resistivity, Physical Review E 98, 043102 (2018).
- Armstrong et al. [2021] R. T. Armstrong, C. Sun, P. Mostaghimi, S. Berg, M. Rücker, P. Luckham, A. Georgiadis, and J. E. McClure, Multiscale characterization of wettability in porous media, Transport in Porous Media 140, 215 (2021).
- Foroughi et al. [2020] S. Foroughi, B. Bijeljic, Q. Lin, A. Q. Raeini, and M. J. Blunt, Pore-by-pore modeling, analysis, and prediction of two-phase flow in mixed-wet rocks, Physical Review E 102, 023302 (2020).
- Foroughi et al. [2021] S. Foroughi, B. Bijeljic, and M. J. Blunt, Pore-by-pore modelling, validation and prediction of waterflooding in oil-wet rocks using dynamic synchrotron data, Transport in Porous Media 138, 285 (2021).
- Garfi et al. [2022] G. Garfi, C. M. John, M. Rücker, Q. Lin, C. Spurin, S. Berg, and S. Krevor, Determination of the spatial distribution of wetting in the pore networks of rocks, Journal of Colloid and Interface Science 613, 786 (2022).
- Breiman [2001] L. Breiman, Random Forests, Machine Learning 45, 5 (2001).
- Sundararajan et al. [2017] M. Sundararajan, A. Taly, and Q. Yan, Axiomatic Attribution for Deep Networks, 34th International Conference on Machine Learning, ICML 2017 7, 5109 (2017), arXiv:1703.01365 .
- Armstrong et al. [2012] R. T. Armstrong, M. L. Porter, and D. Wildenschild, Linking pore-scale interfacial curvature to column-scale capillary pressure, Advances in water resources 46, 55 (2012).
- Schröder-Turk et al. [2011] G. E. Schröder-Turk, W. Mickel, S. C. Kapfer, M. A. Klatt, F. M. Schaller, M. J. Hoffmann, N. Kleppmann, P. Armstrong, A. Inayat, D. Hug, et al., Minkowski tensor shape analysis of cellular, granular and porous structures, Advanced Materials 23, 2535 (2011).
- Van Genuchten [1980] M. T. Van Genuchten, A closed-form equation for predicting the hydraulic conductivity of unsaturated soils, Soil science society of America journal 44, 892 (1980).
- Purswani et al. [2021] P. Purswani, R. T. Johns, Z. T. Karpyn, and M. Blunt, Predictive modeling of relative permeability using a generalized equation of state, SPE Journal 26, 191 (2021).
- Lin et al. [2019] Q. Lin, B. Bijeljic, S. Berg, R. Pini, M. J. Blunt, and S. Krevor, Minimal surfaces in porous media: Pore-scale imaging of multiphase flow in an altered-wettability bentheimer sandstone, Physical Review E 99, 063105 (2019).
- Berg et al. [2021a] S. Berg, E. Unsal, and H. Dijk, Non-uniqueness and uncertainty quantification of relative permeability measurements by inverse modelling, Computers and Geotechnics 132, 103964 (2021a).
- Berg et al. [2021b] S. Berg, E. Unsal, and H. Dijk, Sensitivity and uncertainty analysis for parameterization of multiphase flow models, Transport in Porous Media 140, 27 (2021b).
- Christensen and Tanino [2018] M. Christensen and Y. Tanino, Residual oil saturation under mixed-wet conditions: optimal wettability revisited, in Proc International symposium of the society of core analysts, SCA2018–011, Trondheim, Norway (2018).
- Jadhunandan et al. [1995] P. Jadhunandan, N. R. Morrow, et al., Effect of wettability on waterflood recovery for crude-oil/brine/rock systems, SPE reservoir engineering 10, 40 (1995).
- Brooks and Corey [1964] R. Brooks and A. Corey, Hydraulic Properties of Porous Media, Colorado State University Hydrology Paper (Colorado State University, 1964).
- Da Wang et al. [2021] Y. Da Wang, M. J. Blunt, R. T. Armstrong, and P. Mostaghimi, Deep learning in pore scale imaging and modeling, Earth-Science Reviews 215, 103555 (2021).
- Hassanizadeh and Gray [1993] S. M. Hassanizadeh and W. G. Gray, Thermodynamic basis of capillary pressure in porous media, Water resources research 29, 3389 (1993).
- Bedrunka et al. [2021] M. C. Bedrunka, D. Wilde, M. Kliemank, D. Reith, H. Foysi, and A. Krämer, Lettuce: Pytorch-based lattice boltzmann framework, in International Conference on High Performance Computing (Springer, 2021) pp. 40–55.