Enhancement to Training of Bidirectional GAN : An Approach to Demystify Tax Fraud
Abstract
Outlier detection is a challenging activity. Several machine learning techniques are proposed in the literature for outlier detection. In this article, we propose a new training approach for bidirectional GAN (BiGAN) to detect outliers. To validate the proposed approach, we train a BiGAN with the proposed training approach to detect taxpayers, who are manipulating their tax returns. For each taxpayer, we derive six correlation parameters and three ratio parameters from tax returns submitted by him/her. We train a BiGAN with the proposed training approach on this nine-dimensional derived ground-truth data set. Next, we generate the latent representation of this data set using the (encode this data set using the ) and regenerate this data set using the (decode back using the ) by giving this latent representation as the input. For each taxpayer, compute the cosine similarity between his/her ground-truth data and regenerated data. Taxpayers with lower cosine similarity measures are potential return manipulators. We applied our method to analyze the iron and steel taxpayer’s data set provided by the Commercial Taxes Department, Government of Telangana, India.
Index Terms:
outlier detection, tax fraud detection, bidirectional GAN, goods and services taxI Introduction
I-A Outlier Detection
Outliers are data points that are far from other data points. In other words, they are unusual values in a data set. Detecting outliers is essentially identifying unexpected elements in data sets [1]. Outlier identification has several real world applications such as fraud detection and intrusion detection. Outlier detection is a challenging activity. Several machine learning techniques are proposed in the literature for outlier detection.
Several methods derived from neural networks have been applied to outlier detection. Generative Adversarial Networks have emerged as a leading technique. Goodfellow et al. proposed a new approach for training generative models via an adversarial process [2]. This method simultaneously trains two neural network modules: a generator module that captures the probability distribution of the training data and a discriminator module that estimates the probability that a sample came from the training data set rather than generated by the generator. In this way, the two modules are competing against each other, they are adversarial in the game theory sense, and are playing a zero-sum game. In their existing form, GANs have no means of learning the inverse mapping (projecting training data back into the latent space). Jeff Donahue et al. proposed Bidirectional Generative Adversarial Networks (BiGANs) as a method of learning this inverse mapping [3]. Kaplan et al. implemented anomaly detection using BiGAN, considering it as a one-class anomaly detection algorithm [4]. Since generator and discriminator are highly dependent on each other in the training phase, to minimize this dependency, they proposed two different training approaches for BiGAN by adding extra training steps to it. They also demonstrated that the proposed approaches increased the performance of BiGAN on the anomaly detection tasks.
I-B Indirect Tax
Indirect tax is collected by an intermediary (such as a retailer and manufacturer) from the consumer of goods or services [5]. The intermediary submits the tax he/she collected to the government by filing tax return forms at regular time intervals. In reality, the intermediary acts as a conduit for the flow of tax from the consumer of the goods or services to the government.
I-B1 Goods and Services tax
Goods and Services Tax (GST) is a destination-based, multi-stage, comprehensive taxation system. In GST, the tax is levied in an incremental manner at each stage of the supply chain based on the value added to goods/services at that stage. This tax is levied at each stage of the supply chain in such a way that the tax paid on purchases ( or ) is given as a set-off for the tax levied on sales ( or liability).
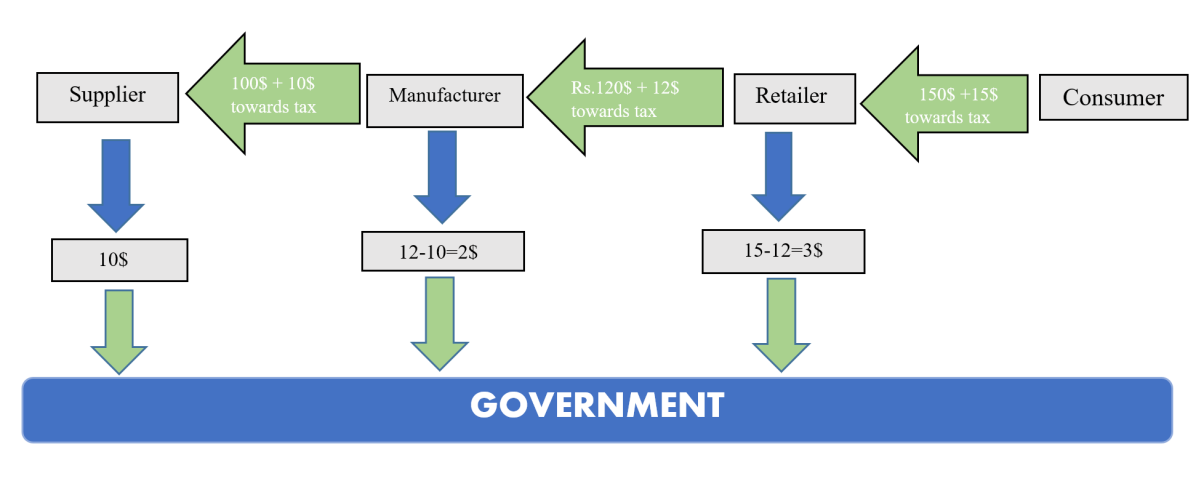
Figure 1 shows how tax is collected incrementally at each stage of the supply chain. In this example, the manufacturer purchases goods from the supplier for a value of $100 and pays $10 as tax at a tax rate of 10%. The supplier then pays the tax he/she collected to the government. In the next stage of the supply chain, the retailer purchases finished goods from the manufacturer for a value of $120 and pays $12 as tax at a tax rate of 10%. The manufacturer pays to the government, which is the difference between the tax he paid to the supplier and the tax he collected from the retailer. Finally, the consumer buys it from the retailer for a value of $150 and pays $15 as tax at a tax rate of 10%. So the retailer will pay to the government. In essence, for every dealer in GST, the tax payable is the difference between output tax and input tax.
I-B2 Tax evasion
Taxation and tax evasion go hand in hand. It is a never-ending cat and mouse game. Business dealers manipulate their tax returns to avoid tax and maximize their profits. Tax enforcement officers formulate new rules and regulations to control tax evasion after studying the behavior of known tax evaders who exploit the loopholes in the existing taxation laws. In this game tax evaders always try their best to stay a few steps ahead of the enforcement officers. Hence, it is necessary for the officials to identify the evasion as early as possible and close the loopholes before the techniques become a widespread practice. In this manner, the taxation officers will be able to limit the loss of government revenue due to tax evasion. The following are prominent ways of tax evasion.
-
1.
The dealer will collect tax at a higher rate from the customer and pays it to the government at a lower rate.
-
2.
The dealer does not report all the sales transactions made by her/him (sales suppression).
-
3.
The dealer will show a lower taxable turnover by wrongly applying the prescribed calculations.
-
4.
The dealer creates fictitious sales transactions where there is no movement of goods but only the invoices are circulated in order to claim an Input Tax Credit (ITC) and evade tax payment. This method is called bill trading.
I-C Our Contribution
In this article, we propose a new training approach for bidirectional GAN (BiGAN) to detect outliers. This is an enhancement to the BiGAN training approach given in [4]. To validate the proposed approach, we train a BiGAN with the proposed training approach to detect taxpayers, who are manipulating their tax returns in the Goods and Services Taxation system, which came into operation in India in July .
The Goods and Services Taxation system unified the taxation laws in India. As per this system, dealers are supposed to file tax return statements every month by providing the complete details of sales and purchases that happened in the corresponding month. The objective of this work is to identify dealers who manipulate their tax return statements to minimize their tax liability. We train Bidirectional GAN (BiGAN) using the proposed approach on nine-dimensional ground-truth data derived from tax returns submitted by taxpayers (six correlation parameters and three ratio parameters). Next, we encode the ground-truth data set using the (generate latent representation) and decode it back using the (regenerate the ground-truth data) by giving the latent representation as input. For each taxpayer, compute the cosine similarity between his/her ground-truth data and regenerated data. Taxpayers with lower cosine similarity measures are potential return manipulators. This idea can be applied in other nations where multi-stage indirect taxation is followed.
The rest of the paper is organized as follows. In Section II, we discuss the previous relevant works. In Section III, we will explain the data set used. In Section IV, we explain our proposed enhancement for BiGAN. In Section V, we give a detailed description of the methodology used in this paper. The results obtained are discussed in Section VI.
II Related Work
Chandola et al. presented several data mining techniques for anomaly detection [1]. Daniel de Roux et al. presented a very interesting approach for the detection of fraudulent taxpayers using only unsupervised learning methods [6]. Yusuf Sahin et al. worked on credit card fraud detection [7]. They developed some classification models based on Artificial Neural Networks (ANN) and Logistic Regression (LR). This study is one of the first in credit card fraud detection with a real data set to compare the performance of ANN and LR. Zhenisbek Assylbekov et al. presented statistical techniques for detecting VAT evasion by Kazakhstani business firms [8]. Starting from features selection they performed an initial exploratory data analysis using Kohonen self-organizing maps. Hussein et al. described classification-based and clustering-based anomaly detection techniques [9]. They applied K-Means to a refund transaction data set from a telecommunication company, with the intent of identifying fraudulent refunds. Gonzlez et al. described methods to detect potential false invoice issuers/users based on the information in their tax return statements using different types of data mining techniques [10]. First, clustering algorithms like SOM and neural gas are used to cluster similar taxpayers. Then decision trees, neural networks, and Bayesian networks are used to identify those features that are related to the conducting of fraud and/or no fraud. Song Wang et al. introduced the challenges of anomaly detection in the traditional network, as well as in the next generation network, and reviewed the implementation of machine learning in the anomaly detection under different network contexts [11]. Shuhan Yuan et al. used a deep learning approach for fraud detection [12]. This method will work only for the labeled data set. Jian Chen et al. applied deep learning techniques to credit card fraud detection. The first used sparse autoencoder to obtain representations of normal transactions and then trained a generative adversarial network (GAN) with these representations. Finally, they combined the SAE and the discriminator of GAN and apply them to detect whether a transaction is genuine or fraud [13]. Shenggang Zhang et al. proposed an anomaly detection model based on BiGAN for software defect prediction. The model proposed by them not only does not need to consider the class imbalance problem but also uses a semi-supervised method to train the model [14]. Raghavendra Chalapathy et al. presented a structured and comprehensive overview of research methods in deep learning-based anomaly detection. Furthermore, they reviewed the adoption of these methods for anomaly across various application domains and assess their effectiveness [15].
III Description of the Data Set
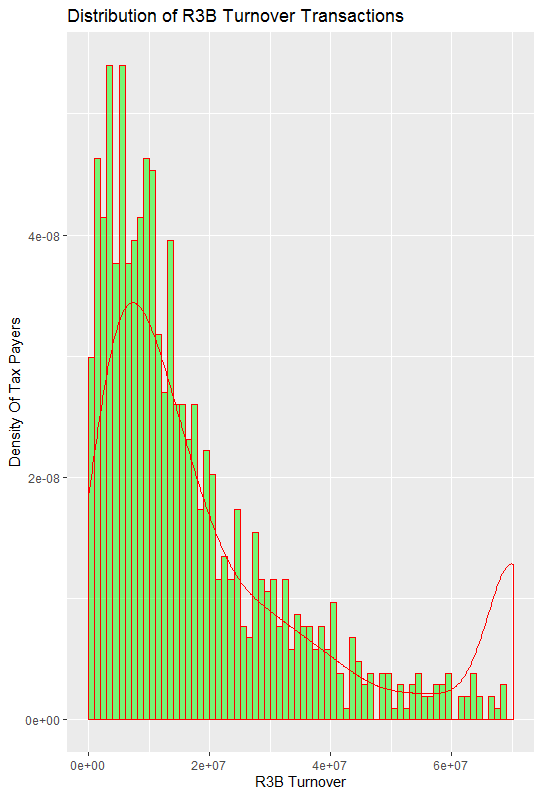
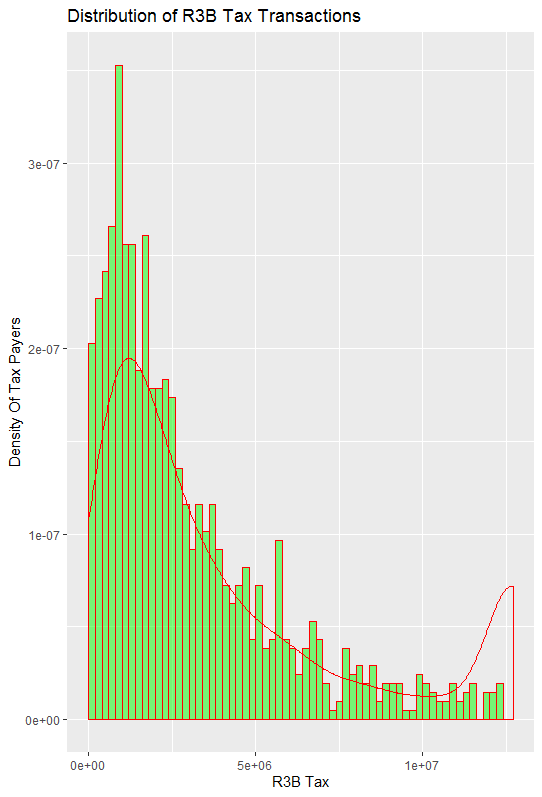
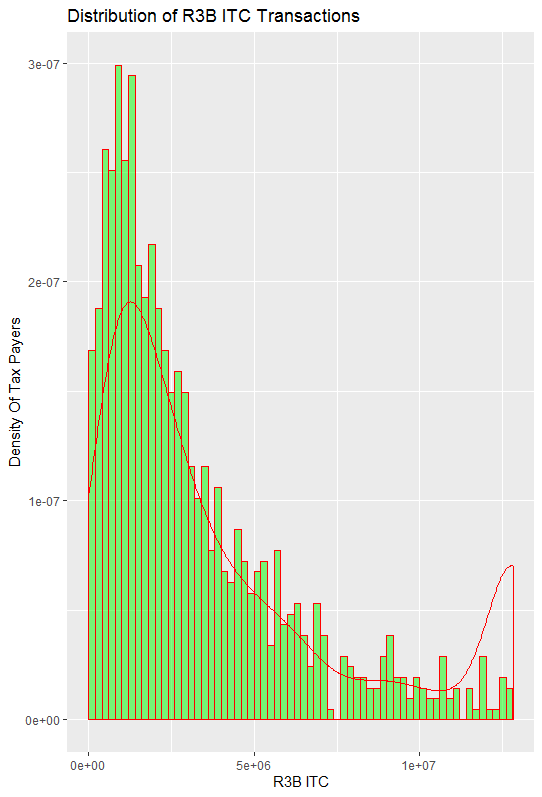
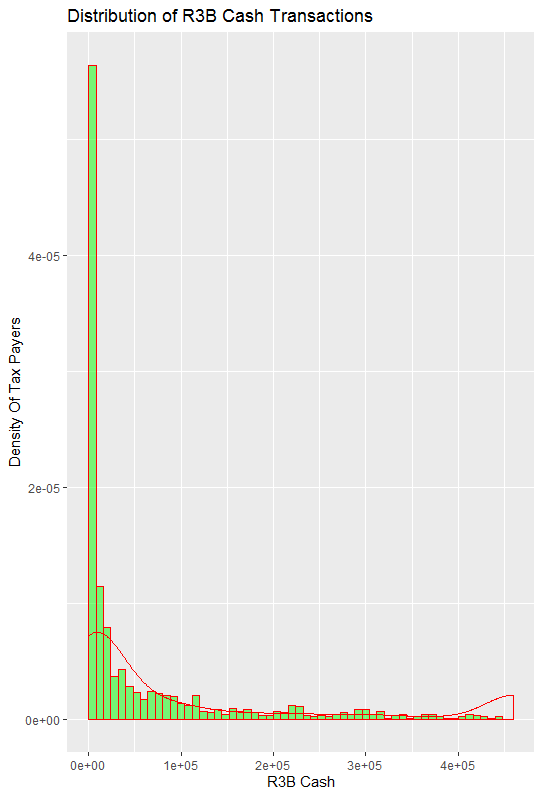
GSTR-3B is a monthly return that has to be filed by the dealer. It is a simple return in which a summary of Input Tax Credit along with outward supplies are declared, and payment of tax is affected by the taxpayer. Table I is a sample of GST returns data. Each row in this table corresponds to a monthly return by a dealer. ITC (Input tax credit) is the amount of tax paid during purchases of services/goods by the dealer. The output tax is the amount of tax collected by the dealer during the sales of services/goods. The dealer has to pay the Government the gap between the output tax and ITC, i.e., output tax - ITC. The actual database consists of much more information, like, return filing data, tax payment method, exempted sales, international exports, and sales on RCM (reverse charge mechanism). Figures 3, 3, 5, and 5 show the distribution of turnover, liability, input tax credit, and cash payments.
| S.No. | Firm | Month | Purchases | Sales | ITC | Output Tax |
|---|---|---|---|---|---|---|
| 1 | BC | Jan 2019 | 190000 | 210000 | 20200 | 24000 |
| 2 | BE | Sep 2021 | 202000 | 270000 | 5200 | 9200 |
| 3 | BD | Oct 2021 | 400200 | 420000 | 41000 | 43000 |
IV Enhanced BiGAN
IV-A Generative Adversarial Network
A generative adversarial network (GAN) is a recent invention in deep learning designed by Ian Goodfellow and his colleagues [2]. Two neural network modules (generator, discriminator) compete with each other in a simultaneous game. Given a training data set (ground-truth data set), the generator learns to generate new data with the same statistics as the training data set and the discriminator learns to estimate the probability that the given input came from the training data set rather than generated by the generator.
The discriminator’s parameters are optimized to minimize the loss function in Equation 1. Here is the estimated probability by the discriminator that input came from the ground-truth data set rather than generated by the generator given the ground-truth data set as input, and is the estimated probability by the discriminator that input came from the ground-truth data set rather than generated by the generator given the generated data set as input. The generator’s parameters are optimized to minimize the loss function in Equation 2.
| (1) |
| (2) |
IV-B Bidirectional GAN
Bidirectional GAN (BiGAN) is a representation learning method. BiGAN adds an encoder to the standard GAN architecture. The encoder takes ground-truth data set and outputs a latent representation of this data set. The generator takes a random sample and generates a data set . The BiGAN discriminator discriminates not only versus , but jointly in data and latent space ( discriminates tuple (X,E(X)) versus tuple (G(z),z)).
The discriminator is trained to minimize Equation 3, where is the estimated probability by the discriminator that input came from rather than given as the input, and is the estimated probability by the discriminator that input came from rather than given as the input. The generator is trained to minimize Equation 4. The encoder is trained to minimize Equation 5
| (3) |
| (4) |
| (5) |
IV-C Enhanced Bidirectional GAN
Kaplan et al. suggested one more cost function to optimize generator and encoder parameters of BiGAN [4]. Let be the current batch of input data set and be the output of with as input. Let be the output of with as input. They suggested to update and parameters together to minimize the mean of euclidean distance between and as in Equation 6.
| (6) |
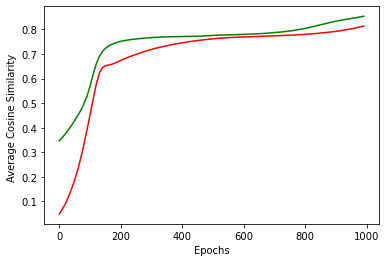
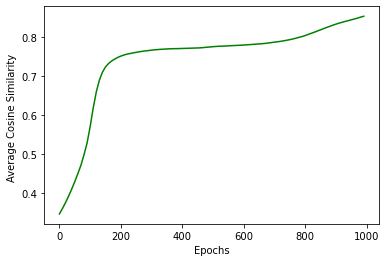
Cosine similarity is a measure used to find similarity between two vectors. Mathematically, it measures the cosine of the angle between two vectors projected in a multi-dimensional space. We propose that increasing the cosine similarity between and is a better approach than minimizing the euclidean distance between them. We update and parameters together to increase the value of Equation 7. Figure 6 shows cosine similarity between ground-truth data and regenerated data for a different number of epochs. The red coloured curve shows the result of the algorithm in [4] and the green coloured curve shows the result of the proposed method. Algorithm 1 gives a detailed description of the enhanced BiGAN training procedure.
| (7) |
V Methodology
The objective of this work is to train Bidirectional GAN (BiGAN) using the proposed training approach on nine-dimensional ground-truth data derived from tax returns submitted by taxpayers (six correlation parameters and three ratio parameters) to identify malicious dealers who manipulate their tax return statements. We had taken the data sets explained in Section III from July 2017 to March 2022 and derived nine features (parameters) from these data sets.
-
•
Six are sensitive correlation parameters.
-
•
Three are ratio parameters.
In Subsection V-A, we explain the six correlation parameters that are used. In Subsection V-B, we describe the three ratio parameters that are used. In Subsection V-C, we give a detailed algorithm.
V-A Correlation parameters
In the Indian GST system, three types of taxes are collected, CGST, SGST, and IGST.
-
•
CGST: Central Goods and Services Tax is levied on intrastate transactions and collected by the Central Government of India.
-
•
SGST: State/Union Territory Goods and Services Tax, which is also levied on intrastate transactions and collected by the state or union territory Government.
-
•
IGST: Integrated Goods and Services Tax is levied on interstate sales. Central Government takes half of this amount and passes the rest of the amount to the state, where corresponding goods or services are consumed.
The six correlation parameters are mentioned in Table II. Total GST liability is the sum of CGST liability, SGST liability, and IGST liability. Total ITC is equal to the sum of SGST ITC, CGST ITC, and IGST ITC.
| S. No. | The Six Correlation Parameters |
|---|---|
| 1 | Total GST Liability V͡S Total Sales Amount |
| 2 | SGST Liability VS Total GST Liability |
| 3 | SGST paid in cash VS SGST Liability |
| 4 | SGST paid in cash VS Total Sales Amount |
| 5 | Total ITC VS Total Tax Liability |
| 6 | IGST ITC VS Total ITC |
V-B Ratio parameters
-
1.
The ratio of VS. : This ratio captures the value addition.
-
2.
The ratio of VS. : This ratio captures how much purchase is shown as interstate or imports compared to total purchases.
-
3.
The ratio of VS. .
V-C Identifying Fraudulent Taxpayers using BiGAN
VI Experimentation and Results obtained
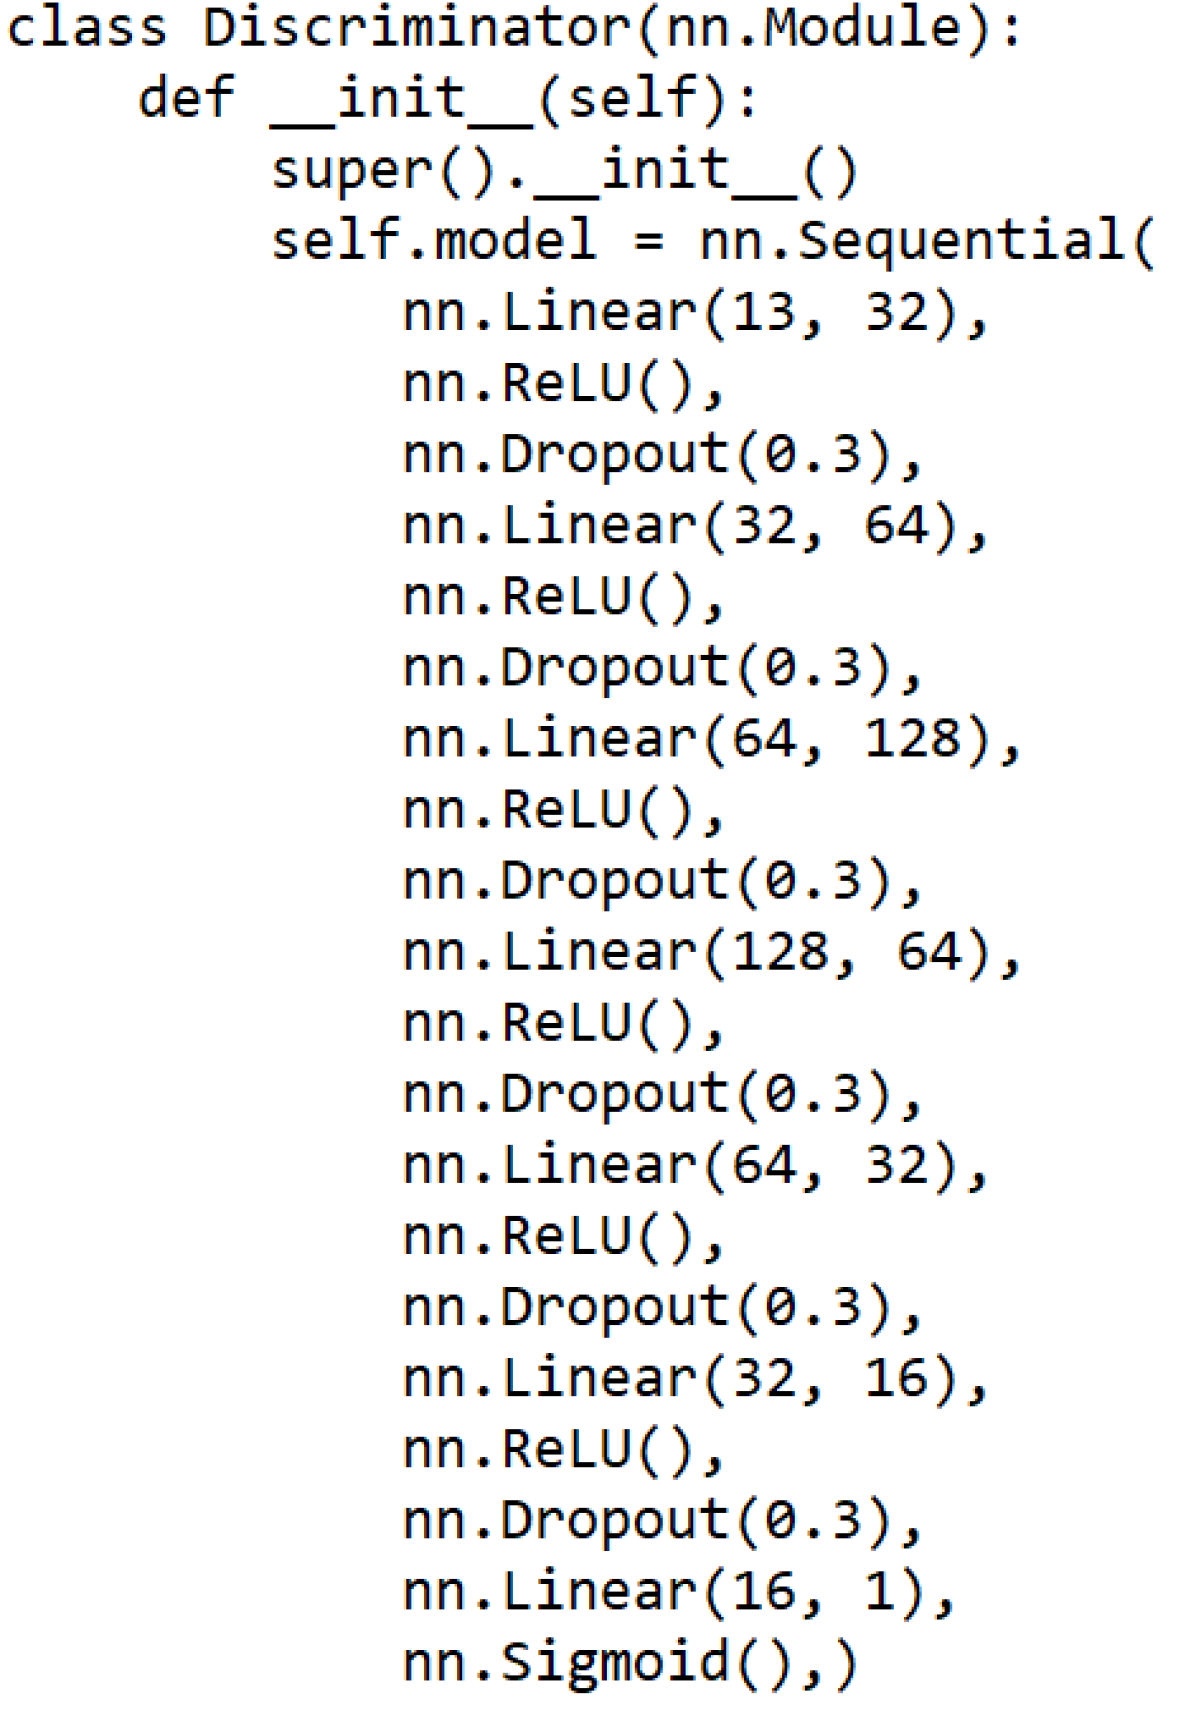
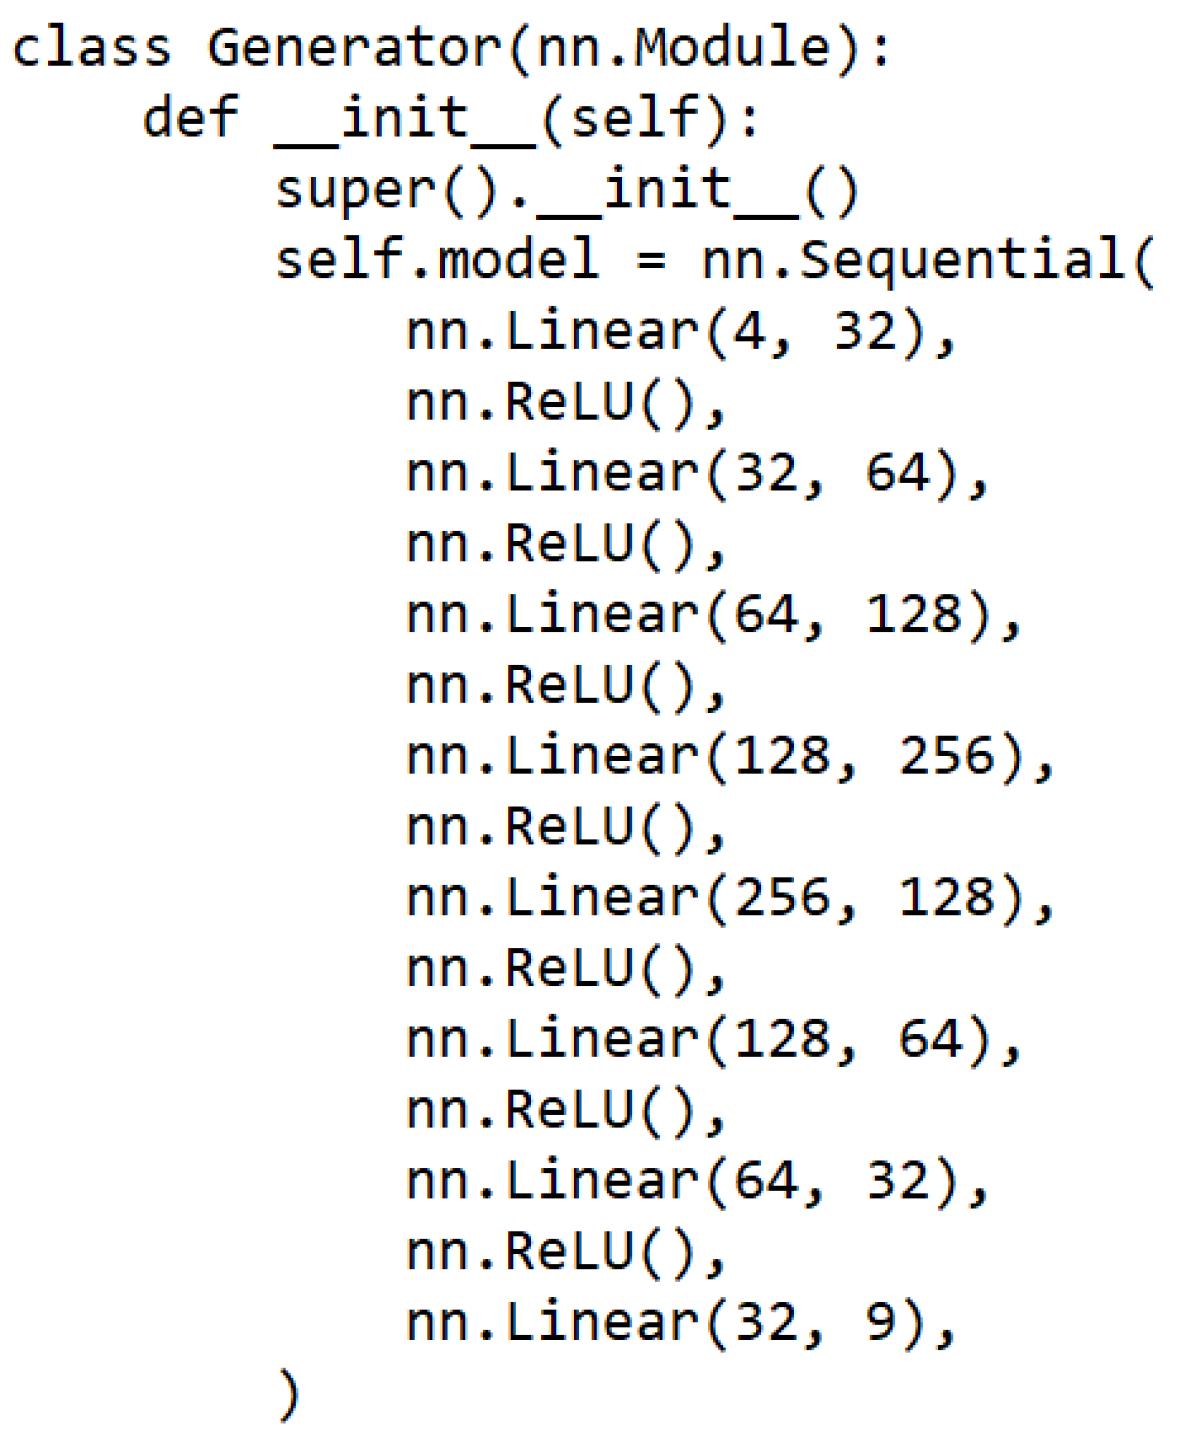
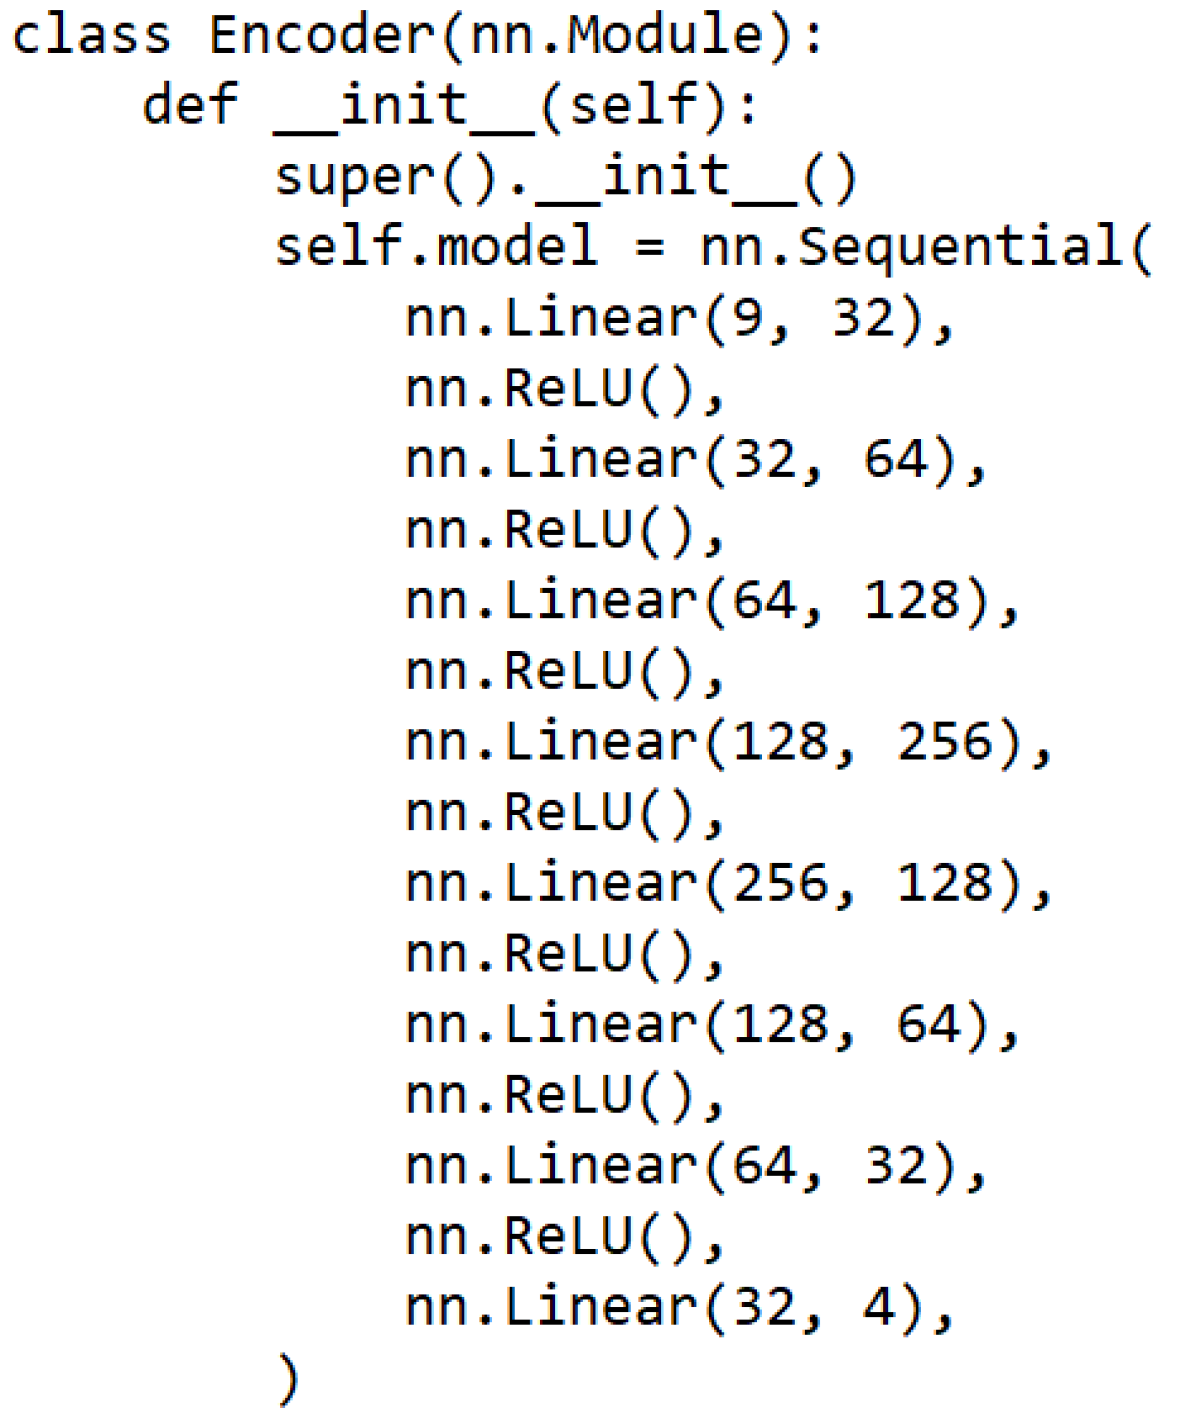
We had taken returns data of 1184 iron and steel dealers. We computed correlation and ratio parameters defined in subsections V-A and V-B for each dealer. Table III gives a snapshot of the parameters created for each dealer. Figure 11 and Figure 11 show the distribution of correlation and ratio parameters respectively. Figures 9, 9, and 9 give the PyTorch code of discriminator, generator, and encoder respectively. After experimentation, we opted for four-dimensional latent space. Note that input to the discriminator is thirteen dimensions (four-dimensional latent space data and nine-dimensional training/ground-truth data set).
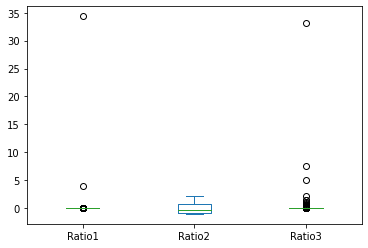
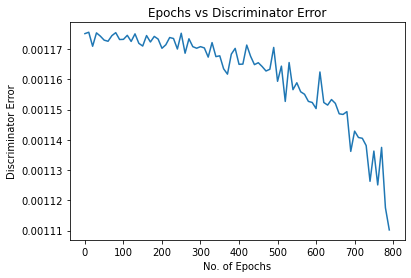
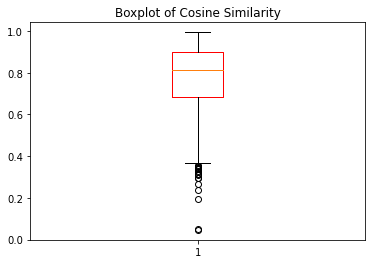
Figure 12 shows the discriminator’s error at different epochs. Figure 14 shows the average cosine similarity measure between corresponding rows in the training data set and regenerated data set at different epochs. The boxplot in Figure 14 shows the distribution of cosine similarities between corresponding rows in the training data set and regenerated set at the final epoch. The third quantile value is 0.8992, first quantile value is 0.6827. There are nineteen taxpayers whose cosine similarity values are less than the . Tax returns of these taxpayers need further investigation by tax officers. Expected evasion by these taxpayers is more than a few hundred million Indian rupees.
S.No Corr 1 Corr 2 Corr 3 Corr 4 Corr 5 Corr 6 Total Sales /Total Purchases IGST ITC /Total ITC Total tax liability /IGST ITC 1 0.9977 0.9998 0.2159 0.1967 0.9556 0.9988 1.0465 0.8717 1.3272 2 0.9940 0.9799 -0.3371 -0.2486 0.6408 0.5539 1.1992 0.1347 7.4129 3 0.9476 0.4556 0.0017 0.1286 -0.1620 0.9606 1.6991 0.8020 2.1824

S.No Corr 1 Corr 2 Corr 3 Corr 4 Corr 5 Corr 6 Total Sales /Total Purchases IGST ITC /Total ITC Total tax liability /IGST ITC 1 0.39657727 0.91993311 0.49645071 0.57682353 0.80236321 0.67371039 -0.03205805 0.44915969 -0.05412638 2 0.99616234 0.89398749 0.7674135 0.60683971 0.97080785 0.88260176 -0.03226673 0.36960728 -0.05415696 3 0.99947796 0.98932055 0.65413855 0.70517677 0.35052473 0.87797351 -0.03098378 0.60539265 -0.05411582
S.No Corr 1 Corr 2 Corr 3 Corr 4 Corr 5 Corr 6 Total Sales /Total Purchases IGST ITC /Total ITC Total tax liability /IGST ITC 1 0.31020196 0.71482671 0.9993972 0.45058559 0.95149288 0.99453044 3.95717384 -0.56773328 -0.04284052 2 0.99998812 0.99800189 -0.26364705 -0.27946686 0.49037541 0.35609805 -0.03317666 -1.06640099 7.48629588 3 0.0335644 -0.1469533 -0.14223751 -0.21525574 0.65303945 0.54761113 -0.02922851 -0.84931729 -0.05217054
VI-A Case Study
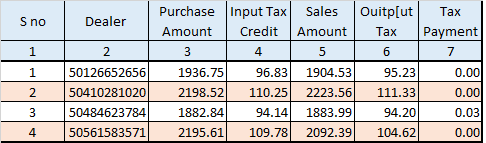
Table IV gives normalized features of three genuine dealers. Table V gives normalized features of three fraudulent dealers. We observed that the feature IGST ITC /total ITC is positive for most of the genuine dealers and negative for most of the fraudulent dealers. This means fraudulent dealers are showing most of their purchases as intra-state purchases. The fourth correlation parameter (total sales vs SGST paid in cash) is low for fraudulent dealers and high for genuine dealers. This means fraudulent dealers are not paying any cash and using the ITC to set off the liability. Figure 15 shows the business details of a few fraudulent taxpayers. Amounts are in lakhs of Indian Rupees. We can observe that they are not paying cash even though they are doing huge business.
VII Conclusion
In this paper, we enhanced the BiGAN training approach given in [4]. This training approach significantly improved the performance/stability of BiGAN.
We analyzed the tax returns data set of a set of business dealers in the state of Telangana, India, to identify dealers who perform extensive tax evasion. We had taken data of 1184 iron and steel dealers and derived ground-truth data set based on their monthly returns. The ground-truth data contains nine parameters (six are correlation parameters and three are ratio parameters). We used the proposed method of BiGAN training to identify fraudulent dealers. First, we trained a BiGAN using the ground-truth data set. Next, we encoded the ground-truth data set using the and decoded it back using the by giving the latent representation as input. For each taxpayer, we computed the cosine similarity between his/her ground-truth data and regenerated data. Taxpayers with lower cosine similarity measures are potential return manipulators. We identified nineteen dealers whose cosine similarity score is less than the . Expected evasion by these taxpayers is more than a few hundred million Indian rupees.
Acknowledgment
We express our sincere gratitude to the Telangana state Government, India, for sharing the commercial tax data set, which is used in this work.
References
- [1] V. Chandola, A. Banerjee, and V. Kumar, “Anomaly detection: A survey,” ACM Comput. Surv., vol. 41, no. 3, pp. 15:1–15:58, 2009. [Online]. Available: https://doi.org/10.1145/1541880.1541882
- [2] I. Goodfellow, J. Pouget-Abadie, M. Mirza, B. Xu, D. Warde-Farley, S. Ozair, A. Courville, and Y. Bengio, “Generative adversarial nets,” in Advances in Neural Information Processing Systems, Z. Ghahramani, M. Welling, C. Cortes, N. Lawrence, and K. Weinberger, Eds., vol. 27. Curran Associates, Inc., 2014. [Online]. Available: https://proceedings.neurips.cc/paper/2014/file/5ca3e9b122f61f8f06494c97b1afccf3-Paper.pdf
- [3] J. Donahue, P. Krähenbühl, and T. Darrell, “Adversarial feature learning,” CoRR, vol. abs/1605.09782, 2016. [Online]. Available: http://arxiv.org/abs/1605.09782
- [4] M. O. Kaplan and S. E. Alptekin, “An improved bigan based approach for anomaly detection,” in KES, 2020.
- [5] S. Dani, “A research paper on an impact of goods and service tax (gst) on indianeconomy,” Business and Economics Journal, vol. 7, pp. 1–2, 2016.
- [6] D. de Roux, B. Perez, A. Moreno, M. Villamil, and C. Figueroa, “Tax fraud detection for under-reporting declarations using an unsupervised machine learning approach,” in Proceedings of the 24th ACM SIGKDD International Conference on Knowledge Discovery & Data Mining, KDD 2018, London, UK, August 19-23, 2018, Y. Guo and F. Farooq, Eds. ACM, 2018, pp. 215–222. [Online]. Available: https://doi.org/10.1145/3219819.3219878
- [7] Y. Sahin and E. Duman, “Detecting credit card fraud by ann and logistic regression,” 2011 International Symposium on Innovations in Intelligent Systems and Applications, pp. 315–319, 2011.
- [8] Z. Assylbekov, I. Melnykov, R. Bekishev, A. Baltabayeva, D. Bissengaliyeva, and E. Mamlin, “Detecting value-added tax evasion by business entities of kazakhstan,” in Intelligent Decision Technologies 2016 - Proceedings of the 8th KES International Conference on Intelligent Decision Technologies, KES-IDT 2016, ser. Smart Innovation, Systems and Technologies, L. Jain, R. Howlett, I. Czarnowski, A. Caballero, L. Jain, and L. Jain, Eds. Germany: Springer Science and Business Media Deutschland GmbH, 2016, pp. 37–49, 8th KES International Conference on Intelligent Decision Technologies, KES-IDT 2016 ; Conference date: 15-06-2016 Through 17-06-2016.
- [9] H. Issa and M. A. Vasarhelyi, “Application of anomaly detection techniques to identify fraudulent refunds,” Economics of Innovation eJournal, 2011.
- [10] P. C. González and J. D. Velásquez, “Characterization and detection of taxpayers with false invoices using data mining techniques,” Expert Syst. Appl., vol. 40, pp. 1427–1436, 2013.
- [11] S. Wang, J. F. Balarezo, S. Kandeepan, A. Al-Hourani, K. G. Chavez, and B. Rubinstein, “Machine learning in network anomaly detection: A survey,” IEEE Access, vol. 9, pp. 152 379–152 396, 2021.
- [12] S. Yuan, X. Wu, J. Y. Li, and A. Lu, “Spectrum-based deep neural networks for fraud detection,” Proceedings of the 2017 ACM on Conference on Information and Knowledge Management, 2017.
- [13] J. Chen, Y. Shen, and R. Ali, “Credit card fraud detection using sparse autoencoder and generative adversarial network,” 2018 IEEE 9th Annual Information Technology, Electronics and Mobile Communication Conference (IEMCON), pp. 1054–1059, 2018.
- [14] S. Zhang, S. Jiang, and Y. Yan, “A software defect prediction approach based on bigan anomaly detection,” Scientific Programming, vol. 2022, 2022.
- [15] R. Chalapathy and S. Chawla, “Deep learning for anomaly detection: A survey,” CoRR, vol. abs/1901.03407, 2019. [Online]. Available: http://arxiv.org/abs/1901.03407