[figure]style=plain,subcapbesideposition=top
Active osmotic-like pressure on permeable inclusions
Abstract
We use active Brownian model to study effective pressure produced by active fluids on a fixed permeable inclusion whose interior and exterior regions are characterized by different particle motilities. We consider both rectangular and disklike inclusions and investigate the role of mismatching interior/exterior motility in the osmotic-like (effective) pressure which is exerted by active particles on the enclosing membrane of the inclusions. We find two different traits in the regimes of small and large motility strengths. In the former case, active pressure is sensitive to initial conditions. Given an initial condition where active particles are homogeneously distributed in the environment, active pressure is found to be higher in the region with higher motility. By contrast, in the regime of strong motility, active pressure is nonsensitive to initial conditions and is found to be higher in the region with lower motility. This difference arises from the ability of active particles to go through the membrane enclosure. In the weak motility regime, active particles are unable to permeate through the membrane, maintaining the same concentration inside and outside the inclusion as established by initial conditions; hence, expectedly, active pressure is higher in the region of higher motility strength. In the strong motility regime, active particles accumulate preferentially in the region of lower motility strength where they produce a respectively higher active pressure.
I Introduction
Active matter has evolved to a rapidly growing and diverse field of interest at the common interface of soft matter, statistical physics and biological sciences and engineering Ramaswamy2010 ; revGompper2015 ; revLowen2016 ; revMarchetti2013 ; revPeruani2019 ; Peruani2016 ; revRomanczuk2012 ; revSpeck2020 ; revStark2016 ; revVicsek2012 ; revFischer2018 ; revSitti2017 ; revWang2017 ; revShang2022 . Active systems comprise a wide range of biological organisms from macroscale (such as schools of fish and flocks of birds) to microscale (such as bacteria, algae and spermatozoa) revMarchetti2013 ; revGompper2015 ; Berg2003 ; Goldstein2015 ; Lardner1974 ; Woolley2003 ; Machemer1972 ; Sleigh1974 . These have inspired development and synthesis of many artificially made active self-propulsive particles (such as Janus colloids, photoactivated particles, bimetallic nanorods, etc) in the recent past revGompper2015 ; Paxton2004 ; Arslanova2021 ; Reddy2013 ; Dugyala2018 ; Vutukuri2016 ; Howse2010 ; Dreyfus2004 ; Bechinger2012 ; Bechinger2016 ; Sano2009 ; Gohy2017 . Active particles continuously take up free energy from their surrounding medium and convert it to motion through, for instance, internal mechanisms (such as extracellular organelles as in flagellated bacteria) or chemical surface reactions (as in Janus colloids). Thanks to their out of equilibrium character, self-propelled particles engender intriguing many-body effects, including self-organized collective motion (see, e.g., Refs. Abkenar2013 ; Peruani2016 ; revPeruani2019 ; revVicsek2012 ; Ramaswamy2014 and references therein), nonequilibrium clustering and phase separation Filion 2016 ; Graaf 2016 ; Dunkel 2014 ; Glaser2021 ; Abkenar2013 ; Dolai2020 ; Cates2015 ; Cates2018 ; Baskaran2013 ; Orlandini2014 ; Brady2015 as well as long-range bath-mediated interactions between inclusions and boundary walls immersed in active suspensions revSpeck2020 ; Harder2014 ; Naji2017 ; Lowen2015 ; Cacciuto2014 ; Bolhuis2015 ; Leonardo2011 ; Reichhardt2014 ; Ferreira2016 ; Zhang2018 ; Zhang2020 ; Pagonabarraga2019 ; Kafri2018 ; Selinger2018 ; Garcia2015 ; Narayanan2018 ; Naji2020z ; Yang2020 ; Marconi2018 ; Mishra2018 ; Naji2020 ; Naji2021a ; Naji2021b ; Naji2021c .
A particularly interesting facet of active suspensions is the so-called active or swim pressure produced by the constituent self-propelled particles Lowen2015 ; Kardar2015-1 ; Kardar2015-2 ; Cacciuto2014 ; Brady2014 ; Brady2015 ; Selinger2018 ; Marconi2017 ; Naji2021a ; Naji2018 . In equilibrium systems, pressure can be calculated using thermodynamic, mechanical and hydrodynamical approaches, leading to the same result; one that follows a state equation and thus varies only with bulk properties such as temperature and density. In active systems, a state equation may not generally exist Kardar2015-2 and the pressure is thus mainly defined via mechanical and hydrodynamical approaches Kardar2015-1 ; Kardar2015-2 ; Brady2014 . More specifically, in the case of self-propelled spheres next to flat walls, the pressure can be described as a state function using activity-dependent effective temperature and bulk number density of spheres Brady2014 ; Cacciuto2014 . Active elongated particles and rods present a different situation where the pressure becomes dependent on particle-wall interactions Kardar2015-2 . Active pressure has been investigated on boundaries with different geometries such as flat walls Cacciuto2014 ; Selinger2018 , curved surfaces Lowen2015 ; Naji2021a ; Naji2018 ; Selinger2018 , corners Lowen2015 , sinusoidal and flexible interfaces Chen2017 ; ten Wolde2019 . In addition to the geometry of boundaries, active pressure can vary depending on intrinsic features of active particles such as chirality Naji2018 , interparticle interactions and local concentration Naji2021a ; Brady2014 ; Brady2015 .
In recent years, active pressure has also been used to explain other phenomena including motility induced phase separation Cates2015 ; Cates2018 ; Baskaran2013 ; Orlandini2014 ; Brady2015 , active depletion Lowen2015 ; Selinger2018 , deformation of flexible vesicles Chen2019 ; Angelan2016 ; Quillen2020 ; Vutukuri2020 ; ten Wolde2019 ; Chen2017 ; Hagan2021 , anomalous droplet ripening Naji2018 ; Cates2017 ; Julicher2014 ; Hyman2014 ; Julicher2016 and negative surface tension Brady2020 ; Lowen2015-1 ; Marchetti2018 . Negative surface tension emerges at the interface between dilute and condensed phases of repulsive active particles that undergo motility induced phase separation. Despite negative surface tension, the interface is stiff and stable Marchetti2018 . Droplet ripening in active fluids transpires in a way that contrasts the so-called Ostwald ripening in equilibrium (passive) emulsions; i.e., for two interconnected droplets, while Ostwald ripening de Gennes2004 ; Israelachvili2011 implies shrinkage of smaller droplets at the expense of the larger ones, the reversed process can take place for droplets suspended in an active fluid Naji2018 ; Julicher2014 ; Julicher2016 . In the latter case, the internal droplet pressure shows a nonmonotonic dependence on its size, enabling two interconnected droplets to reach a final state of equal size Naji2018 .
In this paper, we investigate effective (osmotic-like) pressure exerted on enclosing membrane of a permeable hollow inclusion in a suspension that involves active Brownian particles. The motility field is in general assumed to be different inside and outside the inclusion; i.e., active particles admit self-propulsion velocities in the interior and exterior regions. The system is studied using Brownian dynamics simulation in a standard two-dimensional (2D) setting by considering both rectangular and disklike inclusions. The general aspects of the model is similar to our previous work in which effective interactions between two permeable inclusions were studied Naji2020 . In the present work, we address the behavior of effective pressure (resulting from active pressure inside and outside the inclusion) across the parameter space spanned by the inside and outside Péclet numbers of active particles. We also explore the dependence of effective pressure on the size and geometry of the inclusion, the hardness of its enclosing membrane as well as interparticle interactions and concentration of active particles.
The model inclusions considered here can mimic soft biological micro-compartments such as cells and soft tissues with an example being furnished by tumors invaded by active drug-delivery agents Peng2018 ; Joseph2017 ; Schmidt2018 ; Sitti2019 ; Magdanz2019 ; Ghosh2020 ; Felfoul2016 . Artificial examples of such inclusions include fluid enclosures such as vesicles, stabilized (immiscible) droplets in emulsions and chemically active droplets Larsson2006 ; Kamat2011 ; Rideau2018 ; Cates2017 ; Hyman2014 ; Naji2018 ; Vutukuri2020 ; Angelan2016 . Spatially inhomogeneous motility field as considered can also be realized by producing, e.g., nonuniform temperature fields, fluid viscosity, or a heterogeneous landscape of environmental stimuli such as light and chemical reactant concentration Lowen2016 ; Machemer1972 ; Bechinger2012 ; Paxton2004 . Such motility fields are generally known to result in inhomogeneous nonequilibrium distributions of active particles. This is because active particles tend to populate regions of low motility strength where they achieve longer persistence times Brendel2015 ; Lowen2016 ; Lowen2018 ; Cate2016 ; Brader2017 ; Lowen2019 ; Merlitz2018 ; Naji2020 . We show that a more diverse picture emerges across the parameter space and active particles can accumulate more strongly inside and outside the inclusion (depending on the motility strengths and hardness of the inclusion membrane), causing a similarly diverse range of behaviors (including sign change) for the pressure on the inclusion.
II Model and Methods
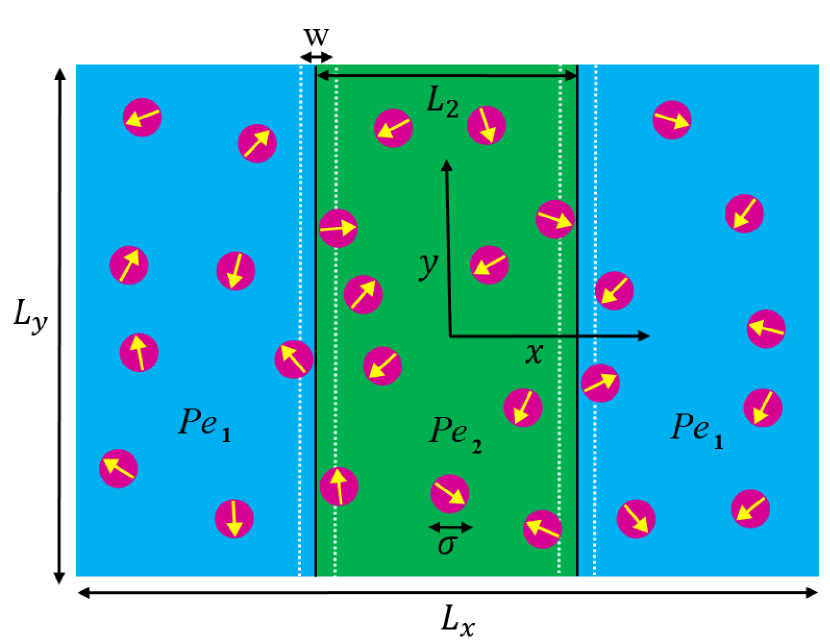
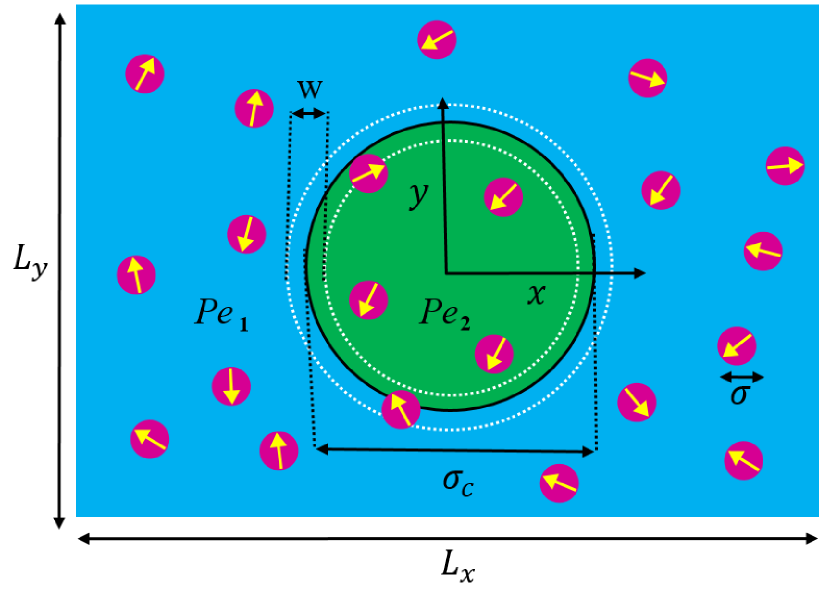
Our model consists of disklike active Brownian particles of diameter moving with constant self-propulsion speed on a 2D confining surface of area Sega2019 . The confining surface embeds a hollow permeable inclusion of rectangular or disk shape fixed at its center. The inclusion comprises a membrane enclosure (wall) of thickness that separates the inside and outside media which themselves impart different activities on the particles. In the case of rectangular inclusion, the length of inclusion in direction matches the entire length of confining surface and the centerlines of its walls (black vertical lines) are separated from each other by a distance of in direction; see Fig. 1a. In the case of disklike inclusion, the effective diameter of the inclusion (distance between the center and middle of its membrane, shown by a black circle) is denoted by ; see Fig. 1b). The membrane enclosure is represented by a soft, repulsive potential of range (to be specified later) and thus acts as a permeable interfacial region of thickness .
The active Brownian particles move with different self-propulsion speeds, and , outside and inside the inclusion, respectively. This discontinuous motility field Naji2020 ; Brendel2015 is formally expressed as
| (1) | |||||
| (5) |
where is the spatial coordinates with respect to the origin at the center of the confining surface, and is the Heaviside step function.
(a)
(b)
The overdamped Brownian dynamics of active particles is described by the Langevin equations,
| (6) | |||
| (7) |
where are the position vectors and are the self-propulsion orientation vectors of active particles labeled by . The angular orientation is measured from the -axis, is the translational particle mobility, is the sum of the interaction potentials between the constituent particles, and and are translational and rotational Gaussian white noises, respectively. The latter are characterized by zero mean, , and the correlators
| (8) | |||
| (9) |
where and are the translational and rotational diffusion coefficients, respectively. The Einstein-Smoluchowski-Sutherland relation implies , and the low-Reynold-number (Stokes) hydrodynamics for no-slip spheres gives Brenner1983 .
The active particles interact with each other via a short-ranged steric pair potential, utilized through the Weeks-Chandler-Andersen (WCA) pair potential, ; i.e., for the th and th active particles, we have
| (13) |
where . When active particles go through the interfacial region of the inclusion, they experience a soft repulsive WCA (sWCA) potential, which for the th active particle, is assumed to be of the form Naji2020
| (14) |
for , and otherwise. Here, is defined through Eq. (5) and we have
| (15) |
We use a fixed value of and vary to study the effects of membrane hardness. We study the steady-state properties of the system by numerically solving the Langevin equation. The results are analyzed in terms of dimensionless Péclet numbers defined as
| (16) |
for outside () and inside () regions. Péclet numbers are varied over a wide range of values from zero up to 100.
In our simulations, we fix the area fraction of active particles as and take the area of the confining surface as . In the case of rectangular and disklike inclusions, we use and , respectively. As defined, gives the bulk area fraction of active particles without excluding the inclusion area. The width of rectangular inclusion is taken as , and and the diameter of the disklike inclusion as , and .
The simulations include 100 up to 204 active particles with a resealed simulation timestep of . We use total simulation time steps with the first steps allocated for relaxation purposes.
III Results
The effective pressure on the inclusion membrane is obtained following the mechanical definition Kardar2015-2 and is expressed in rescaled form as
| (17) |
where is the perimeter of the membrane enclosure, is defined by Eq. (5) and the brackets denote steady-state time averaging over different simulation runs. The expression inside the brackets gives the instantaneous force due to the th active particle as this particle interacts with the inclusion membrane. () indicates an outward (inward) pressure.
III.1 Pressure on rectangular inclusion
(a)

(b)
(c)
(d)

(e)
(f)
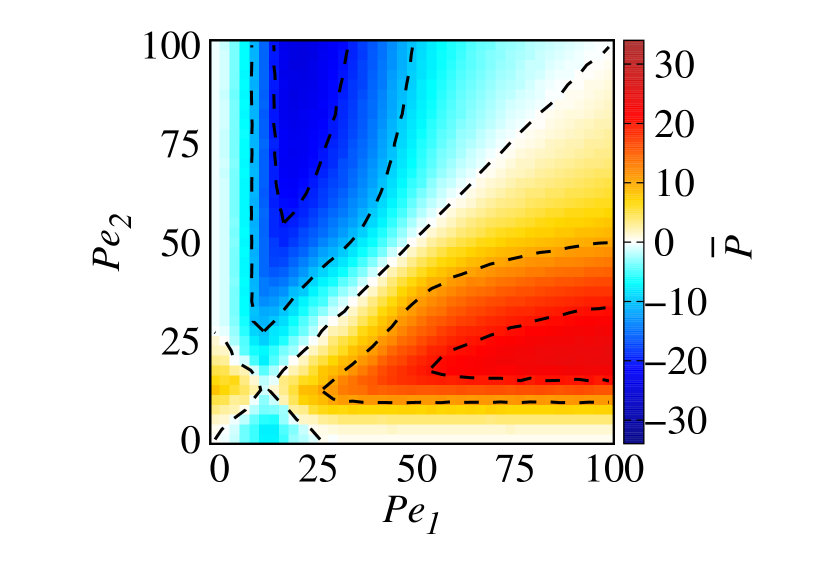
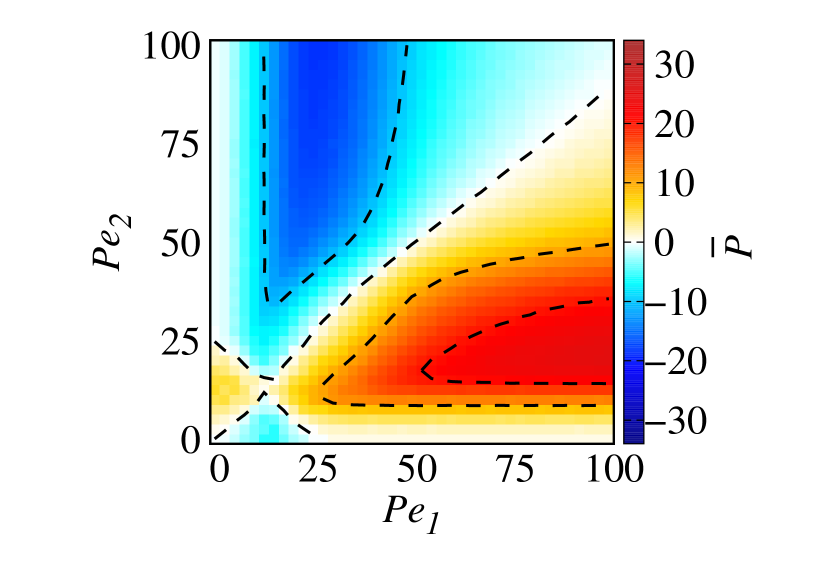
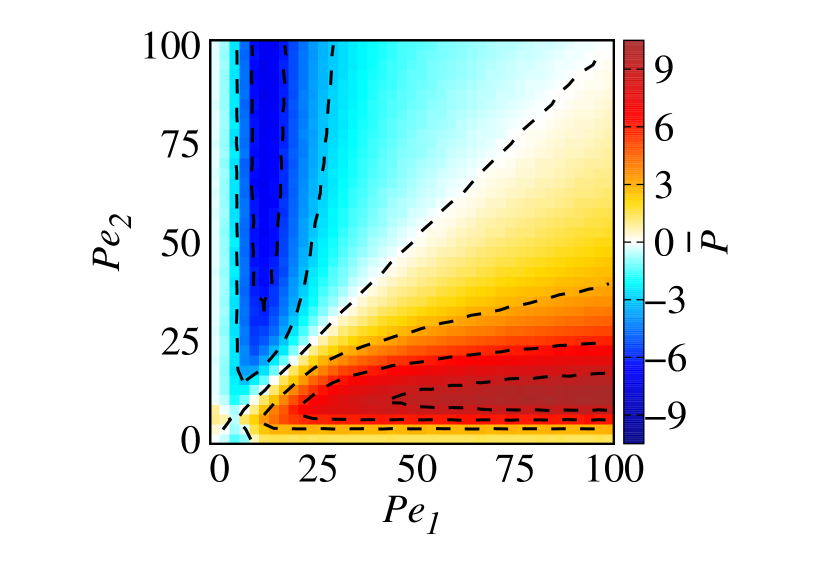
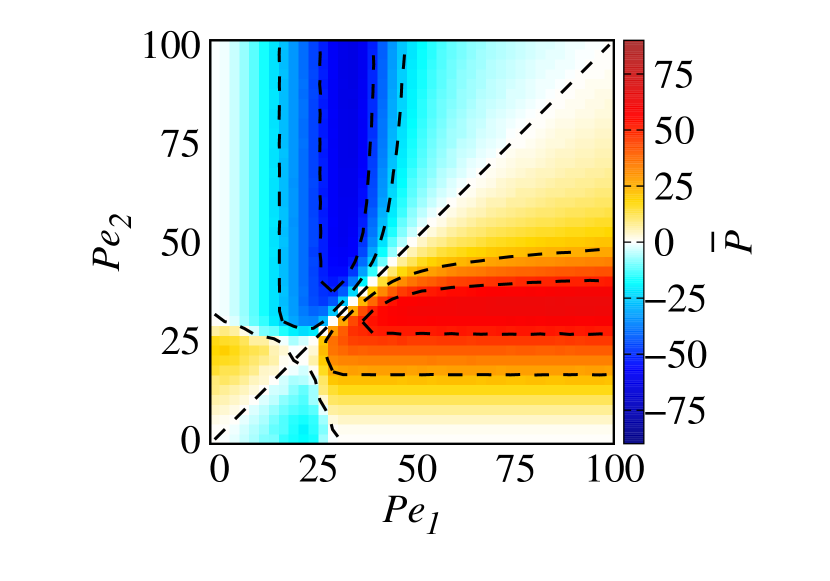
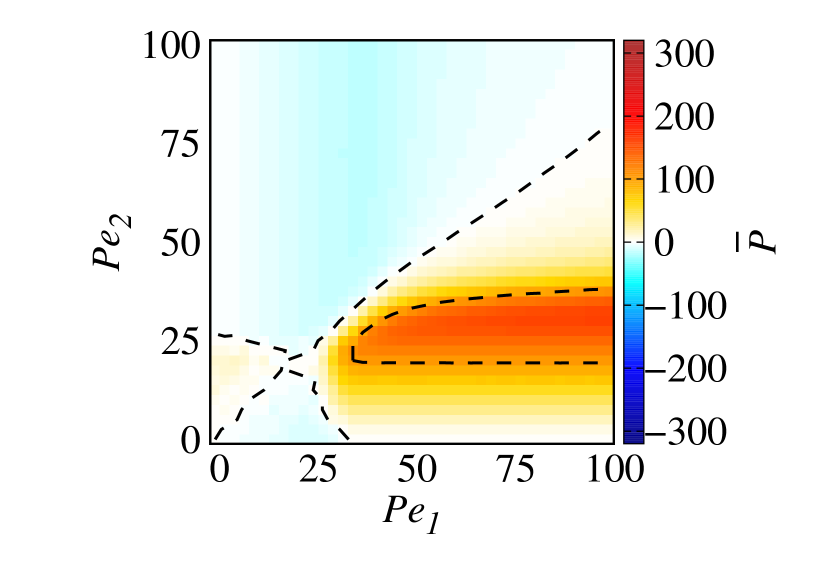
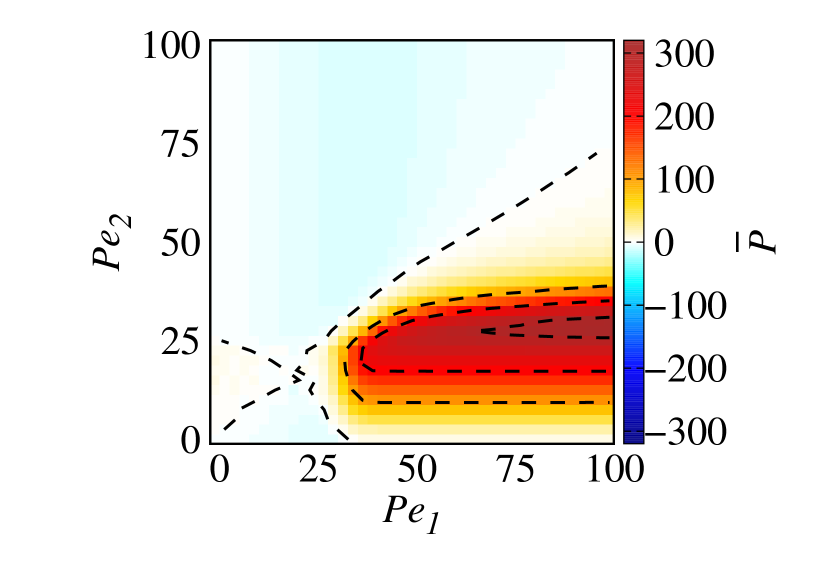
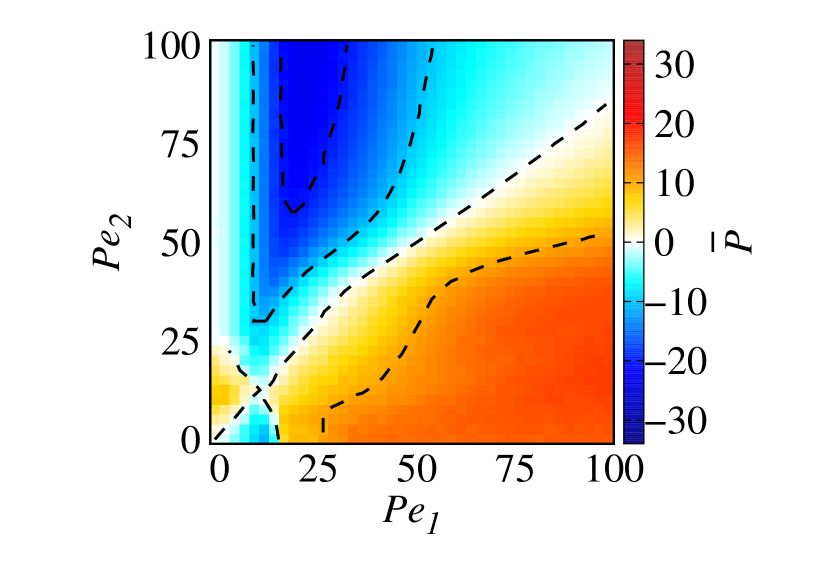
Figure 2 (a-c) shows the effective pressure on a rectangular inclusion as a function of motility strengths and for different widths of the inclusion, . In this figure, red and blue colors indicate positive (outward) and negative (inward) pressures, respectively, and dashed lines indicate constant-pressure contour lines calculated by interpolation of discrete data obtained at resolutions of and . We can recognize two regimes of behavior; i.e., and . In the former regime, effective pressure points toward the region of lower motility and in the later regime, the effective pressure points away from the region of lower motility. In general, the difference in particle concentrations between the two regions and the strengths of motility fields are the key factors that determine the effective pressure. For these data, simulations started from the initial conditions where active particles are homogeneously distributed on the confining surface and, hence, the area fractions were same both inside and outside the inclusion. At low motility field strengths, , active particles cannot overcome the potential barrier of inclusion membrane to go through it. As a result, after the system reaches the steady state, area fractions of active particles inside and outside the inclusion remain unchanged and equal to one another. In this situation, it is only the motilities that influence the effective pressure. Hence, the active pressure in the region of higher motility strength is stronger than that in the region of lower motility strength, and the effective pressure points toward the lower motility region. At intermediate and large motilities, , active particles overcome the potential barrier of the membrane and translate between the exterior and interior regions and accumulate more strongly in the region of lower motility Naji2020 . In this case, the particle concentration difference between the two regions plays a dominant role and the active pressure becomes stronger in the region of lower motility strength and the effective pressure points away from this region.
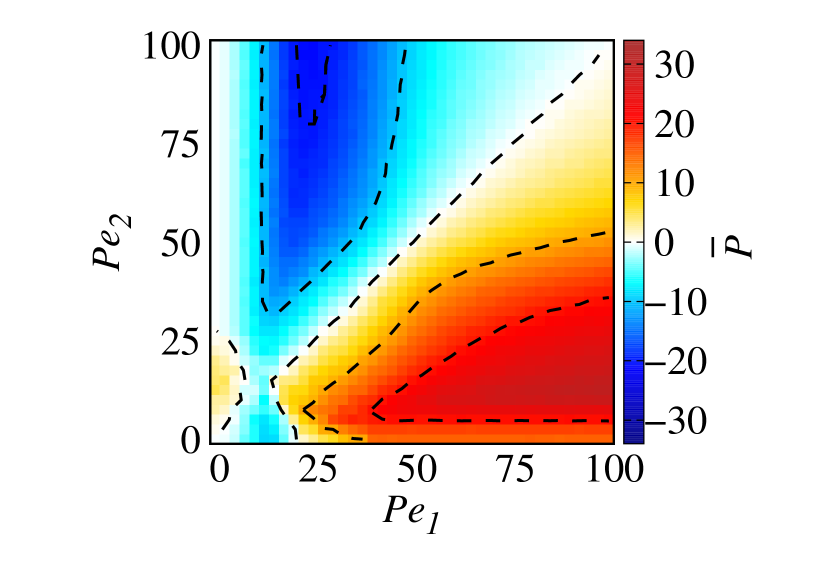
At intermediate and high strength motility fields, , the effective pressure on rectangular inclusion vanishes for (see figure 2 (a-c)). Figure 2 (a) shows effective pressure for inclusion width, . One can see the symmetry of red and blue colors and contour lines with respect to the line which indicates that the direction of effective pressure is reversed by exchanging and because the regions inside and outside the inclusion have equal widths . This symmetry is broken for (see figure 2 (b) and (c)). By reducing the width of inclusion, , outward (positive) and inward (negative) pressures become stronger and weaker respectively (from a to c in figure 2; the red colors become darker while blue colors become lighter). In Tables 1 and 2, we present values of the maximum and minimum pressures and their coordinates in the parameter space for panels (a-c) of figure 2.
| Panels | |||
|---|---|---|---|
| (a) | 24.43 | 100 | 22.5 |
| (b) | 27.28 | 100 | 17.5 |
| (c) | 30.25 | 100 | 12.5 |
| Panels | |||
|---|---|---|---|
| (a) | -24.23 | 22.5 | 100 |
| (b) | -21.70 | 22.5 | 100 |
| (c) | -20.87 | 22.5 | 100 |
As is decreased, the increase rate of the maximum pressure, , becomes greater than the decrease rate of the minimum pressure, . In fact, the rate of change in the maximum and minimum pressures depends on the rate of variation in the difference of active particle concentrations in the two interior and exterior regions. By reducing the width of the region of lower (higher) motility, the area fractions of active particles in both regions and their difference increases (decreases). As a result, positive (outward) and negative (inward) pressures increase and decrease, respectively. One should be aware that the area fraction in the region of lower motility can increase only up to a saturation value because of steric interactions between the active particles Naji2020 . The saturation value corresponds to the area fraction of hexagonally close-packed active particles in two dimensions, . Before the concentration of the region of lower motility reaches the saturation value, the difference of concentrations in the two regions increases by decreasing the area (width) of the region of lower motility. Afterwards, the difference of concentrations decreases. In this case, the concentration of the region of lower motility cannot reach the saturation value even for the shortest width of region 2, . Consequently, the maximum pressure in the table continuously increases by reducing .
Although the maximum difference in the motility strengths of the two regions leads to a maximum difference in particle concentrations, it does necessarily cause a maximum or minimum effective pressure. This is because of the direct impact of the motility strength on the effective pressure that active particles with intermediate motility produce stronger steric overlaps with the enclosing membrane and generate a stronger active pressure. This point is reflected by the values of () in maximum (minimum) pressure for different values of ; see Tables 1 and 2.
For , a strait appears in color maps of effective pressure which connects two blue parts of the maps where the pressure is inward (negative); see Fig. 2 (b) and(c). The strait becomes wider by decreasing . Above a certain threshold for Péclet number, active particles are able to overcome the potential barrier of the membrane. Independently of the value of , the effective pressure is totally negative for fixed values of near the threshold value. This effect may be rationalized as follows: For , one has equal concentrations of active particles outside and inside the inclusion as set by the initial conditions, making the active pressure outside the inclusion stronger than the inside and, hence, the effective pressure negative. For , the outside pressure is stronger because of the higher concentration of active particles. Note that for , despite equal concentrations and motility strengths in both regions, the effective pressure is nonvanishing and negative. Due to the smaller area available inside the inclusion, the number of active particles there is less than the outside and, as a result, a smaller part of the membrane from inside is exposed to active particles relative to the outside.
III.2 Pressure on disklike inclusion
(a)

(b)
(c)
(d)
(e)
(f)
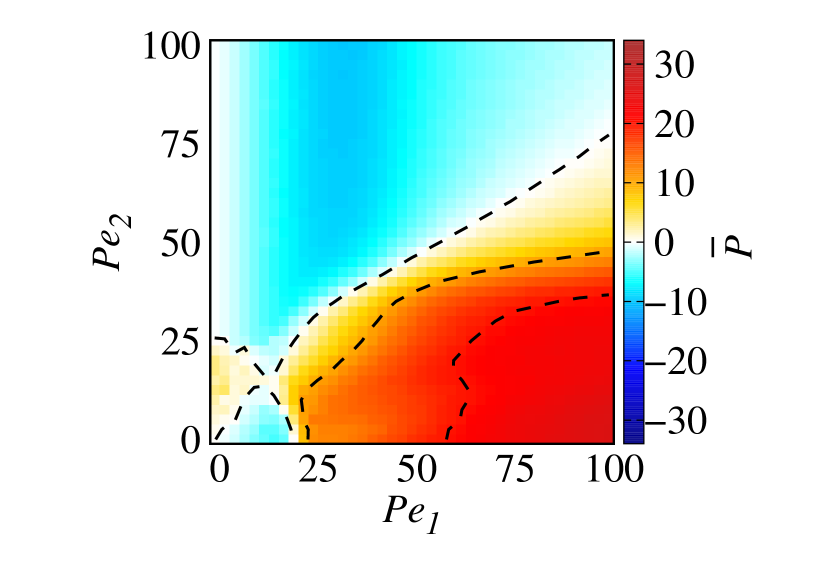
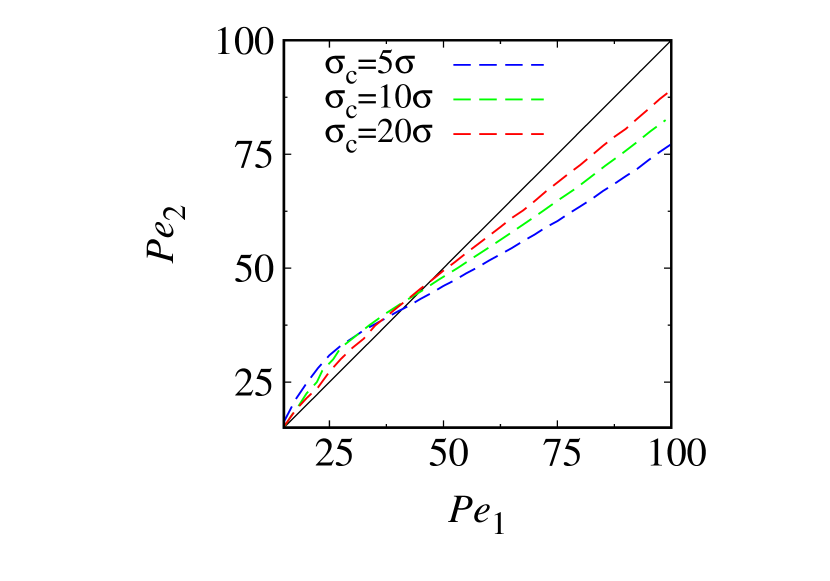
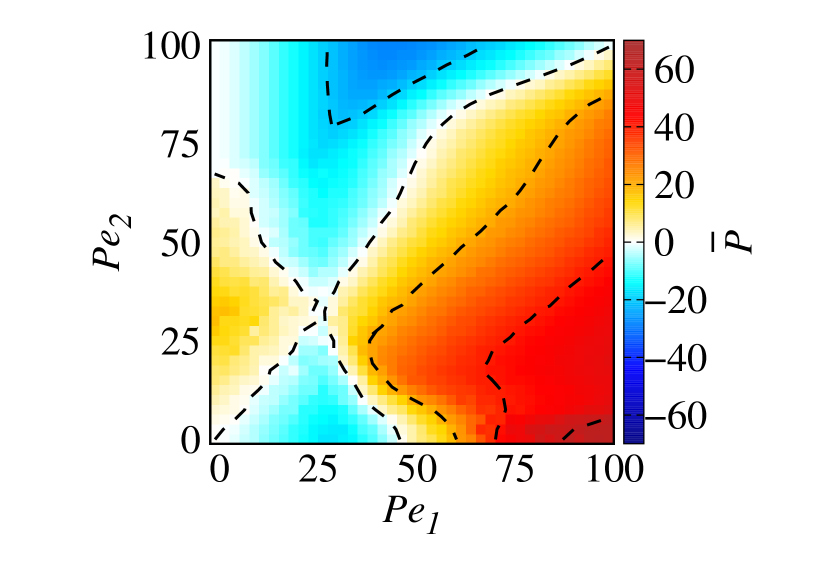
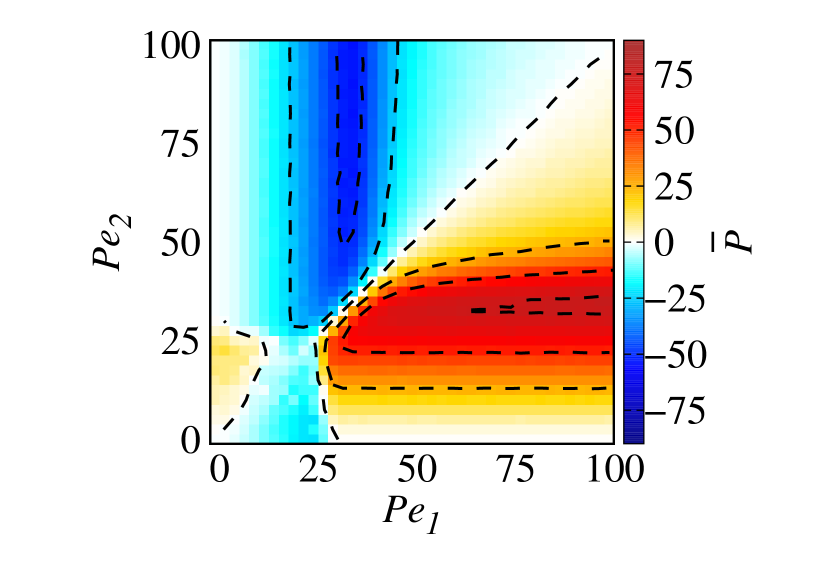
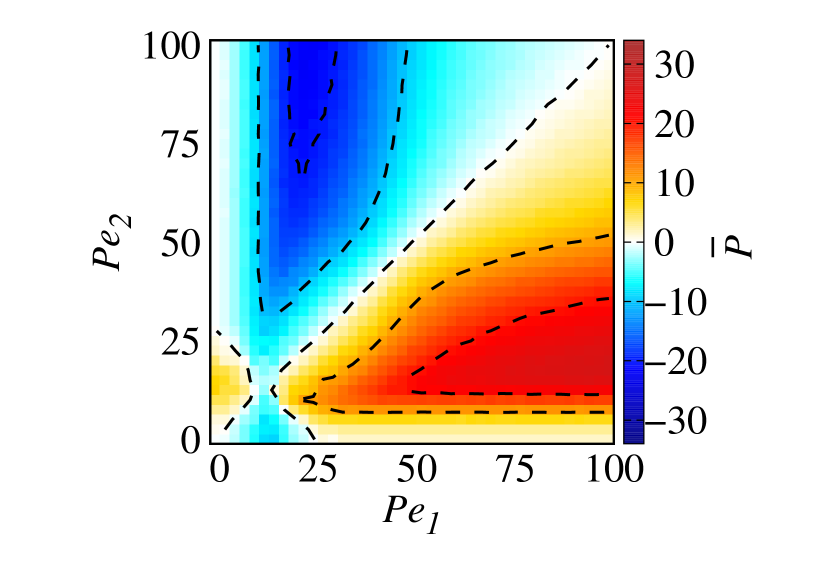
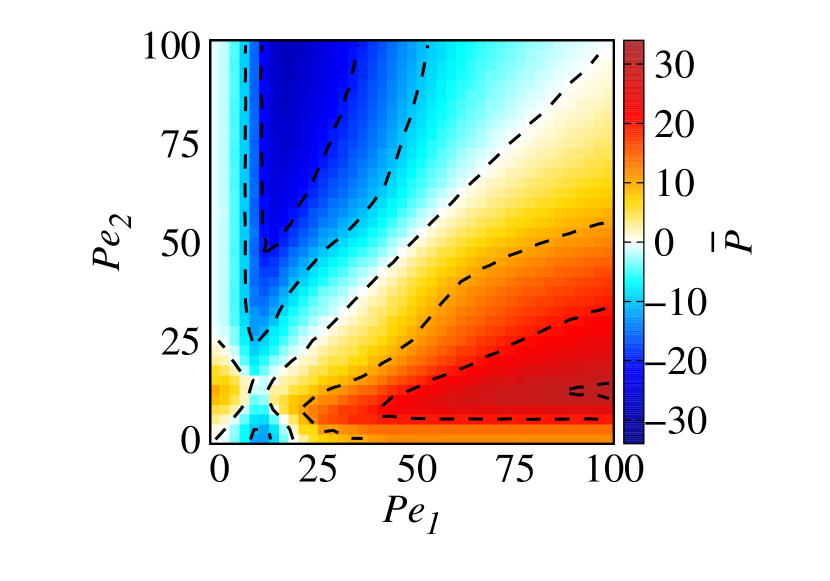
We now turn to the case of a disklike inclusion immersed in the active bath. Effective pressure in this case is partly similar to the case of rectangular inclusion but some subtle differences appear as well (compare the bottom row of panels with the top ones in figure 2). Contour lines in the case of disklike inclusion are different from the rectangular case. Figure 3 shows contour lines of zero pressure for disklike inclusions with different diameters and for intermediate and high strength of motility fields, . In contrast to the rectangular case, the contour lines of zero pressure for the disklike inclusion deviate from the straight line of (for brevity, we call this the reference line and show it by the solid black line in figure 3). These deviations decrease as the diameter of the disklike inclusion increases. For , the contour lines lie above the reference line while for lie under it; see figure 3. At intermediate motility strengths, , active particles can hardly pass through the membrane enclosure of disk, for , active pressure on the concave surface of the membrane is stronger than the convex one akin to the case of impermeable boundaries Naji2018 ; Lowen2015 . This is because the detention time of active particles on the concave surface is larger than on the convex one and, hence, more active particles accumulate against the concave surface Gompper2015 . As a result of this, for , the effect of the longer detention time of active particles on the active pressure inside the inclusion suppressed by the effect of weaker accumulation of active particles there, making a trade-off between active pressure inside and outside (see figure 3). For high strength of the motility fields, , active particles easily pass through the membrane rather than sliding along the membrane for an extended duration. For , typical detention time of active particles on the concave internal surface is expected to remain roughly around the detention time on the convex external surface of the membrane. In this case, active pressure outside the inclusion is larger than the inside because the external border of the membrane is larger than its internal border, producing more active particles collisions with the membrane from the outside region. As a result, for , effective pressure can vanish, as the higher interior concentration of active particles enhance the inside pressure and brings it to level of the outside pressure (see figure 3). In figure. 2, the overall positive (outward) pressure in panel e () is larger than in panels d () and f (). As the diameter of the disk decreases, positive pressure increases up to a maximum value and then decreases. Because the difference in the concentration (area fraction) of active particles inside and outside the disk increases up to a maximum value. When the disklike inclusion has the minimum area to encompass all active particles, the concentration difference reaches a maximum value which corresponds to the situation where the area fractions inside and outside the inclusion equal the saturation value (i.e., area fraction of hexagonal close-packing, ) and the fully depleted value (), respectively.
(a)
(b)
(c)
(d)
(e)
(f)
III.3 Role of membrane hardness
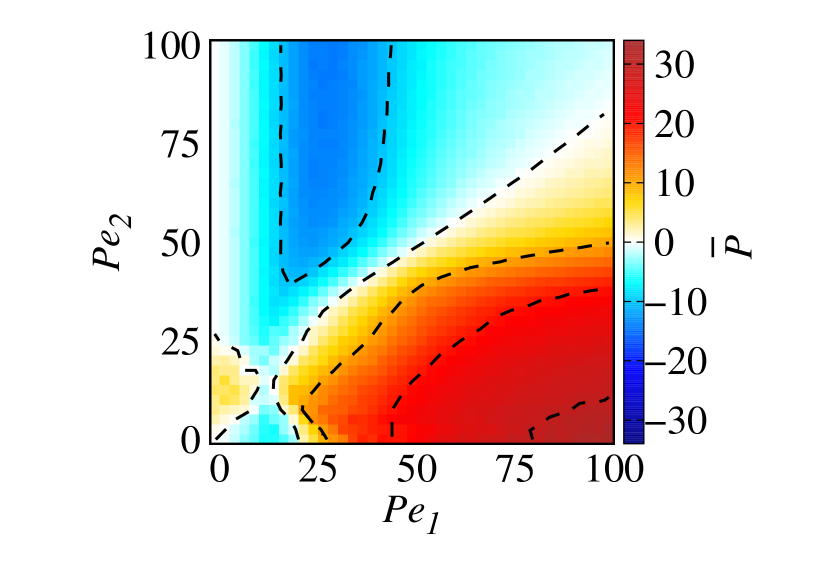
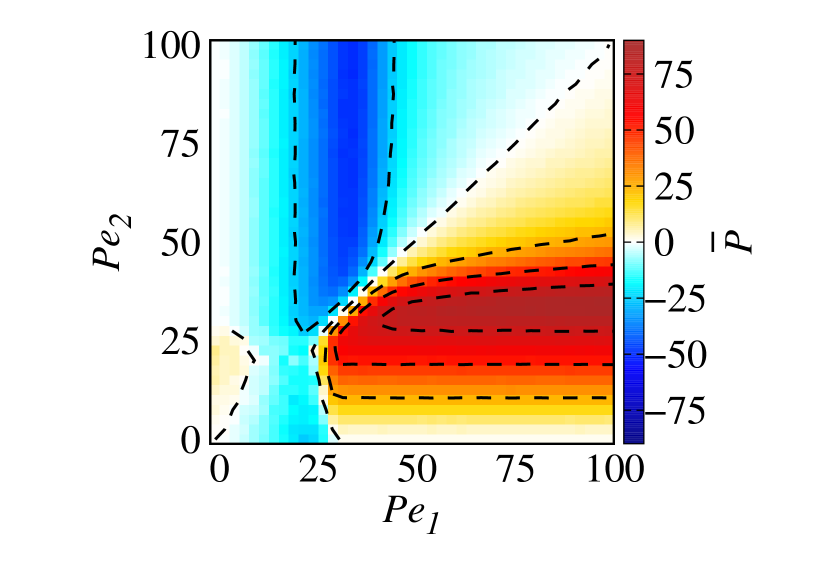
In this section, we discuss how the hardness of enclosing membrane affects the effective pressure on the inclusion. Figure 4 (a-c) shows the effective pressure on the rectangular inclusion as a function of motility field strengths, and , for fixed width of rectangle, and different values of membrane hardness parameter, (a), (b) and (c). As seen, the overall magnitude of the effective pressure increases with the strength of membrane hardness, . As we discussed in sec. III.1, in the regime of low motility fields, effective pressure is directed toward the region of lower motility (due to comparable concentrations of active particles inside and outside the inclusion). By comparing panels (a), (b) and (c) in figure 4, we find that the parametric region, where the effective pressure is directed toward the region of lower motility, shrinks by decreasing the strength of membrane hardness, . Indeed, the extent of this regime of parameters depends on the threshold motility strength required for the active particles to pass through the membrane. The largest such region in the parameter space is found in figure 4 (a) where membrane hardness is the largest (); this region of parameter space almost disappears in figure 4 (c) where the membrane is rather soft. We also find that the strait, which connects the two blue parts of the color map (where the effective pressure is negative or inward), becomes narrower and squeezes down the origin (0, 0) in the parameter space by reducing the strength of membrane hardness, . In general, the span and width of the said strait depends on the strength of membrane hardness.
For the disklike inclusion, the dependence of effective pressure on the hardness of membrane is almost similar to the case of rectangular inclusion. Panels (d-f) in figure 4 show the effective pressure on the inclusion of diameter, for and , respectively. By comparing the contour lines associated with zero effective pressure in these panels, we find that the contour lines for (a) and (c) (the largest and smallest values of membrane hardness, and respectively) in the range of motility strengths indicated in the figure 4, completely lies above and under the line , respectively. As we discussed in section III.2, for , when active particles can hardly pass through the membrane, active pressure inside the inclusion is stronger than outside while when active particles can easily go through the membrane, the active pressure inside the disk is weaker than outside. This is the reason for the contour line lies above and under the reference line () for hard and soft membranes, respectively.
(a)
(b)

(c)
(d)
III.4 Non-interacting active particles
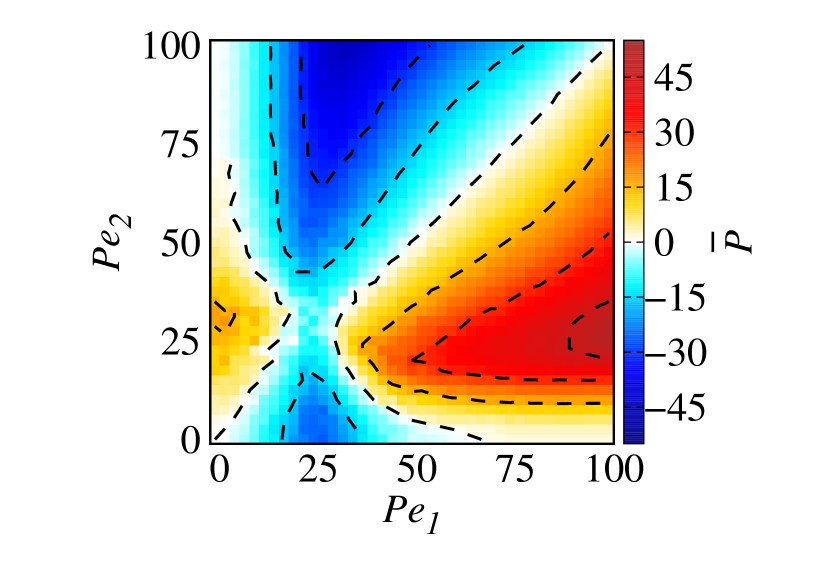
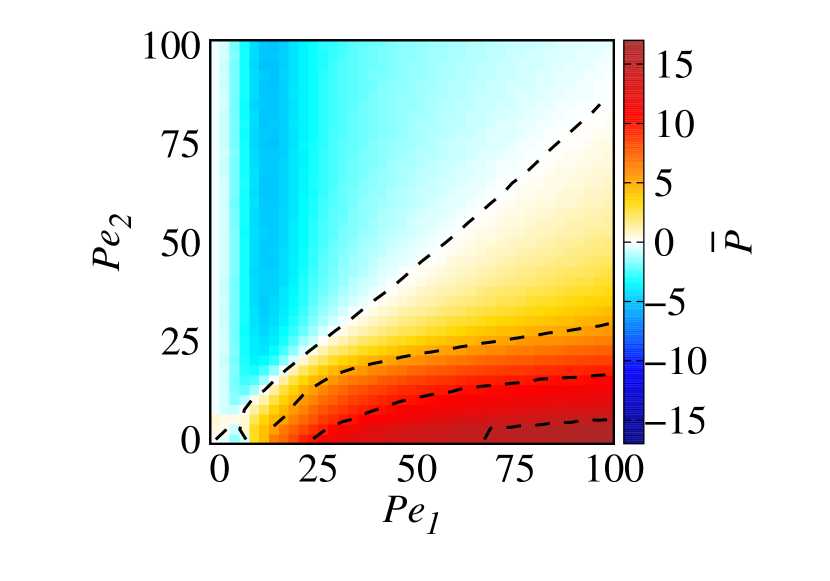
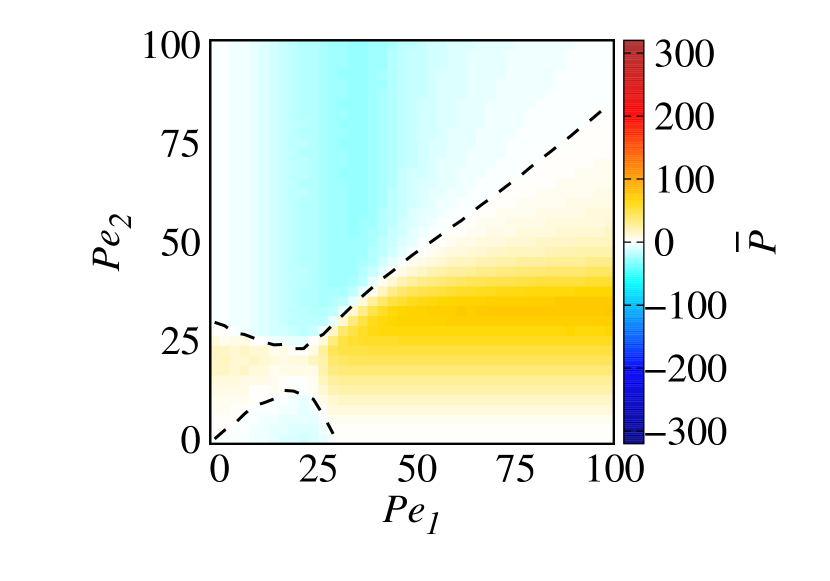
To unveil the interplay between the effective pressure and the steric interactions between active particles, we switch off the steric interactions between active particles and compare the results with the case of interacting active particles in Sec. III.1 and III.2. In the case of non-interacting particles, many body effects are absent. Figure 5 shows the effective pressure on the inclusion by non-interacting active particles for both cases of rectangular (top-row panels) and disklike inclusions (bottom-row panels). Absence of steric interactions enhance the main features of the effective pressure. By comparing the effective pressure in the case of noninteracting (figure 5) and interacting particles (figure 2), we find that the effective pressure in the former case is stronger and varies more rapidly with the motility strengths, and . This is because a larger fraction of active particles come into collision with the membrane in the non-interacting case. In the case of rectangular inclusion, the strait that connects two blue parts of the color map which is associated with the negative (inward) effective pressure becomes wider (compare panels (b) and (c) in figures 5 and 2).
Panels (d-f) in figure 5 show the effective pressure on the disklike inclusion of diameter and , respectively, in the case of non-interacting active particles. As seen, positive (negative) pressures continuously increases (decreases) with decreasing the diameter of the inclusion . In contrast to the case of interacting particles in which the largest value of positive pressure is imparted on the inclusion of diameter (see panels (d-f) in figure 2), here positive pressure is at its highest value for (see panels (d-f) in figure 5). This reflects the fact that there is no saturation for the concentration of active particles inside the disk in the non-interacting case and, thus, interior concentration of active particles increases as decreases.
III.5 Role of area fraction
Panels (a) and (b) in figure 6 show the effective pressure on the rectangular inclusion for fixed width and different values of area fraction for active particles , respectively. The increase in the area fraction makes the overall magnitude of the effective pressure larger because the difference of active particle concentration between the interior and exterior regions increases. In the case of rectangular inclusion, concentration of active particles inside the inclusion can not reach a saturation value (even for ) because the area of inclusion is sufficiently large to encompass all active particles. Panels (c) and (d) in figure 6 show the effective pressure exerted on the disklike inclusion of diameter for and , respectively. As seen, the absolute value of negative (inward) pressure increases by increasing from to , and the positive pressure decreases. The latter is because at high and low , active particle concentration inside the inclusion for (d) reaches the saturation value of , leaving a relatively larger fraction of particles outside the inclusion; as a result, the difference in the interior and exterior concentrations becomes smaller in comparison with (c). In general, by increasing , the effective pressure becomes stronger if both inside and outside the enclosure have enough ‘capacity’ to incorporate all of active particles. This uptrend ends where the area fraction inside or outside the inclusion reaches the saturation value.
IV Summary
In this study, we have employed the active Brownian model to investigate the effective pressure exerted on permeable membrane of a rectangular and a disklike inclusion immersed inside an active fluid by allowing for the motility strength (self-propulsion) speed of the particle to take different values inside and outside the inclusion. We investigated the role of motility fields on the effective pressure and found two distinct traits of behavior in the regimes of low and high motility fields. At low motility fields, the pressure is higher in the fluid region that produces stronger motility for the active particles. In this case, the effective (osmotic-like) pressure is directed outward of the fluid region that is characterized by a higher motility. By contrast, in the regime of high motility fields where both or one of the interior and exterior motilities are above a certain threshold, the active pressure is higher in the region of lower motility. The threshold is characterized by the motility strength that enables the active particles to overcome the repulsive membrane potential and pass across the membrane. We map out the low and high-motility regimes of the parameter space depending on the hardness of the permeable membrane. By increasing the membrane hardness, the areas of the parameter space corresponding to the low and high-motility behaviors expand and shrink respectively. When motility fields inside and outside the inclusion are below the said threshold, concentrations of active particles inside and outside the inclusion remain the same because of the initial conditions through which the active particles are homogeneously distributed on the confining surface. As a result, the active pressure is higher in the region of higher motility and, hence, the effective pressure is directed inward the region of lower motility. Above the threshold, because of stronger accumulation of active particles in the region of lower motility, the effective pressure is directed outward this region.
We have also discussed the differences in the effective pressure due to the rectangular and disklike geometry of the inclusion. Geometrical differences are mostly reflected in the constant-pressure contour lines plotted across the parameter space. At sufficiently high motility strengths, we find that the contour-line of zero pressure is given by the straight line of for the rectangular inclusion, while, for the disklike inclusion, it appears as curved line that tends to straight line as the diameter of the inclusion increases.
In the present model, the inclusion is assumed non-mobile and inflexible. It will be interesting to analyze the role of mobility and flexibility of the inclusion Angelan2016 ; Vutukuri2020 ; Hagan2021 in the future. We have also modeled the active particles as disks with merely steric interactions. Therefore, more complex shapes of active particles Dunkel 2014 ; Graaf 2016 ; Filion 2016 and other types of particle-particle interactions such as Vicsek interaction and particle chirality effects Naji2021a ; Naji2018 will be other possible venues to explore later.
V Acknowledgements
We thank L. Javidpour for useful comments and acknowledge support from the High Performance Computing Center, IPM.
References
- (1) Ramaswamy, S. The mechanics and statics of active matter. Annu. Rev. Condens. Matter Phys. 1, 323 (2010).
- (2) Bechinger, C. et al. Active particles in complex and crowded environments. Rev. Mod. Phys. 88(4), 045006 (2016).
- (3) Romanczuk, P., Bär, M., Ebeling, W., Lindner, B. & Schimansky-Geier, L. Active Brownian particles. Eur. Phys. J. Spec. Top. 202, 1 (2012).
- (4) Zöttl, A. & Stark, H. Emergent behavior in active inclusions. J. Phys. Condens. Matter 28, 253001 (2016).
- (5) Bär, M., Großmann, R., Heidenreich, S. & Peruani, F. Self-propelled rods: insights and perspectives for active matter. Annu. Rev. Condens. Matter Phys. 11, 441 (2019).
- (6) Peruani, F. Active Brownian rods. Eur. Phys. J. Spec. Top. 225, 2301 (2016).
- (7) Vicsek, T. & Zafeiris, A. Collective motion. Phys. Rep. 517, 71 (2012).
- (8) Speck, T. Collective forces in scalar active matter. Soft Matter 16, 2652-2663 (2020).
- (9) Palagi, S., Fischer, P. Bioinspired microrobots. Nat Rev Mater 3, 113 (2018).
- (10) Ceylan, J., Giltinan, J., Kozielski, K. & Sitti, M. Mobile microrobots for bioengineering applications. Labon a Chip 17, 1705–1724 (2017).
- (11) Li, J., Esteban-Fernández de Ávila, B., Gao, W., Zhang, L. & Wang, J. Micro/nanorobots for biomedicine: delivery, surgery, sensing, and detoxification. Sci. Robotic 2, eaam6431 (2017).
- (12) Lin, Z., Jiang, T. & Shang, J. The emerging technology of biohybrid micro-robots: a review. Bio-des. Manuf. 5, 107 (2022).
- (13) Marchetti, M. C. et al. Hydrodynamics of soft active matter. Rev. Mod. Phys. 85(3), 1143 (2013).
- (14) Elbecomei, J., Winkler, R. G. & Gompper, G. Physics of microswimmers–single particle motion and collective behavior: a review. Rep. Prog. Phys. 78(5), 056601 (2015).
- (15) Berg, H. C. E. coli in Motion (Springer, New York, 2003).
- (16) Goldstein, R. E. Green algae as model organisms for biological fluid dynamics. Annu. Rev. Fluid Mech. 47, 343 (2015).
- (17) Shack, W., Fray, C. & Lardner, T. Observations on the hydrodynamics and swimming motions of mammalian spermatozoa. Bull. Math. Biol. 36, 555 (1974).
- (18) Woolley, D. Motility of spermatozoa at surfaces. Reproduction 126, 259 (2003).
- (19) Blake, J. R. & Sleigh, M. A. Mechanics of ciliary locomotion. Biol. Rev. Camb. Philos. Soc. 49, 85 (1974).
- (20) Machemer, H. Ciliary activity and the origin of metachrony in Paramecium: Effects of increased viscosity. J. Exp. Biol. 57, 239 (1972).
- (21) Paxton, W. F. et al. Catalytic nanomotors: Autonomous movement of striped nanorods. J. Am. Chem. Soc. 126, 13424 (2004).
- (22) Buttinoni, I., Volpe, G., Kümmel, F., Volpe, G. & Bechinger, C. Active Brownian motion tunable by light. J. Phys. Condens. Matter 24, 284129 (2012).
- (23) Arslanova, A. et al. Sweeping rods: cargo transport by self-propelled bimetallic microrods moving perpendicular to their long axis. Soft Matter 17, 2369 (2021).
- (24) Reddy, N. K. et al. Metallic and bi-metallic Janus nanofibers: electrical and self-propulsion properties. J. Mater. Chem. C. 1, 3646 (2013).
- (25) Dugyala, V. R., Reddy, N., Fransaer, J. & Clasen, C. Self-propulsion of bent bimetallic Janus rods. Appl. Phys. 52, 014002 (2018).
- (26) Vutukuri, H. R. et al. Dynamic self-organization of side-propelling colloidal rods: experiments and simulations. Soft Matter 12, 9657 (2016).
- (27) Ebbens, S. J. & Howse, J. R. In pursuit of propulsion at the nanoscale. Soft Matter 6, 726 (2010).
- (28) Dreyfus, R., Baudry, J., Roper, M. et al. Microscopic artificial swimmers. Nature 437, 862 (2005).
- (29) Lozano, C., ten Hagen, B., Löwen, H. & Bechinger, C. Phototaxis of synthetic microswimmers in optical landscapes. Nat. Commun. 7, 12828 (2016).
- (30) Jiang, H.-R., Wada, H., Yoshinaga, N. & Sano, M. Manipulation of colloids by a nonequilibrium depletion force in a temperature gradient. Phys. Rev. Lett. 102, 208301 (2009).
- (31) Poggi, E. & Gohy, JF. Janus particles: from synthesis to application. Colloid. Polym. Sci. 295, 2083 (2017).
- (32) Kumar, N., Soni, H., Ramaswamy, S. & Sood, A. K. Flocking at a distance in active granular matter. Nat Commun 5, 4688 (2014).
- (33) Abkenar, M., Marx, K., Auth, T. & Gompper, G. Collective behavior of penetrable self-propelled rods in two dimensions. Phys. Rev. E 88, 062314 (2013).
- (34) Redner, G. S., Hagan, M. F. & Baskaran, A. Structure and dynamics of a phase-separating active colloidal fluid. Phys. Rev. Lett. 110, 055701 (2013).
- (35) Suma, A., Gonnella, G., Marenduzzo, D. & Orlandini, E. Motility-induced phase separation in an active dumbbell fluid. EPL 108, 56004 (2014).
- (36) Cates, M. E. & Tailleur, J. Motility-Induced Phase Separation. Annu. Rev. Condens. Matter Phys. 6:1, 219 (2015)
- (37) Solon, A. P. et al. Generalized thermodynamics of motility-induced phase separation: phase equilibria, Laplace pressure, and change of ensembles. New J. Phys. 20, 075001 (2018).
- (38) Takatori, S. C. & Brady, J. F. Towards a thermodynamics of active matter. Phys. Rev. E 91, 032117 (2015).
- (39) Moore, J. M., Glaser, M. A. & Betterton, M. D. Chiral self-sorting of active semiflexible filaments with intrinsic curvature. Soft Matter, 17, 4559 (2021).
- (40) S. E. Ilse, Holm, C. & Graaf, J. D. Clustering of Self-Propelled Triangles with Surface Roughness. J. Chem. Phys. 145, 134904 (2016).
- (41) V. Prymidis, Samin, S. & Filion, L. State behaviour and dynamics of self-propelled Brownian squares: a simulation study. Soft Matter 12, 4309 (2016).
- (42) Wensink, H. H., Kantsler, V., Goldstein, R. E. & Dunkel, J. Controlling active self-assembly through broken particle-shape symmetry. Phys. Rev. E 89, 010302(R) (2014).
- (43) Dolai, P., Das, A., Kundu, A., Dasgupta, C., Dhar, A. & Kumar, K. V. Universal scaling in active single-file dynamics. Soft Matter 16, 7077 (2020).
- (44) Harder, J., Mallory, S. A., Tung, C., Valeriani, C. & Cacciuto, A. The role of particle shape in active depletion. J. Chem. Phys. 141, 194901 (2014).
- (45) Ni, R., Cohen Stuart, M. A. & Bolhuis, P. G. Tunable long range forces mediated by self-propelled. Phys. Rev. Lett. 114, 018302 (2015).
- (46) Leite, L. R., Lucena, D., Potiguar, F. Q. & Ferreira, W. P. Depletion forces on circular and elliptical obstacles induced by active matter. Phys. Rev. E 94, 062602 (2016).
- (47) Zaeifi Yamchi, M. & Naji, A. Effective interactions between inclusions in an active bath. J. Chem. Phys. 147, 194901 (2017).
- (48) Zarif, M. & Naji, A. Confinement-induced alternating interactions between inclusions in an active fluid. Phys. Rev. E 102, 032613 (2020).
- (49) Sebtosheikh, M. & Naji, A. Effective interactions mediated between two permeable disks in an active fluid. Sci Rep 10, 15570 (2020).
- (50) Sebtosheikh, M., Naji, A. Noncentral forces mediated between two inclusions in a bath of active Brownian rods. Sci Rep 11, 23100 (2021).
- (51) Angelani, L., Maggi, C., Bernardini, M. L., Rizzo, A. & Di Leonardo, R. Effective interactions between colloidal particles suspended in a bath of swimming cells. Phys. Rev. Lett. 107, 138302 (2011).
- (52) Ray, D., Reichhardt, C. & Olson Reichhardt, C. Casimir effect in active matter systems. Phys. Rev. E 90, 013019 (2014).
- (53) Hua, Y., Li, K., Zhou, X., He, L. & Zhang, L. An attraction-repulsion transition of force on wedges induced by active particles. Soft Matter 14, 5205-5212 (2018).
- (54) Li, K. et al. An attraction-repulsion transition of force on two asymmetric wedges induced by active particles. Sci Rep 10, 11702 (2020).
- (55) Baek, Y., Solon, A. P., Xu, X., Nikola, N. & Kafri, Y. Generic long-range interactions between passive bodies in an active fluid. Phys. Rev. Lett. 120, 058002 (2018).
- (56) Semeraro, E. F., Devos, J. M. & Narayanan, T. Effective interactions and dynamics of small passive particles in an active bacterial medium. J. Chem. Phys. 148, 204905 (2018).
- (57) Codina, J. & Pagonabarraga, I. Asymmetric and long range interactions in shaken granular media. J. Chem. Phys. 151, 164903 (2019).
- (58) Krafnick, R. C. & García, A. E. Impact of hydrodynamics on effective interactions in suspensions of active and passive matter. Phys. Rev. E 91, 022308 (2015).
- (59) Liu, P., Ye, S, Ye, F., Chen, K. & Yang, M. Constraint dependence of active depletion forces on passive particles. Phys. Rev. Lett. 124, 158001 (2020).
- (60) Caprini, L. & Marconi, U. M. B. Active particles under confinement and effective force generation among surfaces. Soft Matter 14, 9044-9054 (2018).
- (61) Torrik, A., Naji, A. & Zarif, M. Dimeric colloidal inclusion in a chiral active bath: Effective interactions and chirality-induced torque. Phys. Rev. E 104, 064610 (2021).
- (62) Dolai, P., Simha, A. & Mishra, S. Phase separation in binary mixtures of active and passive particles. Soft Matter 14, 6137 (2018).
- (63) Fazli, Z., & Naji, A. Active particles with polar alignment in ring-shaped confinement. Phys. Rev. E 103, 022601 (2021).
- (64) Smallenburg, F. & Löwen, H. Swim pressure on walls with curves and corners. Phys. Rev. E 92, 032304 (2015).
- (65) Duzgun, A. & Selinger, J. V. Active Brownian particles near straight or curved walls: pressure and boundary layers. Phys. Rev. E 97, 032606 (2018).
- (66) Mallory, S. A., Šarić, A., Valeriani, C. & Cacciuto, A. Anomalous thermomechanical properties of a self-propelled colloidal fluid. Phys. Rev. E 89, 052303 (2014).
- (67) Takatori, S. C., Yan, W. & Brady, J. F. Swim pressure: stress generation in active matter. Phys. Rev. Lett. 113, 028103 (2014).
- (68) Solon, A. P. et al. Pressure and Phase Equilibria in Interacting Active Brownian Spheres. Phys. Rev. Lett. 114, 198301 (2015).
- (69) Solon, A. P. et al. Pressure is not a state function for generic active fluids. Nat. Phys. 11, 673 (2015).
- (70) Jamali, T. & Naji, A. Active fluids at circular boundaries: swim pressure and anomalous droplet ripening. Soft Matter 14, 4820 (2018).
- (71) Marconi, U. M. B.,Maggi, C. & Paoluzzi. M. Pressure in an exactly solvable model of active fluid. J. Chem. Phys. 147, 024903 (2017).
- (72) Li, Y. & ten Wolde, P. R. Shape transformations of vesicles induced by swim pressure. Phys. Rev. Lett. 123, 148003 (2019).
- (73) Tian, W.-d., Gu, Y., Guo, Y.-k. & Chen, K. Anomalous boundary deformation induced by enclosed active particles. Chinese Phys. B 26, 100502 (2017).
- (74) Wang, C., Guo, Y. K., Tian, W. D. & Chen, K. Shape transformation and manipulation of a vesicle by active particles. J. Chem. Phys. 150, 044907 (2019)
- (75) Quillen, A. C., Smucker, J. P., & Peshkov, A. Boids in a loop: Self-propelled particles within a flexible boundary. Phys. Rev. E 101, 052618 (2020).
- (76) Peterson, M.S.E., Baskaran, A. & Hagan, M.F. Vesicle shape transformations driven by confined active filaments. Nat Commun 12, 7247 (2021).
- (77) Paoluzzi, M., Di Leonardo, R., Marchetti, M. & Angelani, L. Shape and Displacement Fluctuations in Soft Vesicles Filled by Active Particles. Sci Rep 6, 34146 (2016).
- (78) Vutukuri, H.R. et al. Active particles induce large shape deformations in giant lipid vesicles. Nature 586, 52 (2020).
- (79) Cates, M. E. & Tjhung, E. Theories of binary fluid mixtures: from phase-separation kinetics to active emulsions. J. Fluid Mech. 836, 1-68 (2017).
- (80) Hyman, A. A., Weber, C. A., & Jülicher, F. Liquid-liquid phase separation in biology. Annu. Rev. Cell Dev. Biol. 30, 39-58 (2014).
- (81) Zwicker, D., Decker, M., Jaensch, S., Hyman, A.A. & Jülicher F. Centrosomes are autocatalytic droplets of pericentriolar material organized by centrioles. Proc. Natl. Acad. Sci. USA 111, E2636 (2014).
- (82) Zwicker, D., Seyboldt, R., Weber, C. A., Hyman, A. A. & Jülicher, F. Growth and division of active droplets provides a model for protocells. Nat. Phys. 13, 408-413 (2016).
- (83) Omar, A. K., Wang, Z. G. & Brady, J. F. Microscopic origins of the swim pressure and the anomalous surface tension of active matter. Phys. Rev. E 101, 012604 (2020).
- (84) Bialké, J., Siebert, J. T., Löwen, H. & Speck, T. Negative Interfacial Tension in Phase-Separated Active Brownian Particles. Phys. Rev. Lett. 115, 098301 (2015).
- (85) Patch, A., Sussman, D. M., Yllanes, D. & Marchetti, M. C. Curvature-dependent tension and tangential flows at the interface of motility-induced phases Soft Matter 14, 7435 (2018).
- (86) Israelachvili, J. N., Intermolecular and Surface Forces, 3rd ed. (Academic Press, London, 2011).
- (87) de Gennes, P.-G., Brochard-Wyart, F. & Quere, D. Capillarity and Wetting Phenomena (Springer, NewYork, 2004).
- (88) Peng, F., Men, Y., Tu, Y., Chen, Y. & Wilson, D. A. Nanomotor-based strategy for enhanced penetration across vasculature model. Adv. Funct. Mater. 28, 1706117 (2018).
- (89) Joseph. A. et al. Chemotactic synthetic vesicles: design and applications in blood-brain barrier crossing. Sci. Adv. 3, e1700362 (2017).
- (90) Medina-Sanchez, M., Xu, H. & Schmidt, O. G. Micro- and nano-motors: the new generation of drug carriers. Ther. Delivery. 9, 303-316 (2018).
- (91) Erkoc, P., Yasa, I.C., Ceylan, H., Yasa, O., Alapan, Y. & Sitti, M. Mobile microrobots for active therapeutic delivery. Adv. Ther. 2, 1800064 (2019).
- (92) Sonntag, L., Simmchen, J. & Magdanz, V. Nano-and micromotors designed for cancer therapy. Molecules 24(18), 3410 (2019).
- (93) Ghosh, A., Xu, W., Gupta, N. & Gracias, D. H. Active matter therapeutics. Nano Today. 31, 100836 (2020).
- (94) Felfoul, O. et al. Magneto-aerotactic bacteria deliver drug-containing nanoliposomes to tumour hypoxic regions. Nature Nanotech 11, 941-947 (2016).
- (95) Larsson, K., Quinn, P., Sato, K. & Tiberg, F. Lipids: Structure, Physical Properties and Functionality (Elsevier Science, 2006).
- (96) Kamat, N. P., Katz, J. S., & Hammer, D. A. Engineering polymersome protocells. J. Phys. Chem. Lett. 2, 1612-1623 (2011).
- (97) Rideau, E., Dimova, R., Schwille, P., Wurm, F. R. & Landfester, K. Liposomes and polymersomes: a comparative review towards cell mimicking. Chem. Soc. Rev. 47, 8572-8610 (2018).
- (98) Magiera, M. P. & Brendel, L. Trapping of interacting propelled colloidal particles in inhomogeneous media. Phys. Rev. E 92, 012304 (2015).
- (99) Lozano, C., ten Hagen, B., Löwen, H. & Bechinger, C. Phototaxis of synthetic microswimmers in optical landscapes. Nat. Commun. 7, 12828 (2016).
- (100) Grauer, J., Löwen, H. & Janssen, L. M. Spontaneous membrane formation and self-encapsulation of active rods in an inhomogeneous motility field. Phys. Rev. E 97, 022608 (2018).
- (101) Stenhammar, J., Wittkowski, R., Marenduzzo, D. & Cates, M. E. Light-induced self-assembly of active rectification devices. Sci. Adv. 2, e1501850 (2016).
- (102) Sharma, A. & Brader, J. M. Brownian systems with spatially inhomogeneous activity. Phys. Rev. E 96, 032604 (2017).
- (103) Jahanshahi, S., Lozano, C., ten Hagen, B., Bechinger, C. & Löwen, H. Colloidal Brazil nut effect in microswimmer mixtures induced by motility contrast. J. Chem. Phys. 150, 114902 (2019).
- (104) Vuijk, H. D., Sharma, A., Mondal, D., Sommer, J. & Merlitz, H. Pseudochemotaxis in inhomogeneous active Brownian systems. Phys. Rev. E 97, 042612 (2018).
- (105) Callegari, A. & Volpe, G. Numerical simulations of active Brownian particles, In: Toschi, F. & Sega, M. (eds.) Flowing matter (Springer, 2019).
- (106) Happel, J. & Brenner, H. Low Reynolds Number Hydrodynamics: With Special Applications to Particulate Media (Springer Netherlands & Martinus Nijho Publishers, The Netherlands, 1983).
- (107) Wysocki, A., Elgeti, J. & Gompper, G. Giant adsorption of microswimmers: Duality of shape asymmetry and wall curvature. Phys. Rev. E 91, 050302 (2015).