Impact ionization in low-band-gap semiconductors driven by ultrafast THz excitation: beyond the ballistic regime
Abstract
Using two-dimensional THz spectroscopy in combination with numerical models, we investigate the dynamics linked to carrier multiplication caused by high-field THz excitation of the low-gap semiconductor InSb. In addition to previously observed dynamics connected with quasi-ballistic carrier dynamics, we observe other spectral and temporal features that we attribute to impact ionization for peak fields above 60 kV/cm, which continue up to the maximum investigated peak field of 430 kV/cm. At the highest fields we estimate a carrier multiplication factor greater than 10 due to impact ionization, which is well-reproduced by a numerical simulation of the impact ionization process which we have developed.
I Introduction
The development of new radiation sources and detectors in the terahertz (THz) frequency range, a previously under-explored region of the electromagnetic spectrum between 0.3 THz and 30 THz [1, 2], has paved the way for new possibilities to investigate solid-state systems on timescales of a few picoseconds. The development of intense single-cycle THz sources and their use in ultrafast terahertz time-domain spectroscopy (THz TDS) have offered a powerful approach to study the properties of semiconductors in different physical regimes relevant to a number of scientific and technological fields. Intense THz electric fields have been used to excite and investigate different transport effects in semiconductors, for example ballistic electron acceleration in GaAs and InGaAs [3, 4], interband tunneling in GaAs [5], as well as impact ionization and intervalley scattering in semiconductors with direct and indirect energy bandgaps [6, 7], including InSb [8, 9].
In recent years, two-dimensional terahertz time-domain spectroscopy (2D THz TDS) has emerged as a variant of the basic TDS technique which is able to study the nonlinear electronic dynamics of crystalline materials [10]. It has been applied to the study of diverse phenomena such as electron- phonon coupling in GaAs/AlGaAs quantum wells [11], two-phonon coherence in InSb [12]. and soft modes in ferroelectrics [13].
Here we consider applications of 2D THz TDS to the study of nonlinear carrier dynamics in InSb. InSb is typical of a broad class of III-V low-bandgap semiconductors, and has become central to a number of technological applications, such as fast photodetectors [14, 15] and high-speed electronic devices with low-power consumption [16, 17, 17, 18]. The material is characterized by a strong spin-orbit coupling, large bulk electron mobility [19, 20], and a very small electron effective mass [21]. Due to these peculiar physical properties, InSb has become a prototypical material for the study of fundamental transport and optical effects in narrow-bandgap semiconductors, and a promising platform for novel applications in a wide range of fields, such as spintronics [22], magneto-plasmonics [23] and superconducting devices [24, 25].
Recently, 2D THz TDS has been used to investigate the low-field ballistic electronic transport regime in InSb and its coupling to the lattice excitations, reconstructing the local curvature of the conduction band in detail [26]. In this regime (peak fields below 60 kV/cm) the dynamics are accurately modeled by assuming the electrons are driven coherently and ballistically by the oscillating THz fields. In this work, we report a new investigation of the ultrafast nonlinear response of bulk InSb at room temperature with 2D THz TDS experiments with THz pump peak fields ranging between 60 kV/cm and 430 kV/cm. In this regime 2D THz spectra indicate the onset of carrier multiplication processes such as impact ionization and interband tunneling. We observe a significant broadening and shift of the plasma resonance, which we argue can be identified as a spectral fingerprint of the THz-driven increase of the conduction band population becoming up to 70 times larger than its equilibrium value. The experimental nonlinear traces are analyzed in detail in both time and frequency domains, highlighting the relevant timescales of carrier multiplication and its effect on the material reflectivity.
We compare these data with the results of a numerical simulation where we solve Maxwell’s equations taking into account the effects of both impact ionization and ballistic carrier transport. This hybrid model predicts the increase of the intensity and the broadening of the plasma spectral peak for high THz pump levels, in very good agreement with the measured 2D nonlinear spectra. Moreover, the calculated increase in the electron population is compatible with the values retrieved from the experimental data, indicating that the hybrid simulation gives a reasonable description of the material response.
II Experimental Methods
Our 2D THz spectroscopy setup employs two independent THz pump and THz probe pulses generated from an amplified femtosecond laser [26]. A Ti:Sapphire amplifier operating at 800 nm with repetition rate of 1 kHz and 100-fs pulse duration is used to seed two optical parametric amplifiers (OPAs). The signal outputs of the two OPAs are independently tuned to emit at wavelengths of 1.3 m and 1.5 m with energies of 0.8 mJ/pulse and 1.2 mJ/pulse, respectively.
We use the 1.3 m-beam to generate broadband THz pulses using the “air-plasma” method [27]. This involves focusing the beam with an off-axis parabolic mirror of focal length cm through a BBO crystal that is type-I phase matched for second-harmonic generation to a focal point in ambient air. The resulting two-color interaction with the air plasma results in a broadband THz pulse with a typical peak field intensity up to 100 kV/cm and broadband spectrum extending over the range 1-12 THz. The 1.5 m-beam is used to pump a DSTMS organic crystal, where optical rectification (OR) induces single-cycle THz pulse generation [28] with peak intensities up to 450 kV/cm and a relatively narrow bandwidth covering the frequency interval between 1.5 and 4.5 THz. The polarization of the air-plasma THz field is horizontal, whereas the OR-generated THz field is vertically polarized. In our 2D THz THD system the narrow-band OR-generated THz field is used as a high-intensity pump to excite the sample out of equilibrium, while the broadband air-plasma-generated THz pulse probes the broadband response of the system, with a focused peak field amplitude typically 2 to 10 times weaker than that of the pump.
The two cross-polarized THz beams are brought onto the sample using a combining wire-grid polarizer (WG), that reflects the THz pump and transmits the THz probe beams. After both beams reflect from the sample, the same WG lets the reflected probe beam through, while filtering out the reflection of the vertically polarized THz pump beam. The reflected probe signal is then refocused into an Air-Biased Coherent Detection (ABCD) system, which measures a projection of the time-dependent electric field at the center of the reflected beam [29]. This broadband, phase-resolved detection scheme uses an infrared detection beam, obtained by sampling a portion of the 1.3 m-beam with a 90-10 beamsplitter, to characterize the reflected THz pulse from the sample.
The ABCD data acquisition architecture is based on a hardware solution that chops the THz probe beam at 500 Hz and the THz pump beam at 250 Hz with fixed phase relationship, while the polarity of the ABCD bias is switched at a frequency of 125 Hz [26]. The choppers alternately expose the sample to different combinations of THz-light exposure (plasma-generated pulse only, OR pulse only, both pulses, and no pulses). The ABCD setup measures a selected projection of the time-dependent electric field at the center of the reflected beams from each of these combinations: the plasma-generated probe pulse , the OR-generated pump , the superposition of both temporal signals , as well as the background signal with all fields blocked. The projection axis of the ABCD is aligned to the polarization of the plasma-generated THz field. The pump-probe delay between the two independent THz beams and the detection delay t between the THz pulses and the infrared detection beam can be independently controlled. Here we define as the time difference between the arrival of the maximum field of the two pulses at the sample, with positive values indicating that the pump arrives first. The time is similarly defined as the time when the ABCD sampling pulse is coincident with the maximum of the probe pulse. For our 2D measurement in reflection mode, we define the “nonlinear” component of the field response as
| (1) |
To calibrate the absolute THz peak field amplitudes at the sample position we use electro-optic sampling in a 100 m-thick GaP crystal placed at the sample position. In order to investigate the high-field effects in the semiconductor sample, we control the incident THz pump intensity with a pair of WG polarizer on the path of the OR-generated beam before the sample. The first WG is set at an angle with respect to the vertical, whereas the second polarizer is set to pass vertically polarized light. The transmitted field is then nominally attenuated to of the OR-generated field, with the actual field amplitude directly measured by electro-optic sampling at the sample location. In this way THz pump peak field amplitudes are varied in the range between 60 kV/cm and 430 kV/cm, while keeping the THz probe fixed to a lower peak field value of 40 kV/cm.
In order to optimize the signal-to-noise ratio of the measurements, the TDS setup is enclosed in a nitrogen-purged box encompassing the THz beam paths, so that the relative humidity is kept below 1.8% and absorption due to water molecules and other THz-active chemicals is strongly reduced.
III Results
Using our 2D THz TDS setup, we investigate the nonlinear signal reflected from a bulk InSb sample, nominally undoped and kept at room temperature. The 350 m-thick sample is oriented with its (100)-cut surface normal to both incident THz pulses. The polarization of the probe air-plasma pulse is along the [010] direction. The optical-rectification-generated pump is oriented along [001].
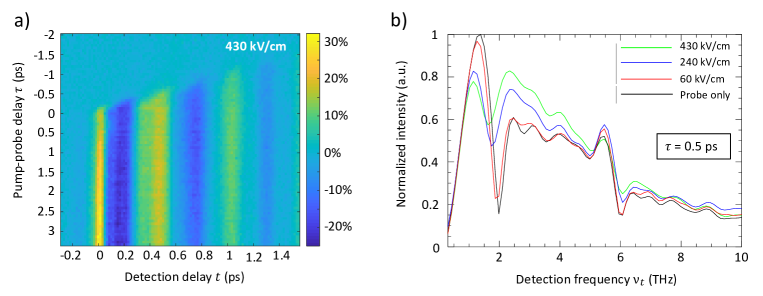
Fig. 1a reports the 2D temporal trace of the reflected nonlinear signal for a pump peak field of 430 kV/cm and a probe peak field of 40 kV/cm. The nonlinear response is measured for pump-probe delays in the range between -2 ps and 3.35 ps, and for detection delays between ps and ps, with time-steps of fs and fs. The 2D trace shows a strong modulation of the nonlinear field along the detection time axis, with alternating sign and a maximum modulation up to % of the plasma field maximum amplitude. Sharp features at ps, 0.22 ps and 0.45 ps indicate that the high pump intensity excites a fast temporal response from the material, which in turn corresponds to a stronger spectral density of the high-frequency components of . This enhancement of the higher frequency components in the material response increases with the applied THz pump peak field, and can be quantified by examining the spectra after the excitation pulse at a fixed pump-probe delay of ps. To show more clearly this effect we define the “nonlinear probe signal”
| (2) |
Fig. 1b shows the one-dimensional Fourier transform of with respect to detection time for a fixed pump-probe delay ps in comparison to the corresponding Fourier transform of the reflected plasma-generated electric field alone , highlighting the difference between the excited material response and its unpumped response. These comparisons are shown for a THz probe peak field of 40 kV/cm and THz pump peak fields of 60 kV/cm, 240 kV/cm and 430 kV/cm. One general trend is a pump-field dependent red-shift of the plasma edge at 2 THz, which manifests in the spectrum as a sharp minimum in the spectral density. At the highest pump peak field this red-shift is approximately 20%. This is accompanied by a broadband increase in the spectral density between 2.5 and 6 THz. Indeed, the increase of the high-frequency components for high THz pump amplitudes extends even beyond the LO phonon resonance at 5.7 THz, which also undergoes an intensity attenuation with increasing pump field.
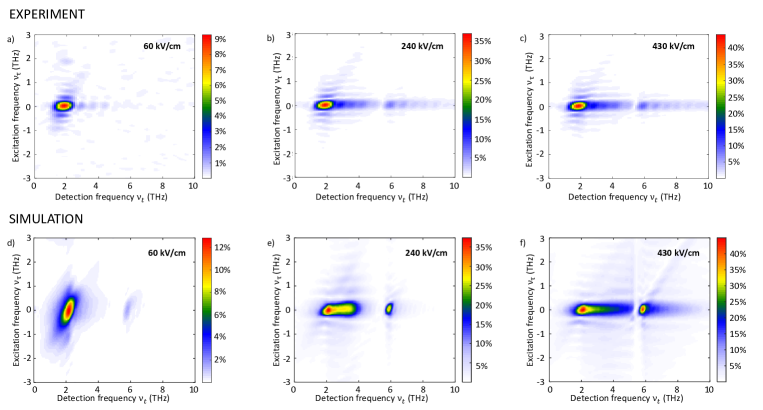
The full 2D TDS traces of the nonlinear signal can be analyzed by performing a direct two-dimensional Fourier transform, so that the modulations of as functions of the pump-probe and detection delays are mapped in their distinct peaks in 2D spectra . Fig. 2a shows such a two-dimensional spectrum of the nonlinear signal, in the case of lowest THz pump peak field intensity (60 kV/cm). The intensity scale is normalized such that a value of 100% corresponds to the maximum value of the amplitude of the 2D Fourier transform of . In this regime, the spectrum reveals a well-defined peak at with an amplitude of 10%. Figs. 2b and 2c report the 2D spectra for THz pump peak fields of 240 kV/cm and 430 kV/cm, where the plasma peak intensity increases to 40% and 50%, respectively. Besides this, an enhancement of the nonlinear spectrum along the horizontal line THz is visible in the range between THz and THz, with a peak clearly appearing at with a relative intensity up to 11% for the maximum THz pump peak of 430 kV/cm. For this peak the value of is very close to that of the LO phonon frequency (5.7 THz).
Qualitatively, the 2D nonlinear signal shows that increasing levels of the THz pump induce a larger broadband modification of the reflectivity spectrum, with an enhanced spectral density immediately above the plasma edge that extends towards the high-frequency sensitivity limit of our ABCD system.
IV Simulation
In order to further interpret the experimental results retrieved with these 2D THz TDS experiments, we developed a finite difference time-domain (FDTD) model of the interaction of the THz pump and probe pulses with the bulk InSb sample to solve Maxwell’s equations in the system [30, 31]. We consider the two cross-polarized THz pulses propagating along the z-direction through the thick sample, with the electronic response of InSb described by a two-dimensional electronic band structure in the x-y plane. For low THz pump fields, the electronic response can be studied in the framework of ballistic motion, with a coherent wave packet driven by the applied THz electric field [26]. In this limit, the equation of motion for the carriers driven by the THz pulse is solved for the in-plane components of the electron wavevector , and the corresponding electron energy is retrieved from the band structure, obtained from a tight-binding model.
This picture changes significantly when higher THz pump pulses are applied. In this case, the strong THz OR pump pulse accelerates the conduction electrons to kinetic energies larger than the energy bandgap, which is meV in room-temperature InSb. While the small energy of THz photons cannot induce direct optical transitions via single-photon processes even in such a low-bandgap semiconductor, the THz-driven electrons reach kinetic energies large enough to induce nonlinear carrier generation and recombination effects [32, 33], sometimes associated with inter-band scattering processes that can significantly alter the electron concentration and motion.[34] Other experimental works have demonstrated that THz pulses can activate the impact ionization mechanism at temperatures below 260 K, with an electron population increase that strongly depends on the THz pump pulse duration and intensity [8, 9].
We expect impact ionization to have a dominant role in the electronic response of InSb when the average carrier kinetic energy becomes larger than the characteristic threshold energy . In this condition, the scattering between accelerated carriers inside the material can promote electrons from the valence band to the conduction band. In a single scattering event, a high-energy conduction electron loses a part of its kinetic energy to create an electron-hole pair. This process can then repeat itself with the new carriers, causing an exponential increase in carrier density as long as the transient THz pulse is sufficient to drive the newly created carriers to kinetic energies above . An in-depth statistical analysis of such process can be performed with Monte Carlo simulations [33, 34], where a large number of single scattering events are simulated to average over all possible combinations of final carrier energies and momenta, and over all carriers in the different bands. An integration of such method using FDTD to reconstruct the propagation of the THz electromagnetic wave in the material in presence of impact ionization would require a time-consuming iteration of Monte Carlo simulations at each time step, with the updated conditions of the electron energy and momentum. This would severely limit the speed of the otherwise rapid FDTD algorithms and likely prove impractical for our purposes. We instead here apply an alternative and efficient FDTD approach based on an approximated treatment of the impact ionization effects, allowing a fast computation of the electromagnetic fields propagating in the InSb sample, as well as the fields reflected by the material.
We consider a one-dimensional spatial mesh along the pulse propagation direction , where our material thickness is divided into discrete segments with length m, surrounded by air layers, while the detection time domain is discretized in steps of duration fs. We define as the initial air-material interface, and set at a boundary condition there a value of the electric field the superposition of the incident OR-generated and plasma-generated THz fields, separated in time by a fixed pump- probe delay . The electric field at and is set to zero. We proceed to solve Maxwell’s equations in the time domain as described in Ref. 26, setting the initial condition of zero fields in the bulk and using the displacement field
| (3) |
where is the permittivity of free space, is the background dielectric constant as determined from an analysis of independent linear THz TDS measurements [26], is the driving field, is the polarization density due to the lowest-frequency infrared-active vibrational mode while is the electronic polarization density arising from free carriers. We determine via the auxiliary partial differential equation
| (4) |
for the initial condition . Here we take THz, THz, and ps, values determined from linear THz TDS measurements [26].
Next we discuss how to determine the free carrier contribution to the polarization density. InSb has a 0.17 eV direct band gap at the point [21]. There is a single lowest energy conduction band, and two highest-energy valence bands that are degenerate at [35]. One of the valence bands has a much higher hole effective mass (by a factor of about 40) than either the conduction band or the other valence band. Due to this high effective mass, in thermal equilibrium the hole population of the heavy-hole band is much higher than that of the light-hole band. Similarly, the main channel for impact ionization is the ionization of heavy holes from collisions with highly energetic conduction band electrons [36]. For these reasons we neglect the light-hole band in our analysis, and identify the main contributions to to come from the dynamics of electrons in the conduction band that occasionally lose energy via ionization of heavy-hole-band electrons. The very large effective mass of the heavy holes relative to the conduction electrons makes it possible to neglect their direct contribution to .
To model the dynamics of the conduction electrons and their contribution to the polarization density, we employ a simplified model similar to that used in Houver et al. [26] but with modifications to include the effects of carrier multiplication due to impact ionization. Rather than attempt to model a statistical distribution of such electrons at a particular depth and time , we instead approximate them as a wavepacket consisting of a local density of electrons all with an identical crystal momentum . The energy per electron is then determined by the conduction band dispersion. We assume the electrons obey a classical equation of motion of the form
| (5) |
where is an intrinsic damping rate determined by the electron energy relaxation time ps in the absence of impact ionization[9], is the elementary charge, and is an effective damping force associated with impact ionization scattering processes, whose explicit form will be derived below. We set the initial condition , which means the electron wavepacket is initially at the bottom of the conduction band at the point. The time-domain polarization density is then determined by
| (6) |
where is the density of conduction-band electrons and is the group velocity of the electrons. As initial conditions we set .
We next need to find a way to determine the carrier density N(z,t), which here is explicitly time-dependent to allow for carrier multiplication. Here we will consider only impact ionization as a mechanism for carrier multiplication. Impact ionization is a process that occurs when the kinetic energy of a carrier exceeds the minimum energy eV required to create an electron-hole pair, resulting in an increase in carrier density and a decrease in the average kinetic energy of the carriers. This leads to an increase in the carrier density which can be modeled in InSb as [9, 32]
| (7) |
where is zero when and is otherwise unity, and eV2s-1 is a material-specific constant computed from the matrix elements of the impact ionization cross section for the case of a parabolic band system.[32] For our simulations we assume an initial value of cm-3, as obtained from linear THz TDS measurements [26].
Concomitant with the increase in carrier density is a decrease in the average energy of the electrons in the conduction band. To leading order this leads to an energy loss contribution
| (8) |
In order to find a suitable form of in Eq. 5, we approximate the dispersion of the conduction band using an analytical formula for the energy dispersion near the valley of the conduction band based on the effective mass approximation:
| (9) |
where eV-1 [37] and the effective mass , and is the mass of a free electron. Using this in combination with Eq. 8 yields
| (10) |
where we also assume that, on average, impact ionization leads to an isotropic redistribution of carrier momentum.
As is apparent from our Eq. 5, the time evolution of the carrier momentum and the associated kinetic energy in our model is controlled by two competing mechanisms: the acceleration of the conduction electron wavepacket by the THz electrical field, and the loss of kinetic energy due to repeated impact ionization scattering events promoting new electrons in the conduction band. Therefore, the carrier energy can repeatedly exceed and then fall below the threshold value while the THz pump pulse propagates, depending on its peak amplitude and temporal shape, in analogy with the approach used in other semiconductors like GaAs [38]. Alternative models for impact ionization describe the THz-driven change in the carrier energy as a step-like change with magnitude equal to the ponderomotive energy [9] of the THz pump pulse at time , followed by a subsequent monotonic decay according to Eq. 7. By their nature these “step-like” models cannot resolve carrier multiplication effects that are extended over the duration of the pulse and are thus not appropriate for our experiment.
After the THz pulse field vanishes and the carrier energy becomes again lower than , impact ionization comes to an end, letting us retrieve the final carrier concentration in all the material slices. To estimate the simulated final carrier multiplication, we average the conduction band density profile over the range to obtain and define the carrier multiplication factor
| (11) |
where is the intrinsic free carrier population of the InSb sample at equilibrium. Considering separately the case when the sample is illuminated by the THz pump only, the THz probe only and both of them with a pump-probe delay , we can simulate the system response at the detection time and retrieve the reflected nonlinear signal .
Figs. 2d, 2e and 2f illustrate the simulated 2D nonlinear spectra obtained for the different THz pump intensities of 60 kV/cm, 240 kV/cm and 430 kV/cm respectively, with a fixed THz probe peak field of 40 kV/cm. For the lowest pump field, Fig. 2d shows a strong peak predicted at for the plasma resonance with relative nonlinear intensity of 12% with respect to the probe spectral maximum, and a much less intense peak at for the LO-phonon excitation. For the larger THz pump peak field of 240 kV/cm shown in Fig. 2e, both these resonances are enhanced, with the plasma peak increasing to a relative value of 37% and showing a broadening to higher frequencies up to , in good qualitative agreement with the experimental data seen in Fig 2b. At the maximum THz pump peak field of 430 kV/cm, Fig. 2f reports a nonlinear signal of about 44% at the plasma resonance, very close to the experimental value of 43%, with a significant broadening that overlaps with the phonon spectral peak and extends up to .
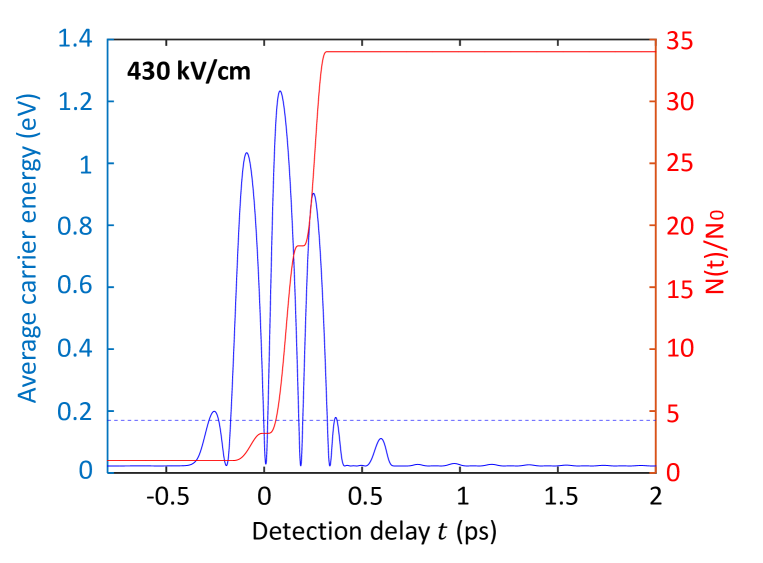
An example of the computed evolution of the carrier concentration and average carrier energy is reported in Fig. 3 for a pump-probe delay of ps, with a THz probe peak field of 40 kV/cm and a THz pump peak field of 430 kV/cm, with the electrons initially at the point. Impact ionization takes place during discrete time intervals when the carrier kinetic energy is above the threshold value, leading to a final multiplication factor of 34. With this intense THz pump polarized along the reciprocal axis of the Brillouin zone, the average kinetic energy reaches a maximum of 1.2 eV, larger than the local minima of the L and X valleys, which are 0.68 eV and 1.0 eV respectively. While most of the electrons are still confined in the valley, intervalley scattering could be possible in this high-pump regime [34, 38], even if it is not implemented in the model. For an intermediate THz pump level of 240 kV/cm, the carrier population grows by approximately 4 times once the THz pump pulse has passed and excited them up to a kinetic energy of approximately 0.9 eV. Conversely, the lowest THz pump amplitude of 60 kV/cm induces a carrier population increase by only 1%, indicating a minimal contribution of impact ionization due to very small oscillation of the electron wavepacket around the point.
V Discussion
Besides these numerical calculations of the 2D nonlinear spectra, we take advantage of the 2D THz TDS scheme to measure the evolution of the nonlinear spectra in the detection frequency domain as a function of the variable pump-probe delays , in order to experimentally evaluate the dynamics of the band population under high THz pump fields and its timescales. We report the experimental results in Figs. 4a, 4b, 4c, showing the associated spectrograms for selected pump levels of 60 kV/cm, 240 kV/cm and 430 kV/cm, respectively. We first note the variation in the intensity of the plasma resonance in the spectral region labelled A, i.e. for , at ps for increasing strength of the THz excitation. The lowest THz pump field induces an excitation of the plasma resonance that has an intensity maximum shortly after ps, followed by a fast decay down by 40% around ps. This plasma peak intensity reduction with time can be fitted by a decaying exponential, which provides a time constant of ps. Conversely, this decay of the plasma peak intensity is not visible for higher THz pump fields, which actually induce an almost stable nonlinear spectral response of InSb in the spectral range A after ps. An intermediate THz pump level of 100 kV/cm induces a slower decay, with a characteristic time of ps, while for excitation pulses with peak field above 115 kV/cm the traces are can be fitted with constant line in our measured range for ps.
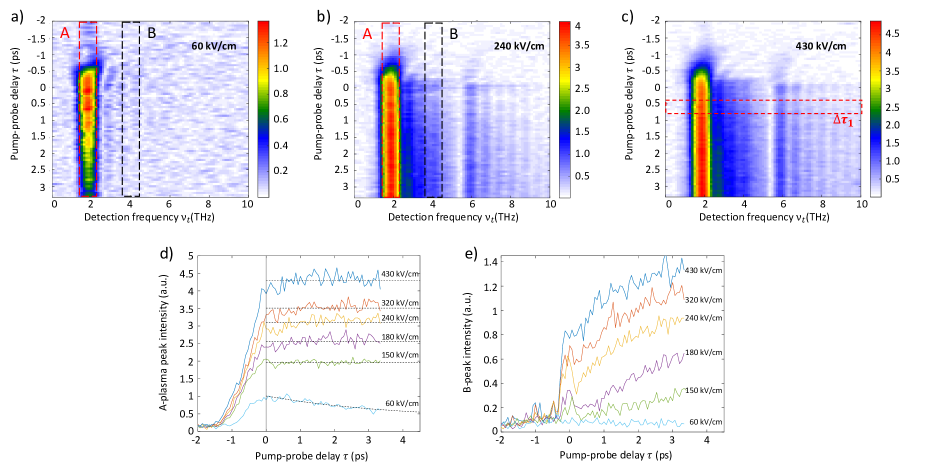
The nonlinear spectrograms also reveal the progressive enhancement of the high-frequency tail of the signal for later pump-probe delays and increasing THz pump peak fields. Besides the increased spectral intensity near the 5.7 THz LO phonon frequency, the evolution of the broadening of the plasma peak can be tracked in a frequency interval where no intrinsic resonances of InSb are present. Considering the detection frequency range B between 3.8 THz and 4.2 THz (see Fig. 4a), we can average the spectral intensity and retrieve its evolution as a function of the pump-probe delay. Fig. 4e reports the time-dependence for THz pump levels between 60 kV/cm and 430 kV/cm, showing remarkable differences with respect to the behavior of the intensity of the plasma resonance at THz shown in Fig. 4d. While no remarkable time evolution is present for the lowest THz pump intensity, the traces averaged around THz at higher pump levels show two different features respectively around ps and for ps. The earliest feature appears as a sharp peak in correspondence with the arrival of the THz pulse on the material, decreasing again within 0.3 ps after most of the pulse energy has been delivered. Higher THz pump levels drive the reflected nonlinear signal at 4 THz to grow again for pump-probe delays ps.
This temporal analysis of the high-frequency components around THz of the nonlinear signal reveals the coexistence of two distinct dynamics over different timescales, in agreement with reports on angle-resolved photoemission experiments done with a laser pump energy of the order of 1 eV [39]. The faster dynamics between ps and ps are associated to the THz pump-driven electron multiplication and acceleration in the valley of the conduction band, while the slower dynamics visible for ps correlates with increasing contributions from intervalley scattering and thermalization of hot electrons. Indeed, the associated long-term rise of the high-frequency tail is visible for THz pump peak fields above 150 kV/cm, which according to our model accelerate the electrons in the valley to energies increasingly larger than 0.6 eV, enabling a growing intervalley scattering with the L valley. It has been reported that, in turn, such hot electrons in the L valley induce phonon-assisted impact ionization, further enhancing electron populations near the minimum of the conduction band in the valley [34, 38]. In the case of the largest THz peak field of 430 kV/cm, the two regimes are not even clearly distinguishable due to a temporal overlap of the fast and slow impact ionization regimes, most likely connected to the very high energies reached by the electrons that rapidly enable a very efficient intervalley scattering and a faster secondary impact ionization. This separate analysis of the evolution in of the different spectral components around the plasma resonance ( THz) and in the high-frequency tail (for example, THz) for different THz pump levels allows us to distinguish the fast impact ionization regime in the valley and the contributions of a slower impact ionization associated to a complex intervalley dynamics, active mainly for THz peak intensities above 150 kV/cm.
In order to quantitatively assess the fast carrier multiplication effect in InSb from these experimental data, we investigate more in detail the nonlinear response to directly retrieve the carrier multiplication factor from the experimental measurements in different THz pump conditions. To do this we focus on positive values of that are sufficiently large that the overlap of the two THz pulses is minimal, but are also sufficiently small that the relaxation of the carrier density back to equilibrium is negligible. Inspection of panels a,b and c of Fig. 4 suggests that an appropriate range of is between ps and ps. We then assume that the weaker probe pulse interacts with the sample in a linear optics approximation, with an isotropic reflectivity that is quasi-statically modified by the stronger pump. In this approximation the frequency-dependent reflectivity at normal incidence is
| (12) |
where the index indicates the state of the material: in equilibrium (with the OR pump pulse blocked) and for . Here the permittivity can be approximated using a Drude-Lorentz model [26]
| (13) |
where we assume that , , and are constants. In the Drude-Lorentz model the carrier density is proportional to (assuming constant effective mass), and so the carrier multiplication factor can be estimated as
| (14) |
This implies that we can estimate the carrier multiplication factor by measuring the value of the excited-state plasma frequency .
To extract a value of from our data, we first define
| (15) |
as the average reflected nonlinear probe field over the interval . Let be the Fourier transform of . In our approximation of a quasi-equilibrium transient state and linear probe interaction,
| (16) |
and
| (17) |
where and are the Fourier transforms of the plasma-generated probe pulse electric field incident on and reflected from the sample, respectively. For fitting to the experimental data we define the relative change in the magnitude of the probe spectrum as
| (18) |
Fig. 5a shows the behavior of for various values of the peak field, as well as fits from the Drude-Lorentz model performed by optimizing the values of and . The are marked features at and around 2 THz and 6 THz are reproduced by the model. As expected, the parameters for the equilibrium free carriers and were highly consistent for all data sets and give average values of THz and ps. The fits shown in Fig. 5 have these equilibrium values fixed at these values for all data sets, but with the quasi-equilibrium parameters still allowed to vary and . The fitted carrier relaxation time lies in the range 0.8 ps and 1.6 ps for THz peak fields below 200 kV/cm, essentially equivalent to the equilibrium value. At higher fields the fitted scattering time dramatically decreases, reaching a minimum of fs for the strongest THz pump intensity. This is compatible with the timescales of intervalley scattering between the L and valleys as well as electron-hole recombination effects [39]. This suggests the coexistence of impact ionization and inter-valley scattering for such high THz pump levels, which is compatible with the electron kinetic energy computed with our simulations.
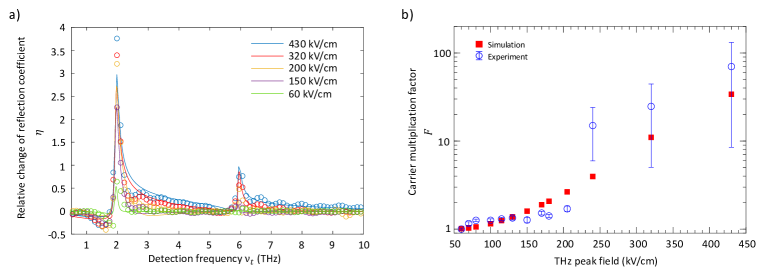
The fitted values of the excited-state plasma frequency can be directly converted to estimates of the carrier multiplication factor using Eq. 14. The results are shown in Fig. 5b as a function of the THz pump peak field. At low pump fields (below 210 kV) the value of is modest, increasing by a factor of less than 2. For higher fields the quality of the fit is lower, leading to larger uncertainties in but nonetheless trending to much larger values, with a value of at the maximum field strength of 430 kV/cm. We can compare these experimental results with the carrier concentration increase predicted by the simulations, averaged over the same pump-probe delay interval. As shown in Fig 5b (red dots), the simulated values are in good agreement with the experimental trend for different THz pump levels. We can deduce from this that our simulation framework provides a reasonable approximation of the InSb response in presence of significant THz-driven fast impact ionization contributions for THz pump peak fields between 60 kV/cm and 430 kV/cm.
Although the agreement here is limited by fit uncertainties, in principle our prediction of might be improved be relaxing some of the assumptions used in the simulation. According to our model, conduction carriers accelerated by fields above 150 kV/cm fields in the valley have enough energy to undergo intervalley scattering to the L valley (600 meV), while electron energies larger than 1 eV are reached for pump fields of 320 kV/cm and more, enabling scattering to the X valley [34, 38]. This would also influence the electron energy relaxation time , which was in our model kept constant for simplicity. These dynamic effects could be accounted for with additional sets of coupled rate equations and Monte-Carlo modeling, at the cost of increased computation complexity and time. Moreover, the formula for the experimental assessment of the plasma frequency is based on the effective mass approximation, which is not very accurate when the electrons populate regions of the conduction band with strong non-parabolic features and valleys away from the point.
VI Conclusion
We have shown using 2D THz TDS that intense ultrafast THz pump pulses between 60 kV/cm and 430 kV/cm on InSb induce significant carrier multiplication within the first picoseconds. Broadband THz probe pulses are sensitive not only to the resonances associated with the intrinsic plasma and phonon frequencies, but also to changes in the conduction band population. We have also introduced a computationally efficient model for this interaction that reproduces the main features of the experiment, incorporating a macroscopic treatment for impact ionization in addition to previously developed methods for treating ballistic transport.
More specifically, the simulated 2D nonlinear spectra show good agreement with the experimental results, reporting comparable spectral intensity of the main plasma resonance peak, up to % of the probe spectrum maximum for the largest THz pump peak field of 430 kV/cm. The model also predicts the enhancement of the high-frequency components of the 2D nonlinear spectra, deriving from the modulation of the plasma frequency induced by the different THz pump level. The analysis of the nonlinear spectra for different pump-probe delays highlights the presence of two timescales in the InSb response evolution, associated with fast impact ionization induced directly by the THz pump pulse and with an additional slow impact ionization effect that becomes dominant for ps approximately.
Moreover, the increase of the conduction band population is quantitatively assessed from the fit of the variation of the nonlinear reflection coefficient induced by the different THz pump levels. We retrieve a maximum carrier multiplication factor , in good agreement with the fast impact ionization simulation, which further grows when considering later pump-probe intervals with increasing contributions from the slow impact ionization.
Overall, the combination of our 2D THz experiments and the developed hybrid model gives access to the relevant ultrafast timescales and magnitude of the impact ionization process in InSb for a broad range of THz pump conditions. This detailed insight into the ultrafast dynamics at the onset of impact ionization process helps to understand and predict the operation conditions under which InSb-based devices can undergo a transition between the purely ballistic transport and the carrier multiplication regime. Moreover, the presented numerical and experimental methods are a promising platform for the investigation of highly nonlinear effects in the electron dynamics not only in conventional low-bandgap semiconductors, but also in gapless materials possessing exotic band structures like topological semimetals, where impact ionization plays a relevant role already at very low incident THz fields.
Acknowledgments
We acknowledge Georg Winkler and Quansheng Wu, formerly at the Institute for Theoretical Physics and Station Q at ETH Zurich, for the band structure calculations used in this work. This research was supported by the NCCR MUST, funded by the Swiss National Science Foundation. S. B. acknowledges that this project has received funding from European Union’s Horizon 2020 under MCSA Grant No. 801459, FP-RESOMUS. E. A. acknowledges support from the Swiss National Science Foundation through Ambizione Grant PZ00P2 179691.
References
- Tonouchi [2007] M. Tonouchi, Cutting-edge terahertz technology, Nature Photonics 1, 97 (2007).
- Williams [2006] G. P. Williams, Filling the THz gap—high power sources and applications, Reports on Progress in Physics 69, 301 (2006).
- Kuehn et al. [2010a] W. Kuehn, P. Gaal, K. Reimann, M. Woerner, T. Elsaesser, and R. Hey, Coherent Ballistic Motion of Electrons in a Periodic Potential, Physical Review Letters 104, 146602 (2010a).
- Blanchard et al. [2011] F. Blanchard, D. Golde, F. H. Su, L. Razzari, G. Sharma, R. Morandotti, T. Ozaki, M. Reid, M. Kira, S. W. Koch, and F. A. Hegmann, Effective Mass Anisotropy of Hot Electrons in Nonparabolic Conduction Bands of n-Doped InGaAs Films Using Ultrafast Terahertz Pump-Probe Techniques, Physical Review Letters 107, 107401 (2011).
- Kuehn et al. [2010b] W. Kuehn, P. Gaal, K. Reimann, M. Woerner, T. Elsaesser, and R. Hey, Terahertz-induced interband tunneling of electrons in GaAs, Physical Review B 82, 075204 (2010b).
- Hebling et al. [2010] J. Hebling, M. C. Hoffmann, H. Y. Hwang, K.-L. Yeh, and K. A. Nelson, Observation of nonequilibrium carrier distribution in Ge, Si, and GaAs by terahertz pump–terahertz probe measurements, Physical Review B 81, 035201 (2010).
- Sharma et al. [2010] G. Sharma, L. Razzari, F. H. Su, F. Blanchard, A. Ayesheshim, T. L. Cocker, L. V. Titova, H. C. Bandulet, T. Ozaki, J.-C. Kieffer, R. Morandotti, M. Reid, and F. A. Hegmann, Time-Resolved Terahertz Spectroscopy of Free Carrier Nonlinear Dynamics in Semiconductors, IEEE Photonics Journal 2, 578 (2010).
- Wen et al. [2008] H. Wen, M. Wiczer, and A. M. Lindenberg, Ultrafast electron cascades in semiconductors driven by intense femtosecond terahertz pulses, Physical Review B 78, 125203 (2008).
- Hoffmann et al. [2009] M. C. Hoffmann, J. Hebling, H. Y. Hwang, K.-L. Yeh, and K. A. Nelson, Impact ionization in InSb probed by terahertz pump—terahertz probe spectroscopy, Physical Review B 79, 161201 (2009).
- Woerner et al. [2013] M. Woerner, W. Kuehn, P. Bowlan, K. Reimann, and T. Elsaesser, Ultrafast two-dimensional terahertz spectroscopy of elementary excitations in solids, New Journal of Physics 15, 025039 (2013).
- Kuehn et al. [2011] W. Kuehn, K. Reimann, M. Woerner, T. Elsaesser, R. Hey, and U. Schade, Strong Correlation of Electronic and Lattice Excitations in GaAs/AlGaAs Semiconductor Quantum Wells Revealed by Two-Dimensional Terahertz Spectroscopy, Physical Review Letters 107, 067401 (2011).
- Somma et al. [2016] C. Somma, G. Folpini, K. Reimann, M. Woerner, and T. Elsaesser, Two-Phonon Quantum Coherences in Indium Antimonide Studied by Nonlinear Two-Dimensional Terahertz Spectroscopy, Physical Review Letters 116, 177401 (2016).
- Pal et al. [2021] S. Pal, N. Strkalj, C.-J. Yang, M. C. Weber, M. Trassin, M. Woerner, and M. Fiebig, Origin of Terahertz Soft-Mode Nonlinearities in Ferroelectric Perovskites, Physical Review X 11, 021023 (2021).
- Ting et al. [2019] D. Z. Ting, A. Soibel, A. Khoshakhlagh, S. A. Keo, S. B. Rafol, A. M. Fisher, B. J. Pepper, E. M. Luong, C. J. Hill, and S. D. Gunapala, Advances in III-V semiconductor infrared absorbers and detectors, Infrared Physics & Technology 97, 210 (2019).
- Kanno et al. [2007] I. Kanno, S. Hishiki, Y. Kogetsu, T. Nakamura, and M. Katagiri, Fast response of InSb Schottky detector, Review of Scientific Instruments 78, 056103 (2007).
- Ashley et al. [1995] T. Ashley, A. B. Dean, C. T. Elliott, G. J. Pryce, A. D. Johnson, and H. Willis, Uncooled high‐speed InSb field‐effect transistors, Applied Physics Letters 66, 481 (1995).
- Ashley et al. [2007] T. Ashley, L. Buckle, S. Datta, M. T. Emeny, D. G. Hayes, K. P. Hilton, R. Jefferies, T. Martin, T. J. Phillips, D. J. Wallis, P. J. Wilding, and R. Chau, Heterogeneous InSb quantum well transistors on silicon for ultra-high speed, low power logic applications, Electronics Letters 43, 777 (2007).
- Nilsson et al. [2010] H. A. Nilsson, P. Caroff, C. Thelander, E. Lind, O. Karlström, and L.-E. Wernersson, Temperature dependent properties of InSb and InAs nanowire field-effect transistors, Applied Physics Letters 96, 153505 (2010).
- Mata et al. [2016] M. d. l. Mata, R. Leturcq, S. R. Plissard, C. Rolland, C. Magén, J. Arbiol, and P. Caroff, Twin-Induced InSb Nanosails: A Convenient High Mobility Quantum System, Nano Letters 16, 825 (2016).
- Litvinenko et al. [2008] K. L. Litvinenko, L. Nikzad, C. R. Pidgeon, J. Allam, L. F. Cohen, T. Ashley, M. Emeny, W. Zawadzki, and B. N. Murdin, Temperature dependence of the electron Landé g factor in InSb and GaAs, Physical Review B 77, 033204 (2008).
- Littler and Seiler [1985] C. L. Littler and D. G. Seiler, Temperature dependence of the energy gap of InSb using nonlinear optical techniques, Applied Physics Letters 46, 986 (1985).
- Žutić et al. [2004] I. Žutić, J. Fabian, and S. D. Sarma, Spintronics: Fundamentals and applications, Reviews of Modern Physics 76, 323 (2004).
- Chochol et al. [2016] J. Chochol, K. Postava, M. Čada, M. Vanwolleghem, L. Halagacka, J.-F. Lampin, and J. Pištora, Magneto-optical properties of InSb for terahertz applications, AIP Advances 6, 115021 (2016).
- Ke et al. [2019] C. T. Ke, C. M. Moehle, F. K. d. Vries, C. Thomas, S. Metti, C. R. Guinn, R. Kallaher, M. Lodari, G. Scappucci, T. Wang, R. E. Diaz, G. C. Gardner, M. J. Manfra, and S. Goswami, Ballistic superconductivity and tunable pi–junctions in InSb quantum wells, Nature Communications 10, 3764 (2019).
- Salimian et al. [2021] S. Salimian, M. Carrega, I. Verma, V. Zannier, M. P. Nowak, F. Beltram, L. Sorba, and S. Heun, Gate-controlled supercurrent in ballistic InSb nanoflag Josephson junctions, Applied Physics Letters 119, 214004 (2021).
- Houver et al. [2019] S. Houver, L. Huber, M. Savoini, E. Abreu, and S. L. Johnson, 2D THz spectroscopic investigation of ballistic conduction-band electron dynamics in InSb, Optics Express 27, 10854 (2019).
- Kress et al. [2004] M. Kress, T. Löffler, S. Eden, M. Thomson, and H. G. Roskos, Terahertz-pulse generation by photoionization of air with laser pulses composed of both fundamental and second-harmonic waves, Optics Letters 29, 1120 (2004).
- Yang et al. [2007] Z. Yang, L. Mutter, M. Stillhart, B. Ruiz, S. Aravazhi, M. Jazbinsek, A. Schneider, V. Gramlich, and P. Günter, Large‐Size Bulk and Thin‐Film Stilbazolium‐Salt Single Crystals for Nonlinear Optics and THz Generation, Advanced Functional Materials 17, 2018 (2007).
- Dai et al. [2006] J. Dai, X. Xie, and X.-C. Zhang, Detection of Broadband Terahertz Waves with a Laser-Induced Plasma in Gases, Physical Review Letters 97, 103903 (2006).
- Yee [1966] K. Yee, Numerical solution of initial boundary value problems involving maxwell’s equations in isotropic media, IEEE Transactions on Antennas and Propagation 14, 302 (1966).
- Yu et al. [2017] S. Yu, K. H. Heffernan, and D. Talbayev, Beyond the effective mass approximation: A predictive theory of the nonlinear optical response of conduction electrons, Physical Review B 95, 125201 (2017).
- Devreese et al. [1982] J. T. Devreese, R. G. v. Welzenis, and R. P. Evrard, Impact ionisation probability in InSb, Applied Physics A 29, 125 (1982).
- Ašmontas et al. [2013] S. Ašmontas, R. Raguotis, and S. Bumelienė, Monte Carlo calculations of the electron impact ionization in n-type InSb crystal, Semiconductor Science and Technology 28, 025019 (2013).
- Ašmontas et al. [2020] S. Ašmontas, S. Bumelienė, J. Gradauskas, R. Raguotis, and A. Sužiedėlis, Impact ionization and intervalley electron scattering in InSb and InAs induced by a single terahertz pulse, Scientific Reports 10, 10580 (2020).
- Kim et al. [2009] Y.-S. Kim, K. Hummer, and G. Kresse, Accurate band structures and effective masses for InP, InAs, and InSb using hybrid functionals, Physical Review B 80, 035203 (2009).
- Kane [1957] E. O. Kane, Band structure of indium antimonide, Journal of Physics and Chemistry of Solids 1, 249 (1957).
- Zawadzki [1974] W. Zawadzki, Electron transport phenomena in small-gap semiconductors, Advances in Physics 23, 435 (1974).
- Hirori et al. [2011] H. Hirori, K. Shinokita, M. Shirai, S. Tani, Y. Kadoya, and K. Tanaka, Extraordinary carrier multiplication gated by a picosecond electric field pulse, Nature Communications 2, 594 (2011).
- Tanimura et al. [2015] H. Tanimura, J. Kanasaki, and K. Tanimura, Ultrafast scattering processes of hot electrons in InSb studied by time- and angle-resolved photoemission spectroscopy, Physical Review B 91, 045201 (2015).