Predictive Data Calibration for Linear Correlation Significance Testing
k.patil@fz-juelich.de
&
s.eickhoff@fz-juelich.de
&
r.langner@fz-juelich.de
1Institute of Neuroscience and Medicine (INM-7: Brain and Behaviour)
Forschungszentrum Jülich
52425 Jülich, Germany
2Institute of Systems Neuroscience
Medical Faculty, Heinrich Heine University
40225 Düsseldorf, Germany
Abstract
Inferring linear relationships lies at the heart of many empirical investigations. A measure of linear dependence should correctly evaluate the strength of the relationship as well as qualify whether it is meaningful for the population. Pearson’s correlation coefficient (PCC), the de-facto measure for bivariate relationships, is known to lack in both regards. The estimated strength maybe wrong due to limited sample size, and nonnormality of data. In the context of statistical significance testing, erroneous interpretation of a -value as posterior probability leads to Type I errors—a general issue with significance testing that extends to PCC. Such errors are exacerbated when testing multiple hypotheses simultaneously. To tackle these issues, we propose a machine-learning-based predictive data calibration method which essentially conditions the data samples on the expected linear relationship. Calculating PCC using calibrated data yields a calibrated -value that can be interpreted as posterior probability together with a calibrated estimate, a desired outcome not provided by other methods. Furthermore, the ensuing independent interpretation of each test might eliminate the need for multiple testing correction. We provide empirical evidence favouring the proposed method using several simulations and application to real-world data.
Keywords machine-learning statistics linear correlation -value calibration data calibration multiple testing brain ageing brain-behaviour
1 Introduction
Inferring linear relation between two observed variables is a ubiquitous task in empirical sciences. The century old Pearson’s correlation coefficient (PCC) (Pearson, 1896) has become the de-facto measure to estimate bivariate linear relationships. A PCC test provides an estimate of the strength and direction of the relationship together with a -value. In the framework of Null Hypothesis Significance Testing (NHST), this -value quantifies the uncertainty associated with observing a linear association () when the null hypothesis () of no association were true. A -value lower than a predefined point-wise significance level (usually set to ) is taken as evidence for rejecting and is declared to be true. This significance testing procedure is widely adopted due to its ease of application and domain-independent nature.
PCC, however, is not perfect and both the estimated strength and -value suffer from shortcomings. First, violation of assumptions behind PCC, such as presence of outliers and nornormality of data, leads to mischaracterization of the linear dependence (Pernet et al., 2013; Bishara and Hittner, 2015; Armstrong, 2019). Second, erroneous interpretation of a -value as the probability of being true leads to inflated Type I errors and has been criticised of its interpretation and reliability (Goodman, 2008; Gao, 2020), and blamed for the replication/reproducibility crisis (Nuzzo, 2014; Halsey et al., 2015; Anderson, 2020). In a wider context there are calls to abandon NHST altogether (Szucs and Ioannidis, 2017; Häggström, 2017; Cumming, 2014). An associated issue is that of multiple testing (also called multiplicity) which leads to a surge in the Type I error rate (increased false positives) when multiple tests are performed simultaneously. With large-scale data measuring thousands or even millions of variables becoming common owing to the advancements in data collection techniques and falling costs, multiple testing has become a common concern.
To alleviate the issue of incorrect estimation of the value, there have been suggestions of alternative or specialized methods that exhibit robustness (Pernet et al., 2013; Bishara and Hittner, 2015; Wilcox, 2012). However, such methods are often designed for handling specific issues, for instance robustness to outliers using skipped-correlations (Wilcox, 2015). Use of alternate methods, rank-based Spearman’s correlation can be used which is less affected by outliers but measures monotonic dependence and not linear dependence as desired here. Other options include performing non-linear transformation of the data, e.g. Box-Cox or rankit (Bishara and Hittner, 2015).
Regarding the (mis)use of -values, their reflected use has been advised with a caution that any interpretation alternative will also be susceptible to similar fallacies (Leek and Peng, 2015; Nickerson, 2000; Gibson, 2021; Lakens, 2021) (also see statement from the American Statistical Association (Wasserstein and Lazar, 2016)). It has been argued that point estimates can provide valuable insights and are an essential part of science for testing a claim (Mayo and Hand, 2022). A possible remedy is "making values work harder" (Matthews, 2021) (cf. March 2019 special issue of The American Statistician (Wasserstein et al., 2019)), e.g. estimating posterior probabilities by value calibration (Sellke et al., 2001; Shi and Yin, 2020; Bickel, 2021a; Cabras and Castellanos, 2017; Gao, 2020; Rafi and Greenland, 2020). After this calibration the type I error probability can be interpreted as as the probability that the null hypothesis is true. As value calibration is easy to compute and interpret it provides an attractive way to counter misinterpretation of values.
To deal with the multiple testing, correction to the -values arising from the individual tests is commonly employed. Several correction methods have been proposed which rely on the number of tests and/or the distribution of -values. These methods differ in their strictness in penalizing -values reflecting the trade-off between false positives and false negatives, e.g. family-wise error rate (FWER) correction provides the strictest control while false discovery rate (FDR) control is more lenient. However, any -value correction method is not without issues and choosing a correction method is usually left to the users. As the correction is often proportional to the number of tests, the power to identify an effect decreases with the number of tests. Defining a domain for control is not straightforward, e.g. whether to exert control over data used within an experiment or an entire discipline (Trafimow and Earp, 2017). Dependencies between the tests (usually not known a priori) require special consideration as ignoring them may increase false negatives (Leek and Storey, 2008; Wilson, 2019). Furthermore "big data" with number of tests ranging in hundreds of thousands or even millions, even lenient correction can lose power. General methods like local FDR (Efron et al., 2001) as well as domain-specific methods with higher power such as threshold free cluster enhancement (TFCE) (Smith and Nichols, 2009) for MRI images and independent hypothesis weighting (IHW) for genomics (Ignatiadis et al., 2016) have been developed. However, specialized methods can not be immediately applied to other fields. Taken together, the issues related to data assumptions, -value interpretation and multiple testing make the trivial sounding task of inferring linear relationships rather challenging and new methods that can solve one or more of the issues are in demand.
If a hypothesis testing method could provide a -value that can be interpreted as the probability of the null hypothesis being true and in isolation, i.e. independent of other tests, then the above mentioned issues would be resolved. Specifically, such a test (1) would not need multiple testing correction, and (2) it will not be susceptible to dependencies between the hypotheses. A posterior probability estimate can indeed serve this purpose . Here we take steps in this direction and propose a method which provides an alternative way to perform large scale statistical tests without having to do multiple testing corrections. The proposed correction-free method rests on the rationale that if a test can be declared generally significant then the associated -value can be used directly for inference and does not require correction. By generally we mean if the test is repeated on other samples of data the it would yield a similar result. This implicit generalizability makes such the test independent of other tests and renders correction unnecessary, paving the way towards high-throughput analysis by identifying as many significant effects as possible, while producing relatively few false positives. In this article we propose a new machine-learning-based method for predictive data calibration.
We propose a new method where each test is treated independently by combining the notion and estimation of generalization as defined in the machine-learning field with inferential statistics. Here, we adopt the cross-validation procedure aimed at estimating the out-of-sample (i.e. generalization) prediction performance based on a finite sample. This is achieved by training a predictive model (e.g. linear regression) on a subset of the data and using the remaining subset to evaluate the prediction performance. The out-of-sample predictions then provide a generalized representation of the predicted variable. Thus, performing the statistical tests on the variables in their generalized forms provides an inference mechanism which can be interpreted as being independent of the other tests. In the proposed data calibration method dcal we replace each value with its out-of-sample prediction. The proposed method reduces the power of the test in a data-driven way solely based on the data of a particular test as opposed to traditional multiple testing correction where the correction is typically dependent on the number of tests. We claim that the proposed approach captures the true relationship and hence provides protection against the multiple comparison problem. Indeed we empirically show this to be the case by performing numerical experiments on simulated and real-world data.
Predictive Data Calibration: Proposal and Design
Our proposed method, which we call data calibration (dcal), relies on estimating generalizable information. dcal works by calibrating the data to the alternative hypothesis under test (following the convention that the default hypothesis is the null of no relationship) using out-of-sample prediction (Hastie et al., 2009). In effect, it regularizes the data such that the samples are penalized by its deviation–i.e. the prediction error it incurs–w.r.t. the hypothesis. To this end, dcal uses a learning algorithm to replace each sample by their out-of-sample (OOS) prediction, in effect creating new data calibrated to the alternative hypothesis and then applies the classical test to this new calibrated data.
Here we focus on linear correlation and propose an alternative to the classical linear correlation test. Linear correlation is calculated for two random variables and which provides a correlation coefficient and a -value . This -value is then used as the basis for NHST.
For linear correlation, linear regression (LR) fitted using the ordinary least squares (OLS) is the natural choice as a learning algorithm. Thus for each of the two variables we calculate mutual out-of-sample predictions for each value, e.g. using the leave-one-out (LOO) cross-validation procedure:
| (1) |
where indicates a subset without the sample and the corresponding is a model induced using this subset. In words, we induce a linear regression function by leaving out a particular instance and estimate it’s value by predicting it. We then calculate the linear correlation between the predicted variables which provides the dcal version of the linear correlation test.
| (2) |
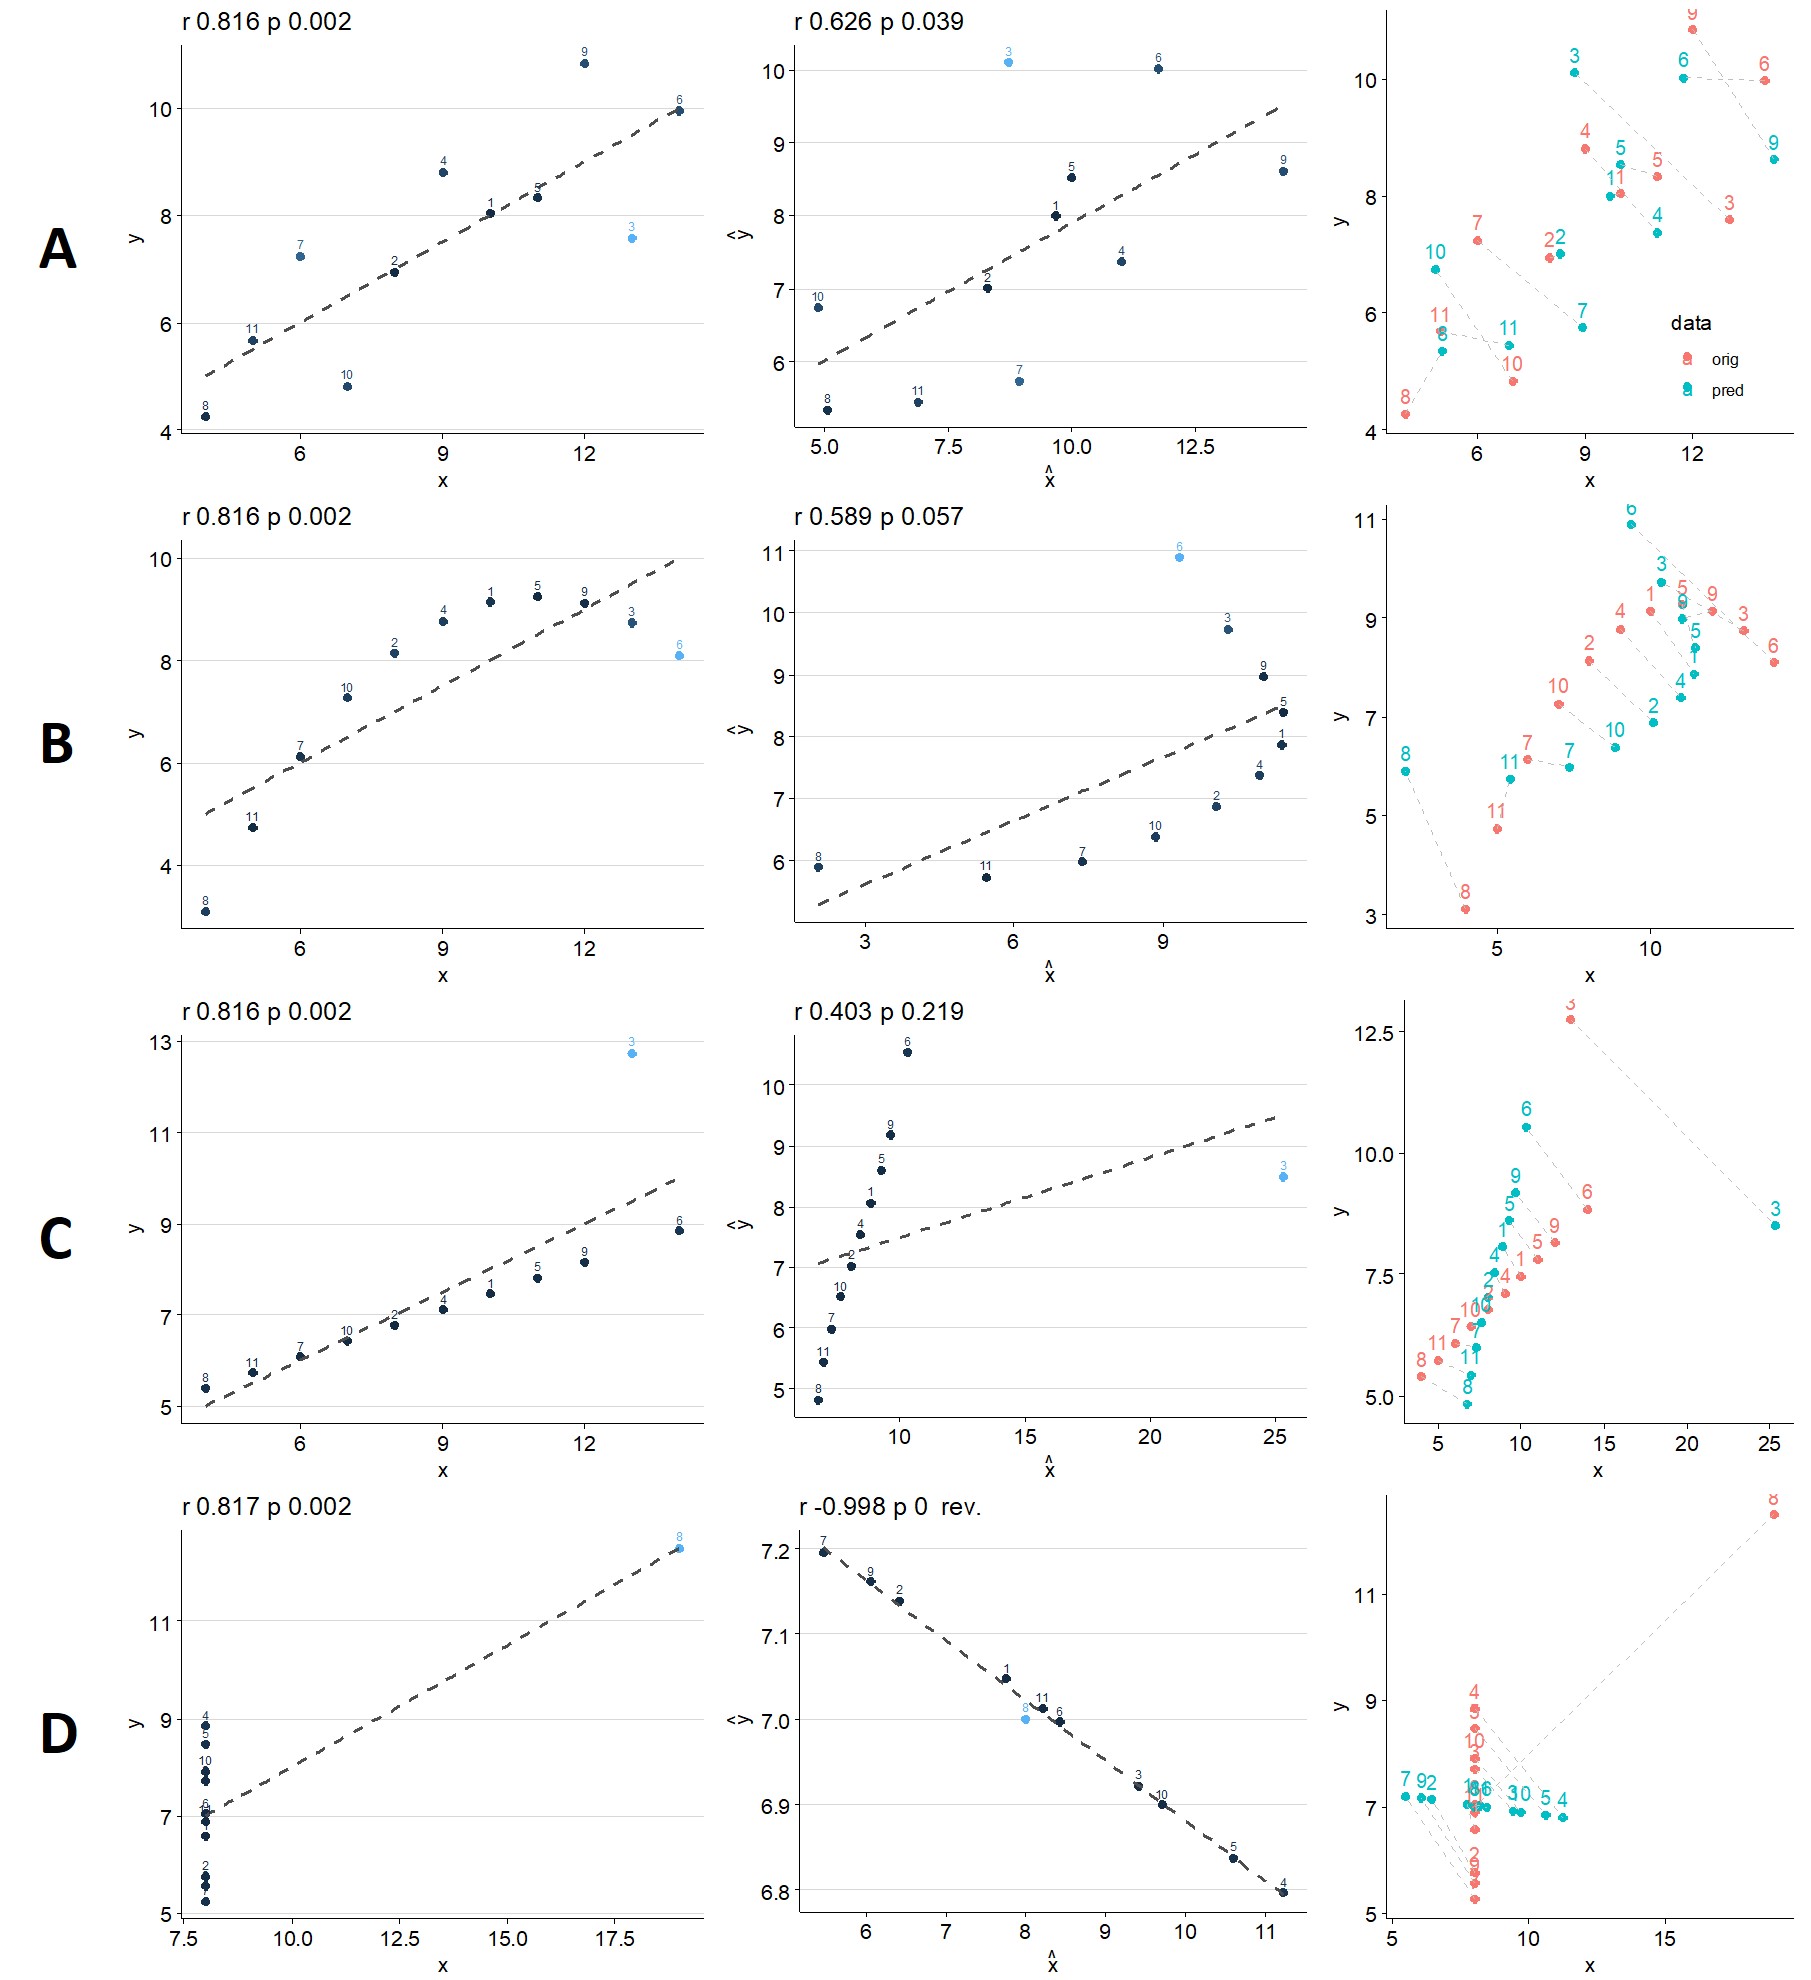
An illustrative and intuitive way to showcase the usefulness of the proposed method is using the Anscombe’s quartet (Anscombe, 1973). This dataset was created to demonstrate the pitfalls when using the linear correlation and consists of four pairs of variables with identical first order statistical properties and the same linear correlation but the actual nature of relationship varies widely. By design, only the first variable pair is valid for linear correlation while the other three violate the assumptions of linear correlation. The established -value calibration methods fail to detect the three invalid datasets as all datasets show a -value which after application of the calibration method proposed by Selke and colleagues (Sellke et al., 2001) will yield a calibrated -value of . Similarly, Bayesian correlation is also not immune to these pitfalls (van Doorn et al., 2020) while robust correlation analysis with possible manual visual checks can revel some of the issues (Pernet et al., 2013). Overall, although simplistic, analysis of the Anscombe’s quartet revealed several illuminating findings (Fig. 1).
- •
The dcal results were different for the four datasets while, as expected, they were the same for the classical correlation tests.
- •
For datasets A-C, the dcal correlation values were lower and the values values higher than their classical counterparts.
- •
The values decreased and the values increased from A to C as the violations by the data become more severe.
- •
Datasets B and C did not result in a significant dcal test with the traditionally used threshold of (B would be significant at a trend-level ).
- •
For dataset D, the sign of the dcal correlation reversed with a higher and a lower value.
[respect all]anscombe_r.csv
[respect all]anscombe_p.csv
This shows that data calibration, i.e. replacing each sample with its out-of-sample prediction, reveals the underlying predictive information. When calibrated using the linear regression model, the predicted values are better suited for testing the linear relationship. Specifically, it identifies the true relationship (Fig. 1, A) and also refutes the false ones (Fig. 1, B-C). This suggests that the dcal test can reveal the true linear relationship between the variables and also qualify its statistical significance.
The Anscombe’s dataset D exposes a critical aspect in the dcal-based test by providing a counter-intuitive result. This is because of a pitfall in the cross-validation procedure which artificially creates negative correlation when there lack of predictability. To the best of out knowledge, this issue has not been part of a publication but has been discussed in on-line forums: Perils of LOO corssvalidation111http://www.russpoldrack.org/2012/12/the-perils-of-leave-one-out.html,222https://not2hastie.tumblr.com/post/56630997146/i-must-confess-i-was-surprised-by-the-negative. The counter-intuitive result on the dataset D clarifies that this issue must be tackled while designing the dcal correlation test. Here we added a simple heuristic that enforces that the original correlation sign is retained after the dcal test.
Based on eq. (1), eq. (2) and the insights from the Anscombe’s quartet, we devised an easy to implement algorithm for dcal correlation test (Algo. 1).
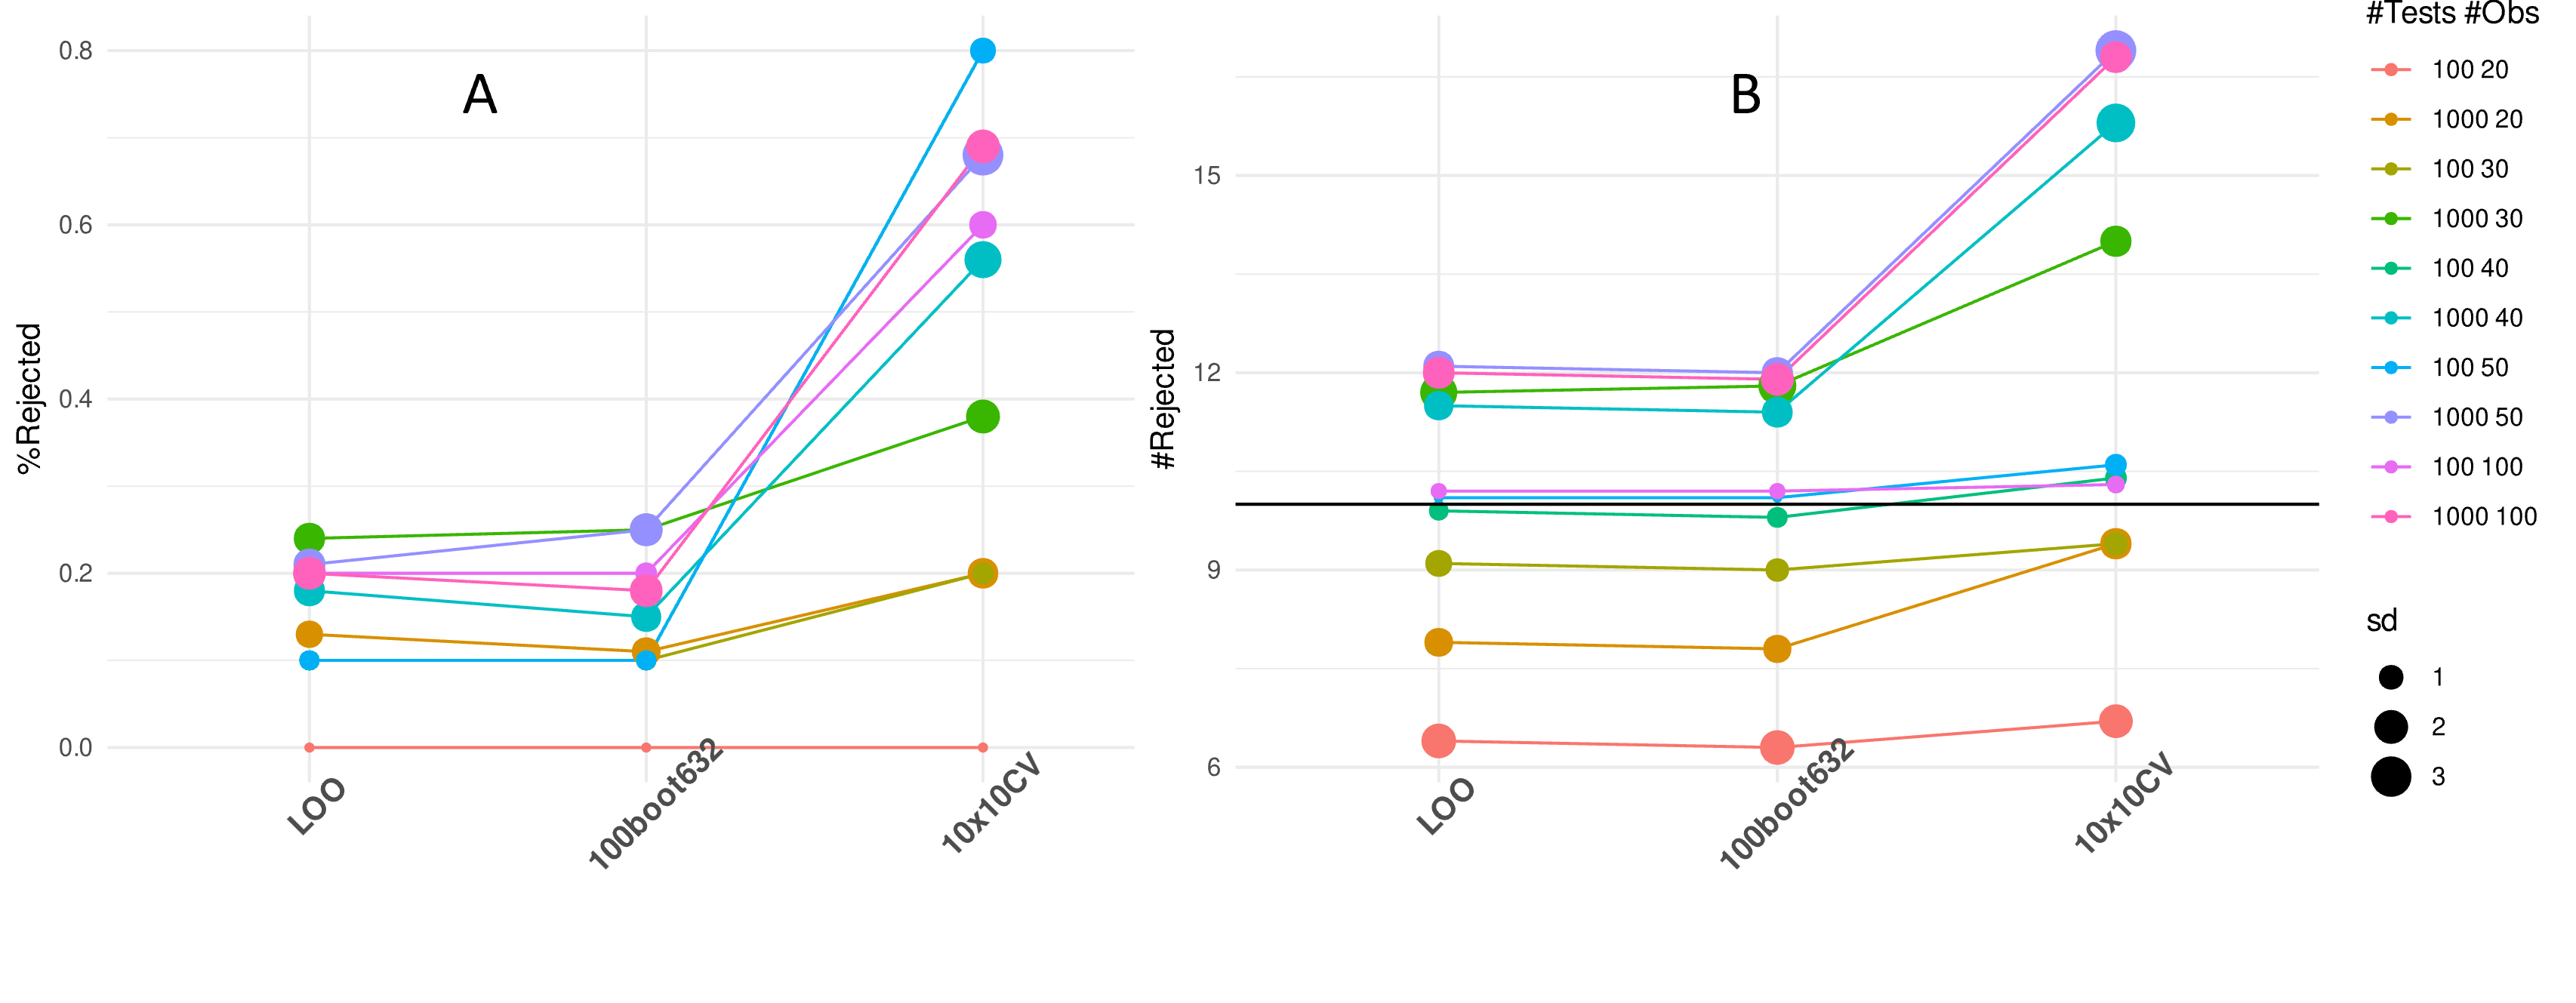
As there are several ways to perform OOS prediction (Hastie et al., 2009), it is necessary to choose a method suitable for data calibration. We evaluated three OOS methods; leave-one-out (LOO) validation, 10 times repeated 10-fold cross-validation (10x10CV), and 100 times repeated bootstrap 632 (100boot632) on various settings of two types of simulated data sets, one with no relationship at all and one with some relationships. We found that LOO and 100boot632 performed adequately while 10x10CV lead to a higher false positive rate (Fig. 2). We, therefore, deemed LOO as our default choice. However, LOO can be computationally prohibitive with very large sample sizes and 100boot632 can serve as an alternative.
Experimental Settings and Data
We used simulations to establish basic properties of our proposed method. For this reason we compared our method with various commonly used multiple testing correction methods which typically penalize the values based on the number of tests performed. These tests included, family-wise error control using the Holm’s correction (Holm), False Discover Rate control using the Benjamini-Hochberg correction (BH), permutation test using the maximum statistic across the tests (Perm_max) as well as permutation test for individual test (Perm). We employed two -value calibration methods, a first proposed by Selke and colleagues (Sellke et al., 2001) (pcalSBB, pcal function from the pcal R package) and a second proposed by Bickel (Bickel, 2021b) (pcalBickel, implemented as ). We also included Bayesian correlation test (the correlationBF function from the R package BayesFactor) which provides a Bayes factor (BF) per test and might need multiple testing correction (Gelman et al., 2012). There is no pre-defined and accepted cut-off for BF and two options have been proposed, 3 as moderate and 10 as strong evidence for accepting the (van Doorn et al., 2020). BF-based hypothesis testing–so called "null hypothesis Bayesian testing" (NHBT)–is prudent compared to NHST but it might be a calibration issue rather than a real disagreement between the two (Trafimow, 2003; Wetzels et al., 2011; Tendeiro and Kiers, 2019). Instead of using the Bayes factors, we converted them to posterior probability estimates with prior probability of (ppBF, bfactor_to_prob function from the pcal R package) (Jeffreys, 1961; Ly et al., 2016). For all the methods statistical significance for null hypotheses rejection was set to the commonly used threshold of . For simulation studies we did not apply any additional correction to values from dcal, the two calibration methods or ppBF. This choice was made to gain a better understanding of "raw" values provides by these methods. Note that use of is intensely debated (e.g., see (Benjamin et al., 2018; Amrhein and Greenland, 2018; Wasserstein et al., 2019)), this debate, however, is out of the scope of the current work.
The simulation studies were helpful in empirically establishing that the proposed dcal correlation test when applied to multiple hypotheses provides values penalized for each individual test and hence can be used without additional multiple testing correction. However, the simulated data can not cover all the complexities of real world data. We, therefore, applied the proposed test together with the comparison methods to a high-dimensional RNA-seq dataset ARXHS4 (Lachmann et al., 2018) to identify co-expressed genes.
Results
Comparison With -value Calibration and Bayesian Methods
Using simulated data with different sample sizes and different effect sizes in the range , we first compared our dcal test with two -value calibration methods (pcalSBB, pcalBickel), and the posterior probability based on the Bayes factor (ppBF).
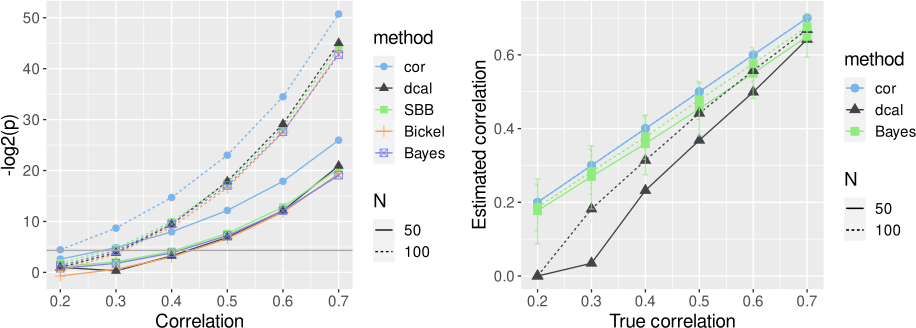
We observed that the dcal test behaved rather conservatively at lower effect sizes–i.e., high values–but then approaches the original values at higher effect sizes (Fig. 3A). An important advantage provided by our dcal test is that it also provides conservative correlation value estimates at lower effect sizes where the Bayesian method remains close to the original values (Fig. 3B). Similarly to the values the estimates approach the true values at higher effect sizes and with increasing sample size, a behaviour desirable in real-world applications.
Simulations With and Without Correlations
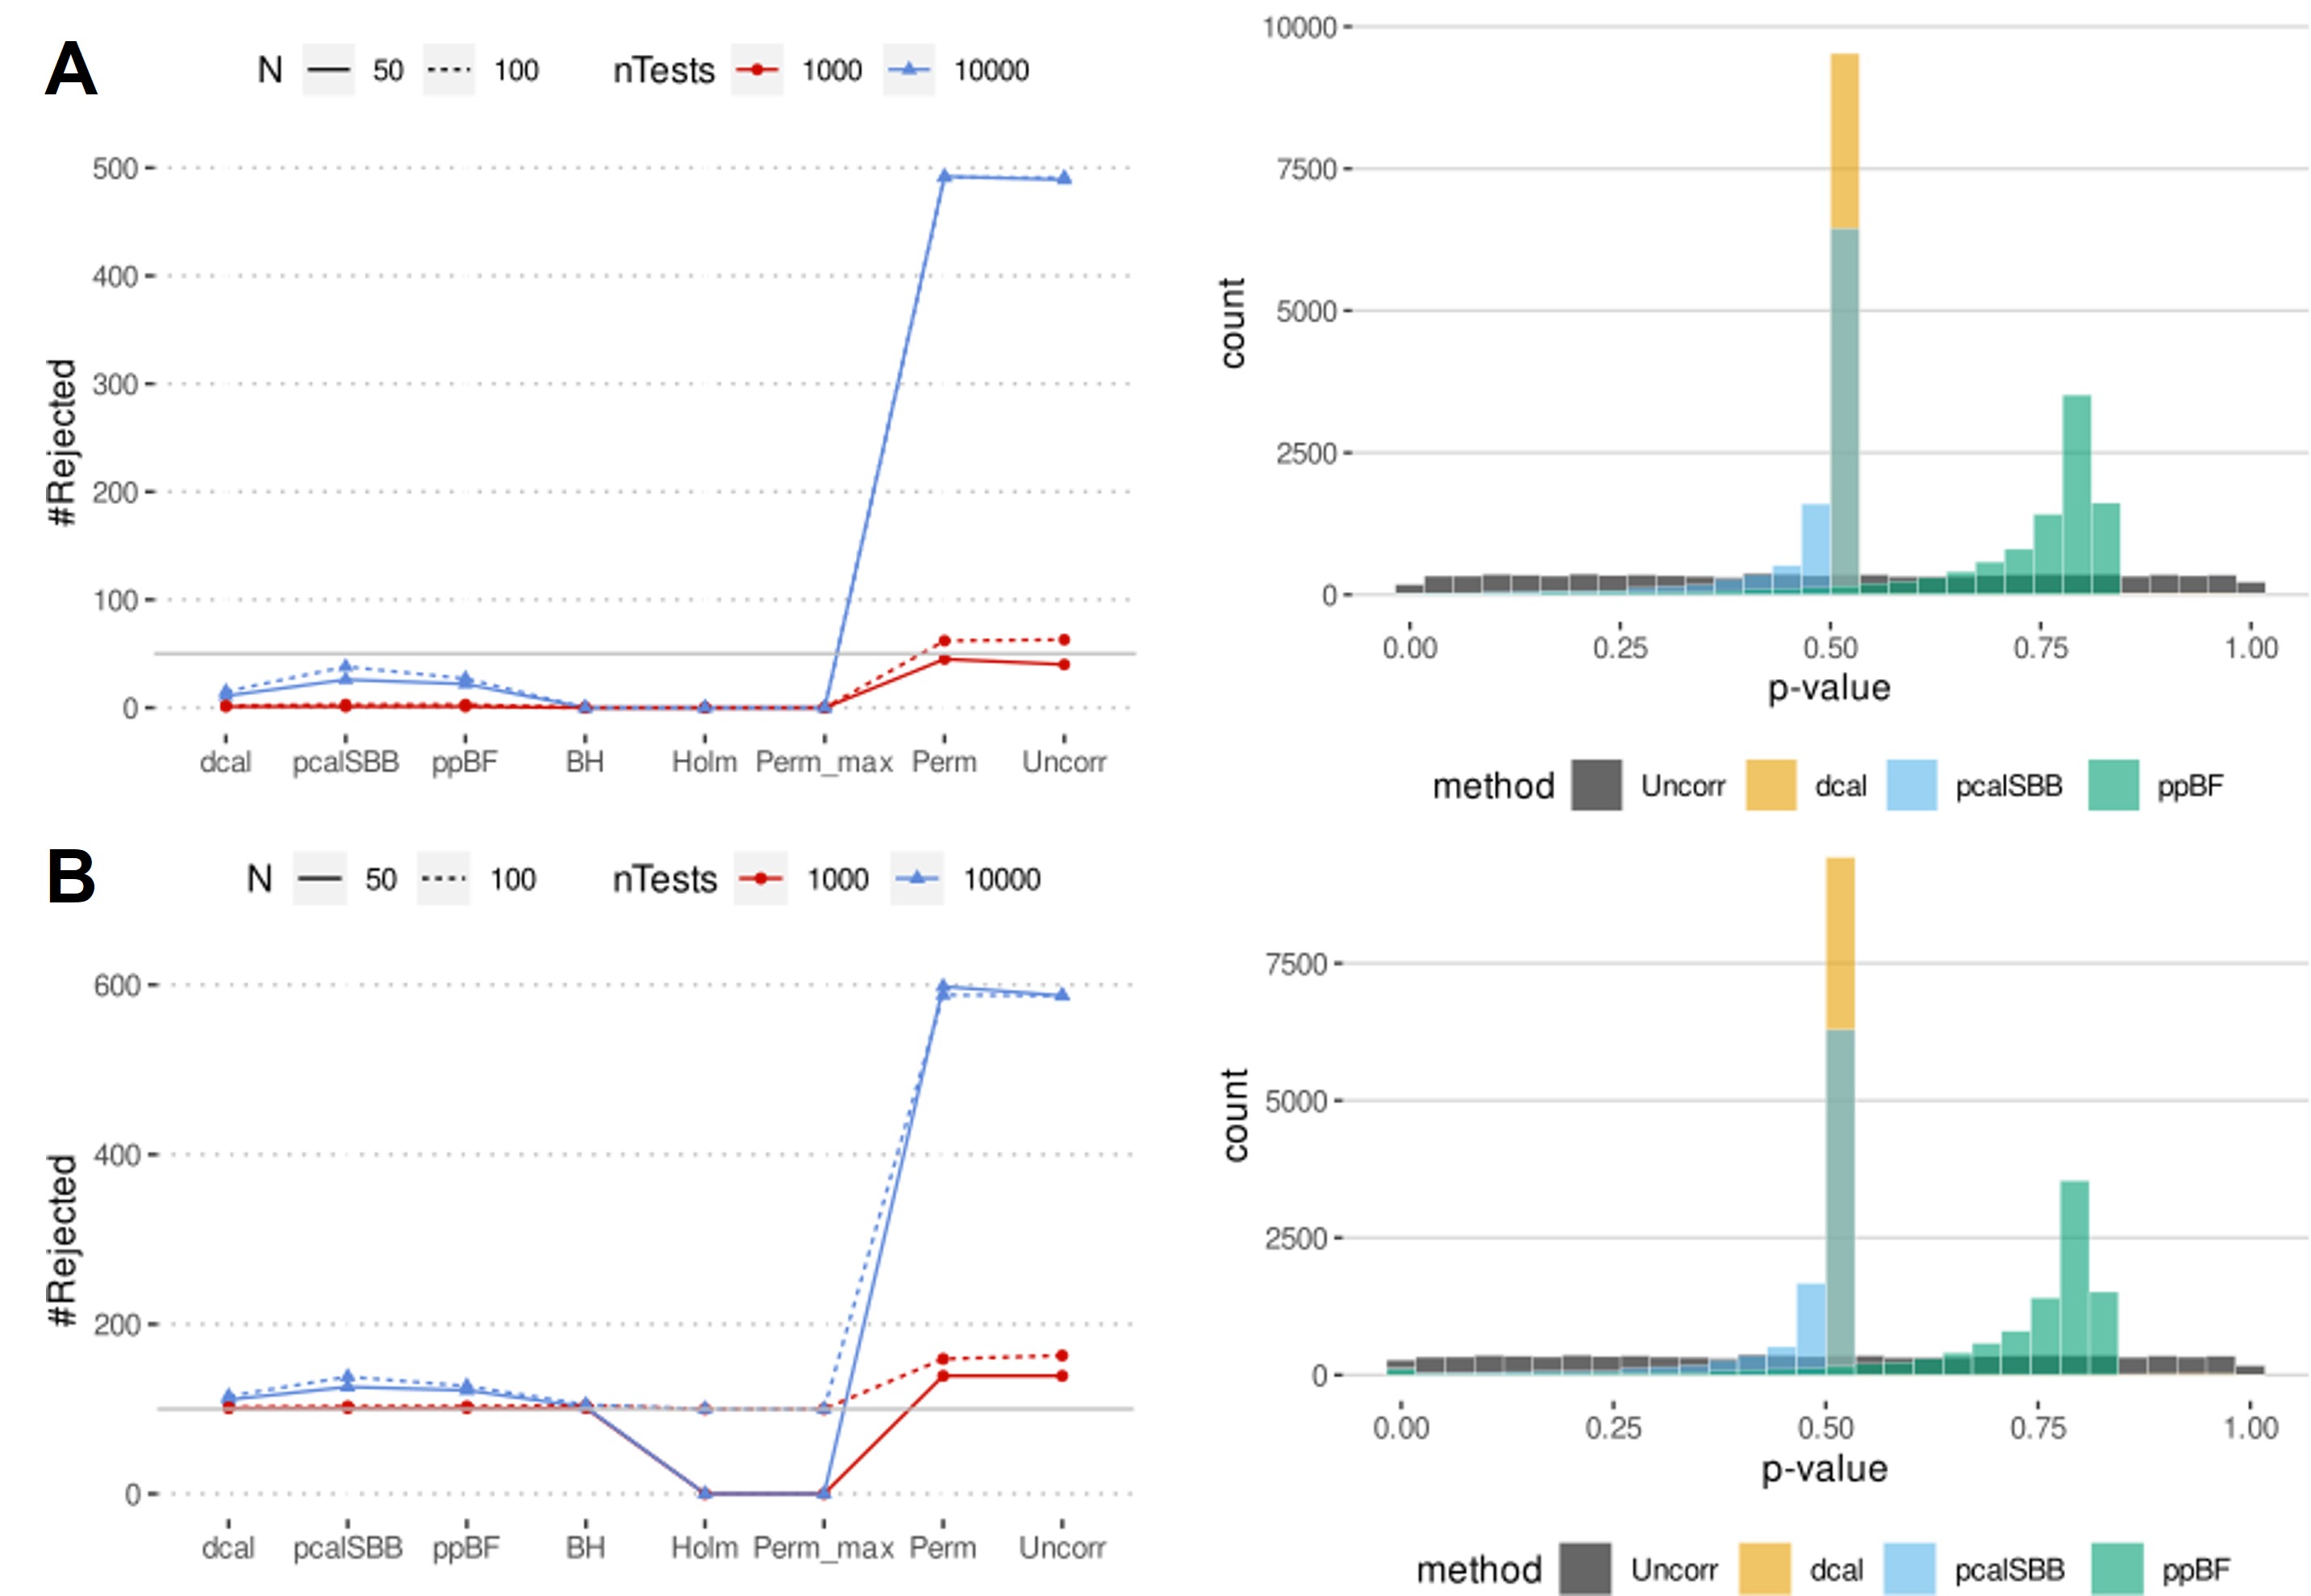
We sought to establish how dcal tests perform in a controlled scenario. For this we first performed a baseline simulation where there were no correlation between the variables, i.e. they were generated completely randomly using a Gaussian distribution with and . We generated 100 independent variables to test against a single dependent variable , a usual setting in real-world scenarios. Here a well-calibrated method should not provide any significant results. Indeed, dcal performed well and did not produce many false positives (Fig. 4 A). The same was true for other methods employing explicit multiple testing correction.
We then generated data with 100 variables correlated with the outcome variable with effect size of . A good method should provide 100 rejections if it can correctly handle the multiple tests. We indeed observed that dcal, pcalSBB, and FDR generated close to 100 rejections when performing 1000 or 10000 tests (Fig. 4 B). Two methods, Holm and Perm_max, were overly conservative with the smaller sample size (N=50).
Overall, Perm and Uncorr produced many more false positives, and more tests (10000) resulted in more false positives, as expected.
Gene Co-expression Analysis
We analysed RNA-seq data to to identify which of the available 32831 genes are significantly correlated with the human specific ARHGAP11B that is involved neocortex expansion (Florio et al., 2015).
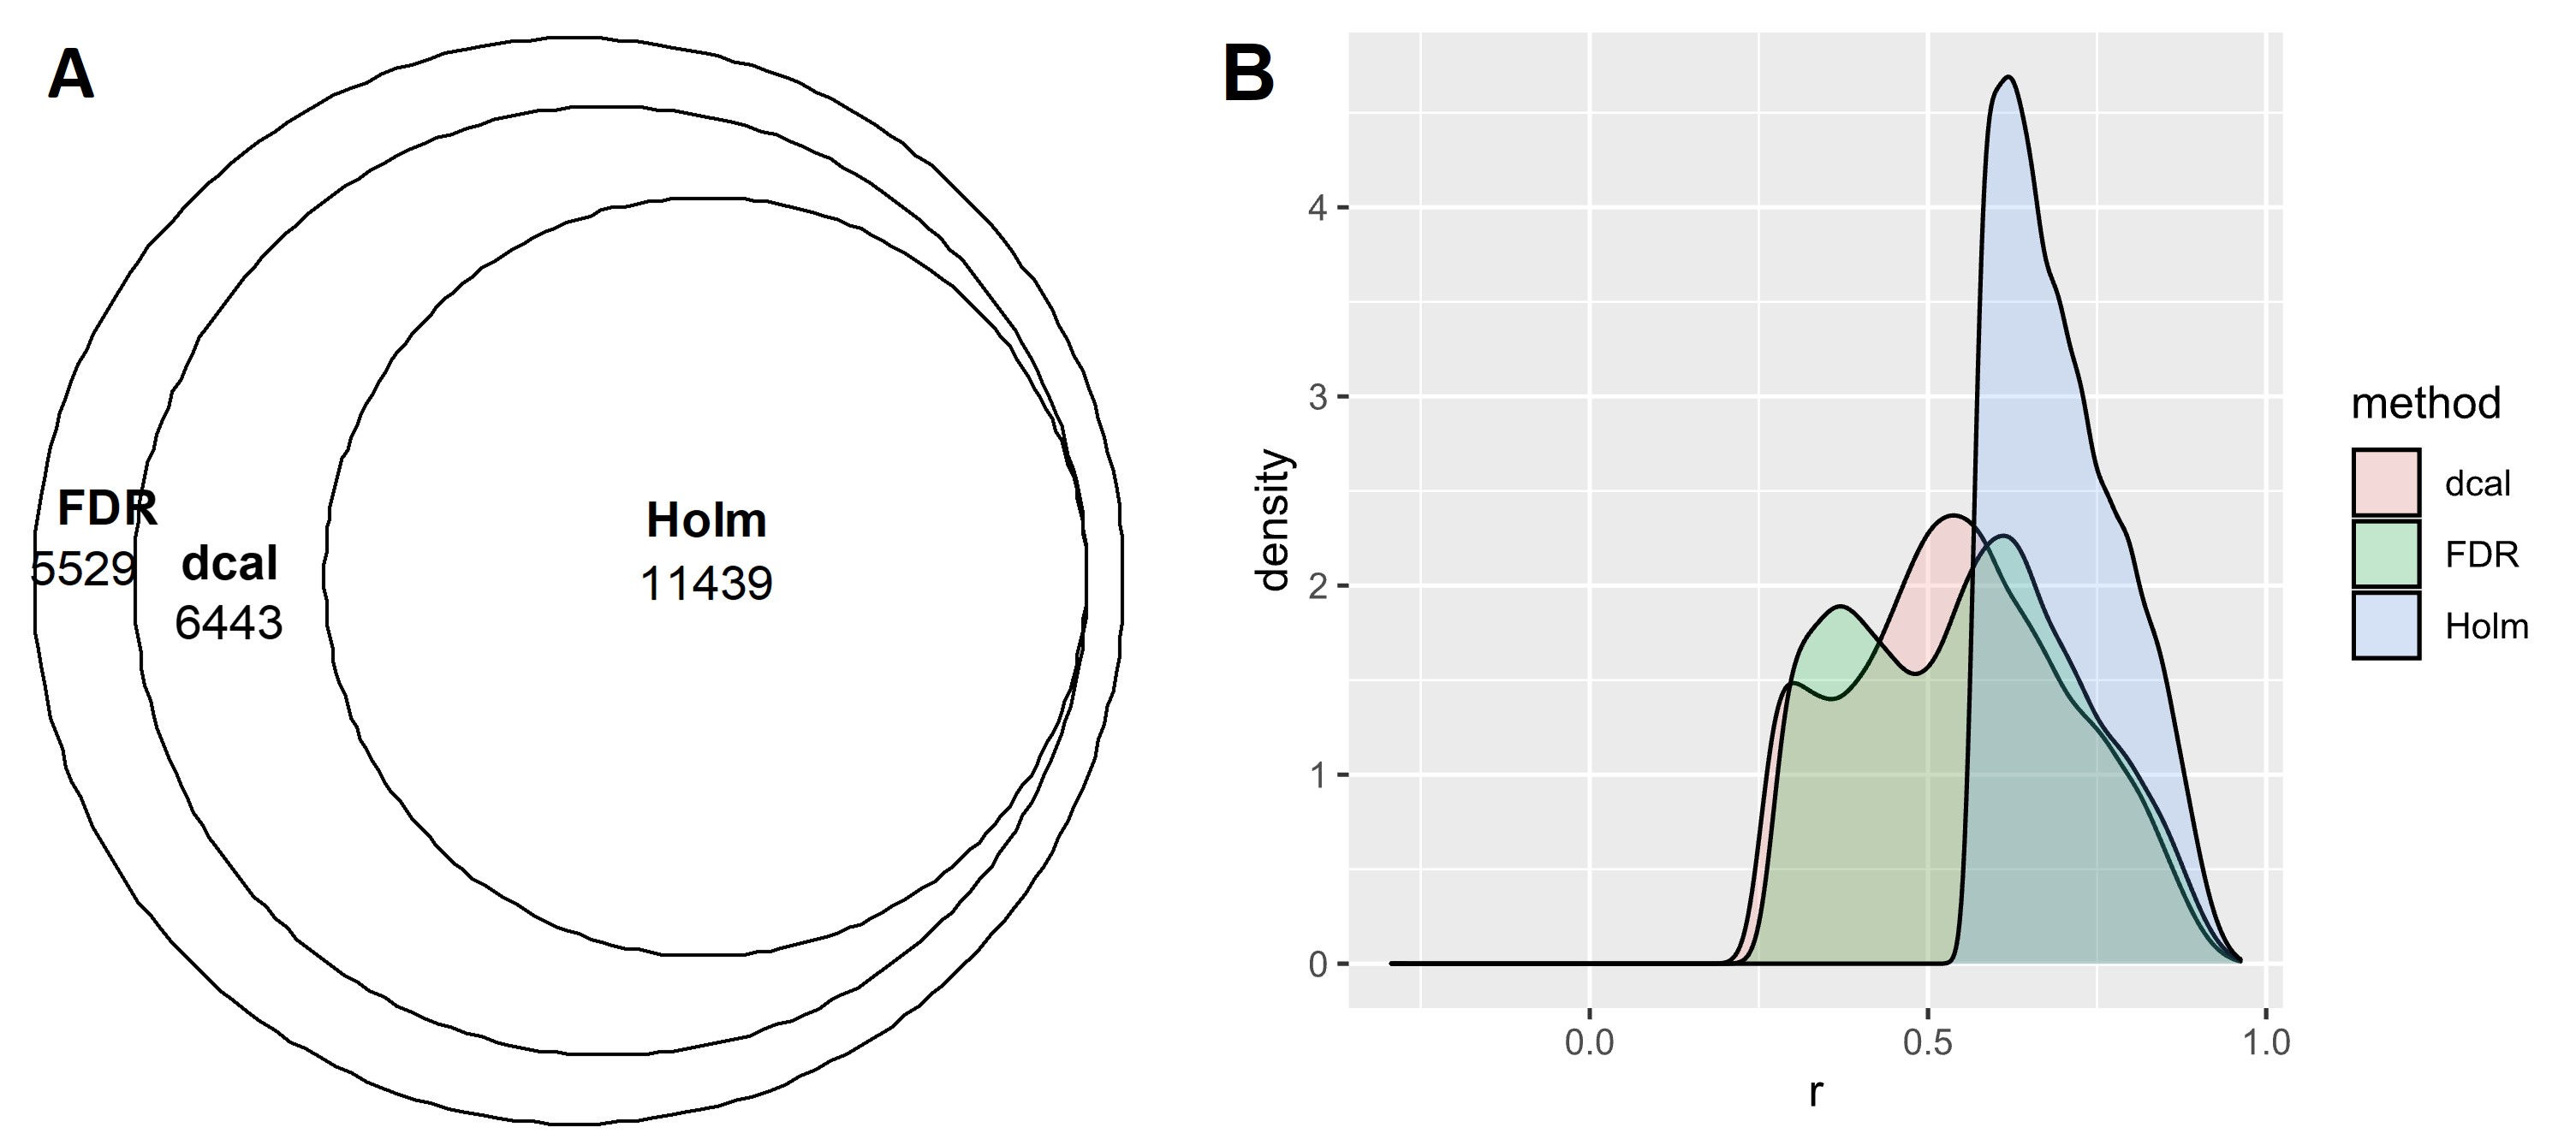
The three methods were consistent such that the most conservative correction Holm (11439 significant) was subsumed by dcal (17882 significant) which in turn was a subset of FDR (23411 significant) (5 A).
Effect of outliers
We then investigated how the dcal method deals with outliers in general. To this end, we performed simulations following previous work (Pernet et al., 2013; Bishara and Hittner, 2015) and compared with a robust correlation method, skipped correlation (Wilcox, 2015). In all cases of the data was sampled from the corresponding outlier distribution.
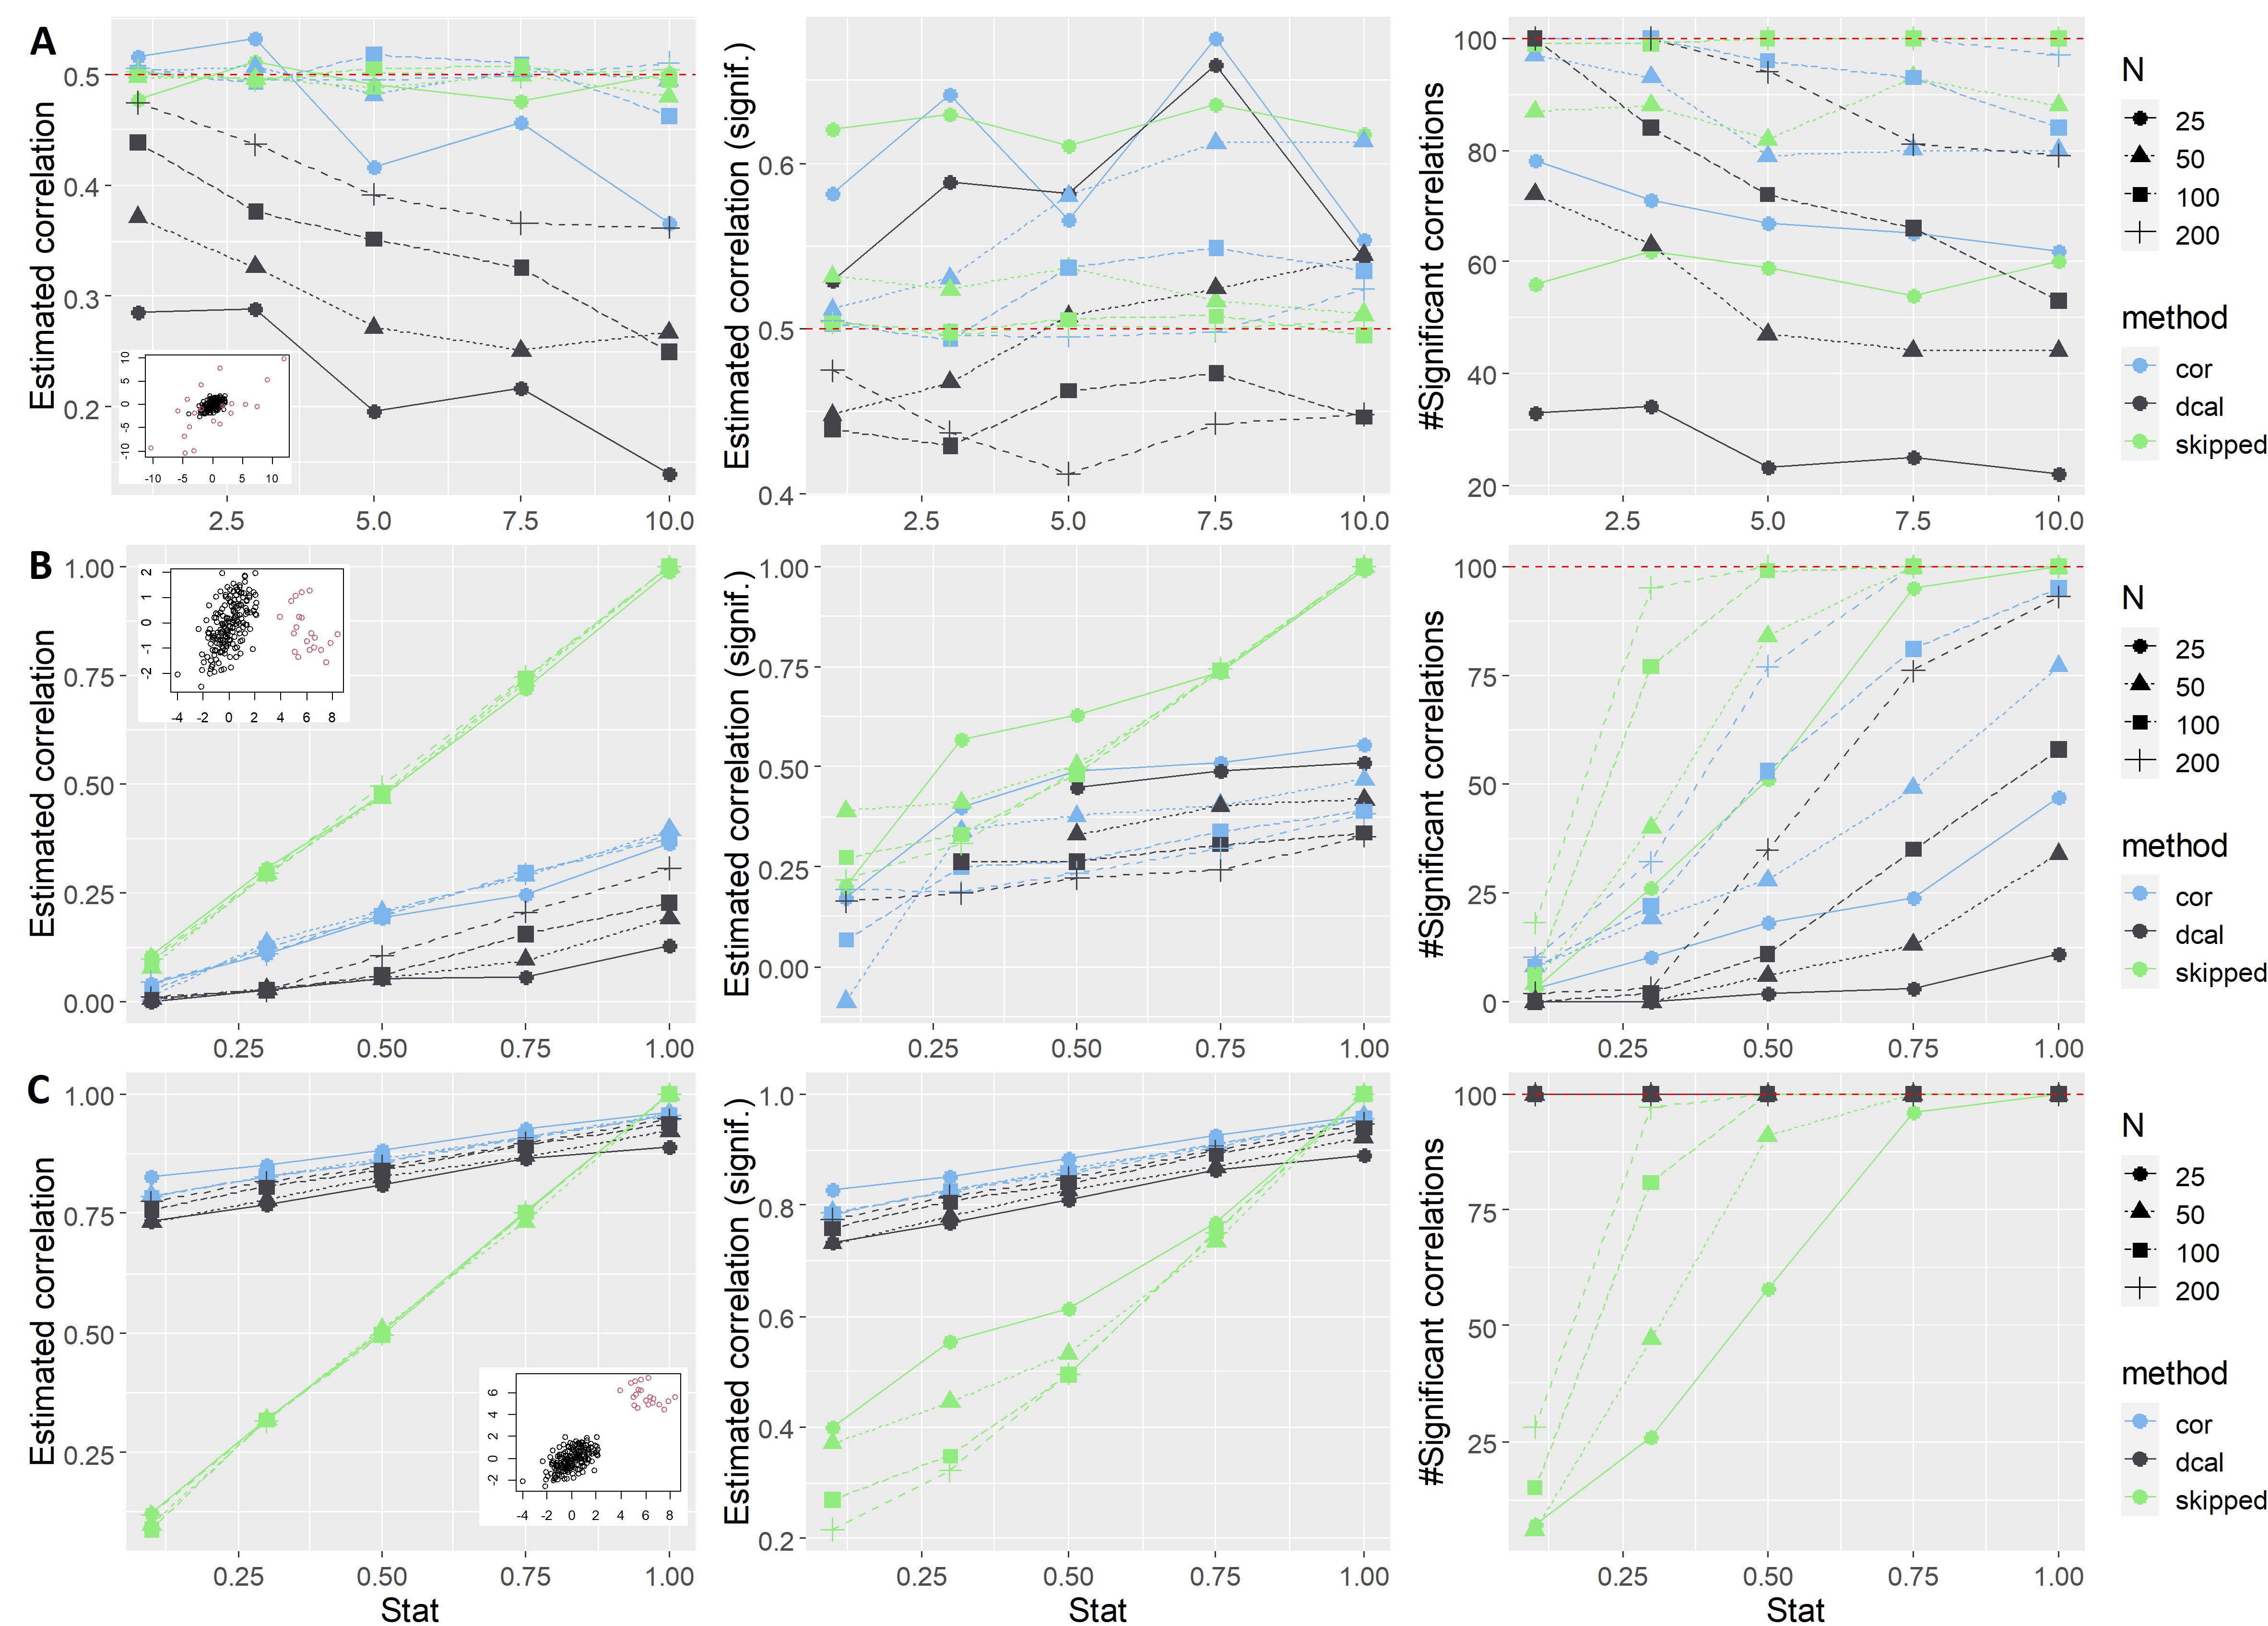
For the high variance outliers we varied the standard deviation of the population distributions while keeping correlation constant at . With higher standard deviation of the outlier distribution dcal estimated correlation values dropped while also shows a drop but only for small sample size and skipped gives more consistent estimates (Fig. 6 A, left). If we look only at the significant correlations (, middle panels) then we observe more fluctuations around the expected value of with smaller samples overestimating the . The sensitivity of the methods (right panel) as expected was generally lower for smaller samples with dcal showing lowest sensitivity and skipped the highest.
For the next two kinds of outliers (univariate and bivariate), we varied the correlation between the two variables. For the univariate outliers (Fig. 6 B), the skipped correlation estimated the values close to the expected values at all sample sizes while both and dcal underestimated them with the latter being more pessimistic. Similar observations could be made while looking only at the significant correlations. While the sensitivity of all the methods increases with increasing value of true , skipped was most sensitive followed by and dcal.
With bivariate outliers (Fig. 6 C), some of the aforementioned trends reversed. skipped estimates of were close to the true value while both and dcal overestimated them. The sensitivity of skipped was lower while the other two methods showed near-perfect sensitivity.
In line with the Anscombe’s quartet analysis (Fig. 1), dcal showed reduced sensitivity in presence of outliers with reduced effect sizes. However, with bivariate outliers dcal behaved similar to suggesting that the type of outliers can impact its behaviour, which can be expected of any method. The reduced sensitivity can be a desirable property to avoid false positives in presence of outliers.
Discussion and Conclusions
We proposed a novel ML-based predictive method to perform linear correlation NHST. Our method, dcal, calibrates the data using the alternative hypothesis model (here linear regression) such that each calibrated data point encodes information regarding its conformation to that hypothesis. Subsequent application of the conventional test to this calibrated data yields calibrated test results. Importantly, both the correlation estimate and the -value are calibrated. This provides an advantage compared to the probability calibration methods which only calibrate the values.
Analysis of the Anscombe’s quartet dataset show that dcal-based correlation test can handle scenarios where both probability calibration and Bayesian methods fail (Fig. 1, Table 1). These results are further validated by several simulations as well as real-world gene co-expression data analysis. Our results regarding multiple testing suggest that the output of dcal does not require additional correction for multiple tests.
Our method has important implications for scientific and industrial applications. A major limitation of traditional multiple testing correction methods is that they become conservative with increasing number of tests. As the number of variables keep growing, e.g. number of probes in a micro-array experiment, resolution of neuorimgaing and satellite data, traditional frameworks become too conservative. dcal can potentially alleviate this limitation as can be used directly for qualifying a test as significant or not. Taken together, our proposed method can help scientific investigation by providing an easy to use alternative to traditional linear correlation analysis and multiple testing correction.
Another important consideration in the big data era is the dependence of values on the sample size (Gómez-de Mariscal et al., 2021). As increasing sample size leads to decreasing -value it also increases the chances of false positives. How this dependence plays out with dcal needs further investigation.
Statistics is a founding discipline of machine learning and many algorithms and theoretical results have benefited from a close interaction with statistics. In this work, we use ML to make a contribution to statistics.
Limitations and Future Work
Here we developed a data-calibration-based test for linear correlation. However, the proposed dcal paradigm provides a framework which can be extended to other statistical tests using appropriate algorithms, for instance t-test using logistic regression. We envision a general data-calibration-based NHST framework applicable to various statistical tests which we fondly call Significance testing INcorporating Generalization (SING).
Our current algorithm (Algo. 1) uses LOO validation for obtaining out-of-sample predictions. It is possible to use other schemes like bootstrap to obtain out-of-sample predictions but here we used LOO as it provides the most unbiased estimates which is beneficial for our purpose. However, LOO can be computationally expensive for large data sets and further tests should be performed to identify optimal choices.
The values were observed to be close to that of value calibration methods. Given the low computational requirement of value calibration, they offer a tempting preference. However, they do not perform well on corner-cases—as we showed using the Anscombe’s quarter—and they do not offer calibrated estimates of the statistic estimate. Investigating similarities and differences between these two approaches may provide novel insights and possibly faster algorithms.
We acknowledge that our use of Bayesian methods is not Bayesian in spirit as we converted the Bayes factors into posterior probability estimates and that too with a fixed prior probability of . Although resulting point estimates are non-Bayesian in spirit they serve well the comparative purpose as we intended in this study.
Taken together, our proposed method provides an alternative way to look at statistical significance testing. We hope that the conceptual and theoretical novelty helps in developing new methods making the application of the widely used NHST framework more robust and less prone to misinterpretation.
Acknowledgements
We cordially thank Prof. Carlos Soares (U. Porto) for fruitful brainstorming sessions. We also thank Prof. Maya Mathur (Stanford), and Prof. Wolfgang Huber (EMBL) for their comments on the initial ideas of this research.
This work was partly supported by the Deutsche Forschungsgemeinschaft (DFG, PA 3634/1-1 and EI 816/21-1), and the Helmholtz Portfolio Theme “Supercomputing and Modelling for the Human Brain”.
References
- Pearson [1896] Karl Pearson. Vii. mathematical contributions to the theory of evolution.—iii. regression, heredity, and panmixia. Philosophical Transactions of the Royal Society of London. Series A, Containing Papers of a Mathematical or Physical Character, 187:253–318, 1896. doi:10.1098/rsta.1896.0007.
- Pernet et al. [2013] Cyril Pernet, Rand Wilcox, and Guillaume Rousselet. Robust correlation analyses: False positive and power validation using a new open source matlab toolbox. Frontiers in Psychology, 3:606, 2013. ISSN 1664-1078. doi:10.3389/fpsyg.2012.00606.
- Bishara and Hittner [2015] Anthony J. Bishara and James B. Hittner. Reducing bias and error in the correlation coefficient due to nonnormality. Educational and psychological measurement, 75(5):785–804, October 2015. ISSN 1552-3888 0013-1644. doi:10.1177/0013164414557639.
- Armstrong [2019] Richard A Armstrong. Should pearson’s correlation coefficient be avoided? Ophthalmic and Physiological Optics, 39(5):316–327, 2019. doi:https://doi.org/10.1111/opo.12636. URL https://onlinelibrary.wiley.com/doi/abs/10.1111/opo.12636.
- Goodman [2008] Steven Goodman. A dirty dozen: twelve p-value misconceptions. Seminars in Hematology, 45(3):135–140, 2008. ISSN 0037-1963. doi:10.1053/j.seminhematol.2008.04.003.
- Gao [2020] Jian Gao. P-values – a chronic conundrum. BMC Medical Research Methodology, 20(1):167, 2020. ISSN 1471-2288. doi:10.1186/s12874-020-01051-6.
- Nuzzo [2014] Regina Nuzzo. Scientific method: Statistical errors. Nature, 506(7487):150–152, 2014. ISSN 1476-4687. doi:10.1038/506150a.
- Halsey et al. [2015] Lewis G Halsey, Douglas Curran-Everett, Sarah L Vowler, and Gordon B Drummond. The fickle p value generates irreproducible results. Nature Methods, 12(3):179–185, 2015. ISSN 1548-7105. doi:10.1038/nmeth.3288.
- Anderson [2020] Samantha F. Anderson. Misinterpreting p: The discrepancy between p values and the probability the null hypothesis is true, the influence of multiple testing, and implications for the replication crisis. Psychological Methods, 25(5):596–609, 2020. ISSN 1939-1463. doi:10.1037/met0000248.
- Szucs and Ioannidis [2017] Denes Szucs and John P. A. Ioannidis. When null hypothesis significance testing is unsuitable for research: A reassessment. Frontiers in Human Neuroscience, 11:390, 2017. ISSN 1662-5161. doi:10.3389/fnhum.2017.00390.
- Häggström [2017] Olle Häggström. The need for nuance in the null hypothesis significance testing debate. Educational and psychological measurement, 77(4):616–630, 2017. ISSN 1552-3888. doi:10.1177/0013164416668233. Edition: 2016/10/05 Publisher: SAGE Publications.
- Cumming [2014] Geoff Cumming. The new statistics: Why and how. Psychological Science, 25(1):7–29, 2014. doi:10.1177/0956797613504966. PMID: 24220629.
- Wilcox [2012] Rand Wilcox. Introduction to Robust Estimation and Hypothesis Testing. Academic Press, 01 2012. doi:10.1016/C2010-0-67044-1.
- Wilcox [2015] Rand Wilcox. Inferences about the skipped correlation coefficient: Dealing with heteroscedasticity and non-normality. Journal of Modern Applied Statistical Methods, 14:2–8, 11 2015. doi:10.22237/jmasm/1446350580.
- Leek and Peng [2015] Jeffrey Leek and Roger Peng. Statistics: P values are just the tip of the iceberg. Nature, 520:612, 04 2015. doi:10.1038/520612a.
- Nickerson [2000] Raymond S. Nickerson. Null hypothesis significance testing: a review of an old and continuing controversy. Psychological methods, 5 2:241–301, 2000.
- Gibson [2021] Eric W. Gibson. The role of p-values in judging the strength of evidence and realistic replication expectations. Statistics in Biopharmaceutical Research, 13(1):6–18, 2021. doi:10.1080/19466315.2020.1724560.
- Lakens [2021] Daniël Lakens. The practical alternative to the p value is the correctly used p value. Perspectives on psychological science : a journal of the Association for Psychological Science, 16:1745691620958012, 02 2021. doi:10.1177/1745691620958012.
- Wasserstein and Lazar [2016] Ronald L. Wasserstein and Nicole A. Lazar. The asa statement on p-values: Context, process, and purpose. The American Statistician, 70(2):129–133, 2016. doi:10.1080/00031305.2016.1154108.
- Mayo and Hand [2022] Deborah G. Mayo and David Hand. Statistical significance and its critics: practicing damaging science, or damaging scientific practice? Synthese, 200(3):220, May 2022. ISSN 1573-0964. doi:10.1007/s11229-022-03692-0. URL https://doi.org/10.1007/s11229-022-03692-0.
- Matthews [2021] Robert Matthews. The p-value statement, five years on. Significance, 18:16–19, 04 2021. doi:10.1111/1740-9713.01505.
- Wasserstein et al. [2019] Ronald L. Wasserstein, Allen L. Schirm, and Nicole A. Lazar. Moving to a world beyond “p < 0.05”. The American Statistician, 73:1–19, 2019. ISSN 0003-1305. doi:10.1080/00031305.2019.1583913.
- Sellke et al. [2001] Thomas Sellke, M. J Bayarri, and James O Berger. Calibration of p values for testing precise null hypotheses. The American Statistician, 55(1):62–71, 2001. ISSN 0003-1305. doi:10.1198/000313001300339950.
- Shi and Yin [2020] Haolun Shi and Guosheng Yin. Reconnecting p-value and posterior probability under one- and two-sided tests. The American Statistician, 75(3):265–275, 2020. ISSN 0003-1305. doi:10.1080/00031305.2020.1717621.
- Bickel [2021a] David R. Bickel. Null hypothesis significance testing defended and calibrated by bayesian model checking. The American Statistician, 75(3):249–255, 2021a. ISSN 0003-1305. doi:10.1080/00031305.2019.1699443.
- Cabras and Castellanos [2017] Stefano Cabras and Maria Eugenia Castellanos. P-value calibration in multiple hypotheses testing. Statistics in Medicine, 36(18):2875–2886, 2017. ISSN 1097-0258. doi:10.1002/sim.7330.
- Rafi and Greenland [2020] Zad Rafi and Sander Greenland. Semantic and cognitive tools to aid statistical science: Replace confidence and significance by compatibility and surprise. BMC medical research methodology, 20:244, 09 2020. doi:10.1186/s12874-020-01105-9.
- Trafimow and Earp [2017] David Trafimow and Brian D. Earp. Null hypothesis significance testing and type i error: The domain problem. New Ideas in Psychology, 45:19–27, 2017. ISSN 0732-118X. doi:https://doi.org/10.1016/j.newideapsych.2017.01.002. URL https://www.sciencedirect.com/science/article/pii/S0732118X16301076.
- Leek and Storey [2008] J T Leek and J D Storey. A general framework for multiple testing dependence. Proc Natl Acad Sci U S A, 105(48):18718–18723, December 2008. doi:10.1073/pnas.0808709105.
- Wilson [2019] Daniel J. Wilson. The harmonic mean <em>p</em>-value for combining dependent tests. Proceedings of the National Academy of Sciences, 116(4):1195, 2019. doi:10.1073/pnas.1814092116.
- Efron et al. [2001] Bradley Efron, Robert Tibshirani, John D Storey, and Virginia Tusher. Empirical bayes analysis of a microarray experiment. Journal of the American Statistical Association, 96(456):1151–1160, 2001. ISSN 0162-1459. doi:10.1198/016214501753382129. Publisher: Taylor & Francis.
- Smith and Nichols [2009] Stephen M. Smith and Thomas E. Nichols. Threshold-free cluster enhancement: Addressing problems of smoothing, threshold dependence and localisation in cluster inference. NeuroImage, 44(1):83–98, 2009. ISSN 1053-8119. doi:10.1016/j.neuroimage.2008.03.061.
- Ignatiadis et al. [2016] Nikolaos Ignatiadis, Bernd Klaus, Judith B Zaugg, and Wolfgang Huber. Data-driven hypothesis weighting increases detection power in genome-scale multiple testing. Nature Methods, 13(7):577–580, 2016. ISSN 1548-7105. doi:10.1038/nmeth.3885.
- Hastie et al. [2009] Trevor Hastie, Robert Tibshirani, and Jerome Friedman. The elements of statistical learning: data mining, inference and prediction. Springer, 2 edition, 2009.
- Anscombe [1973] F. J. Anscombe. Graphs in statistical analysis. The American Statistician, 27(1):17–21, 1973. ISSN 0003-1305. doi:10.1080/00031305.1973.10478966.
- van Doorn et al. [2020] Johnny van Doorn, Don van den Bergh, Udo Böhm, Fabian Dablander, Koen Derks, Tim Draws, Alexander Etz, Nathan J. Evans, Quentin F. Gronau, Julia M. Haaf, Max Hinne, Šimon Kucharský, Alexander Ly, Maarten Marsman, Dora Matzke, Akash R. Komarlu Narendra Gupta, Alexandra Sarafoglou, Angelika Stefan, Jan G. Voelkel, and Eric-Jan Wagenmakers. The jasp guidelines for conducting and reporting a bayesian analysis. Psychonomic Bulletin & Review, 2020. ISSN 1531-5320. doi:10.3758/s13423-020-01798-5.
- Bickel [2021b] David R. Bickel. Interval estimation, point estimation, and null hypothesis significance testing calibrated by an estimated posterior probability of the null hypothesis. Communications in Statistics - Theory and Methods, 0(0):1–31, 2021b. doi:10.1080/03610926.2021.1921805.
- Gelman et al. [2012] Andrew Gelman, Jennifer Hill, and Masanao Yajima. Why we (usually) don’t have to worry about multiple comparisons. Journal of research on educational effectiveness, 5(2):189–211, 2012. ISSN 1934-5747. doi:10.1080/19345747.2011.618213.
- Trafimow [2003] David Trafimow. Hypothesis testing and theory evaluation at the boundaries: surprising insights from bayes’s theorem. Psychological review, 110 3:526–35, 2003.
- Wetzels et al. [2011] Ruud Wetzels, Dora Matzke, Michael D. Lee, Jeffrey N. Rouder, Geoffrey J. Iverson, and Eric-Jan Wagenmakers. Statistical evidence in experimental psychology: An empirical comparison using 855 t tests. Perspectives on Psychological Science, 6(3):291–298, 2011. doi:10.1177/1745691611406923.
- Tendeiro and Kiers [2019] Jorge Nunes Tendeiro and Henk A. L. Kiers. A review of issues about null hypothesis bayesian testing. Psychological methods, 24(6):774–795, 2019.
- Jeffreys [1961] Harold Jeffreys. Theory of Probability. Oxford, Oxford, England, third edition, 1961.
- Ly et al. [2016] Alexander Ly, Josine Verhagen, and Eric-Jan Wagenmakers. Harold jeffreys’s default bayes factor hypothesis tests: Explanation, extension, and application in psychology. 72:19–32, 2016. ISSN 0022-2496. doi:https://doi.org/10.1016/j.jmp.2015.06.004.
- Benjamin et al. [2018] Daniel J. Benjamin, James O. Berger, Magnus Johannesson, Brian A. Nosek, E.-J. Wagenmakers, Richard Berk, Kenneth A. Bollen, Björn Brembs, Lawrence Brown, Colin Camerer, David Cesarini, Christopher D. Chambers, Merlise Clyde, Thomas D. Cook, Paul De Boeck, Zoltan Dienes, Anna Dreber, Kenny Easwaran, Charles Efferson, Ernst Fehr, Fiona Fidler, Andy P. Field, Malcolm Forster, Edward I. George, Richard Gonzalez, Steven Goodman, Edwin Green, Donald P. Green, Anthony G. Greenwald, Jarrod D. Hadfield, Larry V. Hedges, Leonhard Held, Teck Hua Ho, Herbert Hoijtink, Daniel J. Hruschka, Kosuke Imai, Guido Imbens, John P. A. Ioannidis, Minjeong Jeon, James Holland Jones, Michael Kirchler, David Laibson, John List, Roderick Little, Arthur Lupia, Edouard Machery, Scott E. Maxwell, Michael McCarthy, Don A. Moore, Stephen L. Morgan, Marcus Munafó, Shinichi Nakagawa, Brendan Nyhan, Timothy H. Parker, Luis Pericchi, Marco Perugini, Jeff Rouder, Judith Rousseau, Victoria Savalei, Felix D. Schönbrodt, Thomas Sellke, Betsy Sinclair, Dustin Tingley, Trisha Van Zandt, Simine Vazire, Duncan J. Watts, Christopher Winship, Robert L. Wolpert, Yu Xie, Cristobal Young, Jonathan Zinman, and Valen E. Johnson. Redefine statistical significance. Nature Human Behaviour, 2(1):6–10, 2018. ISSN 2397-3374. doi:10.1038/s41562-017-0189-z.
- Amrhein and Greenland [2018] Valentin Amrhein and Sander Greenland. Remove, rather than redefine, statistical significance. Nature Human Behaviour, 2(1):4–4, 2018. ISSN 2397-3374. doi:10.1038/s41562-017-0224-0.
- Lachmann et al. [2018] Alexander Lachmann, Denis Torre, Alexandra B. Keenan, Kathleen M. Jagodnik, Hoyjin J. Lee, Lily Wang, Moshe C. Silverstein, and Avi Ma’ayan. Massive mining of publicly available RNA-seq data from human and mouse. Nature Communications, 9(1):1366, April 2018. ISSN 2041-1723. doi:10.1038/s41467-018-03751-6. URL https://doi.org/10.1038/s41467-018-03751-6.
- Florio et al. [2015] Marta Florio, Mareike Albert, Elena Taverna, Takashi Namba, Holger Brandl, Eric Lewitus, Christiane Haffner, Alex Sykes, Fong Kuan Wong, Jula Peters, Elaine Guhr, Sylvia Klemroth, Kay Prüfer, Janet Kelso, Ronald Naumann, Inna Nüsslein, Andreas Dahl, Robert Lachmann, Svante Pääbo, and Wieland B. Huttner. Human-specific gene arhgap11b promotes basal progenitor amplification and neocortex expansion. Science, 347(6229):1465–1470, 2015. ISSN 0036-8075. doi:10.1126/science.aaa1975.
- Gómez-de Mariscal et al. [2021] Estibaliz Gómez-de Mariscal, Vanesa Guerrero, Alexandra Sneider, Hasini Jayatilaka, Jude M. Phillip, Denis Wirtz, and Arrate Muñoz-Barrutia. Use of the p-values as a size-dependent function to address practical differences when analyzing large datasets. Scientific Reports, 11(20942), 2021. doi:10.1038/s41598-021-00199-5.