11email: vgelder@strw.leidenuniv.nl 22institutetext: Max Planck Institut für Extraterrestrische Physik (MPE), Giessenbachstrasse 1, 85748 Garching, Germany 33institutetext: INAF-Osservatorio Astrofisico di Arcetri, Largo E. Fermi 5, 50125 Firenze, Italy 44institutetext: Jodrell Bank Centre for Astrophysics, Department of Physics and Astronomy, University of Manchester, Oxford Road, Manchester, M13 9PL, UK 55institutetext: I. Physikalisches Institut, Universität zu Köln, Zülpicher Str.77, 50937, Köln, Germany
Methanol deuteration in high-mass protostars
Abstract
Context. The deuteration of molecules forming in the ices such as methanol (CH3OH) is sensitive to the physical conditions during their formation in dense cold clouds and can be probed through observations of deuterated methanol in hot cores.
Aims. The aim is to determine the D/H ratio of methanol for a large sample of 99 high-mass protostars and to link this to the physical conditions during the formation of methanol in the prestellar phases.
Methods. Observations with the Atacama Large Millimeter/submillimeter Array (ALMA) containing transitions of CH3OH, CH2DOH, CHD2OH, 13CH3OH, and CHOH are investigated. The column densities of CH2DOH, CHD2OH, and CH3OH are determined for all sources, where the column density of CH3OH is derived from optically thin 13C and 18O isotopologues. Consequently, the D/H ratio of methanol is derived taking statistical effects into account.
Results. Singly deuterated methanol (CH2DOH) is detected at the level toward 25 of the 99 sources in our sample of the high-mass protostars. Including upper limits, the ratio inferred from was derived for 38 of the 99 sources and varies between . Including other high-mass hot cores from the literature, the mean methanol D/H ratio is . This is more than one order of magnitude lower than what is seen for low-mass protostellar systems (). Doubly deuterated methanol (CHD2OH) is detected at the level toward 11 of the 99 sources. Including upper limits for 15 sources, the ratios derived from are more than two orders of magnitude higher than with an average of which is similar to what is found for low-mass sources. Comparison with literature GRAINOBLE models suggests that the high-mass prestellar phases are either warm ( K) or live shorter than the free-fall timescale. In contrast, for low-mass protostars, both a low temperature of K and a prestellar phase timescale longer than the free-fall timescale are necessary.
Conclusions. The ratio drops by more than an order of magnitude between low-mass and high-mass protostars due to either a higher temperature during the prestellar phases or shorter prestellar phases. However, successive deuteration toward CHD2OH seems equally effective between low-mass and high-mass systems.
Key Words.:
astrochemistry – stars: formation – stars: protostars – techniques: interferometric – ISM: molecules1 Introduction
Isotopologues have proven to be vital in our understanding of the star and planet formation process. They allow for studying the most abundant species for which the emission originating from the main isotopologue is optically thick. Moreover, the sensitivity of isotopologue ratios to the physical conditions such as temperature and ultraviolet (UV) radiation has proven key in understanding the molecular journey during the entire star formation process (see e.g., reviews by Caselli & Ceccarelli, 2012; Tielens, 2013; Ceccarelli et al., 2014). One of the most studied isotopologues are those that contain deuterium (D). These deuterated molecules are suggested to form already in the cold prestellar phases (e.g., van Dishoeck et al., 1995; Caselli & Ceccarelli, 2012; Ceccarelli et al., 2014). Especially for molecules such as methanol (CH3OH) that form on the surfaces of dust grains in dense cores, D/H fractionation ratios up to 10% are found toward low-mass protostars (e.g., Bianchi et al., 2017a, b; Taquet et al., 2019; van Gelder et al., 2020), more than four orders of magnitude larger than the canonical D/H ratio derived for the local interstellar medium (ISM) of of (Linsky et al., 2006; Prodanović et al., 2010). It is thus key to understand the deuterium fractionation process in the earliest phases of star formation.
The gaseous atomic D/H ratio can be increased in the prestellar phases through the exothermic reaction (Watson, 1974; Aikawa & Herbst, 1999; Ceccarelli et al., 2014),
| (1) |
where K. Since in the cold ( K) prestellar cores the backward reaction in Eq. (1) is less efficient, H2D+ is enhanced and the atomic D/H ratio in the gas phase can be effectively increased through dissociative recombination of with free electrons. Moreover, gaseous CO is the main destructor of and (Brown & Millar, 1989; Roberts et al., 2003) and thus the heavy CO freeze-out in dense ( cm-3) prestellar cores additionally stimulates the increase of the gaseous atomic D/H ratio. In turn, the enhanced atomic D/H ratio in the gas can translate into a higher D/H ratio of molecules forming in the ices (Tielens, 1983; Nagaoka et al., 2005). Measuring the deuteration of molecules that form in the ices is thus a powerful tool to determine the physical conditions such as density (e.g., CO freeze-out) and temperature during their formation.
Methanol forms on the surfaces of dust grains in dense prestellar phases through the hydrogenation of CO ice (e.g., Watanabe & Kouchi, 2002; Fuchs et al., 2009) and reactions between its grains-surface products (e.g., H2CO and CH3O Simons et al., 2020; Santos et al., 2022) and is therefore expected to exhibit a high D/H ratio. This is in strong contrast to, for example, water for which the bulk of the ice is formed in the warmer translucent cloud phase leading to a rather low overall HDO/H2O ratio (%; Persson et al., 2014; Furuya et al., 2016; Jensen et al., 2019; van’t Hoff et al., 2022). The sensitivity of the methanol deuteration process to temperature was investigated by Bøgelund et al. (2018) using the GRAINOBLE gas-grain chemical model (Taquet et al., 2012, 2013, 2014), finding a strong correlation between the D/H ratio of methanol and the formation temperature. Moreover, Taquet et al. (2019) showed that the timescale of the prestellar phase is highly relevant for methanol deuteration.
Methanol and its (deuterated) isotopologues are readily observed as they desorb from the dust grains. Mono deuterated methanol, CH2DOH and CH3OD, have been observed in the warm inner regions of both low-mass and high-mass protostellar systems (e.g., Fuente et al., 2014; Belloche et al., 2016; Bøgelund et al., 2018; van Gelder et al., 2020; van der Walt et al., 2021). Similarly, both doubly and triply deuterated methanol have been detected in hot cores (e.g., Parise et al., 2002, 2004; Bianchi et al., 2017a; Drozdovskaya et al., 2022; Ilyushin et al., 2022). Moreover, CH2DOH has also been detected in both low-mass prestellar cores (e.g., Bizzocchi et al., 2014; Lattanzi et al., 2020; Ambrose et al., 2021) and high-mass starless cores (e.g., Fontani et al., 2015). Across this mass and evolutionary range, the D/H ratio of singly deuterated methanol varies orders of magnitude. The D/H ratio is on the order of 10% for low-mass prestellar cores, low-mass protostars, and comets (e.g., Bianchi et al., 2017a, b; Jørgensen et al., 2018; Taquet et al., 2019; Manigand et al., 2020; van Gelder et al., 2020; Lattanzi et al., 2020; Ambrose et al., 2021; Drozdovskaya et al., 2021). Interestingly, successive deuteration toward CHD2OH and CD3OH seems to be quite effective in low-mass protostars (about 15–25%; Drozdovskaya et al., 2022; Ilyushin et al., 2022). On the other hand, the D/H ratio derived from CH2DOH is as low as % for high-mass starless cores and high-mass protostars (Fontani et al., 2015; Neill et al., 2013; Belloche et al., 2016; Bøgelund et al., 2018). However, the sample of high-mass protostars for which reliable and interferometrically derived methanol D/H ratios are available (e.g., Orion KL, Sgn B2(N2), NGC 6334I) remains small compared to the low-mass sources ( sources). Furthermore, no interferometric detections of CHD2OH in high-mass sources have been presented thus far.
In this work, the methanol D/H ratios are derived for an additional 99 high-mass sources based on ALMA observations of CH2DOH, CHD2OH, CH3OH 13CH3OH, CHOH. In Sect. 2, the observations and derivation of the column densities are explained. The resulting D/H ratios of CH3OH and CH2DOH are presented in Sect. 3. In Sect. 4, the methanol D/H ratios derived for our high-mass sources are compared to their low-mass counterparts and prestellar phases. Furthermore, through comparison with the GRAINOBLE models computed by Bøgelund et al. (2018) and Taquet et al. (2019), the effect of physical conditions on the methanol D/H ratio is discussed. Our main conclusions are listed in Sect. 5.
2 Methodology
2.1 Observations
The dataset analyzed in this work was taken from the ALMA Evolutionary study of High Mass Protocluster Formation in the Galaxy (ALMAGAL) survey (2019.1.00195.L; PI: S. Molinari) that targeted over 1000 dense clumps with M⊙ based on the Herschel Hi-Gal survey (Molinari et al., 2010; Elia et al., 2017, 2021). The ALMAGAL survey covers frequencies from GHz to GHz with multiple configurations of ALMA down to resolution at a spectral resolution of between km s-1. In this work a subsample of 40 high-mass cores is selected based on high bolometric luminosity ( L⊙) and the sources being rich in lines from complex organic molecules (COMs) such as CH3OH and CH3CN. Only archival data with a beam smaller than 2′′ ( au) that were public before February 2021 are included. This selection introduces a bias in our sample to line-rich sources and means that not all high-mass cores in the ALMAGAL survey are covered. In the higher resolution ALMA data, the 40 Hi-Gal high-mass cores are resolved into in total 99 sources based on the continuum emission (labeled A, B, C, etc., see Appendix B). These 99 sources are all studied in this work and are the same as those that were analyzed by van Gelder et al. (2022). The data are pipeline calibrated and imaged with the Common Astronomy Software Applications111https://casa.nrao.edu/ (CASA; McMullin et al., 2007) version 5.6.1. The angular resolution of the data ranges from , corresponding to about au at the range of distances covered ( kpc; Mège et al., 2021), and the data have a sensitivity of K. The ALMAGAL data cover several transitions of CH3OH, four transitions of 13CH3OH, nine transitions of CHOH, 21 transitions of CH2DOH, and 22 transitions of CHD2OH (see Appendix A). Also nine transitions of CD3OH are covered (Ilyushin et al., 2022), but these are not detected toward any of the sources. No transitions of CH3OD are covered in the observed frequency range. Both CD3OH and CH3OD are therefore not analyzed further in this paper.
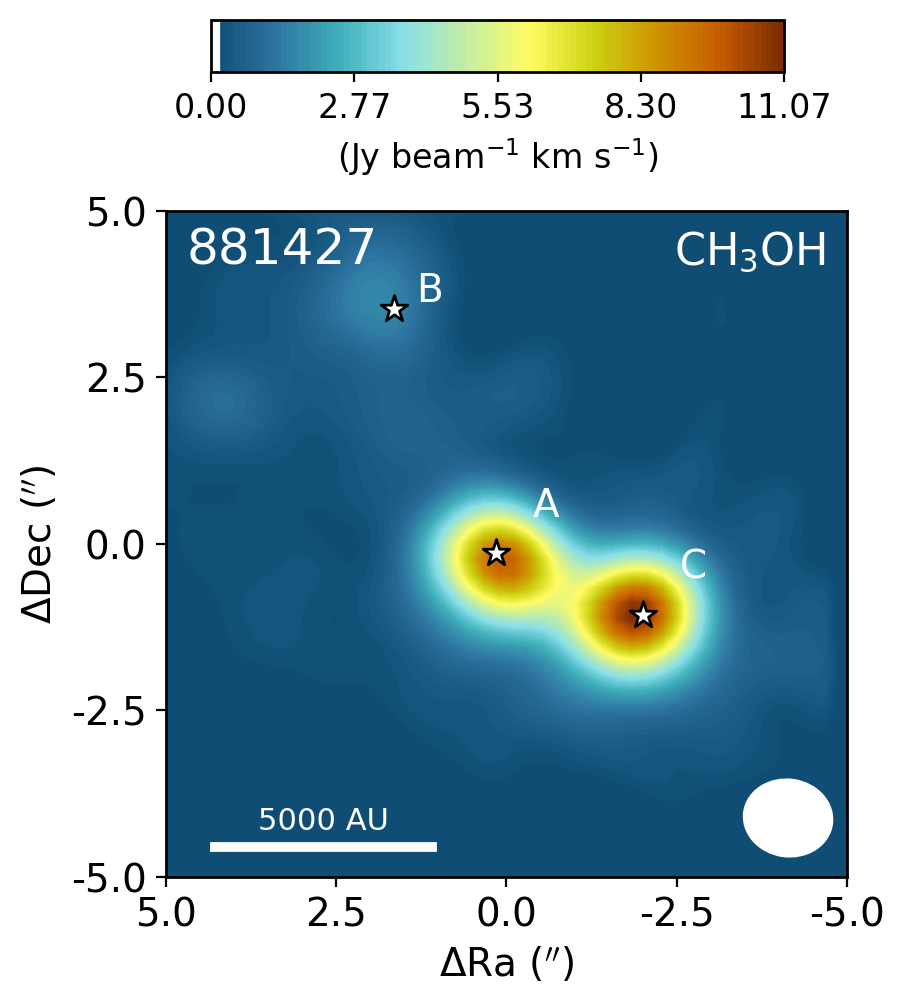
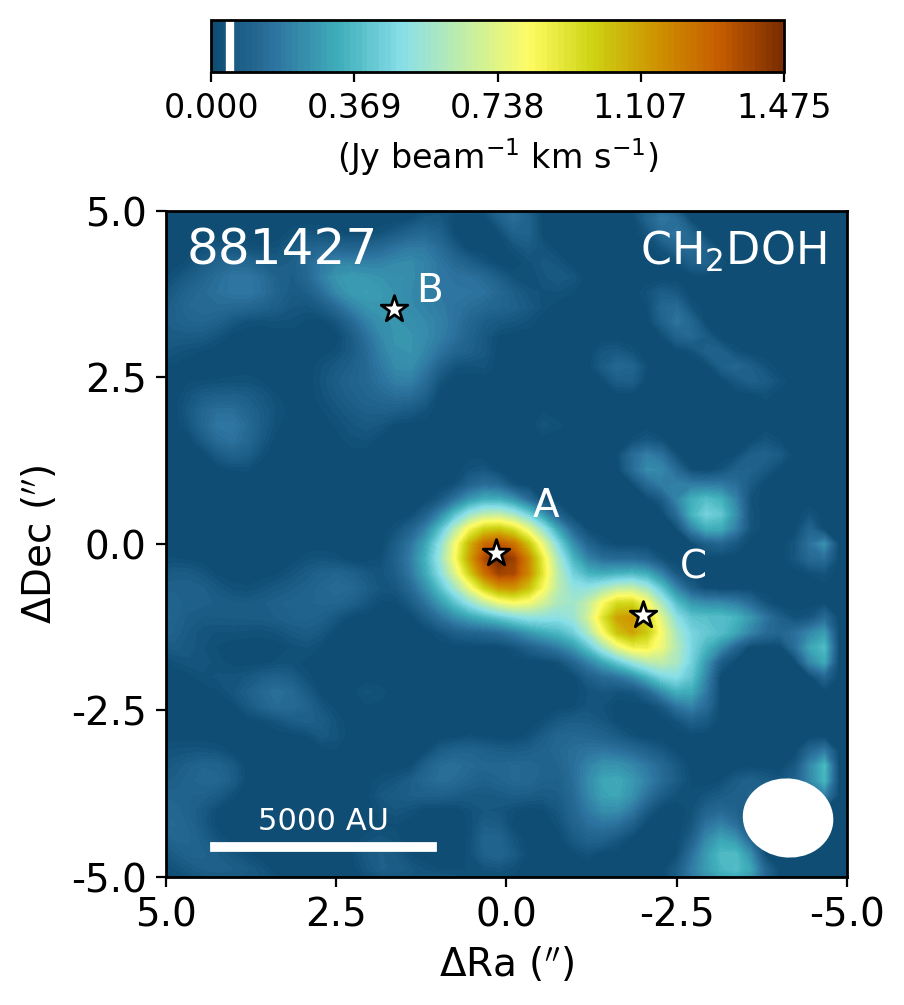
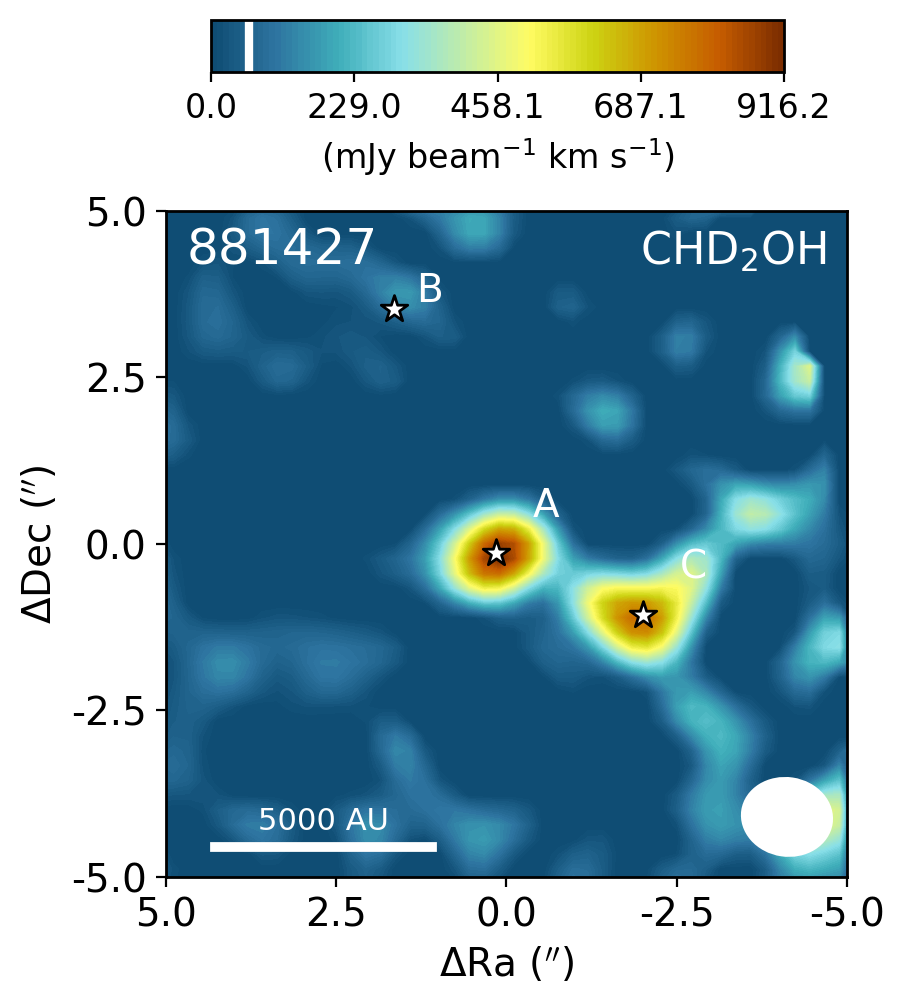
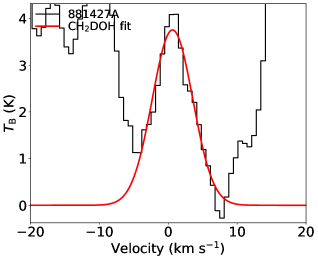
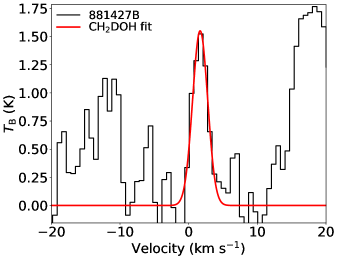
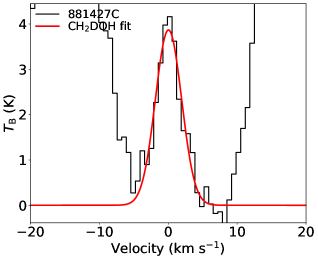
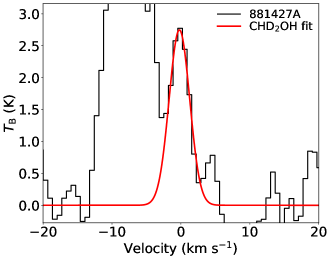
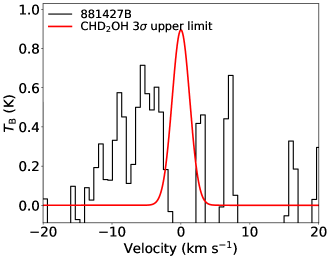
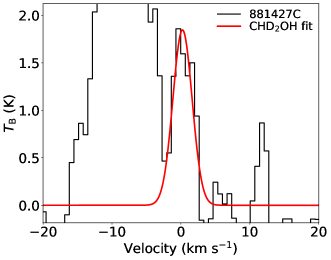
Integrated intensity maps of the CH3OH , CH2DOH , and CHD2OH lines for the source 881427 are presented in Fig. 1. The source 881427 hosts three nearby hot cores with varying line strengths and line widths and is a representative source of the rest of the sample. Whereas the emission of CH3OH is often larger than the central beam, the emission of both CH2DOH and CHD2OH is generally confined within the central beam similar to the 13C and 18O isotopologues. The main exception for this is CH2DOH ( K) which often shows more extended emission. This is likely because the low upper energy level of this line is also sensitive to cold ( K) material where methanol is nonthermally desorbed from the grains (e.g., Perotti et al., 2020, 2021). To exclude the contribution of extended emission, this transition is not included in the analysis described below.
The spectra are extracted from the peak pixel in the CH3OH ( K) integrated intensity maps for all sources that show this at the level. This line is strongest transition of CH3OH in the sample with K (lines with lower can suffer from contamination by the outflow or extended emission). For sources that do not show emission from the CH3OH line, spectra are extracted from the peak continuum pixel and only upper limits on the column densities of CH3OH (and isotopologues) are derived. In the G323.7399-00.2617B cluster, which contains seven nearby cores, all spectra are extracted from the same positions as van Gelder et al. (2022). In G023.3891+00.1851, the emission of CH2DOH peaks offset by about half the beam () and therefore the spectrum is extracted from the peak of CH2DOH ( K). For all other sources, the the peak in CH3OH coincides with the peaks of CH2DOH and CHD2OH. For sources also included by Nazari et al. (2022), our spectral extraction locations are the same as theirs, which are extracted from the peak position of the CH3CN integrated intensity maps, except for 721992 and G023.3891+00.1851 where the CH3OH and CH2DOH emission peaks offset from the CH3CN emission by about . It is important to note that these spectral extraction positions are different by up to from van Gelder et al. (2022) who extracted their spectra from the peak continuum pixel for all sources. Therefore, the column densities derived in this work may deviate from theirs. The reason why our spectra are extracted from the peak pixel of CH3OH is to have the highest signal-to-noise in methanol lines and its isotopologues the extracted spectra.
2.2 Deriving the column densities
The column densities of all methanol isotopologues are derived using the spectral analysis tool CASSIS222http://cassis.irap.omp.eu/ (Vastel et al., 2015) under the assumption of local thermodynamic equilibrium (LTE). The line lists of CH3OH, 13CH3OH, and CHOH are taken from the CDMS catalog333https://cdms.astro.uni-koeln.de/ (Müller et al., 2001, 2005; Endres et al., 2016). These entries include the first three (CH3OH) and two (13CH3OH and CHOH) torsional states and are based on the works of Xu et al. (2008), Xu & Lovas (1997), and Fisher et al. (2007), respectively. The difference between the statistical weight factors of 13CH3OH () and CHOH and CH3OH () is correctly taken into account in the CDMS database entries and therefore does not affect any column densities derived in this work. The line list of CH2DOH is taken from the JPL catalog444https://spec.jpl.nasa.gov/ (Pickett et al., 1998), where the entry is based on the work of Pearson et al. (2012). The line list of CHD2OH is taken from Drozdovskaya et al. (2022), which is mostly based on the the work of Coudert et al. (2021).
Only transitions with K are used to derive the column densities since lines with lower likely include also emission from non-thermally desorbed methanol and emission possibly related to outflows. For 13CH3OH, the ( K) transition gives the only constraint on the column density for many sources as the other transitions suffer from severe line blending. Similarly, for CHOH only the ( K) and ( K) transitions provide constraints on the column density as well as some information on the excitation temperature. Furthermore, for CH2DOH the ( K) line, as well as several other lines, have rather low Einstein values ( s-1) and are often blended with other COMs. Moreover, the spectroscopy of the CH2DOH line is unreliable and shows large discrepancies in between the JPL catalog entry ( s-1) and that derived by Coudert et al. (2014, s-1) and is therefore also excluded from the analysis. Consequently, the ( K) transition of CH2DOH provided the best constraint on the column density of CH2DOH. However, although the ( K) transition is excluded from the fitting, it can provide information on the excitation temperature of CH2DOH as the best-fit LTE model should not overproduce this line. Lastly, for CHD2OH, the ( K) transition is the only detected line in our sample and therefore is the only constraint on the column density of CHD2OH.
As a consequence of only single or a few lines being available, the excitation temperature is fixed to 150 K, which is roughly the mean temperature as measured toward other high-mass hot cores (e.g., Neill et al., 2013; Belloche et al., 2016; Bøgelund et al., 2018, 2019). However, if clear anticorrelations between the best-fit LTE model and the data were present, the excitation temperature was varied by eye in steps of 25 K until the anticorrelations disappear in a similar way as the by eye fit method of Nazari et al. (2021, see their Appendix C).
The column densities of 13CH3OH, CHOH, CH2DOH, and CHD2OH are derived following a similar method as van Gelder et al. (2020). A grid of and the full width at half maximum (FWHM) of the line is set and a model spectrum is computed for each grid point assuming LTE conditions. The size of the emitting region is fixed to the size of the beam (see Appendix B). Blended lines are excluded from the fitting procedure and similarly broad lines ( km s-1) and lines with K are excluded in the fit to exclude any emission possibly related to outflows. The best-fit column density and the uncertainty are computed from the grid for each isotopologue. The main contributors to the uncertainty of are the uncertainty on the flux calibration of ALMA (assumed to be 10%) and the assumed excitation temperature. However, changing the excitation temperature in the 100-300 K range leads to at most a factor 3 variation in the derived column densities. For several sources (e.g., 705768), the lines are broad ( km s-1) making automated line fitting complicated. For these sources the column density is estimated using the by eye fitting method of Nazari et al. (2021). In this case, a 50% uncertainty on the column density is assumed. Moreover, the sources 101899, 615590, 865468, and G345.5043+00.3480 showed line profiles consisting of multiple components. The column density of each component is derived and reported separately.
For all sources, the column density of CH3OH is derived from CHOH and, when no lines originating from CHOH were detected, from 13CH3OH. The adopted and ratios are dependent on the galactocentric distance and are determined using the relations of Milam et al. (2005) and Wilson & Rood (1994), respectively. In cases where only upper limits on the column densities of both 13CH3OH and CHOH could be derived, the range in was calculated by setting the 3 upper limit based on scaling the 3 upper limit of 13CH3OH and the lower limit based on the main isotopologue. Lastly, when CH3OH was not detected, the 3 upper limit is derived directly from CH3OH lines.
3 Results
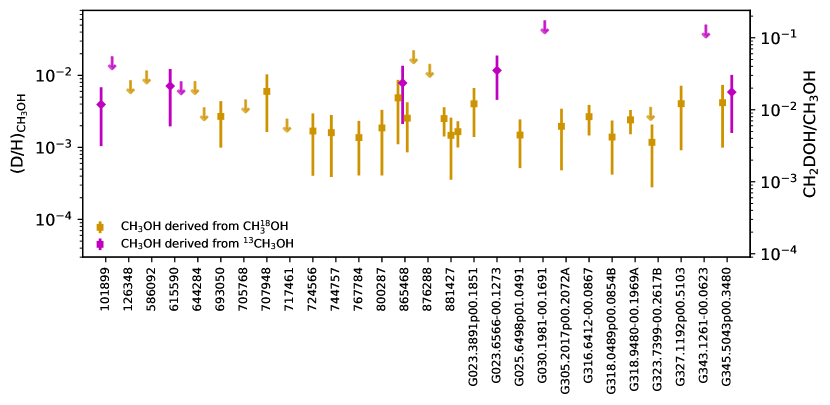
The derived column densities of all isotopologues are presented in Table LABEL:tab:D_H_columns for the reported excitation temperature. In Fig. 2, the best-fit models to the CH2DOH and CHD2OH lines are presented for three hot cores in 881427 (see Fig. 1). Toward 25 sources, at least one clean unblended line of CH2DOH is detected at the level, allowing for the determination of the column density. For the remaining 74 sources where no (unblended) transitions of CH2DOH are detected, the upper limit is reported. For CHD2OH, the column density could be determined for 11 sources. In Table LABEL:tab:D_H_columns, the column densities of 13CH3OH, CHOH, and CH3OH are also reported.
The column densities of CH2DOH are generally between one and three orders of magnitude lower than those of CH3OH, see also Fig. 3. Furthermore, the column densities of CHD2OH are about a factor 3–10 lower than that of CH2DOH, see Fig. 4. In order to translate the column density ratios to the D/H ratios, statistical weighting has to be taken into account since a deuterium atom has a three times higher probability to land in the CH3 group compared to the OH group. Therefore, the D/H ratios of CH3OH and CH2DOH can be derived through,
| (2) | ||||
| (3) |
The derived D/H ratios are also listed in Table LABEL:tab:D_H_columns.
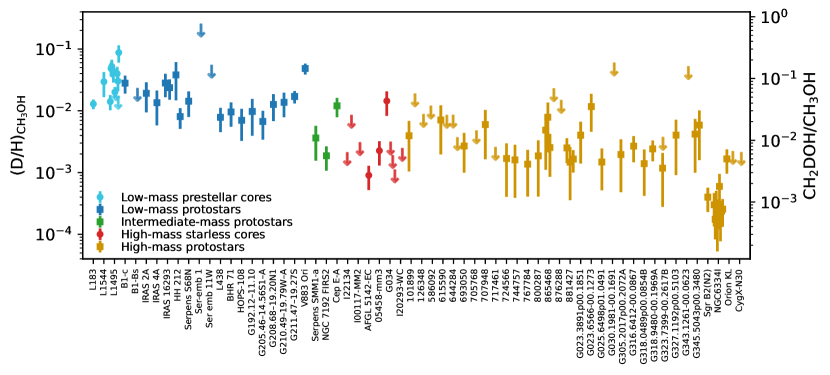
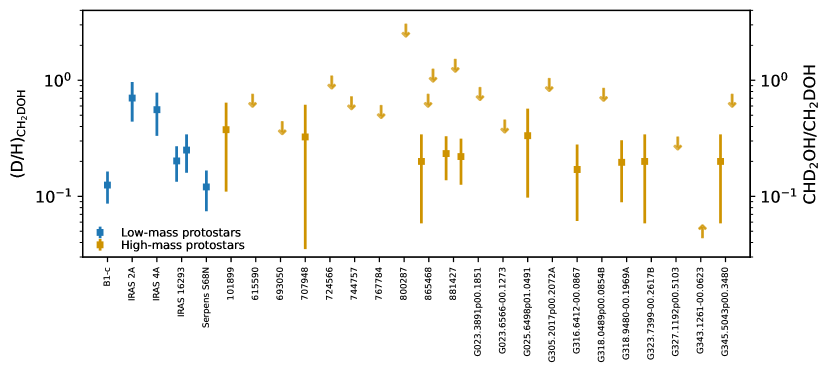
The resulting and ratios are presented in Figs. 3 and 4, respectively. Including upper limits, a (limit on the) and ratios could be derived for 38 and 26 of the 99 studied sources, respectively. Besides the ALMAGAL sources, also other classical high-mass hot cores such as Sgr B2(N2) (Belloche et al., 2016), NGC 6334I (Bøgelund et al., 2018), Orion KL (Neill et al., 2013), and CygX-N30 (van der Walt et al., 2021) are included in Figs. 3 and 4. Only sources where is derived from the 13C or 18O isotopologues are included in Fig. 3 to ensure that is not underestimated. The ratios lie mostly in the range. Interestingly, all the ALMAGAL sources and Orion KL show higher ratios () than Sgr B2(N2) and NGC 6334I (). No clear correlation between the detection of CH2OH or the derived and protostellar parameters such as and envelope mass is present among the high-mass sources. Excluding upper limits, the average ratio is . This is almost two orders of magnitude higher than the D/H ratio in the local ISM of (Linsky et al., 2006; Prodanović et al., 2010), suggesting effective deuteration in the cold high-mass prestellar phases. However, both the range of observed values and the average is more than one order of magnitude lower than what is generally observed toward low-mass sources (, e.g., Bianchi et al., 2017a, b, 2020; Jacobsen et al., 2019; van Gelder et al., 2020, see Sect. 4.1 for further discussion).
Interestingly, the ratio (Eq. (3)) is significantly higher than the ratio, see Fig. 4. For the high-mass sources, only ALMAGAL datapoints are shown since no other interferometric studies of CHD2OH in high-mass protostellar systems are available. The derived ratios lie mostly in the range, with an average of , which is more than two orders of magnitude higher than the ratio. Furthermore, this indicates that about 1/5 of the single deuterated methanol molecules gets successively deuterated further toward CH2DOH in high-mass protostellar systems. This is in good agreement with low-mass protostellar systems where about 1/4 of the CH2DOH is successively deuterated toward CHD2OH (Drozdovskaya et al., 2022).
4 Discussion
4.1 Methanol deuteration from low to high mass
In this work, a (limit on the) ratio could be derived for 38 of the 99 studied high-mass sources. Since large samples of both low-mass and high-mass protostellar systems with methanol D/H values are now available, a more significant comparison over the mass regime can be made. In Fig. 3, also ratios derived for both low-mass prestellar cores and high-mass starless cores are included. It is evident that the ratio is lower in high-mass hot cores () than in their low-mass counterpart (). Intermediate-mass protostars show values in between (), but this subsample only consists of three sources (NGC 7192 FIR2, Cep E-A, and Serpens SMM1-a, Fuente et al., 2014; Ospina-Zamudio et al., 2018; Ligterink et al., 2022, the D/H ratio of NGC 7192 FIR2 is taken from the beam averaged values). However, interestingly the ratio seems very similar between low-mass protostars and high-mass protostars (, see Fig. 4). Among the low-mass sources, IRAS 2A and IRAS 4A show somewhat elevated , but these were derived using older spectroscopic data of CHD2OH (Taquet et al., 2019).
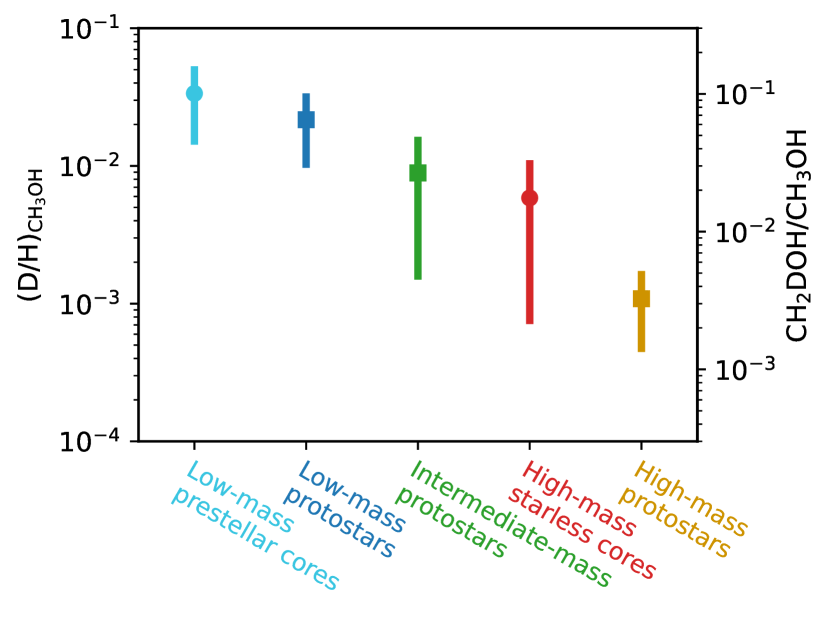
In Fig. 5, the mean ratio is presented for low-mass, intermediate-mass, and high-mass protostellar systems. The average ratio for high-mass hot cores () lies more than one order of magnitude lower than the average ratio for low-mass hot corinos (), with the average for intermediate-mass protostars in between (). A similar trend is seen for the high-mass and low-mass prestellar phases where the average ratios are and , respectively. The lower ratio in both high-mass hot cores and high-mass prestellar phases compared to their lower-mass counterparts suggests a lower deuteration efficiency already in the high-mass prestellar phases (see Sect. 4.3).
The methanol D/H ratios derived in low-mass prestellar cores agree well with those derived for low-mass protostars (see Fig. 3). Since CH3OH is formed through the hydrogenation of CO ice (e.g., Watanabe & Kouchi, 2002; Fuchs et al., 2009; Simons et al., 2020; Santos et al., 2022), this is a strong indication for inheritance of methanol and other COMs ices between low-mass prestellar phases and protostars. On the other hand, the average ratio for high-mass starless cores () seems to be about a factor of five higher than that for high-mass protostars (). However, the average of the high-mass starless cores has a large errorbar since it is based on three detections of which one (G034-G2(MM2)) has a high ratio of (Fontani et al., 2015). The other two detections (AFGL 5142-EC and 0548-mm3; Fontani et al., 2015) and all the upper limits show which agree well with most of the ALMAGAL sources as well as with Orion KL (Neill et al., 2013). Only Sgr B2(N2) and most of the cores in NGC 6334I show slightly lower D/H ratios at the level. This therefore also suggests inheritance of methanol ice from the high-mass prestellar phase to the protostellar phase.
4.2 Singly vs doubly deuterated methanol
As evident from Figs. 3 and 4, the methanol D/H ratio derived for CH2DOH is significantly higher than that derived for CH3OH. The average ratio is about two orders of magnitude higher () than . In contrast to , this is in good agreement with the average of for low-mass protostars, suggesting that successive deuteration happens almost equally effective in both low-mass and high-mass systems.
Having higher D/H ratios for the doubly deuterated isotopologue compared with singly deuterated isotopologue is not unique to methanol. For water, the D2O/HDO ratios are on the order of (e.g., Coutens et al., 2014; Jensen et al., 2021), which is about an order of magnitude higher than typical HDO/H2O ratios (; Persson et al., 2014; Jensen et al., 2019; van’t Hoff et al., 2022). This difference was attributed to be the result of layered ice chemistry (Dartois et al., 2003; Furuya et al., 2016), where the bulk of the water ice is formed in the warmer translucent cloud phase with a low D/H ratio whereas the surface layers formed in the cold prestellar phases show higher D/H ratios. However, methanol is thought to only start forming in the cold prestellar phases where CO is frozen out (e.g., Watanabe & Kouchi, 2002; Fuchs et al., 2009) with little to no formation in the warmer translucent phases. Indeed, also for a direct precursor of CH3OH on the surface of dust grains, H2CO, the D2CO/HDCO ratio in IRAS 16293-2422 points toward a high D/H ratio of % compared to a much lower D/H ratio derived from HDCO/H2CO (%; Persson et al., 2018). Small variations in temperature in the 10–20 K range can change the D/H ratio of ice mantle species such as methanol (see Sect. 4.3), but this should affect both CH2DOH and CHD2OH in a similar way and should therefore not lead to the observed difference.
One possible explanation could be the optical depth of CH2DOH. In the low-mass source L1551 IRS5, the emission of CH2DOH (as well as 13CH3OH) was suggested to be optically thick (Bianchi et al., 2020). However, since the ratios derived from CH2DOH clearly show lower values in high-mass protostellar systems compared to their lower-mass counterpart (see Sect. 4.1), this does not seem like a viable solution. Very recently, spectroscopic data for 13CH2DOH has become available (Ohno et al., 2022), but these do not yet include a calculation of the partition function and line properties such as . When assuming that the source size is equal to the beam size, the line optical depth of the most constraining transition, (, K) is . Only for source sizes smaller than does CH2DOH become marginally optically thick () for the most line rich sources. Also, the ratios where was derived from the possibly optically thick 13C isotopologue are on average less than a factor higher than the ratios where could be derived using the optically thin 18O isotopologue (see Fig. 8).
A more realistic explanation is that successive deuteration of molecules is more effective than the first deuteration. This explanation is supported by several laboratory studies performed at low temperatures of 10–20 K (e.g., Nagaoka et al., 2005, 2007; Hidaka et al., 2009). Drozdovskaya et al. (2022) showed that their observed ratio as derived from CH2DOH for the low-mass binary IRAS 16293-2422 could be well explained by these experiments whereas CHD2OH and CD3OH were overproduced by the experiments. The latter could be the result of the high atomic D/H flux of 0.1 used in the laboratory studies in contrast to the ISM value of , although the atomic D/H ratio is enhanced in cold dense prestellar cores. Assuming that the ratio is a direct representative of the gaseous atomic D/H ratio available in the prestellar phases (i.e., that H/D addition reactions are equally effective), a D/H flux of may be more realistic for high-mass cold dense cores.
4.3 Linking the methanol D/H to the physical conditions during formation
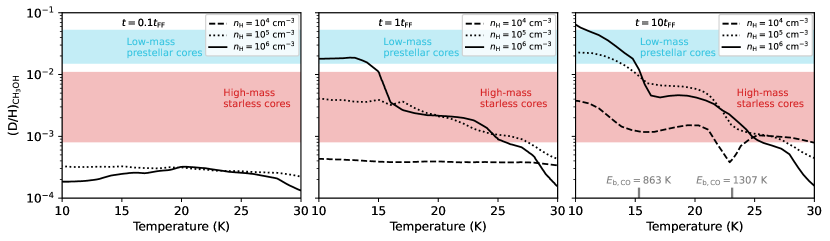
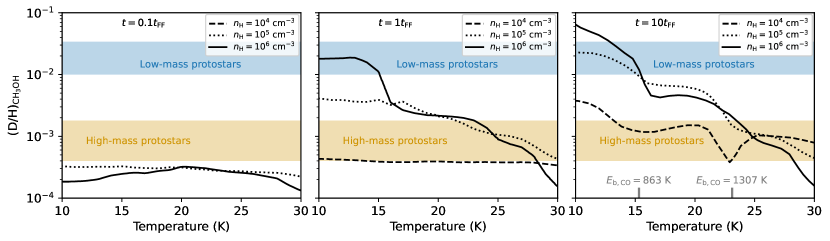
Given the sensitivity of the methanol deuteration process to both temperature and density (i.e., CO freeze-out), the measured methanol D/H ratios are linked to these physical properties during the prestellar phases. To quantify this for the protostellar systems studied in this work, the observed D/H ratios are compared to the astrochemical gas-grain models presented by Bøgelund et al. (2018) and Taquet et al. (2019). These works used the GRAINOBLE model (Taquet et al., 2012, 2013, 2014) to test the effect of the dust and gas temperature (assumed to be equal) and hydrogen density on the resulting ratio in the ices during the prestellar phases. In this work, we compare our results to their results and therefore only a brief description of the model is presented.
In GRAINOBLE, the gas-ice chemistry is computed in three phases: the bulk ice, the ice surface layers, and in the gas phase, following the approach initially presented by Hasegawa & Herbst (1993). The model includes both adsorption and desorption reactions and computes the rate equations in each phase. The chemical network used for the gas-phase chemistry is described in Taquet et al. (2014) and includes both ion-neutral chemistry and all molecules relevant for the chemistry of methanol (e.g., CO, HCO, H2CO). Moreover, the model computes the deuteration of ice species based on laboratory experiments and includes both the hydrogenation (with both H and D atoms) reactions leading to methanol as well as hydrogen/deuterium abstraction reactions in low temperature ( K) conditions (Hidaka et al., 2009).
The effect of and on the resulting methanol D/H ratio is presented in Fig. 6 as computed by Bøgelund et al. (2018) and Taquet et al. (2019). For a constant temperature and density, the chemistry is evolved over a timescale indicated on the top of each panel, where the free-fall timescale is , , and years for , , and cm-3, respectively. For the longest timescales (), it is evident that for all densities the methanol D/H ratio drops with increasing temperature. The strongest decrease is seen for cm-3, where the methanol D/H ratio decreases from for K to as low as when K. A similar trend is visible for cm-3 where the D/H ratio decreases from for K to at K. The decreasing D/H ratios for both these densities is the direct consequence of the decrease of atomic deuterium enhancement in Eq. (1) with increasing temperature. For cm-3, the methanol D/H ratio also decreases with temperature, but only by a factor between K.
Another interesting trend is that for decreasing timescales (i.e., moving from right to left in Fig. 6), the D/H ratio at a given temperature also drops for all densities. The strongest drops are seen for the higher density cases at low temperatures ( K) where the D/H ratio drops two orders of magnitude from toward . This is the direct result of having less time where CO is frozen out and hence less time to deuterate ice species such as methanol. For higher temperatures ( K), this effect is less evident since significantly less CO freezes out, although a slightly higher binding energy of CO (up to K; Noble et al., 2012) could result in CO frozen out till higher temperatures of K and hence a higher deuteration efficiency also above 20 K. However, even when CO does not freeze out, CO molecules can still land on the grain for a short period and react with H or D atoms toward HCO, H2CO, and eventually (deuterated) methanol. This effect is most efficient for higher densities of cm-3 and reduces when timescales smaller than the free-fall timescale are considered. For the lowest density of cm-3, this effect is most evident since the CO freeze-out timescale is the highest and therefore the methanol deuteration is hampered the most.
Overplotted in Fig. 6 are the observed methanol ratios for both low-mass and high-mass protostars. It is evident that the observed ratios suggest a different temperature during methanol formation or different prestellar phase lifetimes for low-mass and high-mass protostars. For high-mass protostars, a temperature of K is needed when the density is larger than cm-3 and the timescale of the high-mass prestellar phase is . A lower temperature of K at low densities of cm-3 can also explain the observed methanol D/H ratio toward high-mass protostars, but such low densities in the dense high-mass starless phase are unlikely. Alternatively, the temperature in the high-mass prestellar phases can be in the K range with a lifetime of . For prestellar lifetimes much smaller than the free-fall timescale, any temperature can explain the observed methanol deuteration toward high-mass protostars.
Contrary to the high-mass protostars, the observed ratio for low-mass protostars suggests both a temperature of K and a prestellar phase duration longer than . Furthermore, the observed methanol D/H ratio for low-mass protostars can not be explained by a low density of cm-3 at any modeled timescale.
It is important to note that the methanol D/H ratio is observed in the gas phase with ALMA whereas the GRAINOBLE models predict the ice abundances in the prestellar phases. Several processes can affect the D/H ratio as the ices warm up while infalling toward the protostar (e.g., Ratajczak et al., 2009; Faure et al., 2015). However, one of the likely dominant processes, CH2DOH formation through H-D substitution in methanol ice (Nagaoka et al., 2005) is included in the model but this does not dominate over hydrogenation of CO.
These results thus suggest that the high-mass prestellar phases are generally either warm ( K) or short () while the low-mass prestellar phases are colder ( K) and long (). The observed methanol D/H ratios toward high-mass starless cores and low-mass prestellar cores also fit this picture, see Fig. 9. On the other hand, the spread in observed abundance ratios of nitrogen-bearing COMs suggests that the scatter in timescales of high-mass prestellar phases is rather small and similar to that of low-mass prestellar phases (Nazari et al., 2022), implying that warmer high-mass pre-stellar phases are a more likely explanation. One possible explanation for the discrepancy between the low-mass and high-mass methanol D/H ratios could be that high-mass stars generally form in clusters with other nearby high-mass stars that heat the surrounding cloud which can affect the D/H ratios molecules forming in the ices (e.g., such as seen for water toward low-mass protostars; Jensen et al., 2019). The majority of the sources studied in this work are located in a clustered environments but these do not show significantly lower D/H ratios than high-mass sources that are single sources at our angular resolution. More modeling work similar to those performed by Bøgelund et al. (2018) and Taquet et al. (2019) including CHD2OH is needed to further test these hypotheses.
5 Conclusion
In this work, (limits on) the D/H ratios of CH3OH and CH2DOH are determined for 38 and 26 sources, respectively, out of the 99 studied sources using ALMA observations of CH2DOH, CHD2OH, CH3OH, 13CH3OH, and CHOH. The derived and ratios are compared to each other as well as to other high-mass protostars, low-mass protostars, and both low-mass and high-mass prestellar phases. Furthermore, comparison with the gas-grain chemical code GRAINOBLE links the observed D/H ratios to the temperature during methanol formation and the lifetime of the prestellar phases. The main conclusions of this work are as follows:
-
•
The ratios of the high-mass protostars studied in this work lie in the range. Combining our sample with other high-mass protostars studied with ALMA, an average ratio of is derived. This is in good agreement with the ratio derived for high-mass starless cores (), but is more than an order of magnitude lower than the average ratio for low-mass protostars () and low-mass prestellar cores ().
-
•
For , significantly higher values than are found ranging from 0.1–1 with an average of . The latter is good agreement with results on low-mass protostars and suggests that about 1/5 singly deuterated methanol molecules gets successively deuterated further independent of the mass of the system.
-
•
Based on a comparison with GRAINOBLE models in the literature, the lower ratios toward high-mass protostars suggest either a temperature of K in the high-mass prestellar phases or a short lifetime () of the high-mass prestellar phases. This is in strong contrast with the low-mass sources for which the higher ratio can only be achieved when the low-mass prestellar phases are both cold ( K) and long lived ().
This work demonstrates that the deuteration of the CH3-group of methanol as measured toward protostellar systems could be used to probe the physical conditions (e.g., temperature) of the prestellar phases. The discrepancy in between low-mass and high-mass sources indicates that the physical conditions are already different before the onset of star formation. Additional observations of multiple deuterated methanol isotopologues (e.g., CHD2OH, CD3OH) as well as CH3OD will shed further light on the efficiency of methanol deuteration between low-mass and high-mass systems. In combination with additional modeling studies (such as those performed by Bøgelund et al., 2018; Taquet et al., 2019; Kulterer et al., 2022), this can provide further insight on the relevant deuterium chemistry and how the D/H ratio varies across the protostellar mass range.
Acknowledgements.
The authors would like to thank the anonymous referee for their constructive comments on the manuscript and L. Coudert for discussions on the CH2DOH spectroscopy. This paper makes use of the following ALMA data: ADS/JAO.ALMA#2017.1.01174.S, ADS/JAO.ALMA#2019.1.00195.L. ALMA is a partnership of ESO (representing its member states), NSF (USA) and NINS (Japan), together with NRC (Canada), MOST and ASIAA (Taiwan), and KASI (Republic of Korea), in cooperation with the Republic of Chile. The Joint ALMA Observatory is operated by ESO, AUI/NRAO and NAOJ. Astrochemistry in Leiden is supported by the Netherlands Research School for Astronomy (NOVA), by funding from the European Research Council (ERC) under the European Union’s Horizon 2020 research and innovation programme (grant agreement No. 101019751 MOLDISK), and by the Dutch Research Council (NWO) grants TOP-1 614.001.751, 648.000.022, and 618.000.001. Support by the Danish National Research Foundation through the Center of Excellence “InterCat” (Grant agreement no.: DNRF150) is also acknowledged.References
- Aikawa & Herbst (1999) Aikawa, Y. & Herbst, E. 1999, ApJ, 526, 314
- Ambrose et al. (2021) Ambrose, H. E., Shirley, Y. L., & Scibelli, S. 2021, MNRAS, 501, 347
- Belloche et al. (2016) Belloche, A., Müller, H. S. P., Garrod, R. T., & Menten, K. M. 2016, A&A, 587, A91
- Bianchi et al. (2020) Bianchi, E., Chandler, C. J., Ceccarelli, C., et al. 2020, MNRAS, 498, L87
- Bianchi et al. (2017a) Bianchi, E., Codella, C., Ceccarelli, C., et al. 2017a, MNRAS, 467, 3011
- Bianchi et al. (2017b) Bianchi, E., Codella, C., Ceccarelli, C., et al. 2017b, A&A, 606, L7
- Bizzocchi et al. (2014) Bizzocchi, L., Caselli, P., Spezzano, S., & Leonardo, E. 2014, A&A, 569, A27
- Bøgelund et al. (2019) Bøgelund, E. G., Barr, A. G., Taquet, V., et al. 2019, A&A, 628, A2
- Bøgelund et al. (2018) Bøgelund, E. G., McGuire, B. A., Ligterink, N. F. W., et al. 2018, A&A, 615, A88
- Brown & Millar (1989) Brown, P. D. & Millar, T. J. 1989, MNRAS, 237, 661
- Caselli & Ceccarelli (2012) Caselli, P. & Ceccarelli, C. 2012, A&A Rev., 20, 56
- Ceccarelli et al. (2014) Ceccarelli, C., Caselli, P., Bockelée-Morvan, D., et al. 2014, in Protostars and Planets VI, ed. H. Beuther, R. S. Klessen, C. P. Dullemond, & T. Henning, 859
- Chahine et al. (2022) Chahine, L., López-Sepulcre, A., Neri, R., et al. 2022, A&A, 657, A78
- Coudert et al. (2021) Coudert, L. H., Motiyenko, R. A., Margulès, L., & Tchana Kwabia, F. 2021, Journal of Molecular Spectroscopy, 381, 111515
- Coudert et al. (2014) Coudert, L. H., Zemouli, M., Motiyenko, R. A., Margulès, L., & Klee, S. 2014, J. Chem. Phys., 140, 064307
- Coutens et al. (2014) Coutens, A., Jørgensen, J. K., Persson, M. V., et al. 2014, ApJ, 792, L5
- Dartois et al. (2003) Dartois, E., Thi, W. F., Geballe, T. R., et al. 2003, A&A, 399, 1009
- Drozdovskaya et al. (2022) Drozdovskaya, M. N., Coudert, L. H., Margulès, L., et al. 2022, A&A, 659, A69
- Drozdovskaya et al. (2021) Drozdovskaya, M. N., Schroeder I, I. R. H. G., Rubin, M., et al. 2021, MNRAS, 500, 4901
- Elia et al. (2021) Elia, D., Merello, M., Molinari, S., et al. 2021, MNRAS, 504, 2742
- Elia et al. (2017) Elia, D., Molinari, S., Schisano, E., et al. 2017, MNRAS, 471, 100
- Endres et al. (2016) Endres, C. P., Schlemmer, S., Schilke, P., Stutzki, J., & Müller, H. S. P. 2016, Journal of Molecular Spectroscopy, 327, 95
- Faure et al. (2015) Faure, A., Faure, M., Theulé, P., Quirico, E., & Schmitt, B. 2015, A&A, 584, A98
- Fisher et al. (2007) Fisher, J., Paciga, G., Xu, L.-H., et al. 2007, Journal of Molecular Spectroscopy, 245, 7
- Fontani et al. (2015) Fontani, F., Busquet, G., Palau, A., et al. 2015, A&A, 575, A87
- Fuchs et al. (2009) Fuchs, G. W., Cuppen, H. M., Ioppolo, S., et al. 2009, A&A, 505, 629
- Fuente et al. (2014) Fuente, A., Cernicharo, J., Caselli, P., et al. 2014, A&A, 568, A65
- Furuya et al. (2016) Furuya, K., van Dishoeck, E. F., & Aikawa, Y. 2016, A&A, 586, A127
- Hasegawa & Herbst (1993) Hasegawa, T. I. & Herbst, E. 1993, MNRAS, 263, 589
- Hidaka et al. (2009) Hidaka, H., Watanabe, M., Kouchi, A., & Watanabe, N. 2009, ApJ, 702, 291
- Hsu et al. (2022) Hsu, S.-Y., Liu, S.-Y., Liu, T., et al. 2022, ApJ, 927, 218
- Ilyushin et al. (2022) Ilyushin, V. V., Müller, H. S. P., Jørgensen, J. K., et al. 2022, A&A, 658, A127
- Jacobsen et al. (2019) Jacobsen, S. K., Jørgensen, J. K., Di Francesco, J., et al. 2019, A&A, 629, A29
- Jensen et al. (2021) Jensen, S. S., Jørgensen, J. K., Kristensen, L. E., et al. 2021, A&A, 650, A172
- Jensen et al. (2019) Jensen, S. S., Jørgensen, J. K., Kristensen, L. E., et al. 2019, A&A, 631, A25
- Jørgensen et al. (2018) Jørgensen, J. K., Müller, H. S. P., Calcutt, H., et al. 2018, A&A, 620, A170
- Kulterer et al. (2022) Kulterer, B. M., Drozdovskaya, M. N., Antonellini, S., Walsh, C., & Millar, T. J. 2022, ACS Earth and Space Chemistry, 6, 1171
- Lattanzi et al. (2020) Lattanzi, V., Bizzocchi, L., Vasyunin, A. I., et al. 2020, A&A, 633, A118
- Lee et al. (2019a) Lee, C.-F., Codella, C., Li, Z.-Y., & Liu, S.-Y. 2019a, ApJ, 876, 63
- Lee et al. (2019b) Lee, J.-E., Lee, S., Baek, G., et al. 2019b, Nature Astronomy, 3, 314
- Ligterink et al. (2021) Ligterink, N. F. W., Ahmadi, A., Coutens, A., et al. 2021, A&A, 647, A87
- Ligterink et al. (2022) Ligterink, N. F. W., Ahmadi, A., Luitel, B., et al. 2022, ACS Earth and Space Chemistry, 6, 455
- Linsky et al. (2006) Linsky, J. L., Draine, B. T., Moos, H. W., et al. 2006, ApJ, 647, 1106
- Manigand et al. (2020) Manigand, S., Jørgensen, J. K., Calcutt, H., et al. 2020, A&A, 635, A48
- Martín-Doménech et al. (2021) Martín-Doménech, R., Bergner, J. B., Öberg, K. I., et al. 2021, ApJ, 923, 155
- Martín-Doménech et al. (2019) Martín-Doménech, R., Bergner, J. B., Öberg, K. I., & Jørgensen, J. K. 2019, ApJ, 880, 130
- McMullin et al. (2007) McMullin, J. P., Waters, B., Schiebel, D., Young, W., & Golap, K. 2007, in Astronomical Society of the Pacific Conference Series, Vol. 376, Astronomical Data Analysis Software and Systems XVI, ed. R. A. Shaw, F. Hill, & D. J. Bell, 127
- Mège et al. (2021) Mège, P., Russeil, D., Zavagno, A., et al. 2021, A&A, 646, A74
- Milam et al. (2005) Milam, S. N., Savage, C., Brewster, M. A., Ziurys, L. M., & Wyckoff, S. 2005, ApJ, 634, 1126
- Molinari et al. (2010) Molinari, S., Swinyard, B., Bally, J., et al. 2010, A&A, 518, L100
- Müller et al. (2016) Müller, H. S. P., Belloche, A., Xu, L.-H., et al. 2016, A&A, 587, A92
- Müller et al. (2005) Müller, H. S. P., Schlöder, F., Stutzki, J., & Winnewisser, G. 2005, Journal of Molecular Structure, 742, 215
- Müller et al. (2001) Müller, H. S. P., Thorwirth, S., Roth, D. A., & Winnewisser, G. 2001, A&A, 370, L49
- Nagaoka et al. (2005) Nagaoka, A., Watanabe, N., & Kouchi, A. 2005, ApJ, 624, L29
- Nagaoka et al. (2007) Nagaoka, A., Watanabe, N., & Kouchi, A. 2007, Journal of Physical Chemistry A, 111, 3016
- Nazari et al. (2022) Nazari, P., Meijerhof, J., van Gelder, M., & van Dishoeck, E. F. 2022, A&A, submitted
- Nazari et al. (2021) Nazari, P., van Gelder, M. L., van Dishoeck, E. F., et al. 2021, A&A, 650, A150
- Neill et al. (2013) Neill, J. L., Crockett, N. R., Bergin, E. A., Pearson, J. C., & Xu, L.-H. 2013, ApJ, 777, 85
- Noble et al. (2012) Noble, J. A., Congiu, E., Dulieu, F., & Fraser, H. J. 2012, MNRAS, 421, 768
- Ohno et al. (2022) Ohno, Y., Oyama, T., Tamanai, A., et al. 2022, ApJ, 932, 101
- Ospina-Zamudio et al. (2018) Ospina-Zamudio, J., Lefloch, B., Ceccarelli, C., et al. 2018, A&A, 618, A145
- Parise et al. (2004) Parise, B., Castets, A., Herbst, E., et al. 2004, A&A, 416, 159
- Parise et al. (2002) Parise, B., Ceccarelli, C., Tielens, A. G. G. M., et al. 2002, A&A, 393, L49
- Pearson et al. (2012) Pearson, J. C., Yu, S., & Drouin, B. J. 2012, Journal of Molecular Spectroscopy, 280, 119
- Perotti et al. (2021) Perotti, G., Jørgensen, J. K., Fraser, H. J., et al. 2021, A&A, 650, A168
- Perotti et al. (2020) Perotti, G., Rocha, W. R. M., Jørgensen, J. K., et al. 2020, A&A, 643, A48
- Persson et al. (2018) Persson, M. V., Jørgensen, J. K., Müller, H. S. P., et al. 2018, A&A, 610, A54
- Persson et al. (2014) Persson, M. V., Jørgensen, J. K., van Dishoeck, E. F., & Harsono, D. 2014, A&A, 563, A74
- Pickett et al. (1998) Pickett, H. M., Poynter, R. L., Cohen, E. A., et al. 1998, J. Quant. Spec. Radiat. Transf., 60, 883
- Prodanović et al. (2010) Prodanović, T., Steigman, G., & Fields, B. D. 2010, MNRAS, 406, 1108
- Ratajczak et al. (2009) Ratajczak, A., Quirico, E., Faure, A., Schmitt, B., & Ceccarelli, C. 2009, A&A, 496, L21
- Roberts et al. (2003) Roberts, H., Herbst, E., & Millar, T. J. 2003, ApJ, 591, L41
- Santos et al. (2022) Santos, J. C., Chuang, K.-J., Lamberts, T., et al. 2022, ApJ, 931, L33
- Simons et al. (2020) Simons, M. A. J., Lamberts, T., & Cuppen, H. M. 2020, A&A, 634, A52
- Taquet et al. (2019) Taquet, V., Bianchi, E., Codella, C., et al. 2019, A&A, 632, A19
- Taquet et al. (2012) Taquet, V., Ceccarelli, C., & Kahane, C. 2012, A&A, 538, A42
- Taquet et al. (2014) Taquet, V., Charnley, S. B., & Sipilä, O. 2014, ApJ, 791, 1
- Taquet et al. (2013) Taquet, V., Peters, P. S., Kahane, C., et al. 2013, A&A, 550, A127
- Tielens (1983) Tielens, A. G. G. M. 1983, A&A, 119, 177
- Tielens (2013) Tielens, A. G. G. M. 2013, Reviews of Modern Physics, 85, 1021
- van der Walt et al. (2021) van der Walt, S. J., Kristensen, L. E., Jørgensen, J. K., et al. 2021, A&A, 655, A86
- van Dishoeck et al. (1995) van Dishoeck, E. F., Blake, G. A., Jansen, D. J., & Groesbeck, T. D. 1995, ApJ, 447, 760
- van Gelder et al. (2022) van Gelder, M. L., Nazari, P., Tabone, B., et al. 2022, A&A, 662, A67
- van Gelder et al. (2020) van Gelder, M. L., Tabone, B., Tychoniec, Ł., et al. 2020, A&A, 639, A87
- van’t Hoff et al. (2022) van’t Hoff, M. L. R., Harsono, D., van Gelder, M. L., et al. 2022, ApJ, 924, 5
- Vastel et al. (2015) Vastel, C., Bottinelli, S., Caux, E., Glorian, J. M., & Boiziot, M. 2015, in SF2A-2015: Proceedings of the Annual meeting of the French Society of Astronomy and Astrophysics, 313–316
- Watanabe & Kouchi (2002) Watanabe, N. & Kouchi, A. 2002, ApJ, 571, L173
- Watson (1974) Watson, W. D. 1974, ApJ, 188, 35
- Wilson & Rood (1994) Wilson, T. L. & Rood, R. 1994, ARA&A, 32, 191
- Xu et al. (2008) Xu, L.-H., Fisher, J., Lees, R. M., et al. 2008, Journal of Molecular Spectroscopy, 251, 305
- Xu & Lovas (1997) Xu, L.-H. & Lovas, F. J. 1997, Journal of Physical and Chemical Reference Data, 26, 17
- Yang et al. (2020) Yang, Y.-L., Evans, Neal J., I., Smith, A., et al. 2020, ApJ, 891, 61
Appendix A Transitions of CH3OH and isotopologues
| Species | Transition | Frequency | ||||
|---|---|---|---|---|---|---|
| (J K L M | - | J K L M) | (GHz) | (s-1) | (K) | |
| CH3OH | 6 1 5 3 | - | 7 2 5 3 | 217.2992 | 373.9 | |
| 15 6 9 3 | - | 16 5 11 3 | 217.6427 | 745.6 | ||
| 15 6 10 3 | - | 16 5 12 3 | 217.6427 | 745.6 | ||
| 20 1 19 1 | - | 20 0 20 1 | 217.8865 | 508.4 | ||
| 4 2 3 1 | - | 3 1 2 1 | 218.4401 | 45.5 | ||
| 25 3 23 1 | - | 24 4 20 1 | 219.9837 | 802.2 | ||
| 23 5 18 1 | - | 22 6 17 1 | 219.9937 | 775.9 | ||
| 8 0 8 1 | - | 7 1 6 1 | 220.0786 | 96.6 | ||
| 10 5 6 2 | - | 11 4 8 2 | 220.4013 | 251.6 | ||
| 13CH3OH | 14 1 13 -0 | - | 13 2 12 -0 | 217.0446 | 254.3 | |
| 10 2 8 +0 | - | 9 3 7 +0 | 217.3995 | 162.4 | ||
| 17 7 11 +0 | - | 18 6 12 +0 | 220.3218 | 592.3 | ||
| 17 7 10 -0 | - | 18 6 13 -0 | 220.3218 | 592.3 | ||
| CHOH | 14 1 14 1 | - | 13 2 12 1 | 217.1729 | 238.9 | |
| 18 6 13 4 | - | 17 7 11 4 | 217.9223 | 874.1 | ||
| 17 5 13 4 | - | 18 6 13 4 | 218.5521 | 884.6 | ||
| 4 2 2 2 | - | 3 1 2 2 | 219.4078 | 44.6 | ||
| 8 7 1 5 | - | 7 6 1 5 | 219.8433 | 663.2 | ||
| 18 3 16 5 | - | 19 4 16 5 | 219.9572 | 795.8 | ||
| 8 1 8 1 | - | 7 0 7 1 | 220.1951 | 85.7 | ||
| CH2DOH | 26 4 22 0 | - | 26 3 24 2 | 217.2664 | 817.1 | |
| 26 1 25 2 | - | 26 1 26 2 | 217.3300 | 777.9 | ||
| 17 4 13 2 | - | 16 5 11 1 | 217.3436 | 409.7 | ||
| 17 4 14 2 | - | 16 5 12 1 | 217.3593 | 409.7 | ||
| 23 6 18 1 | - | 22 7 15 0 | 217.3818 | 742.6 | ||
| 23 6 17 1 | - | 22 7 16 0 | 217.3825 | 742.6 | ||
| 18 1 17 2 | - | 18 2 17 0 | 217.4479 | 391.5 | ||
| 25 1 25 2 | - | 25 0 25 1 | 217.6429 | 712.4 | ||
| 12 7 6 0 | - | 13 6 7 1 | 217.6446 | 357.2 | ||
| 12 7 5 0 | - | 13 6 8 1 | 217.6446 | 357.2 | ||
| 18 0 18 0 | - | 17 1 16 2 | 218.1095 | 363.2 | ||
| 5 2 4 1 | - | 5 1 5 1 | 218.3164 | 58.7 | ||
| 24 3 21 1 | - | 24 2 23 2 | 218.5348 | 687.7 | ||
| 20 5 16 1 | - | 19 6 13 0 | 219.2043 | 557.6 | ||
| 20 5 15 1 | - | 19 6 14 0 | 219.2061 | 557.6 | ||
| 5 1 5 1 | - | 4 1 4 1 | 219.5515 | 48.2 | ||
| 5 1 5 0 | - | 4 1 4 0 | 220.0718 | 35.8 | ||
| 29 4 26 0 | - | 29 3 26 2 | 220.3492 | 997.1 | ||
| 17 1 16 0 | - | 17 0 17 0 | 220.5526 | 335.9 | ||
| 21 1 20 1 | - | 21 1 21 1 | 220.6256 | 515.1 | ||
| 21 2 19 2 | - | 21 1 20 2 | 220.7358 | 531.1 | ||
| CHD2OH | 6 2 2 1 | - | 5 1 2 2 | 217.0702 | 61.9 | |
| 13 2 1 2 | - | 12 3 1 2 | 217.1181 | 213.0 | ||
| 16 5 1 2 | - | 17 4 1 0 | 217.2651 | 366.8 | ||
| 7 0 1 2 | - | 6 1 1 2 | 217.4912 | 74.3 | ||
| 7 4 2 1 | - | 8 3 2 0 | 217.4946 | 111.1 | ||
| 7 4 1 1 | - | 8 3 1 0 | 217.5430 | 111.1 | ||
| 24 9 1 1 | - | 25 8 1 0 | 217.8034 | 854.9 | ||
| 24 9 2 1 | - | 25 8 2 0 | 217.8034 | 854.9 | ||
| 2 2 1 1 | - | 3 1 1 0 | 218.0092 | 25.8 | ||
| 7 2 1 0 | - | 7 1 2 0 | 218.1279 | 68.8 | ||
| 16 3 2 2 | - | 15 4 2 2 | 218.2323 | 318.2 | ||
| 20 2 2 2 | - | 20 2 1 1 | 218.4156 | 449.9 | ||
| 11 2 1 2 | - | 11 1 2 2 | 218.4824 | 163.0 | ||
| 12 2 1 2 | - | 12 1 2 2 | 219.2181 | 187.0 | ||
| 23 10 2 2 | - | 24 9 2 2 | 219.3323 | 872.6 | ||
| 23 10 1 2 | - | 24 9 1 2 | 219.3323 | 872.6 | ||
| 16 3 1 0 | - | 15 4 1 0 | 219.3377 | 300.9 | ||
| 22 5 2 0 | - | 22 4 1 2 | 219.6514 | 583.5 | ||
| 22 5 1 0 | - | 22 4 2 2 | 219.7983 | 583.4 | ||
| 13 2 1 0 | - | 12 3 1 0 | 220.2430 | 195.3 | ||
| 11 6 1 1 | - | 12 5 1 1 | 220.5567 | 249.5 | ||
| 11 6 2 1 | - | 12 5 2 1 | 220.5569 | 249.5 | ||
Appendix B Observational details
| Source | RA (J2000) | Dec (J2000) | 111111Derived from using Eq. (2). | 222222Derived from using Eq. (3). | |||||||
|---|---|---|---|---|---|---|---|---|---|---|---|
| ′′ | K | cm-2 | cm-2 | cm-2 | cm-2 | cm-2 | |||||
| 86213A | 18:26:48.92 | -12:26:24.51 | 1.23 | 150 | 3.3(15) | 1.0(15) | 0.4–14.8(16) | 2.1(15) | 2.4(15) | – | – |
| 86213B | 18:26:47.96 | -12:26:20.73 | 1.23 | 150 | 4.0(15) | 1.6(15) | 0.3–17.9(16) | 1.5(15) | 4.0(15) | – | – |
| 86213C | 18:26:48.73 | -12:26:25.98 | 1.23 | 150 | 1.9(15) | 1.1(15) | 0.5–8.7(16) | 1.7(15) | 3.0(15) | – | – |
| 81635A | 18:25:00.82 | -13:15:34.46 | 1.22 | 150 | 3.8(15) | 2.8(15) | 0.1–17.7(16) | 2.5(15) | 4.7(15) | – | – |
| 81635B | 18:25:01.01 | -13:15:38.57 | 1.22 | 150 | 2.7(15) | 1.5(15) | 1.4(15) | 3.1(15) | 2.2(15) | – | – |
| 81635C | 18:25:01.65 | -13:15:28.99 | 1.22 | 150 | 10.0(15) | 1.5(15) | 4.0(15) | 3.6(15) | 4.0(15) | – | – |
| 83968A | 18:25:10.59 | -12:42:22.16 | 1.23 | 150 | 2.2(15) | 1.4(15) | 0.1–10.9(16) | 1.5(15) | 5.2(15) | – | – |
| 83968B | 18:25:10.69 | -12:42:26.14 | 1.23 | 150 | 3.0(15) | 1.2(15) | 1.5(15) | 1.7(15) | 5.1(15) | – | – |
| 83968C | 18:25:10.82 | -12:42:24.68 | 1.23 | 150 | 2.3(15) | 9.9(14) | 0.1–11.3(16) | 1.9(15) | 3.2(15) | – | – |
| 83968D | 18:25:10.62 | -12:42:19.43 | 1.23 | 150 | 2.3(15) | 1.2(15) | 1.3(15) | 3.0(15) | 5.2(15) | – | – |
| 83968E | 18:25:10.65 | -12:42:24.74 | 1.23 | 150 | 2.3(15) | 1.2(15) | 1.3(15) | 2.4(15) | 5.0(15) | – | – |
| 101899 C1 | 18:34:40.29 | -09:00:38.44 | 1.25 | 150 | 1.50.3(16) | 4.0(15) | 6.83.6(17) | 8.04.0(15) | 3.01.5(15) | 3.92.9(-3) | 3.82.7(-1) |
| 101899 C2 | 18:34:40.29 | -09:00:38.44 | 1.25 | 150 | 6.71.5(15) | 4.0(15) | 2.91.6(17) | 6.0(15) | 3.0(15) | 1.5(-2) | – |
| 103421 | 18:33:23.98 | -08:33:31.92 | 1.24 | 150 | 4.3(15) | 1.0(15) | 0.1–1.9(17) | 3.3(15) | 2.4(15) | – | – |
| 106756A | 18:34:23.98 | -07:54:48.26 | 1.23 | 150 | 2.5(15) | 2.7(15) | 0.2–11.2(16) | 3.5(15) | 3.8(15) | – | – |
| 106756B | 18:34:25.55 | -07:54:46.39 | 1.23 | 150 | 4.0(15) | 2.0(15) | 4.2(15) | 3.5(15) | 6.6(15) | – | – |
| 106756C | 18:34:25.59 | -07:54:43.11 | 1.23 | 150 | 1.1(16) | 2.6(15) | 4.3(15) | 3.5(15) | 8.0(15) | – | – |
| 126120A | 18:42:37.55 | -04:02:05.17 | 1.17 | 150 | 1.9(15) | 5.7(14) | 0.5–9.1(16) | 1.7(15) | 2.4(15) | – | – |
| 126120B | 18:42:37.66 | -04:02:07.27 | 1.17 | 150 | 2.0(15) | 7.8(14) | 0.3–9.5(16) | 1.8(15) | 4.1(15) | – | – |
| 126120C | 18:42:36.85 | -04:02:17.66 | 1.17 | 150 | 3.8(15) | 1.8(15) | 5.7(15) | 4.2(15) | 6.3(15) | – | – |
| 126120D | 18:42:37.14 | -04:02:02.37 | 1.17 | 150 | 3.4(15) | 9.8(14) | 1.0(15) | 2.0(15) | 2.9(15) | – | – |
| 126348 | 18:42:51.98 | -03:59:54.37 | 1.16 | 150 | 1.10.3(16) | 3.02.0(15) | 9.46.9(17) | 5.0(15) | 1.7(15) | 6.9(-3) | – |
| 565926A | 08:02:42.97 | -34:31:48.77 | 0.58 | 150 | 5.1(15) | 2.5(15) | 2.5(15) | 4.1(15) | 6.4(15) | – | – |
| 565926B | 08:02:42.94 | -34:31:49.96 | 0.58 | 150 | 5.0(15) | 2.4(15) | 4.5(15) | 6.2(15) | 4.9(15) | – | – |
| 565926C | 08:02:42.72 | -34:31:49.61 | 0.58 | 150 | 5.1(15) | 2.5(15) | 2.5(15) | 4.1(15) | 4.5(15) | – | – |
| 586092A | 08:32:08.70 | -43:13:45.44 | 0.92 | 75 | 5.11.1(15) | 1.50.3(15) | 8.04.5(17) | 1.0(16) | 3.6(15) | 9.4(-3) | – |
| 586092B | 08:32:08.48 | -43:13:49.28 | 0.92 | 150 | 2.9(15) | 1.6(15) | 0.1–2.1(17) | 5.6(15) | 4.3(15) | – | – |
| 586092C | 08:32:09.06 | -43:13:43.28 | 0.92 | 150 | 2.8(15) | 1.7(15) | 2.5(15) | 7.6(15) | 4.8(15) | – | – |
| 615590 C1 | 09:24:41.96 | -52:02:08.04 | 0.64 | 200 | 2.00.5(16) | 5.0(15) | 1.40.7(18) | 3.01.5(16) | 1.0(16) | 7.15.2(-3) | 6.7(-1) |
| 615590 C2 | 09:24:41.96 | -52:02:08.04 | 0.64 | 150 | 1.50.3(16) | 5.0(15) | 1.10.6(18) | 1.0(16) | 1.0(16) | 6.7(-3) | – |
| 640076A | 10:20:15.66 | -58:03:56.32 | 0.87 | 150 | 4.1(15) | 1.2(15) | 0.1–2.9(17) | 4.3(15) | 5.3(15) | – | – |
| 640076B | 10:20:15.60 | -58:03:53.47 | 0.87 | 150 | 4.1(15) | 2.6(15) | 0.1–2.9(17) | 3.0(15) | 6.7(15) | – | – |
| 644284A | 10:31:29.78 | -58:02:19.27 | 0.86 | 150 | 6.21.4(15) | 1.50.3(15) | 4.22.2(17) | 4.0(15) | 3.8(15) | 6.7(-3) | – |
| 644284B | 10:31:29.63 | -58:02:18.82 | 0.86 | 100 | 8.21.8(15) | 1.50.3(15) | 7.84.3(17) | 3.0(15) | 3.9(15) | 2.9(-3) | – |
| 693050 | 12:35:35.05 | -63:02:31.19 | 0.99 | 200 | 1.40.3(16) | 3.10.7(15) | 1.30.8(18) | 1.10.3(16) | 3.0(15) | 2.71.7(-3) | 3.9(-1) |
| 695243 | 12:43:31.51 | -62:36:13.25 | 0.98 | 150 | 4.0(15) | 1.2(15) | 1.8(15) | 5.9(15) | 7.9(15) | – | – |
| 704792 | 13:11:14.14 | -62:45:06.80 | 1.29 | 150 | 4.5(15) | 8.2(14) | 1.2(15) | 4.5(15) | 2.2(15) | – | – |
| 705768 | 13:12:36.17 | -62:33:34.43 | 0.87 | 150 | 9.32.2(15) | 3.01.5(15) | 1.30.8(18) | 6.3(15) | 4.9(15) | 3.7(-3) | – |
| 706733A | 13:14:22.78 | -62:45:59.48 | 0.87 | 150 | 2.7(15) | 1.8(15) | 0.2–16.4(16) | 4.8(15) | 2.9(15) | – | – |
| 706733B | 13:14:22.99 | -62:45:54.35 | 0.87 | 150 | 6.7(15) | 1.5(15) | 2.0(15) | 6.6(15) | 2.9(15) | – | – |
| 706733C | 13:14:23.07 | -62:45:47.54 | 0.87 | 150 | 5.6(15) | 1.8(15) | 2.5(15) | 4.9(15) | 9.0(15) | – | – |
| 706785A | 13:14:26.92 | -62:44:29.72 | 0.88 | 150 | 3.2(15) | 2.1(15) | 0.1–1.9(17) | 6.2(15) | 2.6(15) | – | – |
| 706785B | 13:14:26.55 | -62:44:31.80 | 0.88 | 150 | 3.3(15) | 2.9(15) | 0.0–2.0(17) | 6.0(15) | 3.6(15) | – | – |
| 706785C | 13:14:26.38 | -62:44:30.24 | 0.88 | 150 | 2.7(15) | 1.3(15) | 1.7(15) | 5.9(15) | 9.0(15) | – | – |
| 706785D | 13:14:25.64 | -62:44:30.36 | 0.88 | 150 | 4.4(15) | 3.2(15) | 0.1–2.7(17) | 6.1(15) | 3.7(15) | – | – |
| 707948 | 13:16:43.19 | -62:58:32.83 | 0.88 | 150 | 1.80.4(17) | 1.50.3(16) | 1.10.6(19) | 2.01.0(17) | 6.54.8(16) | 6.04.3(-3) | 3.22.9(-1) |
| 717461A | 13:43:01.68 | -62:08:51.42 | 1.29 | 150 | 7.61.9(15) | 2.60.8(15) | 1.10.4(18) | 3.7(15) | 2.5(15) | 2.0(-3) | – |
| 717461B | 13:43:01.74 | -62:08:55.34 | 1.29 | 150 | 2.2(15) | 1.9(15) | 2.8(15) | 3.8(15) | 3.6(15) | – | – |
| 721992 | 13:51:58.27 | -61:15:41.04 | 0.85 | 150 | 4.4(15) | 1.9(15) | 0.5–2.5(17) | 7.3(15) | 5.5(15) | – | – |
| 724566 | 13:59:30.92 | -61:48:38.27 | 0.83 | 150 | 2.90.6(16) | 1.00.2(16) | 4.02.3(18) | 2.01.0(16) | 9.6(15) | 1.71.3(-3) | 9.6(-1) |
| 732038 | 14:13:15.05 | -61:16:53.19 | 0.82 | 150 | 7.6(15) | 4.8(15) | 1.2–4.2(17) | 6.8(15) | 7.5(15) | – | – |
| 744757A | 14:45:26.35 | -59:49:15.55 | 1.30 | 150 | 1.40.4(16) | 4.10.9(15) | 1.71.0(18) | 8.04.0(15) | 2.5(15) | 1.61.2(-3) | 6.3(-1) |
| 744757B | 14:45:26.16 | -59:49:19.87 | 1.30 | 150 | 1.9(15) | 4.1(15) | 1.3–11.3(16) | 2.9(15) | 2.3(15) | – | – |
| 759150A | 15:10:43.13 | -57:44:49.63 | 1.29 | 150 | 1.9(15) | 1.2(15) | 0.3–10.1(16) | 5.0(15) | 2.3(15) | – | – |
| 759150B | 15:10:43.52 | -57:44:44.82 | 1.29 | 150 | 2.4(15) | 9.6(14) | 1.5(15) | 5.0(15) | 2.8(15) | – | – |
| 759150C | 15:10:44.48 | -57:44:47.33 | 1.29 | 150 | 2.2(15) | 9.6(14) | 8.6(14) | 5.0(15) | 2.3(15) | – | – |
| 759150D | 15:10:42.71 | -57:44:52.85 | 1.29 | 150 | 5.0(15) | 9.7(14) | 1.2(15) | 4.9(15) | 2.3(15) | – | – |
| 759150E | 15:10:44.10 | -57:44:52.03 | 1.29 | 150 | 2.1(15) | 9.6(14) | 9.9(14) | 4.8(15) | 2.3(15) | – | – |
| 767784 | 15:29:19.31 | -56:31:22.02 | 1.29 | 100 | 3.90.5(16) | 7.21.6(15) | 2.51.4(18) | 1.00.4(16) | 3.3(15) | 1.41.0(-3) | 5.3(-1) |
| 800287 | 16:11:26.57 | -51:41:57.14 | 0.80 | 100 | 1.50.3(16) | 6.21.4(15) | 1.81.1(18) | 1.00.5(16) | 1.3(16) | 1.91.5(-3) | 2.7(0) |
| 854214A | 16:52:32.74 | -43:23:49.60 | 1.26 | 150 | 2.2(15) | 1.7(15) | 0.7–9.5(16) | 3.8(15) | 5.0(15) | – | – |
| 854214B | 16:52:33.02 | -43:23:50.26 | 1.26 | 150 | 5.0(15) | 7.8(14) | 0.1–2.1(17) | 3.8(15) | 2.7(15) | – | – |
| 863312A | 17:02:08.36 | -41:46:56.89 | 0.83 | 150 | 8.9(15) | 3.7(15) | 3.8(15) | 2.0(16) | 1.4(16) | – | – |
| 863312B | 17:02:09.14 | -41:46:45.04 | 0.83 | 150 | 3.7(15) | 1.9(15) | 2.0(15) | 6.0(15) | 4.2(15) | – | – |
| 865468A C1 | 17:05:10.90 | -41:29:06.99 | 1.23 | 100 | 1.30.3(17) | 3.10.7(16) | 1.00.6(19) | 1.50.8(17) | 4.02.0(16) | 4.93.8(-3) | 2.71.9(-1) |
| 865468A C2 | 17:05:10.90 | -41:29:06.99 | 1.23 | 150 | 5.11.1(16) | 3.0(15) | 2.51.4(18) | 6.03.0(16) | 2.0(16) | 7.95.7(-3) | 6.7(-1) |
| 865468B | 17:05:11.22 | -41:29:07.65 | 1.24 | 150 | 1.30.2(16) | 2.60.6(15) | 8.65.0(17) | 6.52.0(15) | 5.0(15) | 2.51.7(-3) | 1.1(0) |
| 865468C | 17:05:11.12 | -41:29:03.47 | 1.24 | 150 | 5.01.9(15) | 1.00.2(15) | 3.42.0(17) | 7.5(15) | 5.8(15) | 1.8(-2) | – |
| 876288 | 17:11:51.02 | -39:09:29.18 | 0.81 | 150 | 8.92.9(15) | 3.10.7(15) | 5.73.9(17) | 6.0(15) | 5.0(15) | 1.2(-2) | – |
| 881427A | 17:20:06.31 | -38:57:15.18 | 1.23 | 150 | 9.31.8(16) | 2.60.7(16) | 1.10.4(19) | 8.31.6(16) | 1.90.7(16) | 2.51.1(-3) | 2.31.0(-1) |
| 881427B | 17:20:06.46 | -38:57:11.44 | 1.23 | 300 | 1.00.2(16) | 8.21.8(15) | 3.41.9(18) | 1.50.8(16) | 1.0(16) | 1.51.1(-3) | 1.3(0) |
| 881427C | 17:20:06.12 | -38:57:15.84 | 1.23 | 150 | 7.41.6(16) | 2.60.5(16) | 1.10.4(19) | 5.51.2(16) | 1.20.5(16) | 1.70.7(-3) | 2.20.9(-1) |
| G023.3891+00.1851 | 18:33:14.32 | -08:23:57.82 | 1.24 | 200 | 7.92.2(15) | 2.51.2(15) | 7.94.5(17) | 9.53.0(15) | 5.0(15) | 4.02.6(-3) | 7.6(-1) |
| G023.6566-00.1273 | 18:34:51.57 | -08:18:21.81 | 1.24 | 150 | 1.40.4(16) | 5.0(15) | 7.12.5(17) | 2.51.2(16) | 5.0(15) | 1.20.7(-2) | 4.0(-1) |
| G025.6498+01.0491 | 18:34:20.92 | -05:59:42.08 | 1.17 | 150 | 3.00.6(16) | 8.52.7(15) | 3.41.4(18) | 1.50.8(16) | 5.02.5(15) | 1.51.0(-3) | 3.32.4(-1) |
| G030.1981-00.1691 | 18:47:03.05 | -02:30:36.30 | 0.60 | 150 | 5.11.1(15) | 1.8(15) | 2.21.2(17) | 1.5(16) | 1.6(16) | 4.7(-2) | – |
| G233.8306-00.1803 | 07:30:16.73 | -18:35:49.06 | 0.81 | 150 | 3.7(15) | 3.0(15) | 2.6(15) | 6.5(15) | 4.4(15) | – | – |
| G305.2017+00.2072A1 | 13:11:10.45 | -62:34:38.60 | 1.30 | 150 | 1.20.3(16) | 2.00.5(15) | 8.54.8(17) | 5.02.5(15) | 2.3(15) | 2.01.5(-3) | 9.1(-1) |
| G305.2017+00.2072A2 | 13:11:13.12 | -62:34:42.74 | 1.30 | 150 | 8.8(15) | 5.0(15) | 0.1–5.3(17) | 8.0(15) | 1.2(16) | – | – |
| G310.0135+00.3892 | 13:51:37.88 | -61:39:07.74 | 1.30 | 150 | 2.3(15) | 2.6(15) | 0.3–13.5(16) | 7.9(15) | 2.9(15) | – | – |
| G314.3197+00.1125 | 14:26:26.25 | -60:38:31.26 | 1.30 | 150 | 2.4(15) | 2.2(15) | 0.8–1.4(17) | 1.0(16) | 6.0(15) | – | – |
| G316.6412-00.0867 | 14:44:18.35 | -59:55:11.28 | 1.29 | 100333333 is set to 150 K for deuterated isotopologues and to 100 K for the other isotopologues. | 2.80.4(16) | 8.62.7(15) | 3.51.5(18) | 2.80.5(16) | 4.83.0(15) | 2.71.2(-3) | 1.71.1(-1) |
| G318.0489+00.0854B | 14:53:42.64 | -59:08:53.02 | 1.30 | 150 | 1.70.3(16) | 4.91.9(15) | 1.90.9(18) | 8.04.0(15) | 3.0(15) | 1.41.0(-3) | 7.5(-1) |
| G318.9480-00.1969A1 | 15:00:55.28 | -58:58:52.60 | 1.29 | 100333333 is set to 150 K for deuterated isotopologues and to 100 K for the other isotopologues. | 8.51.2(16) | 2.20.4(16) | 9.63.2(18) | 7.01.1(16) | 1.40.7(16) | 2.40.9(-3) | 2.01.1(-1) |
| G318.9480-00.1969A2 | 15:00:55.23 | -58:58:55.88 | 1.29 | 150 | 2.6(15) | 7.8(14) | 0.4–16.0(16) | 6.5(15) | 2.3(15) | – | – |
| G323.7399-00.2617B1 | 15:31:45.64 | -56:30:50.16 | 1.28 | 150 | 8.72.0(15) | 2.00.5(15) | 7.54.3(17) | 2.8(15) | 3.0(15) | 2.9(-3) | – |
| G323.7399-00.2617B2 | 15:31:45.45 | -56:30:49.84 | 1.28 | 125 | 8.21.8(16) | 1.50.3(16) | 5.73.3(18) | 2.01.0(16) | 4.02.0(15) | 1.20.9(-3) | 2.01.4(-1) |
| G323.7399-00.2617B3 | 15:31:45.73 | -56:30:51.93 | 1.28 | 150 | 2.5(15) | 6.0(14) | 1.4–13.4(16) | 4.7(15) | 2.3(15) | – | – |
| G323.7399-00.2617B4 | 15:31:45.94 | -56:30:51.34 | 1.28 | 150 | 2.6(15) | 6.9(14) | 1.2–14.2(16) | 2.7(15) | 2.8(15) | – | – |
| G323.7399-00.2617B5 | 15:31:45.62 | -56:30:45.62 | 1.28 | 150 | 2.6(15) | 5.8(14) | 0.1–13.9(16) | 5.0(15) | 2.7(15) | – | – |
| G323.7399-00.2617B6 | 15:31:45.84 | -56:30:47.68 | 1.28 | 150 | 3.9(15) | 1.2(15) | 0.1–2.1(17) | 2.6(15) | 3.7(15) | – | – |
| G323.7399-00.2617B7 | 15:31:45.91 | -56:30:46.10 | 1.28 | 150 | 1.7(15) | 1.2(15) | 0.1–9.3(16) | 3.9(15) | 1.6(15) | – | – |
| G327.1192+00.5103 | 15:47:32.72 | -53:52:38.60 | 0.81 | 100 | 4.00.9(16) | 9.22.0(15) | 2.91.7(18) | 3.51.8(16) | 5.0(15) | 4.03.1(-3) | 2.9(-1) |
| G343.1261-00.0623 | 16:58:17.22 | -42:52:07.54 | 1.25 | 100 | 8.82.7(15) | 7.0(15) | 5.01.8(17) | 4.0(16) | 4.02.0(15) | 4.1(-2) | 5.0(-2) |
| G345.5043+00.3480 C1 | 17:04:22.89 | -40:44:23.06 | 1.25 | 125 | 5.11.1(16) | 1.00.2(16) | 4.02.3(18) | 5.02.5(16) | 1.00.5(16) | 4.23.2(-3) | 2.01.4(-1) |
| G345.5043+00.3480 C2 | 17:04:22.89 | -40:44:23.06 | 1.25 | 150 | 3.10.7(16) | 1.0(16) | 1.70.9(18) | 3.01.5(16) | 1.0(16) | 5.94.3(-3) | 6.7(-1) |
| G348.7342-01.0359B1 | 17:20:07.08 | -38:57:11.22 | 1.23 | 150 | 3.4(15) | 9.9(14) | 1.3–17.7(16) | 1.2(16) | 3.9(15) | – | – |
| G348.7342-01.0359B2 | 17:20:07.26 | -38:57:09.82 | 1.23 | 150 | 2.3(15) | 1.7(15) | 0.1–11.9(16) | 3.6(15) | 4.1(15) | – | – |
| G348.7342-01.0359B3 | 17:20:07.38 | -38:57:10.15 | 1.23 | 150 | 4.0(15) | 1.5(15) | 1.4(15) | 1.1(16) | 3.8(15) | – | – |
Appendix C Methanol D/H ratios of sources in the literature
| Source | Type(1)1(1)(1)1(1)footnotemark: | Refs | ||
|---|---|---|---|---|
| B1-c | LMP | 2.80.9(-2) | 1.30.2(-1) | 1,2 |
| Serpens S68N | LMP | 1.40.6(-2) | 1.20.5(-1) | 1,2 |
| B1-bS | LMP | 1.8(-2) | – | 1,2 |
| HH212 | LMP | 3.82.3(-2) | – | 3 |
| 8.13.0(-3) | – | 4 | ||
| IRAS 16293A | LMP | 2.81.2(-2) | 2.00.7(-1) | 5,6 |
| IRAS 16293B | LMP | 2.40.9(-2) | 2.50.9(-1) | 6,7 |
| IRAS 2A | LMP | 1.91.0(-2) | 7.02.6(-1) | 8 |
| IRAS 4A | LMP | 1.40.8(-2) | 5.62.2(-1) | 8 |
| L483 | LMP | 7.83.3(-3) | – | 9 |
| BHR71 | LMP | 9.64.1(-3) | – | 10 |
| Ser-emb 1 | LMP | 2.0(-1) | – | 11 |
| Ser-emb 11W | LMP | 4.3(-2) | – | 12 |
| HOPS-108 | LMP | 7.03.8(-3) | – | 13 |
| G192.12–11.10 | LMP | 9.85.8(-3) | – | 14 |
| G205.46–14.56S1–A | LMP | 6.73.3(-3) | – | 14 |
| G208.68–19.20N1 | LMP | 1.30.6(-2) | – | 14 |
| G210.49–19.79W–A | LMP | 1.40.6(-2) | – | 14 |
| G211.47–19.27S | LMP | 1.70.4(-2) | – | 14 |
| V883 Ori | LMP | 4.81.0(-2) | – | 15 |
| Serpens SMM1-a | IMP | 3.62.1(-3) | – | 16 |
| NGC 7192 FIRS2 | IMP | 1.90.8(-3) | – | 17 |
| Cep E-A | IMP | 1.20.4(-2) | – | 18 |
| Sgr B2(N2) | HMP | 4.01.7(-4) | – | 19,20 |
| NGC6334I MM1 I | HMP | 3.01.7(-4) | – | 21 |
| NGC6334I MM1 II | HMP | 1.80.9(-4) | – | 21 |
| NGC6334I MM1 III | HMP | 3.21.8(-4) | – | 21 |
| NGC6334I MM1 IV | HMP | 1.61.0(-4) | – | 21 |
| NGC6334I MM1 V | HMP | 2.31.1(-4) | – | 21 |
| NGC6334I MM2 I | HMP | 6.03.6(-4) | – | 21 |
| NGC6334I MM2 II | HMP | 1.50.7(-4) | – | 21 |
| NGC6334I MM3 I | HMP | 2.41.1(-4) | – | 21 |
| NGC6334I MM3 II | HMP | 2.61.1(-4) | – | 21 |
| Orion KL ridge | HMP | 1.70.7(-3) | – | 22 |
| Orion KL HC | HMP | 1.7(-3) | – | 22 |
| CygX-N30 | HMP | 1.7(-3) | – | 23 |
| L1495-B10 6 | LMPC | 1.40.4(-2) | – | 24 |
| L1495-B10 7 | LMPC | 4.81.3(-2) | – | 24 |
| L1495-B10 8 | LMPC | 5.21.5(-2) | – | 24 |
| L1495-B10 9 | LMPC | 4.61.1(-2) | – | 24 |
| L1495-B10 10 | LMPC | 4.21.3(-2) | – | 24 |
| L1495-B10 11 | LMPC | 1.9(-2) | – | 24 |
| L1495-B10 12 | LMPC | 2.00.4(-2) | – | 24 |
| L1495-B10 13 | LMPC | 3.5(-2) | – | 24 |
| L1495-B10 14 | LMPC | 1.4(-2) | – | 24 |
| L1495-B10 15 | LMPC | 4.01.1(-2) | – | 24 |
| L1495-B10 16 | LMPC | 3.01.0(-2) | – | 24 |
| L1495-B10 17 | LMPC | 8.82.7(-2) | – | 24 |
| L183 | LMPC | 1.30.2(-2) | – | 25 |
| L1544 | LMPC | 3.01.3(-2) | – | 26 |
| I00117-MM2 | HMSC | 2.4(-3) | – | 27 |
| AFGL 5142-EC | HMSC | 9.03.8(-4) | – | 27 |
| 05458-mm3 | HMSC | 2.31.0(-3) | – | 27 |
| G034-G2(MM2) | HMSC | 1.40.6(-2) | – | 27 |
| G034-F2(MM7) | HMSC | 2.5(-3) | – | 27 |
| G034-F1(MM8) | HMSC | 1.5(-3) | – | 27 |
| G034-C1(MM9) | HMSC | 8.7(-4) | – | 27 |
| I20293-WC | HMSC | 1.9(-3) | – | 27 |
| I22134-G | HMSC | 1.7(-3) | – | 27 |
| I22134-B | HMSC | 6.7(-3) | – | 27 |
$1$$1$footnotetext: LMP: low-mass protostar, IMS: intermediate-mass protostar, HMS: high-mass protostar, LMPC: low-mass prestellar core, HMSC: high-mass starless core.
References. 1: van Gelder et al. (2020); 2: Appendix D; 3: Lee et al. (2019a); 4: Bianchi et al. (2017b); 5: Manigand et al. (2020); 6: Drozdovskaya et al. (2022); 7: Jørgensen et al. (2018); 8: Taquet et al. (2019); 9: Jacobsen et al. (2019); 10: Yang et al. (2020); 11: Martín-Doménech et al. (2019); 12: Martín-Doménech et al. (2021); 13: Chahine et al. (2022); 14: Hsu et al. (2022); 15: Lee et al. (2019b); 16: Ligterink et al. (2021); 17: Fuente et al. (2014); 18: Ospina-Zamudio et al. (2018); 19: Belloche et al. (2016); 20: Müller et al. (2016); 21: Bøgelund et al. (2018); 22: Neill et al. (2013); 23: van der Walt et al. (2021); 24: Ambrose et al. (2021); 25: Lattanzi et al. (2020); 26: Bizzocchi et al. (2014); 27: Fontani et al. (2015).
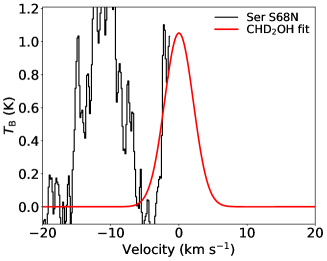
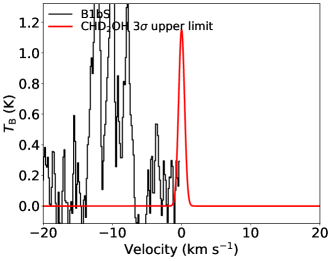
Appendix D Doubly deuterated methanol in B1-c, Serpens S68N, and B1-bS
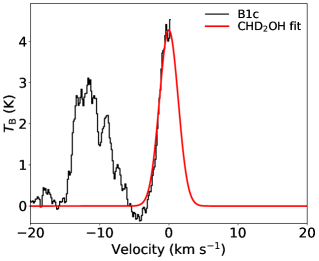
Using the database entry of CHD2OH provided by Drozdovskaya et al. (2022), transitions from CHD2OH can also be searched for in a few COM-rich low-mass protostars. Here, this is done for B1-c, Serpens S68N (hereafter S68N), and B1-bS from the 2017.1.01174.S ALMA program. The content of oxygen-bearing COMs for these sources was presented by van Gelder et al. (2020), but no public database entry was yet available for CHD2OH at that time.
Only one strong transition of CHD2OH (, K) is available for these sources which lies on the very edge of the covered frequency range. For B1-c and S68N, this transition is detected at the 3 level, but given that only half the line is observed this detection is still tentative. Using the same method for deriving the column densities as used by van Gelder et al. (2020) and assuming an excitation temperature of 150 K, we derive column densities of cm-2 for B1-c, cm-2 for S68N, and cm-2 for B1-bS. The FWHM was fixed to the average FWHM of those sources of 3.2km s-1, 5.5km s-1, and 1.0km s-1, respectively (van Gelder et al. 2020). The resulting fits are shown in Fig. 7. Using these derived column densities and those reported for CH3OH by van Gelder et al. (2020), the ratios for B1-c and S68N (for B1-bS, both CH2DOH and CHD2OH are not detected) are shown in Fig. 4 and agree very well with those derived for other low-mass sources as well as with the high-mass sources.
Appendix E Additional figures