Scaling and the Universality of Function Diversity Across Human Organizations
Abstract
Function diversity, namely, the range of tasks individuals can perform, is essential to productive organizations. This concept has been studied in disparate discipline contexts, while general patterns and mechanisms remain unclear. Here, we first analyze over five thousand observations of top-down organizations—US federal agencies, Norwegian companies, and US universities, and find that the number of distinct functions scales with organizational size, approximately as a power law with an exponent of . Further, we find common patterns in the distribution of function abundance within organizations. This universality suggests that human organizations, despite differences in their purpose, structure, and culture, may share common mechanisms for creating specializations. Additionally, we find that cities—bottom-up organizations—differ from top-down organizations and exhibit logarithmic scaling. We discuss potential avenues for modeling the mechanisms for these observations using history-dependent random processes, and offer several criteria for model selection.
1 Introduction
Diversity, that is, the composition of the sub-components of a system, is essential for healthy, functional, and productive social and biological organizations [1, 2, 3, 4, 5]. One important axis of diversity is the range of tasks individuals in a system are able to perform. We define this property as the function diversity of the organization. As systems grow, expand, and mature, their functional repertoire inevitably increases in order to adapt to complex environments, to process complex information, or to perform complex tasks. As a result, diversification is a universal characteristic of any complex adaptive system. Examples include companies with many functional divisions, cities with many business categories, and ecosystems with an abundance of species.
Function diversity is important to human organizations of all scales, from teams to nations. For example, the ability to aggregate diverse knowledge is connected with a groups’ ability to solve complex problems [6] or to produce prosperous economic outcomes whether for companies, cities, or nations [7]. More fundamentally, the ability to integrate across different functions is essential to the success of modern human society, where the collective possesses large volumes of knowledge, whereas each individual can only maintain a relatively small subset of that knowledge [8].
Function diversity is investigated in various disciplinary contexts under different names—as organizational complexity in management science [9], as specialization and capabilities in economics [10, 3, 8, 7], and as species abundance in ecology [2]. These studies have been scattered across fields, resulting in the scope of research often being confined to a particular organizational type and/or to the effect of a single variable. For example, in management science and organizational psychology, past research has focused on empirical studies at the level of small teams, such as senior management teams or project teams in companies. Here the focus has been on how function diversity correlates with team performance metrics [11, 9]. In urban studies, the focus has been on how diversity leads to economic success, and to proposals that openness to diverse people is a moral imperative [12]. While informative in their specific domains, these scatted and disjointed efforts are limited when it comes to revealing general patterns and understanding general mechanisms for what attributes generate function diversity. What determines the distribution and degree of function diversity of a system? What, if any, optimization principles are at play? What universal mechanisms lead to the growth or decay of function diversity? Surprisingly, we do not yet have unifying quantitative frameworks for understanding function diversity in human organizations, despite its central role in determining their successful operation and performance.
A useful approach for discovering universal quantitative frameworks is scaling analysis, the study of how aggregated properties change with system size, ideally across several orders of magnitudes. It has been successfully and widely used in understanding physical and engineering systems [13] and, more recently, to address important questions in biology [14, 15], ecology [16], firms [17] and cities [18]. Scaling analyses have uncovered systematic empirical laws, as well as fundamental underlying principles across the entire spectrum of science and technology, typically revealing regularities that transcend individuality, such as evolutionary history, culture, and geography. The observation of regularity across a wide range of organizational sizes strongly suggests the existence of common underlying mechanisms, thereby motivating the construction of quantitative, first principle mathematical models to explain the empirical patterns, especially the scaling exponents, while more importantly leading to predictions for the structure and dynamics of the system [19].
Using scaling analysis, several lines of research have successfully uncovered new understanding for diversity outside of the application of human organizations. In linguistics, various studies have analyzed how the number of unique words increases with the length of the corpus. The number of distinct words, a measure of vocabulary diversity, scales with the length of the corpus as a power law whose exponent is often around [20], an observation known as Heaps’ law [21]. The universality of Heaps’ law that appears in numerous corpora has led to the development of several persuasive quantitative theories for the universal architectures of human languages [22, 20, 23]. In ecology, similar analyses appear in the study of the species-area relation—how the number of species varies with the area of an ecosystem (see, e.g., [24] for a review). The empirical observations appear to follow a power law with an exponent close to . The debate on the precise functional form of this species-area dependence still remains open [24]. Regularities in the species-area relation also ignited rich theoretical developments to discover principles governing biodiversity [24].
Here, we use scaling analysis as a starting point to study function diversity in human organizations. These organizations include top-down ones—federal agencies, companies, and universities—as well as bottom-up ones, such as cities. We identify commonalities and differences in the scaling of function diversity across these organizations. We use these empirical observations to discuss potential avenues for modeling the generating mechanisms that can predict the commonalities and differences in the scaling behavior.
2 The Scaling Framework
A growing body of recent work has illustrated the power of using a scaling perspective to analyze systems. This perspective seeks to understand how aggregated features () of systems change with system size (), which often follows the power law form . Past work in both the biological and social sciences has demonstrated that the exponent can often be derived from the underlying organizing mechanisms and constraints of a system. In cases, where such theory has not yet been formulated these exponents can often be informative in suggesting possible mechanisms or in inspiring theory development. Here we adopt a scaling perspective to gain a deeper insight into what might be driving the patterns of diversity in a variety of human organizations.
Our focus is the empirical scaling relationship between an organization’s size, , and the number of distinct functions in that organization, . It is useful to consider at the outset what processes might be generating scaling relationships. It is instructive to focus on the growth dynamics of diversity and consider how changes in size are associated with changes in diversity, as quantified by . The simplest possibility is that the growth law depends only on either the current system size, , or on the current diversity . Since is expected to be a function of , these two viewpoints are, in fact, equivalent. From a scaling perspective, it is natural to assume that this rate of change, , is a power law in (or ). That is,
| (1) |
which yields the solution
| (2) |
There are two special cases worth noting: (i) If , then there is diminishing growth of diversity as systems increase in size, and will increase slower than linearly with system size. For example, if , then , as in Heaps’ law, which is equivalent to the diversity growth rate being directly proportional to diversity, or . (ii) If the growth rate of diversity is inversely proportional to size, so that , then the above solution is not valid and instead we would have .
These solutions give us some intuition into how an observed scaling of diversity with system size might be generated, and suggest that we analyze data by fitting
| (3) |
where, simply, . Taking logarithms, this is equivalent to
| (4) |
Consequently, a plot of vs. should yield a straight line whose slope is the exponent and whose intercept on the y-axis is . Below we provide a scaling analysis of various systems using Eq. 4. We then discuss the implications of the fit values of and what they reveal about different systems.
3 Results
We interpret human organization broadly and categorize them roughly into two types: top-down and bottom-up. Top-down organizations are those whose composition is determined by design. For example, in federal agencies and companies, new roles are determined by the management, while in universities, new majors require the approval through designated processes or decision-makers. In contrast, bottom-up organizations are those whose compositions evolve more organically and much less by prescribed design. Cities are one prominent example of a bottom-up system. Although incentives and long-term planning and policy play a role, individuals and businesses relocate to cities or decide to enter certain careers through their own decisions without a central planner, though influenced by market conditions. We collect data on these two types of systems and discuss implications for generating mechanisms.
3.1 Top-down organizations
We collected data on the size and number of distinct functions for three types of human organizations. The data include personnel records of 125 agencies in the US federal government, including cabinet-level departments (such as Department of Veterans Affairs and Department of Justice), and independent agencies (such as the National Science Foundation); 3,191 observations of companies in Norway; 1,592 US universities offering degrees at the bachelor’s level and above, and another 950 US universities at the associate level. See the Data and Methods section for details on the datasets collected.
For federal agencies and companies, we define the organization size by the number of employees. We measure function diversity by the number of distinct occupations present in each organization. Occupations for the federal government are defined by the US Office of Personnel Management. Occupations in Norwegian companies are defined by the International Standard Classification of Occupations. For universities, size is measured by the total number of graduates in a year, and their function diversity by the number of distinct degrees awarded, as defined by the Classification of Instructional Programs. See the Data and Methods section for details.
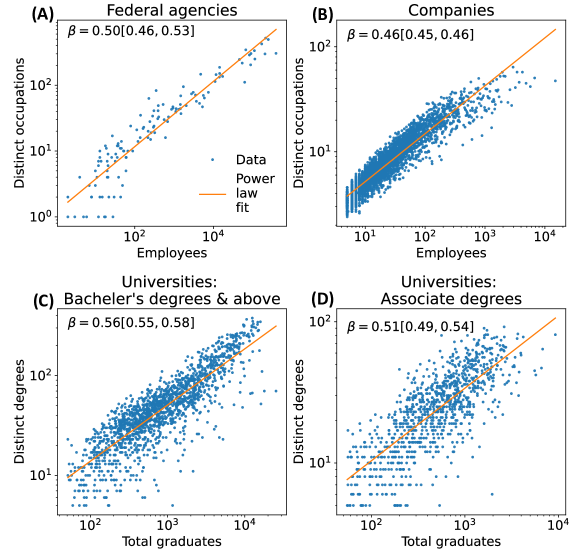
Using the scaling analysis described above, we find that all of these systems generally exhibit an algebraic dependence of diversity on size. In Fig. 1(A), the number of distinct occupations for federal agencies scales approximately as the number of employees in the agency to the power of , with confidence interval . Fig. 1(B) shows the number of distinct occupations in Norwegian companies as a function of the number of employees in the company. The best-fit scaling exponent is , with confidence interval . Fig. 1(C) shows the number of distinct degree types at the bachelor level and above offered by US universities, as a function of the total number of graduates at these levels. The best-fit scaling exponent is , with confidence interval . For universities that grant associate-level degrees, there is a similar scaling relationship with best-fit exponent , with confidence interval (Fig. 1(D)). See the Data and Methods section for statistical methods.
While some curvature is noticeable especially among the larger organizations in Fig. 1(A) and (B), and more scatter in the university data, the scaling of function diversity may be approximated by a power law in these datasets. Strikingly, in all three datasets, the scaling exponents are approximately . This commonality suggests that while varying in goals, geography, and culture, different human organizations such as government agencies, companies, and universities may share a similar underlying dynamic in how their function diversity is generated and grows with size. This exponent value shows that to double the number of functions in an organization, the organization needs to be four times as large in size, or alternatively, that a successful organization needs only to double the number of its distinct functions when it grows by a factor of four.
It is also worth noting that this scaling behavior resembles Heaps’ Law for the diversity scaling observed in several other human and biological systems. Looking across systems as diverse as books, music compositions, genomes, and using an appropriate diversity measure in each, one finds exponents varying between 0.35 and 0.60 [20, 25, 26, 27, 28].
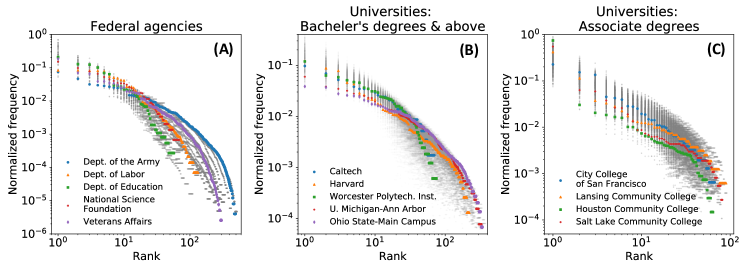
Besides investigating the number of distinct functions, we also look at the distribution of the abundance of functions within each organization. Fig. 2 shows the relative frequency of a function in an organization (that is, the frequency of the function divided by the total number of individuals in the organization) versus the rank of the function, where the value one denotes the most commonly occurring function. We analyze the federal agencies dataset (panel A) and the two university datasets (panels B and C), while we do not have access to the microdata of private companies. We analyze all available organizations having at least 20 functions to ensure a reasonable range in the data. This procedure results in a sample size of 64 federal agencies, 1355 universities offering bachelor’s degrees and above, and 605 universities offering associate degrees. Fig. 2 shows all data analyzed in grey, while selected organizations are highlighted in color for illustration.
While the ordering of ranking differs across organizations, i.e., the most common function in one organization may not be the most common in another111For example, the most frequent two occupations in Veterans Affairs are “nurse” and “medical officer”, while those in the National Science Foundation are “miscellaneous administration and program” and “management and program analysis.”, the rank-frequency distributions show commonality across organizations. Within an organization class (e.g., federal agencies), functions of a similar rank in different organizations exhibit similar relative frequencies. Across organizational classes, the relationships between normalized frequency and rank show similar curvature on a double logarithmic scale. The distributions span a broad range, with a decaying exponential being a good approximation in the high-rank (low frequency) region. This observed commonality and curvature are echoed in a previous study which observed a similar common pattern for the types of businesses in cities [4]. Our observation suggests that how often the most frequent function occurs relative to the second most frequent, and to subsequent functions, follows a common pattern. This commonality suggests that there may be systematic contingencies between the occurrences of different functions: the growth of a new function may depend systematically on the growth of other functions that are prerequisites for its existence.
3.2 Bottom-up organization—Cities
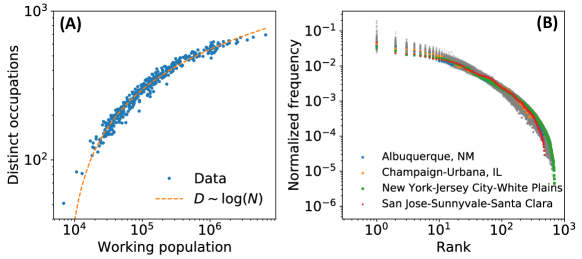
To develop a more comprehensive picture of how function diversity scales in human organizations, we now study an example of a bottom-up organization—US cities. Cities exhibit different scaling relationships compared to those of top-down organizations. As shown in Fig. 3(A), the number of distinct occupations in US urban areas scales as the logarithm of the total number of workers: . In this logarithmic scaling, function diversity increases faster with city size for smaller cities, while this growth slows down for larger cities. This observation suggests that cities obey a different set of mechanisms for the growth in their function diversity.
Similar to our study of top-down organizations, we investigate the distribution of the abundance of functions in each urban area. Fig. 3(B) shows the rank-frequency distributions of functions in urban areas, and the shape of these distributions resembles those found in Federal agencies and two types of universities (Fig. 2).
There are two important implications of this result for cities. First, if a city’s population grows exponentially with time (), i.e., , where is the population at time , and is the growth rate, then function diversity is predicted to grow linearly in time, with , where is the slope in the fit , and is a constant determined by the initial condition of the system. For example, the growth rate for US urban areas on average is in 2019 [29] while the slope is , which together predict that the growth rate for function diversity () is occupations per year. Second, since almost all socio-economic metrics in cities, and especially GDP, grow with population size according to an approximate power law, with [18], this result further predicts that GDP (and other socio-economic metrics) increase exponentially with diversity, i.e., . Thus an increase in diversity is associated with an exponential enhancement of GDP, wages, wealth, patent production (innovation), etc., illustrating the crucial role that diversity has in fostering a strong economy.
3.3 Potential modeling approaches for function diversity
3.3.1 Growth processes for scaling relations
As already noted, the power-law scaling for top-down organizations is mathematically equivalent to the growth process of ; the rate at which new functions are added as the organization increases in size is inversely proportional to the number of existing functions. On the other hand, the logarithmic scaling of cities is equivalent to the growth process of , in which the rate of addition of new functions is inversely proportional to the number of individuals in the system.
3.3.2 Evidence of contingencies between functions
The observation of common and systematic scaling relationships often suggests that unifying generating mechanisms underlie these systems. A simple null model for function diversity is through the random sampling of all possible functions, with each function weighted by its overall abundance. This null model has been successful in explaining similar scaling relationships in linguistics [23], where the rank-frequency distributions in the abundance of functions follow Zipf’s law or a generalized version of it [23, 30]. However, we find this explanation fails for human organizations. We evaluate the null model where we generate simulated hypothetical organizations where the functions (occupations or degrees) are randomly sampled from all available functions. The probability of being sampled is proportional to the overall abundance of the function in the dataset. We find that the rank-frequency distribution is not Zipfian for human organizations and that random weighted sampling fails to replicate the observations in human organizations; (details in the Supplementary Material). Overall, this null model overestimates the number of distinct functions in organizations. Thus we conclude that the function diversity in an organization is not simply obtained from a random sampling of overall available functions.
These sampling results suggest that systematic dependencies exist between the occurrences of functions in human organizations and that the generating process leading to the distribution of function diversity is historically-dependent. That is, functions appearing later in the organization are systematically affected by those that already exist.
3.3.3 Modelling challenges
Several modeling frameworks have been developed to study history-dependent random processes. Many aim to explain the power-law scaling of the number of distinct elements, be it words in a book or songs in a music catalog, with exponents around . These modeling frameworks include preferential-attachment models, where elements with more abundance attract more of the same kind; urn models, where the possibility of new elements are triggered by the presence of certain existing elements; and sample space reduction, where the presence of certain elements prevent other elements from occurring (see [31] for a review of these models). Each modeling framework contains many variations, giving a myriad of models to select from. As almost all models make power-law-like predictions with similar exponents, it is hard to select which one(s) faithfully represents the underlying generating process of the systems being modeled.
The challenge in model selection for the scaling of diversity is not unique to studying human organizations [24]. The study of diversity has been a central focus in ecology, where the species-area relationship—how the number of species in an ecosystem changes with the area occupied by the ecosystem—is a commonly measured regularity that applies across ecosystems. Historically, the “universality” of this relationship was connected with a commonly observed exponent of for an approximate power-law fit. However, much debate has emerged regarding the functional form that best captures the species-area curve, and interrelatedly, regarding the underlying generating mechanisms [24]. The species-area relationship is slightly different than our analysis of diversity because it quantifies how much diversity is observed within a single connected system as the scale of observation increases, whereas our analysis quantifies how diversity changes as one looks across autonomous systems of different sizes. Thus, the power-law approximation of the species-area curve with an exponent of is likely meaningfully different than an exponent of in terms of generating mechanisms.
Our finding that cities, a bottom-up human organization, manifest logarithmic scaling of function diversity, suggests that a successful model should be able to simultaneously account for both power-law and logarithmic scaling by, for example, differences in the character and size of the model parameters. This potentially provides an important empirical constraint for testing successful models.
3.3.4 Possible solutions to modeling challenge
One example of a random process, which in different variations, can predict both power law and logarithmic relationships, is the Yule-Simon process.
The Yule-Simon process is a generalized preferential attachment process. As a new individual enters the organization, they either create a new function (with probability ), or join an existing function (with probability ). If this probability scales as , then the number of functions, scales with as a power law. On the other hand, if scales as , then . Consequently, a generalized Yule-Simon process can accommodate, and potentially predict the different behaviors of top-down and bottom-up organizations. Besides making predictions about the scaling of different functions, generalized Yule-Simon processes have been shown to predict both the overall curvature of the rank-frequency distributions of functions in cities (measured by the types of businesses present) [4], making it a plausible framework for generalizations. Future research can benefit from using flexible modeling frameworks, in which different parameters can lead to the results seen in top-down and bottom-up organizations.
4 Discussion
Human organizations allow a group of individuals to accomplish what disconnected individuals cannot. Function diversity reflects the skills and abilities that are brought together in these groups. Our finding suggests that for top-down organizations, often governed by specified goals and objectives, such as government agencies, companies, and universities, there is a common scaling relationship between the function diversity and organization size, namely, a power law with exponent close to . This empirical observation implies that a critical size is required to sustain a given level of function diversity in an organization.
The difference in scaling relationships between top-down and bottom-up organizations suggests that the dependencies between functions differ between these two cases. Cities have been shown to demonstrate increasing returns to scale, so that larger cities systematically have a higher GDP and produce more patents per resident than smaller ones [18]. Companies, on the contrary, are shown to have decreasing returns to scale, so that companies with more employees produce less revenue per employee [19]. The investigation of function diversity may shed light on this important distinction.
Our finding on functional diversity in cities may also suggest new mechanism for the consistent return to scale of cities [18]. Economic productivity is hypothesized to be an outcome of recombination of skills and abilities [7], which would naively lead economic output, , to roughly scale as . This exponential relationship arises by computing the number of different combinations of elements or less, . Combining this with the logarithmic scaling of diversity, , leads to urban economic output scaling as .
One challenge in theory development is that many random processes can produce the scaling exponent of —random walks, preferential attachment, and sample space reduction, to name a few [32]. But not all of them reflect the processes that underlie the growth of human organizations. The abundance of processes that can generate the exponent makes it challenging to select the best models. Our work offers two additional criteria for model selection. First, besides observing the exponent in top-down human organizations, our work offers additional empirical observations against which a generating mechanism can be tested. The logarithmic scaling of cities, suggests that a successful model has to predict different relationships for function diversity in top-down systems that are engineered to accomplish a goal, versus a bottom-up one without an overarching goal. We also offer observations of non-Zipfian rank-frequency distributions of the functions in various organizations as additional data to test the generating process. Second, we argue that a successful generative model should be faithful to the nature of human organizations—that the generating process should be grounded in the reality of organizations, and ideally backed by robust human behavioral findings. For example, when developing a model based on the preferential attachment mechanism, one needs support from human behavioral findings that adding one function indeed increases the likelihood of adding more individuals of the same function.
Our work offers several contributions to the literature. First, we develop a unifying quantitative framework to identify commonalities of function diversity across a wide range of human organizations. Second, we identify common empirical patterns in function diversity in top-down organizations, while showing that bottom-up ones behave differently. Third, our empirical analysis identifies the basic regularities in these systems, and suggests generic theoretical models that can explain them, laying the basic groundwork for developing more detailed mechanistic quantitative theories in future work.
Data and Methods
Data
US Federal Agencies
The data on US Federal agencies are compiled from the FedScope Employment Cube provided by the US Office of Personnel Management (OPM). The data can be accessed at https://www.fedscope.opm.gov/employment_access.asp. The data used in our analysis are from September 2018. The dataset contains 125 cabinet-level departments and independent agencies. The smallest agencies in this dataset contain 2 employees, which are Commission for the Preservation of America’s Heritage Abroad and the Northern Border Regional Commission. The largest agencies contain hundreds of thousands of employees—the largest two being the Department of Veterans Affairs, with 391,187 employees, and the Department of the Army, with 249,074 employees. The FedScope data is compiled through human resource software used by the US federal government. Note that not all federal agencies are reported in this data set; however, all agencies available through FedScope are used in our analysis.
The occupation classification in this dataset is according to the OPM’s Handbook of Occupational Groups and Families, available at https://www.opm.gov/policy-data-oversight/classification-qualifications/classifying-general-schedule-positions/occupationalhandbook.pdf. The occupation categories used in our analysis is on the 4-digit level, the finest level in the dataset.
Universities
The data on US degree-granting universities are obtained from the Integrated Postsecondary Education Data System (IPEDS). The data was accessed from https://nces.ed.gov/ipeds/use-the-data. The data used in our analysis are from the year 2016. Our analysis for bachelor-level and above institutions includes universities classified as Baccalaureate, Master, or Doctoral universities in the Carnegie 15 classification system. The degree levels included Bachelor’s, Master’s, and Doctoral. The degree type is determined by the area of study, classified by the Classification of Instructional Programs (CIP) code, combined with the level at which the degree was awarded (e.g., the Applied Physics bachelor’s degree is considered to be different from the Applied Physics master’s degree). For associate-level degrees, we include universities classified as Associate universities in the Carnegie 15 classification system, and count the associate degrees awarded. The CIP code is used to classify distinct degrees. In both analyses, we filter for a minimum university size of 50 graduates and a minimum of 5 types of degrees awarded. We only include students’ primary majors in our analysis.
Companies
The data on Norwegian companies were purchased from Statistics Norway in May 2022. The data are from the year 2019. For confidentiality, the company-level data was aggregated by Statistics Norway according to the following procedure. The companies are first sorted by the number of employees from large to small. For every five companies, both the number of employees and the number of distinct functions are aggregated by taking the mean of the log-transformed variables, i.e., where is a variable for company in that size bin. This data only includes companies with five or more employees for confidentiality reasons. The occupation classification uses the 4-digit International Standard Classification of Occupations (ISCO-08), which is detailed at https://www.ssb.no/en/klass/klassifikasjoner/7/versjon/33. Note that this dataset only includes resident employees in Norway, and it does not include subsidiary companies in countries other than Norway.
Urban areas
The data on occupations in US urban areas are obtained from the US Bureau of Labor Statistics (BLS). The data were accessed from https://www.bls.gov/oes/tables.htm. In our analysis, we use data from the year 2017. The occupation classification is according to the 2010 Standard Occupational Classification (SOC) system (https://www.bls.gov/soc/). The boundaries of urban areas in this dataset use the Metropolitan Statistical Area established by the US Office of Management and Budget (OMB).
Methods
Fitting power law exponents
Consistent with previous literature on scaling in human social systems [18], we obtain the scaling exponent of the data by performing ordinary least square regressions on the log-transformed variables. In other words, estimating parameters and in , where and are the data of dependent and independent variables, and is the scaling exponent. The estimation uses ordinary least square regression and the confidence interval is based on Student’s t-distribution. Zeros and missing values are removed from the datasets before making the logarithmic transformation.
References
- [1] Page, S. The Difference (Princeton University Press, 2008).
- [2] Whittaker, R. H. Evolution and measurement of species diversity. \JournalTitleTaxon 21, 213–251 (1972).
- [3] Quigley, J. M. Urban diversity and economic growth. \JournalTitleJournal of Economic Perspectives 12, 127–138 (1998).
- [4] Youn, H. et al. Scaling and universality in urban economic diversification. \JournalTitleJournal of the Royal Society Interface 13, 20150937 (2016).
- [5] Luis M. A, B., Horacio, S. & Hyejin, Y. Professional diversity and the productivity of cities. \JournalTitleScientific Reports 4 (2014).
- [6] Aminpour, P. et al. The diversity bonus in pooling local knowledge about complex problems. \JournalTitleProceedings of the National Academy of Sciences 118, e2016887118 (2021).
- [7] Hidalgo, C. A. & Hausmann, R. The building blocks of economic complexity. \JournalTitleProceedings of the National Academy of Sciences 106, 10570–10575 (2009).
- [8] Hausmann, R., Hidalgo, C. A., Bustos, S., Coscia, M. & Simoes, A. The Atlas of Economic Complexity: Mapping Paths to Prosperity (MIT Press, 2014).
- [9] Milliken, F. J. & Martins, L. L. Searching for common threads: Understanding the multiple effects of diversity in organizational groups. \JournalTitleAcademy of Management Review 21, 402–433 (1996).
- [10] Becker, G. S. & Murphy, K. M. The division of labor, coordination costs, and knowledge. \JournalTitleThe Quarterly Journal of Economics 107, 1137–1160 (1992).
- [11] Horwitz, S. K. Working across boundaries. \JournalTitleThe Psychology and Management of Project Teams 329 (2015).
- [12] Florida, R. The Rise of the Creative Class (Basic Books, 2019).
- [13] Barenblatt, G. I. Scaling, vol. 34 (Cambridge University Press, 2003).
- [14] van Nimwegen, E. Scaling laws in the functional content of genomes: Fundamental constants of evolution? In Power Laws, Scale-Free Networks and Genome Biology, 236–253 (Springer, 2006).
- [15] Kempes, C. P. et al. Drivers of bacterial maintenance and minimal energy requirements. \JournalTitleFrontiers in Microbiology 8, 31 (2017).
- [16] Cody, M. L., MacArthur, R. H., Diamond, J. M. et al. Ecology and Evolution of Communities (Harvard University Press, 1975).
- [17] Stanley, M. H. et al. Scaling behaviour in the growth of companies. \JournalTitleNature 379, 804–806 (1996).
- [18] Bettencourt, L. M., Lobo, J., Helbing, D., Kühnert, C. & West, G. B. Growth, innovation, scaling, and the pace of life in cities. \JournalTitleProceedings of the National Academy of Sciences 104, 7301–7306 (2007).
- [19] West, G. Scale: The Universal Laws of Life, Growth, and Death in Organisms, Cities, and Companies (Penguin, 2018).
- [20] Tria, F., Loreto, V., Servedio, V. D. P. & Strogatz, S. H. The dynamics of correlated novelties. \JournalTitleScientific Reports 4, 1–8 (2014).
- [21] Heaps, H. S. Information Retrieval, Computational and Theoretical Aspects (Academic Press, 1978).
- [22] Mazzolini, A., Colliva, A., Caselle, M. & Osella, M. Heaps’ law, statistics of shared components, and temporal patterns from a sample-space-reducing process. \JournalTitlePhys. Rev. E 98, 052139 (2018).
- [23] van Leijenhorst, D. C. & van der Weide, T. P. A formal derivation of Heaps’ law. \JournalTitleInformation Sciences 170, 263–272 (2005).
- [24] Dengler, J. Which function describes the species–area relationship best? A review and empirical evaluation. \JournalTitleJournal of Biogeography 36, 728–744 (2009).
- [25] Benz, R. W., Swamidass, S. J. & Baldi, P. Discovery of power-laws in chemical space. \JournalTitleJournal of Chemical Information and Modeling 48, 1138–1151 (2008).
- [26] Tettelin, H., Riley, D., Cattuto, C. & Medini, D. Comparative genomics: The bacterial pan-genome. \JournalTitleCurrent Opinion in Microbiology 11, 472–477 (2008).
- [27] Park, S.-C., Lee, K., Kim, Y. O., Won, S. & Chun, J. Large-scale genomics reveals the genetic characteristics of seven species and importance of phylogenetic distance for estimating pan-genome size. \JournalTitleFrontiers in Microbiology 10, 834 (2019).
- [28] Serra-Peralta, M., Serrà, J. & Corral, Á. Heaps’ law and vocabulary richness in the history of classical music harmony. \JournalTitleEPJ Data Science 10, 40 (2021).
- [29] The World Bank. Urban Population Growth – United States. https://data.worldbank.org/indicator/SP.URB.GROW?locations=US.
- [30] Lü, L., Zhang, Z.-K. & Zhou, T. Zipf’s law leads to Heaps’ law: Analyzing their relation in finite-size systems. \JournalTitlePloS One 5, e14139 (2010).
- [31] Loreto, V., Servedio, V. D., Strogatz, S. H. & Tria, F. Dynamics on expanding spaces: Modeling the emergence of novelties. In Creativity and Universality in Language, 59–83 (Springer, 2016).
- [32] Mazzolini, A., Colliva, A., Caselle, M. & Osella, M. Heaps’ law, statistics of shared components, and temporal patterns from a sample-space-reducing process. \JournalTitlePhysical Review E 98, 052139 (2018).