Unravelling the nature of the dual AGN in the galaxy pair system IRAS 05589+2828 and 2MASX J06021107+2828382
Abstract
We have studied the nuclear region of the previously detected dual AGN system in the galaxy pair IRAS 05589+2828 and 2MASX J06021107+2828382 through new optical spectroscopy observations, along with radio and X-ray archival data. Our multiwavelength data strongly suggest that the Sy1 IRAS 05589+2828 (z=0.03300.0002) conforms to a dual AGN system with the Sy2 2MASX J06021107+2828382 (z=0.03340.0001) with a projected separation obtained from the radio data of 20.08″ (13.3 kpc). Analysis of the optical spectra reveals a faint narrow extended emission from H and [OIII] amidst the two AGN, supporting evidence for an ongoing merger. IRAS 05589+2828 is a double component narrow emission line AGN, with complex broad Balmer emission line profiles that clearly show a strong red-peaklet with a velocity shift of 3500 km s-1. The black hole mass estimates of IRAS 05589+2828 and 2MASX J06021107+2828382 are log MBH = 8.59 0.14 (M⊙) and log MBH = 8.210.2 (M⊙), respectively. In the X-ray bands, IRAS 05589+2828 is compatible with a Type 1 object, showing both spectral and flux variability. Chandra data of 2MASX J06021107+2828382 allowed us to measure a high hardness ratio in this source, providing evidence for a Type 2 AGN. The 22 GHz image obtained with the Karl G. Jansky Very Large Array has revealed that both AGN are compact radio objects with spectral indices -0.260.03 and -0.700.11, confirming for the first time its dual AGN nature in the radio bands.
keywords:
galaxies: active– galaxies: Seyfert– quasars:individual: IRAS 05589+2828, 2MASX J06021107+2828382– quasars: emission lines– galaxies: evolution1 Introduction
In the cosmological CDM paradigm, galaxies are proposed to grow hierarchically via mergers (White & Rees, 1978; White & Frenk, 1991). Galaxy mergers are mechanisms that can produce major gas inflows towards the galactic centres that can trigger bursts of star formation and also be responsible for the supermassive black hole (SMBH, with masses in the range of 106 to 1010 M) growth in AGN (Barnes & Hernquist, 1991; Di Matteo et al., 2005; Hopkins et al., 2008; Blumenthal & Barnes, 2018).
Observational studies have led to the discovery that nearly every massive galaxy with a bulge harbours a SMBH in its centre. SMBHs have fundamental connections with the evolution of the host galaxy and the SMBH growth (Magorrian et al., 1998; Gebhardt et al., 2000; Ferrarese & Merritt, 2000; Tremaine et al., 2002; Ferrarese & Ford, 2005; Kormendy & Ho, 2013; Gültekin et al., 2009; McConnell & Ma, 2013; Schutte et al., 2019), as well as the evolution of galaxies during mergers. Therefore, if SMBHs are ubiquitous in galaxy centres, a natural consequence is to expect that merging and merged galaxies will host two, or more, SMBHs (Begelman et al., 1980; Milosavljević & Merritt, 2001). Thus, a large fraction of them should be found in many sources (Van Wassenhove et al., 2012; Liu et al., 2019; Kim et al., 2020).
The so-called dual AGN (DAGN) are galaxies in a late merger phase that lasts 100 Myr where close interactions produce that two AGN are powered by accretion onto a SMBH with projected separations in the range of a few kpc (Comerford et al., 2009; Blecha et al., 2013), although some authors accordingly with simulations (e.g., Van Wassenhove et al., 2012) used to define DAGN as systems with their stellar bulges separated by 10 kpc (e.g. Stemo et al., 2021). Since gas-rich mergers could be obscured by dust, (Hickox & Alexander, 2018) DAGN are difficult to detect in the optical bands and are considered as DAGN candidates until the pair of central SMBHs are confirmed with either X-ray or radio observations (Fu et al., 2015b). Since more than a decade, several studies dedicated to the detection of DAGN have been done in the optical, (e.g., Liu et al., 2010; Woo et al., 2014; Kim et al., 2020); mid-infrared (MIR) (e.g., Satyapal et al., 2017; Ellison et al., 2017); radio (e.g., Fu et al., 2015a; Müller-Sánchez et al., 2015; Rubinur et al., 2019); and in X-ray (e.g., Komossa et al., 2003; Liu et al., 2019; Hou et al., 2019). In this context, binary-AGN are defined as a pair of active SMBHs which are forming a Keplerian binary bound system with pc to sub-pc projected separation (see review by De Rosa et al., 2019).
The detection and characterization of dual and binary SMBHs is fundamental to understand the formation and accretion history of SMBHs across cosmic ages. Until recently, a few dozens of DAGN were confirmed as such in the literature (e.g. Rubinur et al., 2018). However, the number of DAGN is increasing. For example, Zhang et al. (2021) report 16 likely DAGN and 15 new identified DAGN in a systematic search for DAGN among 41 merging galaxies separated at kpc scales at z0.25. Also, Brooks et al. (2022) find a new sub-kpc binary-AGN in the radio bands with a projected separation of 0.950.29 kpc.
In particular, X-ray bands above 2 keV are found to be extremely useful to identify DAGN, since AGN with multiple nuclei are strong hard X-ray emitters, which also are less affected by the emission produced by the host galaxy (e.g. Komossa et al., 2003; Koss et al., 2011). Among the DAGN detected in hard X-ray, the serendipitous discovery by Komossa et al. (2003) of the ongoing merger of two disk galaxies in NGC 6240 using Chandra observations stands out. This object, is known to have double AGN separated by 1″(or 0.7 kpc) in projection. Observations in the radio and near-IR bands by Max et al. (2007) also confirmed its dual nature. Recently, 3D spectroscopy observations revealed a third nucleus in a region of only 1 kpc in this source, i.e., a triple-AGN candidate system (Kollatschny et al., 2020). However, revisiting the Chandra data, it was discovered that the third nucleus in NGC 6240 does not have evidence of hard X-ray emission (Fabbiano et al., 2020).
Initially, Zhou et al. (2004) suggested that a method for finding DAGN could be based on the detection of double-peaked narrow emission line profiles (DPAGN) in the AGN spectra. Since then, hundreds of DPAGN were detected using the Sloan Digital Sky Survey database (SDSS; e.g. Fu et al., 2012; Comerford et al., 2012; Kim et al., 2020). However, DPAGN are sometimes confirmed as DAGN systems, but frequently can be the result of gas kinematics, jet-driven outflows, winds or disk rotation on small scales (e.g., Fischer et al., 2011; Crenshaw & Kraemer, 2000; Rosario et al., 2010; Kharb et al., 2017; Müller-Sánchez et al., 2015; Comerford et al., 2018; Benítez et al., 2018, 2019).
IRAS 05589+2828 is a nearby AGN at z=0.033 111The scale with our adopted cosmology is 0.662 kpc/”, see Table 1. that was detected with the Swift-Burst Alert telescope (BAT; Barthelmy et al., 2005) and catalogued as a Type 1 hard X-ray source. In the optical bands, a spectroscopy study done by Winter et al. (2010) classify IRAS 05589+2828 as a Seyfert 1 galaxy and estimated a SMBH mass of log MBH=8.22 (M⊙). Moreover, published data and the spectra presented in this paper allows locating IRAS 05589+2828 along the quasar main sequence (e.g., Sulentic et al., 2000; Shen & Ho, 2014), a correlation space that helps the contextualization of Type 1 AGN observational properties, and that provides a tentative link to physical and aspect parameters (Sulentic et al., 2011).
In a previous study done by Koss et al. (2010) they suggested that the companion galaxy of IRAS 05589+2828 is 2MASXJ 06021038+2828112, having a projected separation of 8 kpc. Later, Koss et al. (2012) found that IRAS 05589+2828 is a DAGN based on the analysis of X-ray data obtained with Chandra. Specifically, in their Table 1, IRAS 05589+2828 appears as a DAGN system conformed by a pair of Seyfert 2 (Sy2) galaxies, being the companion galaxy 2MASX J06021107+2828382, and both with a projected separation 8 kpc. Since then, IRAS 05589+2828 is known as a confirmed DAGN in the X-ray by direct imaging with a projected separation less than 10 kpc (see, e.g. Deane et al., 2014; Satyapal et al., 2017).
In order to provide a detailed study of the nature of the DAGN system previously detected in IRAS 05589+2828, new optical spectroscopic data were obtained along with data from radio and X-ray databases. Our data analysis shows that the galaxy pair conformed by IRAS 05589+2828 and 2MASX J06021107+2828382, is a DAGN in the radio bands. In Section 2 the optical spectra obtained with three telescopes are presented; while section 3 shows the analysis done to the optical data. In Section 4 analysis of the VLA data of IRAS 05589+2828 and 2MASX J06021107+2828382 is given. In section 5 X-ray data for both AGN are presented and analysed. Finally, a discussion of the obtained results in the optical, radio and X-ray is given in Section 6. Throughout the paper we adopt a cosmology where =69.6 km s-1 Mpc-1, =0.286 and 0.714 (Bennett et al., 2014).
2 Optical spectroscopic observations
A set of new optical spectroscopic observations were obtained with the aim to study the dual AGN IRAS 05589+2828 system previously reported as such by Koss et al. (2012) and also the spectral properties of some of its close neighbours.
2.1 WHT/ISIS–(ORM)
Optical long-slit data of IRAS 05589+2828 were obtained using the Intermediate dispersion Spectrograph and Imaging System (ISIS), attached to the 4.2 m William Herschel Telescope (WHT) at the Roque de los Muchachos Observatory (ORM). ISIS has two CCD arrays, an EEV12 for the blue arm and a REDPLUS CCD for the red arm. The blue CCD was centred around 4500 Å, and the red one at 6999 Å. The gratings used were R600B and R600R, which provide a dispersion of 0.44 and 0.49 Å pixel-1, respectively. The slit width was set to 1.018 ″, this is about 3.3 pixels FWHM. The spectral resolution in the blue region is 2.06 Å and in the red 1.84 Å. The slit was placed at a position angle (PA) -92∘ and observations were done with an average seeing 1.2″. With this setup, three exposures of 1200 s in the blue (3550-5250 Å), and in the red (5860-7780 Å) were obtained. Data were reduced and calibrated using standard IRAF packages222IRAF is distributed by the National Optical Astronomy Observatories, operated by the Association of Universities for Research in Astronomy, Inc., under cooperative agreement with the National Science Foundation.. For the wavelength calibration, CuAr and HeNeAr lamps were used. The standard star Feige 34 from the Oke (1990) catalogue was used for flux calibration. Sky subtraction was done using task IRAF/Background. Spectra were combined to produce a final 3600 s exposure time. An aperture of 3″ was used to extract the 1-dimensional spectrum. The obtained WHT spectrum has a signal-to-noise ratio (S/N) 55 in the continuum around, 5100 Å. The complete log of optical observations obtained with WHT/ISIS, 2.1m/B&Ch and Copernico/AFOSC is presented in Table 1.
2.2 2.1m/B&Ch–(OAN-SPM)
Optical spectroscopic observations of IRAS 05589+2828 and some of its close neighbours were obtained on 2018 October 18,with the 2.1 m telescope and the Boller & Chivens spectrograph (2.1m/B&Ch) at the Observatorio Astronómico Nacional at San Pedro Mártir, Baja California, Mexico (OAN-SPM). The 2.1m/B&Ch was used with a 300 l/mm grating, covering the spectral range of 3800-8000 Å. The slit width was set to 2.5″ and the PA was oriented E-W. The spectral dispersion is 4.5 Å pix -1, corresponding to 10 Å FWHM, which was estimated using different emission lines of the arc-lamp (CuHeNeAr) spectrum. Observations were obtained with clear sky conditions and a seeing of 2″. Data were reduced with IRAF following standard procedures. Arc-lamp (CuHeNeAr) exposures were used for the wavelength calibration. A spline function was fit to determine the dispersion function (wavelength-to-pixel correspondence). Flux calibrations were done using the spectrophotometric standard star Feige 110 from Oke (1990) which was observed each night.
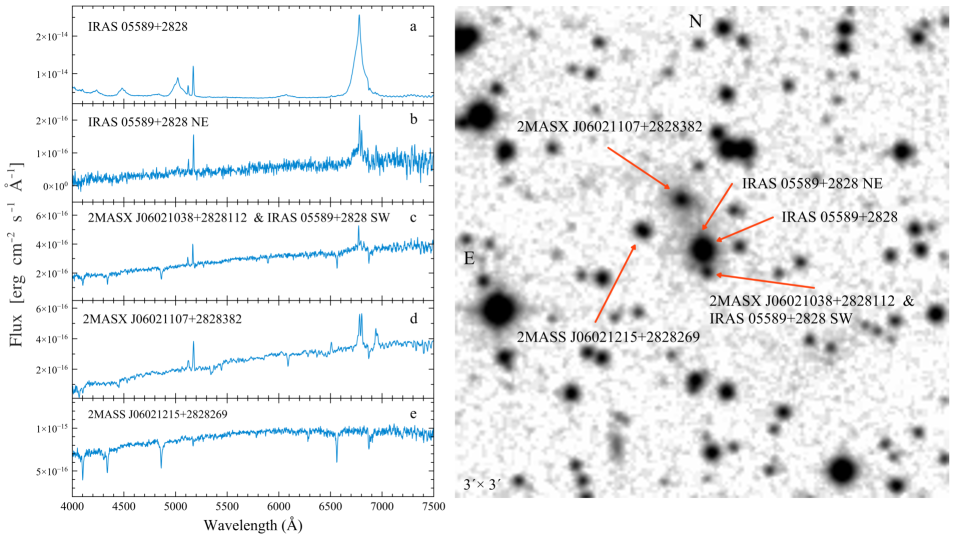
The spectra obtained for IRAS 05589+2828 and some of its neighbours along with the identification map from the Digitized Sky Survey (DSS, 333https://archive.eso.org/dss/dss) of all observed sources are shown in the left and right panels of Figure 1, respectively. Spectrum in panel (a) corresponds to IRAS 05589+2828; panel (b) shows the spectrum of the extended emission located at the NE of IRAS 05589+2828; in (c) 2MASX J06021107+2828112 shows a stellar-like spectrum with some faint emission lines that probably are due to extended emission at the SW of IRAS 05589+2828; panel (d) shows the spectrum of 2MASSX J06021107+2828382 where AGN emission lines are evident; finally, panel (e) shows the stellar-like spectrum of 2MASX J06021107+2828269.
2.3 Copernico/AFOSC–(INAF-OAPd)
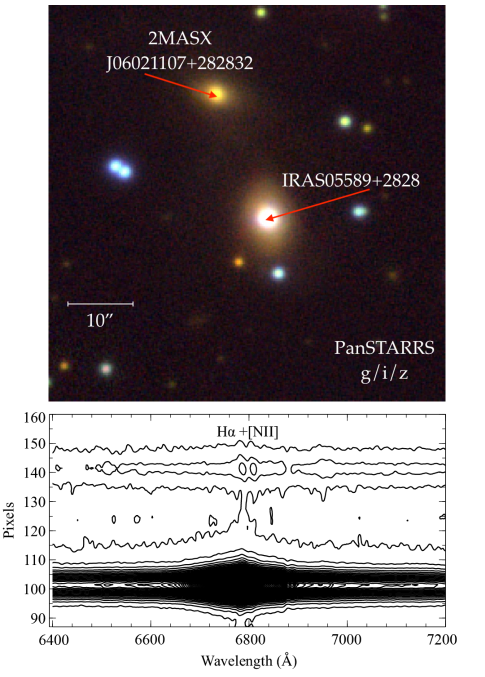
Observations of IRAS 05589+2828 were obtained with the 182 cm Copernico telescope at the Astronomical Observatory of Padova (INAF OAPd - Asiago Observatory) and the Asiago Faint Object Spectrograph and Camera (AFOSC). The aim for this new set of optical spectroscopic observations was to study the low brightness extended emission initially observed in the PanSTARSS image of IRAS 05589+2828444image available at http://cdsportal.u-strasbg.fr, see upper panel of Figure 2, between IRAS 05589+2828 and 2MASX J06021107+2828382. Henceforth, we will refer to this extended emission as the “bridge” zone. Data were obtained with the GR08 Grism with a central wavelength =7000 Å, and a spectral range from 6250 to 8050 Å. Neon and Thorium arc-lamps were used and combined for wavelength calibration. The spectral dispersion is 1.98 Å pix -1, corresponding to 3.3 Å FWHM, which was estimated using the arc-lamp spectrum. The slit aperture was set to 1.69″. The final spectra were calibrated in flux using the spectrophotometric standard star PG 0205+134 also from Massey et al. (1988). Two images of 3600 s were obtained with a PA=21∘.
2.4 The bridge zone
The 2D Copernico spectrum shows evidence of an extended H emission in the bridge zone, see lower panel of Figure 2. So, using this 2D spectrum, an estimation of the size of the extended emission was done. This resulted in a region of 15 pixels. Since the scale for this setup is 0.5″ pix-1 for a binning of 22, this corresponds to 4.965 kpc.
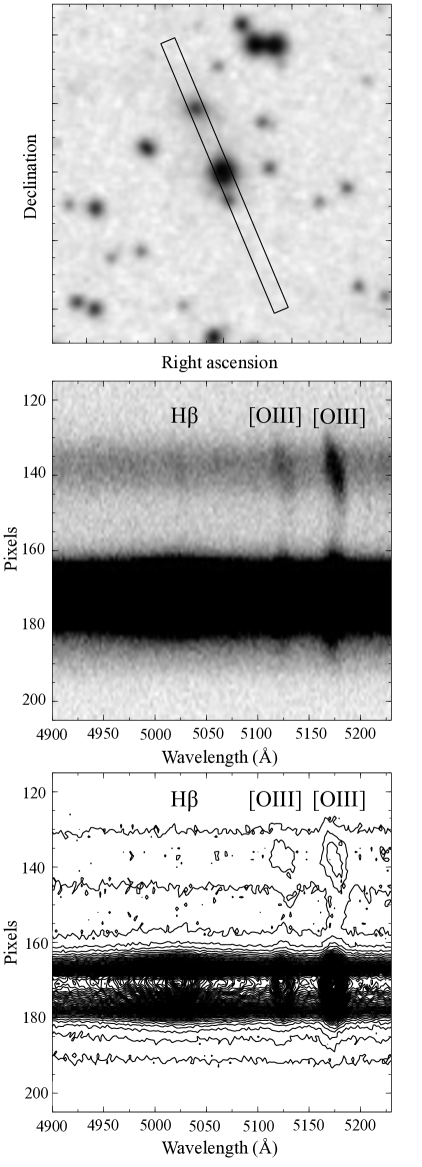
In order to verify this result, deep spectra of the bridge zone were obtained also with the 2.1m/B&Ch at the (OAN-SPM) on 2020 February 26. Observations were obtained with clear sky conditions and a seeing of 2.5″. The slit has a PA21∘ in order to cover the bridge zone and again with an aperture of 2.5″. Spectra were processed using the same procedure explained in section 2.2. The spectra were extracted using an aperture of 4 pixels (i.e., 2.4″). The flux calibration was done using the spectrophotometric standard star Feige 34 from the Oke (1990) catalogue. Three spectra of 1800 s of integration time were combined to obtain a final 1.5 hr 2D spectrum. Evidence of extended emission from [OIII]4950,5007 in IRAS 05589+2828 is also found, see Figure 3.
| Telescope/Instrument | Object ID | Date (UT) | Exposure time (s) | za | S/Nb |
| WHT/ISIS | IRAS 05589+2828 | 2015 January 28 | 3600 | 0.0330 0.0002 | 53 |
| 2.1m/B&Ch | IRAS 05589+2828 | 2018 October 18 | 900 | 0.0329 0.0001 | 54 |
| IRAS 05589+2828 NE | ” | 900 | 0.0334 0.0001 | 6 | |
| 2MASXJ06021107+2828382 | ” | 5400 | 0.0334 0.0001 | 28 | |
| 2MASXJ06021038+2828112 | ” | 3600c | 0.0320 0001 | 40 | |
| 2MASSJ06021215+2828269 | ” | 1800c | star | 61 | |
| The bridge | 2020 February 26 | 5400 | |||
| Copernico/AFOSC | |||||
| The bridge | 2019 January 10 | 3600 | |||
| a Redshifts of IRAS 05589+2828 and its close neighbors were estimated using narrow emission lines. | |||||
| b Measured around 5100Å | |||||
| cIn the same slit. | |||||
3 Emission line profiles models
3.1 IRAS05589+2828
The AGN spectrum of IRAS 05589+2828 obtained with WHT/ISIS was modelled with IRAF/Specfit. This routine allows fitting the emission lines and the underlying continuum at the same time (Kriss, 1994). The spectrum was modelled in the blue and red spectral regions. The blue region (4230-5070 Å) includes H and H (see Figure 4). The red region (6250-6850 Å) includes only H+[Nii] (see Figure 5). For each spectral region we considered continuum windows at 4250, 4450 and 5050 Å for the H+H region and at 6150 and 6850 Å for H+N[II]. The first step consisted in modelling the underlying continuum with a power law, taking as a reference the windows described above. Then, the fitting was done leaving as free parameters the flux, velocity shift and FWHM.
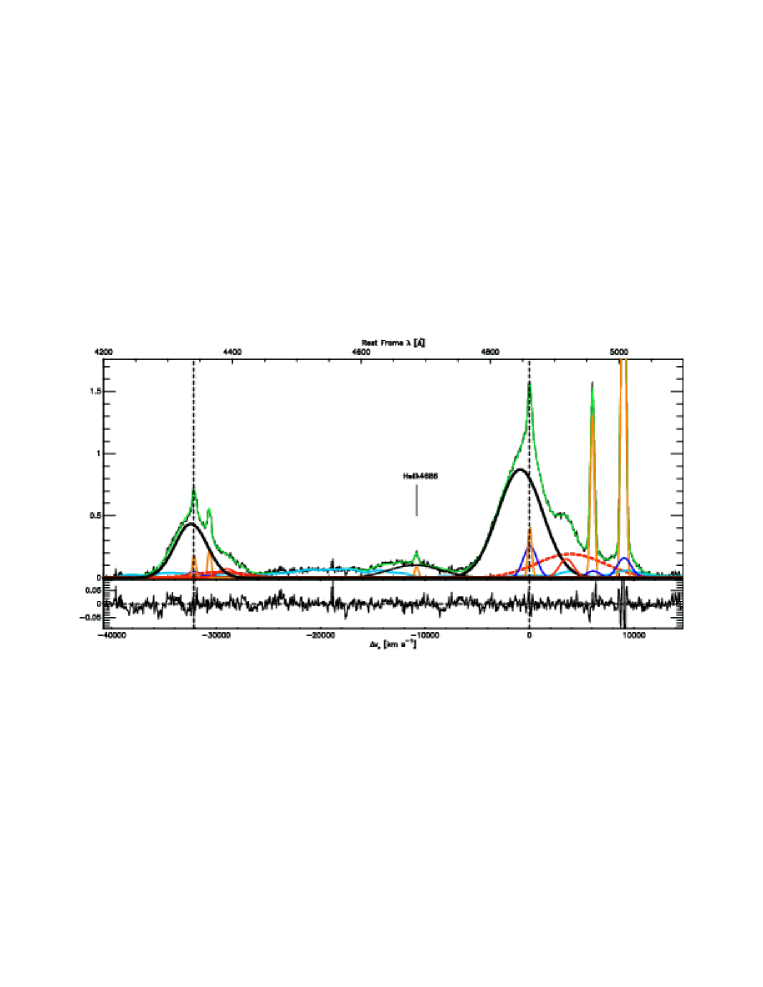
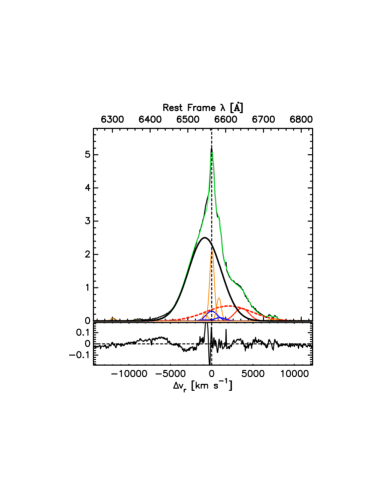
The best fit for the Balmer broad line profiles was obtained using three broad Gaussian components. The first Gaussian was used to fit the most intense component, identified as the main component (MC), which is blueshifted with respect to the restframe. This component is interpreted as emerging from the broad line region, the closest to the SMBH. The width of the line is assumed to be due to Doppler broadening of the clouds in a co-planar geometry (e.g. Netzer, 2013). The second Gaussian component was used to fit a redshifted very broad component (VBC), a component frequently observed in objects with FWHM > 4000 km s-1 and low FeII emission (c.f., Marziani et al., 2010; Zamfir et al., 2010). Finally, a third Gaussian component was used to fit a redshifted peaked emission that has a velocity shift of 3500 km s-1 with respect to the restframe, see Figure 6. Henceforth, we will refer to this peculiar component as the red-peaklet (RP). The results of the fitting of these components MC, VBC, and RP are shown in Table 2. A FeII template was used to model the pseudo-continuum. Also, modelling the HeII4686 emission line was necessary in order to obtain the best fit.
The best fit for the narrow emission lines was obtained using two Gaussian components. This fit was done using the same FWHM and velocity shift for all lines, based on the assumption that these lines are produced in the same region. The fitted narrow lines are: H, [Nii], [Sii]6716,6731, [Oi], [Oiii]4959,5007, H, HeII4686, H, and [Oiii]4364. Both narrow components are centred in the restframe, with an average shift of 1 Å.
Therefore, in this object there are no blueshifted nor redshifted components as it is usually the case in DPAGN. So, this object has a double narrow emission line component (e.g., Ilić et al., 2006). The first narrow component (NC), which is the most prominent, has a FWHM 500 km s-1. For the second component (SC), similar to what was done with the broad emission lines, a Gaussian component with FWHM 1550 km s-1, was used. The second component is expected in quasars, particularly in [Oiii]4959,5007 which is a high-ionization line that is frequently affected by broadening and shifts with respect to the quasar rest frame due to disk winds (e.g., Zamfir et al., 2010; Zhang et al., 2011). However, we assume that a similar emission could emerge from the other narrow lines if they share the same emitting region. The SC is well visible in the strongest lines like H, H, and [Oiii]4959,5007, and appears weaker in [Nii], H, and [Oiii]4364, while no emission from the SC is observed in the faintest lines like HeII4686, [Sii]6716,6731, and [Oi].
Results of the best fit for the broad and narrow emission lines profiles of IRAS 05589+2828 are presented in Table 2. The presence of broad permitted lines in the optical spectrum of IRAS 05589+2828 confirms that it is a Sy1 AGN, in agreement with previous results (e.g. Baumgartner et al., 2013).
| WHT | Flux 10-14 | Luminosity 1041 | vb | FWHM | |
|---|---|---|---|---|---|
| erg s-1 cm-2 Å-1 | erg s-1 | Å | km s-1 | km s-1 | |
| HMC | 27.47 0.97 | 6.87 0.12 | 4335.7 0.5 | -294 33 | 4115 86 |
| H | 4.94 1.30 | 1.24 0.16 | 4380.6 7.8 | 2803 536 | 6713 824 |
| H | 1.22 0.08 | 0.30 0.01 | 4340.7 0.1 | 46 7 | 446 3 |
| H | 1.22 0.08 | 0.30 0.01 | 4340.8 0.3 | 58 20 | 1540 102 |
| H | 2.61 0.54 | 0.65 0.07 | 4391.0 2.1 | 3521 142 | 2330 302 |
| [Oiii]4364 | 1.54 0.09 | 0.39 0.01 | 4364.3 0.2 | 91 14 | 446 3 |
| [Oiii]4364SC | 0.55 0.03 | 0.14 0.00 | 4363.8 0.3 | 58 20 | 1540 102 |
| HMC | 75.72 3.21 | 18.95 0.40 | 4846.8 0.3 | -875 20 | 5043 27 |
| HRP | 4.34 0.35 | 1.09 0.04 | 4918.2 0.7 | 3530 42 | 1636 92 |
| H | 3.09 0.17 | 0.77 0.02 | 4861.7 0.1 | 46 7 | 446 3 |
| H | 6.71 0.59 | 1.68 0.07 | 4861.9 0.3 | 58 20 | 1540 102 |
| H | 25.19 4.19 | 6.30 0.52 | 4924.4 7.2 | 3908 443 | 7479 649 |
| [Oiii]5007 | 30.79 0.25 | 7.71 0.03 | 5006.9 0.0 | -8 1 | 446 3 |
| [Oiii]SC | 4.39 0.36 | 1.10 0.04 | 5008.0 0.3 | 58 20 | 1540 102 |
| HeIIBC | 10.52 0.61 | 2.63 0.08 | 4683.8 1.7 | -144 111 | 6178 292 |
| HeIINC | 0.65 0.07 | 0.16 0.01 | 4685.8 0.4 | -10 25 | 446 3 |
| HMC | 270.86 5.59 | 67.78 0.70 | 6544.8 0.1 | -830 7 | 4657 28 |
| HRP | 18.09 1.28 | 4.53 0.16 | 6642.8 0.6 | 3643 29 | 2033 15 |
| H | 32.58 0.44 | 8.15 0.05 | 6563.7 0.1 | 31 5 | 661 9 |
| HSC | 11.08 0.15 | 2.77 0.02 | 6563.0 0.1 | 31 5 | 1619 162 |
| H | 68.51 5.70 | 17.14 0.71 | 6608.1 1.9 | 2061 86 | 6506 270 |
| [Nii]6583 | 10.70 0.38 | 2.68 0.05 | 6582.0 0.2 | -138 11 | 661 9 |
| [Nii]6583SC | 3.64 0.13 | 0.91 0.02 | 6585.0 0.0 | -1 0 | 1619 162 |
| [Sii]6716 | 0.86 0.16 | 0.22 0.02 | 6718.0 0.1 | 31 5 | 661 9 |
| [Sii]6731 | 0.90 0.14 | 0.23 0.02 | 6732.0 0.1 | 31 5 | 661 9 |
| [Oi]6300 | 1.20 0.11 | 0.30 0.01 | 6302.6 0.7 | 126 35 | 661 9 |
| a Central wavelength measured at the peak of the line. | |||||
| b Velocity difference with respect to the systemic value. | |||||
| c RP stands for red-peaklet. | |||||
3.2 The relativistic disk model
A relativistic disk model was used to fit the broad emission line component of H (see Chen et al., 1989; Chen & Halpern, 1989). The fit was meant to account for the RP in the profile observed at Å. This is the main peculiarity with respect to the typical Balmer line profiles of sources with FWHM H 4000 km s-1 (e.g., Zamfir et al., 2010, Population B following Sulentic et al. 2011). In most cases, Population B objects show a prominent red wing or VBC (Sulentic et al., 2002), so it cannot be considered as a peculiarity. The second characteristic of this class of AGN is associated with the core, whose centroid appears significantly blueshifted.
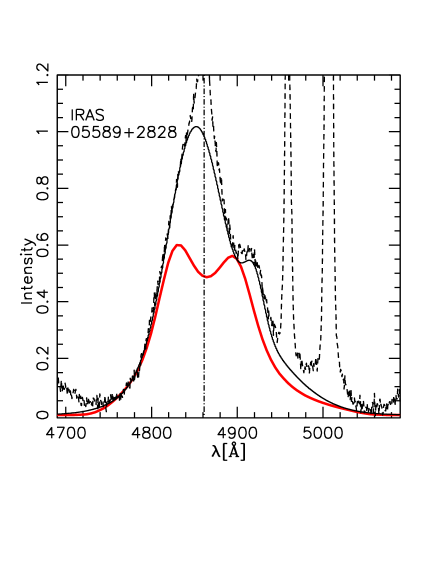
The disk profiles shown in Figure 7 can account for part of the emission lines, as was found in previous works (see, for example Bon et al. 2007, 2009). The left panel in Figure 7 shows that a disk profile seen at low inclination (viewing angle = 15∘, defined as the angle between the line-of-sight and the disk axis-of-symmetry) with a steep emissivity law as a function of the disk radius with (), and inner radius , can account for the RP. However, it clearly fails to reproduce the core as well as the extended red wing. Increasing the inclination and reducing the inner radius ( ) produces a fit that is able to reproduce fairly well the line base, nicely fitting the blue side and accounting for the shape of the red wing, but the RP is not reproduced. Therefore, the blue excess and the RP observed in the H profile of IRAS 05589+2828 should have a different origin.
Since in all the optical spectra obtained with the three telescopes the RP is observed, in order to establish the possible origin of this feature, an estimation of a possible spatial separation between IRAS 05589+2828 and the RP is done using the 2D Copernico/AFOSC red spectrum. A section of the 2D spectrum centred in the H region of IRAS 05589+2828 was analysed (see Sun et al., 2011). A series of Gaussian functions are fit line by line throughout the spectrum, estimating the FWHM in each one. Starting at the peak of the H emission, the collection of FWHM, with a mean of 5.18 pixels, were analysed. A small protuberance stands out in the middle of the noise at pixels 38-39, equivalent to a 75.15-77.13 Å towards the red. This, in turn, is equivalent to 3435 - 3525 km s-1, consistent with the adjustment of the RP mentioned before. The maximum value of this peak, representing a transversal widening of the spectra in the spatial direction, is only 0.1 pixel (0.096 0.046) over the mean value of 5.18. This spatial size corresponds to 33 16 pc. Certainly, this detection is marginal and purely statistical, being a small fraction of a pixel, where a full pixel covers 330 pc.

3.3 2MASX J06021107+2828382
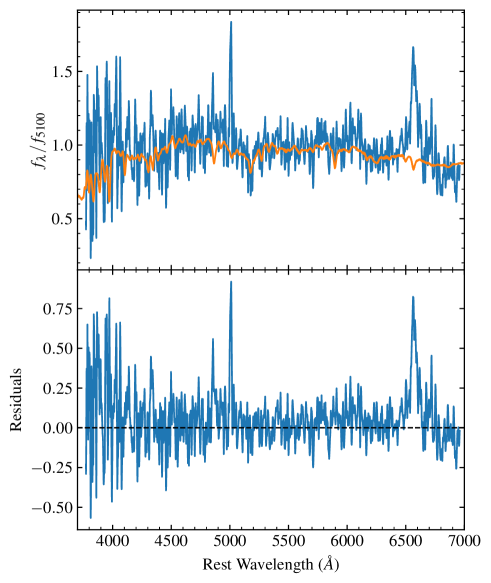
The optical spectrum of 2MASX J06021107+2828382 was obtained in 2018 October with the 2.1m/B&Ch (see details in Table 1). In order to model the stellar spectrum of the host galaxy of 2MASX J06021107+2828382 we use the starlight code (see Cid Fernandes et al., 2005). The spectrum was corrected for Galactic extinction using the dust maps by Schlegel et al. (1998) and the extinction law of Cardelli et al. (1989) with .
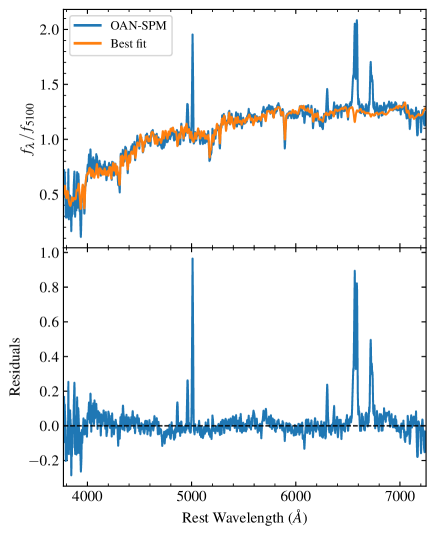
starlight works by representing the observed spectrum as a linear combination of spectra in a given base, which are later convolved with a Gaussian kernel to fit the kinematics, at the same time accounting for the dust in the target galaxy by simultaneously fitting an attenuation curve. In our case, the base was composed by simple stellar populations (SSP) from the MILES library (Vazdekis et al., 2010). For regions affected by atmospheric absorption and by H+[NII] and H+[OIII] emission line complexes, different masks were used in order to exclude these features from the fit. The fitted spectrum after one hundred realizations is presented in Figure 8.
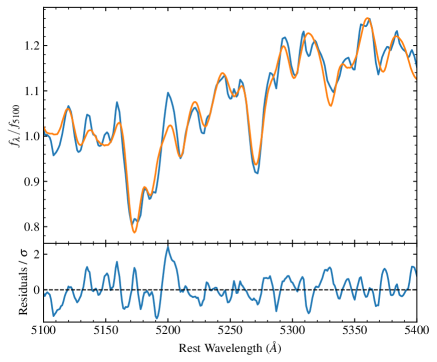
In order to estimate the kinematic parameters, we used a smaller portion of the spectrum with numerous stellar absorption lines, between 5100Å and 5400Å. The uncertainties in the best fit parameters were derived from 100 Monte Carlo realizations, each time having the flux in each pixel randomized by a normal distribution with a standard deviation equivalent to a signal-to-noise ratio of 32. The obtained systemic velocity is VR = 1005718 km s-1. Therefore, 2MASX J06021107+2828382 is the companion galaxy of IRAS 05589+2828 since the latter has a systemic velocity of VR = 9893.15250 km s-1. We estimate a stellar velocity dispersion of = 19110 km s-1, based on the best fit broadening of = 22710 km s-1, an instrumental broadening of 13731 km s-1, and the 58.4 km s-1 resolution of the MILES spectral library.
Once the contribution of the host galaxy was subtracted, the fit was done without the need of a power law. The pure emission lines were modelled using the Specfit code. Gaussian components were used to obtain the best fit, see Figure 8 and Table 3. The pure emission of 2MASX J06021107+2828382 shows that this object is an obscured Type 2 (Sy2) AGN (Antonucci, 1993).
| 2.1m/B&Ch | Flux 10-14 | Luminosity 1041 | FWHM | |
|---|---|---|---|---|
| erg s-1 cm-2 Å-1 | erg s-1 | Å | km s-1 | |
| H | 13.41 0.67 | 3.36 0.08 | 4863.4 0.3 | 641 9 |
| [Oiii]5007 | 70.70 1.01 | 17.69 0.13 | 5009.1 0.1 | 641 9 |
| H | 79.01 1.85 | 19.77 0.23 | 6565.2 0.2 | 601 10 |
| [Nii]6583 | 69.63 1.63 | 17.42 0.20 | 6585.4 0.2 | 601 10 |
| [Sii]6716 | 41.53 1.68 | 10.39 0.21 | 6717.8 0.3 | 601 10 |
| [Sii]6731 | 30.27 1.53 | 7.57 0.19 | 6734.4 0.5 | 601 10 |
| [Oi]6300 | 20.83 1.24 | 5.21 0.15 | 6301.2 0.4 | 601 10 |
3.4 Black hole mass estimates
Previous spectroscopic studies on IRAS 05589+2828 have obtained MBH estimates using the complete broad component (e.g. Winter et al., 2010; Raimundo et al., 2012). Nevertheless, due to the complex broad profiles shown by the Balmer lines of IRAS 05589+2828 (e.g. in Figure 4) an estimation of the black hole mass MBH can be obtained using an empirical correction applied to this type of lines (see Marziani et al., 2019). In particular, this correction is applied if the VBC of IRAS 05589+2828 is produced by a radial velocity excess that could be associated with gas with a velocity component increasing towards the central black hole. So, in that case, the full profile was symmetrized through the relation FWHMsymm = FWHM , where c is the velocity centroid estimated at half-maximum. So, assuming that the FWHMsymm is a virial estimator, the MBH of IRAS 05589+2828 is log MBHsymm = 8.59 0.14 (M⊙). Another way to correct the complete FWHM empirically is to consider the spectral type associated with the parameter space of Eigenvector 1, under the assumption that the broad symmetric component of H is representative of the virialized region of the BLR. IRAS 05589+2828 is a population B AGN in this parameter space, since its FWHM(H) 4000 km s-1. In this case, the correction proposed by Marziani et al. (2019) is FWHMvir = 0.8 FWHM, and the obtained black hole mass estimate is log MBHvir = 8.440.13 (M⊙). Both results are in agreement within a factor of 1.4. In a recent work by Smith et al. (2020) an estimation of the MBH of IRAS 05589+2828 is log MBH = 8.69 (M⊙). This result is in agreement with our values, although the authors do not specify the method used in their estimation. The bolometric luminosity was computed using the luminosity continuum at 5100Å, and a bolometric correction factor of 10.33 (Richards et al., 2006). We obtained a value of Lbol(IRAS) = 45.11 0.09 (erg s-1). Table 4 shows the results of the black hole mass estimations for all the cases. With these results, the Eddington ratio = Lbol/LEdd was computed for IRAS 05589+2828, assuming an Eddington luminosity of LEdd = 1.51038 (MBH/M⊙) erg s-1. The Eddington ratios for the two MBH estimations obtained for IRAS 05589+2828 are (symm) = 0.026 0.020 and (vir) = 0.037 0.020.
In the case of 2MASX J06021107+2828382, since it is a Type 2 object, the MBH was obtained using the velocity dispersion of bulge stars obtained in Section 3.3 and the MBH vs. relation from McConnell & Ma (2013). Therefore, MBH = 8.210.2 (M⊙). The bolometric luminosity was computed using the [Oiii]5007 luminosity corrected by the Balmer decrement L, given by Lbol = C[OIII] L with a bolometric correction factor C[OIII] = 142 (Lamastra et al., 2009). We obtained for 2MASX J06021107+2828382 a bolometric luminosity Lbol= 45.26 0.04 (erg s-1), and an Eddington ratio = 0.023 0.003.
| Object/method | FWHM | log MBH | |
|---|---|---|---|
| km s-1 | M⊙ | ||
| IRAS 05589+2828 | |||
| Sym | 6549 403 | 8.59 0.14 | 0.026 0.020 |
| Vir | 5526 314 | 8.44 0.13 | 0.037 0.020 |
| 2MASX J06021107+2828382 | |||
| M- | - | 8.21 0.20 | 0.023 0.003 |
3.5 BPT Diagrams
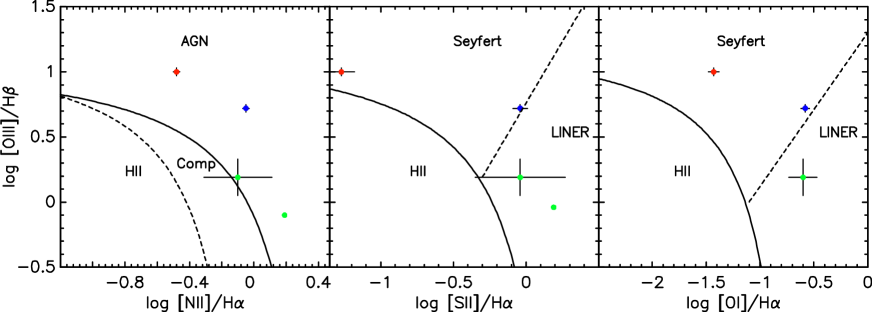
BPT diagnostic diagrams (Baldwin et al., 1981; Veilleux & Osterbrock, 1987) were used to classify IRAS 05589+2828 and 2MASX J06021107+2828382. In all BPT diagrams shown in Figure 10 the solid curved line traces the upper theoretical limit due to pure HII region contribution established by (Kewley et al., 2001). The dotted line in the [NII] diagnostic provides an empirical upper limit, measured by Kauffmann et al. (2003). The region lying between these two lines represents objects with spectra showing emission from HII regions, but also from the AGN. Sy galaxies occupy the upper region of the diagrams, and the dotted-lines in the [SII] and [OI] diagrams show the region of sources with LINER-like emission (Kewley et al., 2006). The line ratios, obtained with the more intense narrow component, are presented in Table 5. In the three diagrams, IRAS 05589+2828 and 2MASX J06021107+2828382 appear in the AGN region.
In order to analyse the spectrum of the bridge zone, the starlight code was used following the methodology explained in Section 3.3. After fitting and subtracting the contribution from the host galaxy, line ratios were estimated from the emission spectrum (see Figure 9) and are shown in green colour in the BPT diagrams. In all diagrams, the bridge zone emission appears in the LINER-like region.
| Line ratios | 2MASX J06021107+2828382 | IRAS 05589+2828 | Bridge zone |
|---|---|---|---|
| log[Oiii]5007/H | 0.720.03 | 1.000.03 | 0.190.14 |
| log[Nii]6583/H | -0.050.02 | -0.480.02 | -0.100.21 |
| log[Sii]6716,6731/H | -0.040.05 | -1.270.09 | -0.040.31 |
| log[Oi]6300/H | -0.580.04 | -1.430.05 | -0.600.13 |
4 VLA–data
In the archives of the Karl G. Jansky Very Large Array (VLA) of NRAO555The National Radio Astronomy Observatory is a facility of the National Science Foundation operated under cooperative agreement by Associated Universities, Inc. observations of IRAS 05589+2828 were found as part of the project 13A-281 during 2013 July 20. These observations were made in the radio K-band (18 to 26 GHz, with a central value of 22 GHz) with the VLA in the C configuration. The data were calibrated in the standard manner using the CASA (Common Astronomy Software Applications) package of NRAO and the pipeline provided for VLA666https://science.nrao.edu/facilities/vla/data-processing/pipeline observations. This pipeline consists of a sequence of individual tasks that are applied to the data with the final goal of calibrating it in amplitude and phase. Images are then obtained by Fourier transforming of the calibrated data. In addition, the data were self-calibrated in phase once. Additional self-calibration iterations did not produce any significant improvement. These observations have been reported previously by Smith et al. (2020). They made images with robust weighting of -0.5 (Briggs, 1995), to compromise between sensitivity and angular resolution, while we used a robust weighting of 2, to obtain the highest sensitivity possible. Smith et al. (2020) detect IRAS 05589+2828 with a total flux density of 2.79 mJy, while we do it with a total flux density of 3.00.1 mJy (see left contour image in Figure 11). The slightly larger value determined by us from the same data is probably due to the different weighting schemes.
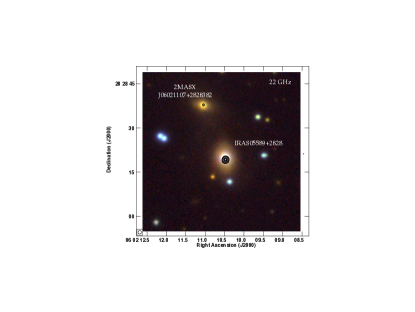
In addition to IRAS 05589+2828, we report for the first time the detection at 22 GHz of 2MASXJ06021107+2828382 with a total flux density of 0.200.03 mJy (see Figure 11). These two sources are the only ones above 5 in a region of 1′1′centered on IRAS 05589+2828 (Figure 11). Both sources appear unresolved for the angular resolution of 1″. In Table 6 we summarize the parameters of the two sources.
| Source | Positiona | Flux Density (mJy) | Spectral | ||
|---|---|---|---|---|---|
| RA (2000) | DEC (2000) | 3 GHz | 22 GHz | Index | |
| IRAS 05589+2828 | 06:02:10.4750.001 | 28:28:19.240.01 | 5.00.3 | 3.00.1 | -0.260.03 |
| 2MASXJ06021107+2828382 | 06:02:11.0290.032 | 28:28:37.940.37 | 0.81 0.14 | 0.200.03 | -0.700.11 |
| a Positions from the 22 GHz data. | |||||
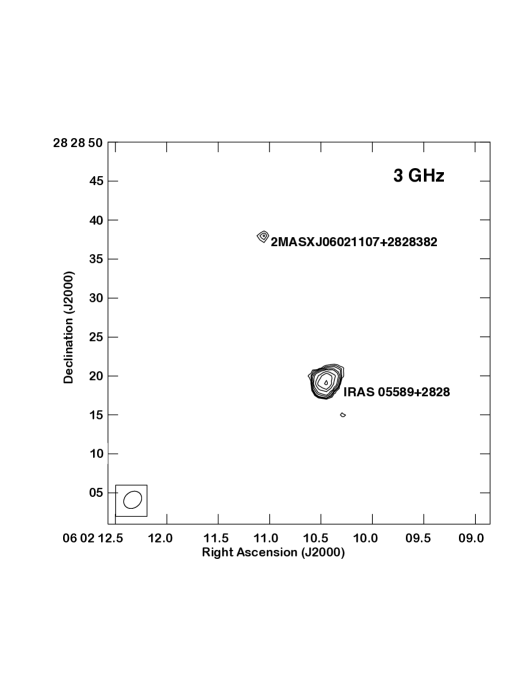
To determine the spectral index of these sources, a Quick Look image from the first epoch of the Karl G. Jansky Very Large Array Sky Survey (VLASS) was used. A detailed description of this survey is given by Lacy et al. (2020). In brief, the observations of this survey are made in the S-band (2 to 4 GHz, with a centre value of 3 GHz) with a typical angular resolution of . The Quick Look images of the VLASS have limitations, in particular the positions are accurate only to and the total flux densities of the second campaign of the first epoch (when the image of interest was obtained) are systematically low by 3%. We corrected the image for this underestimate. A more detailed discussion of the limitations is given in the homepage of NRAO. 777https://science.nrao.edu/vlass/data-access/vlass-epoch-1-quick-look-users-guide
The contour images at 3 GHz and 22 GHz from the VLASS are presented in the upper and lower panels in Figure 11, respectively. As in the case of the 22 GHz image, the only sources detectable above 5- in the region are IRAS 05589+2828 and 2MASXJ06021107+2828382. The compactness of both sources favours an AGN nature.
The flux densities are given in Table 6, as well as the spectral indices derived from the 22 and 3 GHz observations. The spectral index of IRAS 05589+2828 of -0.260.03 is flat, which is characteristic of compact AGN, while the spectral index of 2MASXJ06021107+2828382 of -0.700.11 favours optically thin synchrotron emission from an AGN (see Müller-Sánchez et al., 2015). The separation between the two sources is 20.08″ which at the distance of IRAS 05589+2828 corresponds to 13.3 kpc.
5 X-ray–data
IRAS 05589+2828 has been pointed in X-ray with both Swift and Chandra observatories. All observations included both IRAS 05589+2828 and its companion galaxy 2MASX J06021107+2828382. The sources were in the field of view of a series of three Swift observations with identification numbers 3525501, 3525502, and 3525503 with respective exposures of 7.5, 5.1, and 4.3 ks, and observed during 2006 March 3 and 6, and April 21, respectively. The Chandra observation, with identification number 12864, was obtained on 2011 January 16 with a total exposure time of 16 ks. At the moment, XMM-Newton has not pointed IRAS 05589+2828, but the source was detected in the second version of the XMM-Newton Slew-Catalog (Saxton et al., 2008) from an observation during 2003 March 26, reporting a count rate of 3.96 counts s-1. The associated estimated flux in the 0.2 - 12 keV band is 1.3 0.310-11 erg cm-2 s-1. In the following, we will analyse the Swift and Chandra data available, studying both the images and spectroscopic data.
For both Swift and Chandra data, we have followed the standard procedures for their reduction described in the respective satellite documentation. For the Swift observations, we have only considered the XRT data. The three available observations have been obtained with the Photon Counting mode, using the 600600 pix2 (23.623.6 ′2) pointing configuration. The data were reduced according to the procedure described in The SWIFT XRT Data Reduction Guide v1.2. Chandra observed the source using the ACIS-S detector; the data have been reprocessed according to the standard procedure and using the CIAO v4.13888See https://cxc.cfa.harvard.edu/ciao/ and Fruscione et al. (2006) and the CALDB 4.9.4 .
X-ray spectra of all available observations have been extracted and analysed. For the three Swift observations of the whole X-ray emission inside a circle of radius 1′ were extracted. The background was extracted in a region of the same size located close to the source but free of any spurious emission. The Swift spectra have been then grouped in order to have at least 15 counts per bin. In order to extract and analyse the Chandra spectrum of the source, we have extracted the source and background spectra using the reprocessed Chandra data, a level = 2 event file with the standard filtering. The source spectrum was obtained from a circular region of 7.6″, centred in the pixel of maximum emission of the source. The background spectrum was obtained from the combination of four circular regions of 9″ located close to IRAS 05589+2828 but free from any other source of emission. The spectrum has then been grouped in order they have at least 15 counts per bin in order to be able to apply the statistics. The spectral analysis has been performed using the package sherpa inside CIAO v4.11999See https://cxc.cfa.harvard.edu/sherpa/ and Freeman et al. (2001).
5.1 X-ray Spatial Analysis
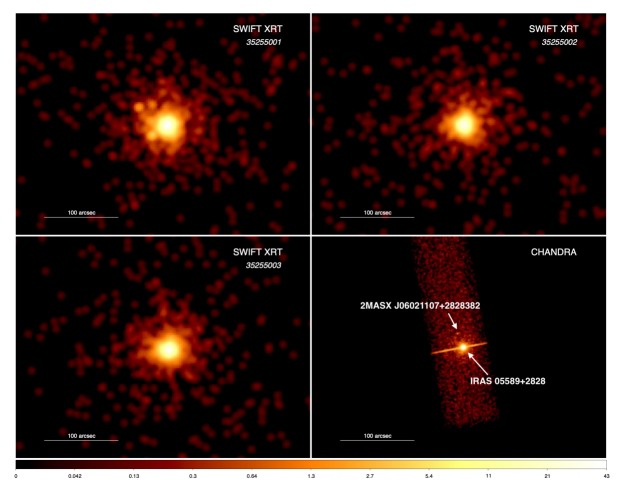
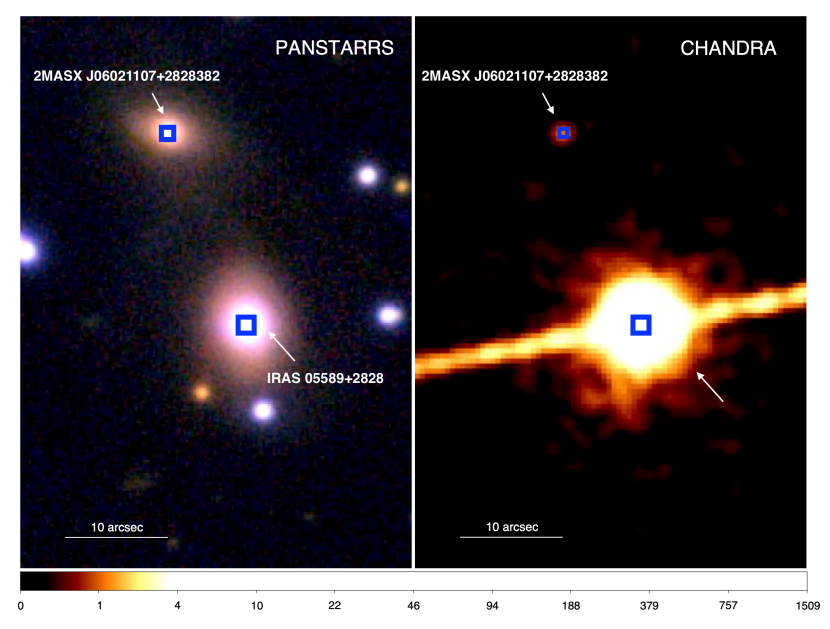
For the spatial analysis of the IRAS 05589+2828 field of view, we have considered the three XRT Swift and the Chandra observations. Figure 12 shows the three Swift and Chandra images in the 0.5-10 keV energy band. All four images have been smoothed. The images show that IRAS 05589+2828 is detected as a point-like source in the Swift observations, but the PSF extends to the location 2MASX J06021107+2828382. However, the Chandra resolution allows disentangling both IRAS 05589+2828 and a weak companion source. In Figure 13, we compare the PanSTARRS image of source, on the left, with the Chandra image, on the right. The PanSTARRS image is a composition of the z and g filters. We have located the position of the maximum Chandra emission in both images, showing that the location of the brightest source coincides with the location of IRAS 05589+2828 and the location of the weakest source coincides with the location of 2MASX J06021107+2828382. No other sources have been detected in the X-ray images. It is worth noting that the 3525001 XRT observation, the deepest Swift observation, shows several point sources surrounding the East and North part of the X-ray bulk emission, as seen in the first panel of Figure 12. These sources do not coincide with any of the sources detected in optical images. It is not clear if these sources are real or are only artefacts of the fluctuations of the X-ray images and not real X-ray sources. It is also worth noting that the Chandra image shows that IRAS 05589+2828 clearly suffer from piled-up, last panel of Figure 12, showing the characteristic signature of the saturation streak.
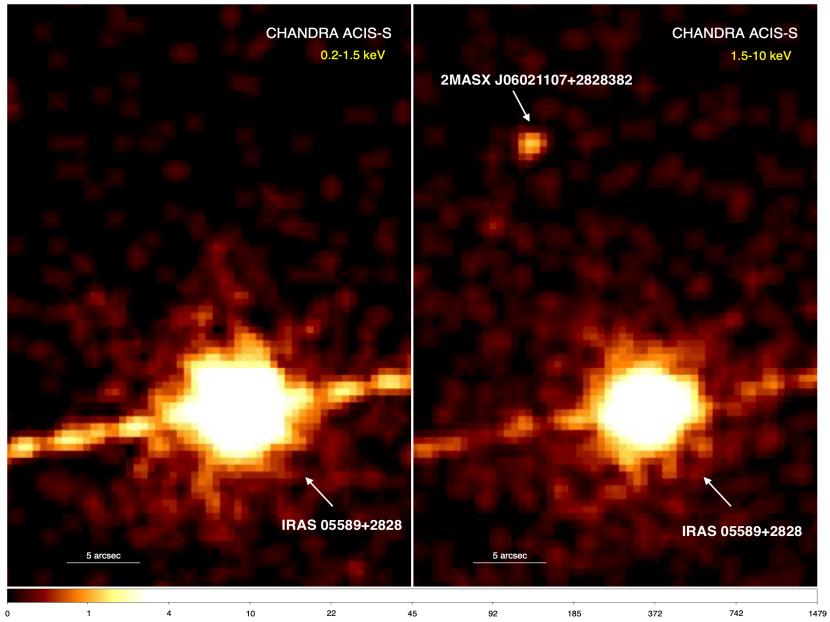
In order to further explore the X-ray image, we have generated two Chandra images in the soft (0.2-1.5 keV) and hard (1.5-10 keV) bands. Both images can be seen in Figure 14. Interestingly, the weakest source, identified with 2MASX J06021107+2828382, is not detected in the soft band. A close inspection shows that while in the hard band image, a total of 24 counts are detected in a circle of radius of 3 pixels, or 1.476″, only three counts are detected in the same extraction area, indicating that the source is likely to be highly absorbed, being the reason of the lack of photons at soft energies. This result is compatible with the Type 2 nature of 2MASX J06021107+2828382, as found with our optical spectroscopic analysis.
5.2 X-ray Spectral Analysis
In order to study the spectra of IRAS 05589+2828, we have tested several emission models for Chandra and Swift data. We have modelled all data sets individually, but also we have fitted all spectra simultaneously, in which only the normalization of the components for each of the spectra have been left unbounded among the observations. The results obtained for parameters and goodness of the fits are given in Table 7. A local galactic absorption, in the line of sight of IRAS 05589+2828 of 3.37 cm-2 (HI4PI Collaboration et al., 2016), has been considered.
For the Chandra observation, as it is shown in Figures 13 and 14, the X-ray image shows a streak characteristic of the saturation of the CCD by the source. In order to account for pile-up, we have followed the The Chandra ABC Guide to Pileup. The pile-up was taken into account by including the pileup (Davis, 2001) model when fitting the spectrum. The pile-up model has two free parameters: which represents the probability, per photon count greater than one, that the piled event is not rejected by the spacecraft software as a bad event and , the fraction of events in the source extraction region to which pileup will be applied. For our data, the best fit values for each parameter are in the range of 0.40-0.70 and 0.85 - 0.91, depending on the model. The pile-up fraction obtained for the several tested models ranged in 30 - 50%.
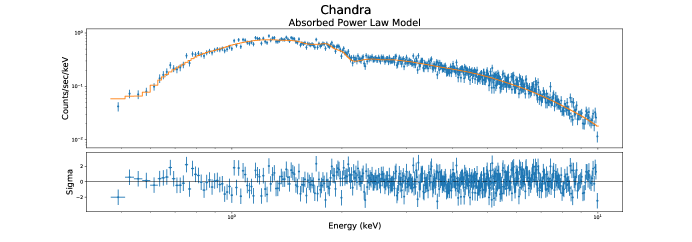
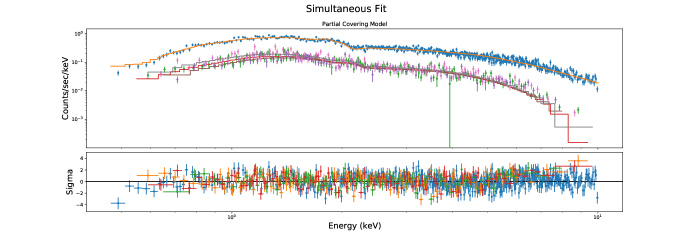
The spectra shown in Figure 15 were fitted using: i) a single power law model, and ii) an absorbed power law at the redshift of the galaxy model. The i) single power law model provides a fairly acceptable description for all data sets with values of in the range of 1.06 - 1.24. The values of the power law index are in the range of 1.03 and 1.39, considered to be low for expected values of AGN sources.
We then considered if the ii) absorbed power law model provides a better fit to our data sets. According to the F-test, only the fit for the Chandra data improves by the inclusion of a neutral absorption component. The resulted value for is and the NH is . The is 1.02 for 476 dof. However, for the Swift spectra and the simultaneous fit, the fits do not improve significantly and the values of the power law indices remained similar to the ones for the single power law model. At the same time, the values of the absorption obtained are low, of the order of .
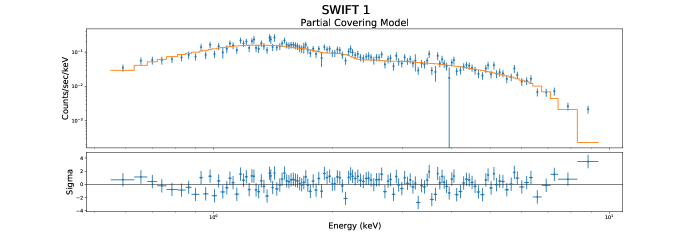
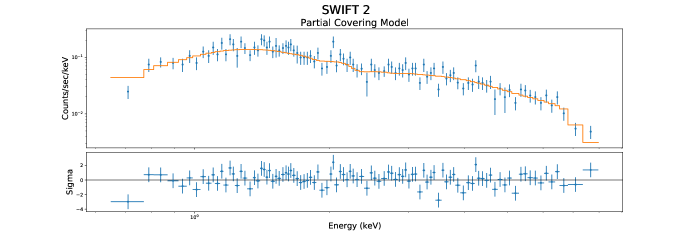
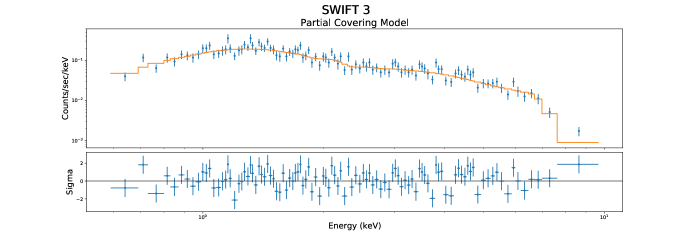
Motivated by the flatness of the power law and in order to further understand the X-ray emission of IRAS 05589+2828, we also tested for all the spectra an iii) partial covering model. This model provides a statistically better explanation for the simultaneous fit, with an F-test probability %. The three Swift spectra fits also improve when this model is applied, with F-test probabilities of 96%, 99.3% and 99.56% for Swift-1, 2, and 3 respectively. The intrinsic absorption values measured are in the range of , highly exceeding the local galactic extinction of 3.37 cm-2 (HI4PI Collaboration et al., 2016). The indices of the power law remain flat, in the order of magnitude of . When this model is applied to the Chandra spectrum there is no statistical improvement of the fit and, in fact, the found values are fully compatible with the absorbed power law model.
We have also tested the possibility of the presence of an iron line by adding this component to the best fit model of each spectrum. We have included a Gaussian line with the energy fixed to 6.4 keV and the energy width fixed to the instrumental resolution. For none of the data set, the inclusion of the Fe K line improves the fit.
Table 7 also shows the derived fluxes and luminosities for the best fit model for each data set, marked in bold in the value of the in the same table.
In the field of view of Chandra observation we have also detected 2MASX J06021107+2828382. However, the counts of this source are not enough to extract a spectrum. We have calculated the hardness ratio considering the 0.5 - 2 keV and 2 - 10 keV bands, obtaining a value of 0.85, with 25 counts in the hard band and only two counts in the soft band. Using the relationship in Tozzi et al. (2006), we have also estimated the flux in the 0.5 - 2 keV and the 2 - 10 keV bands, assuming a Galactic absorbing column of 8 and a photon index of = 1.4, the model which describes well the average spectrum of the sources detected in the Chandra Deep Field South. The values obtained are F = 6.310-16 erg s-1 cm-2 and F = 5.010-14 erg s-1 cm-2. The soft emission is negligible, probably due to a high intrinsic absorption (see Wilms et al., 2000; Hickox & Alexander, 2018).
| Observation | Chandra | SWIFT 1 | SWIFT 2 | SWIFT 3 | Simultaneous | |
| Obs. ID | 35255001 | 35255002 | 35255003 | |||
| Obs. Date | 03-03-2006 | 06-03-2006 | 21-04-2006 | 06-01-2011 | ||
| Exposurea | 6.4 | 5.0 | 4.3 | 14.5 | ||
| Count Rateb | 0.379 | 0.365 | 0.427 | 1.9460.012 | ||
| Model: phabs*powerlaw | ||||||
| c | ||||||
| Normalization Chandrae | ||||||
| Normalization Swift1e | ||||||
| Normalization Swift2e | ||||||
| Normalization Swift3e | ||||||
| alphaf | ||||||
| fg | ||||||
| 537.27 | 159.38 | 104.94 | 124.19 | 974.97 | ||
| DOFh | 477 | 129 | 99 | 104 | 812 | |
| 1.13 | 1.24 | 1.06 | 1.19 | 1.20 | ||
| Model: phabs*zphabs*(powerlaw) | ||||||
| d | ||||||
| c | ||||||
| Normalization Chandrae | ||||||
| Normalization Swift1e | ||||||
| Normalization Swift2e | ||||||
| Normalization Swift3e | ||||||
| alphaf | ||||||
| fg | ||||||
| 485.585 | 159.38 | 102.54 | 124.19 | 973.65 | ||
| DOFh | 476 | 128 | 98 | 103 | 811 | |
| 1.02 | 1.25 | 1.05 | 1.21 | 1.20 | ||
| Model: Partial Covering | ||||||
| d | 185 | 215 | ||||
| c | 1.37 | 1.24 | 1.1 | 1.31 | 1.28 | |
| Normalization Chandrae | 7.0 | 10.8 | ||||
| Normalization Swift1e | 3.25 | 3.39 | ||||
| Normalization Swift2e | 2.69 | 3.05 | ||||
| Normalization Swift3e | 3.89 | |||||
| Normalization B Chandrae | 100 | 70 | ||||
| Normalization B Swift1e | 5 | 25 | ||||
| Normalization B Swift2e | 2.6 | 50 | ||||
| Normalization B Swift3e | 70 | 36 | ||||
| alphaf | 0.58 | 0.403 | ||||
| fg | 0.85 | 0.856 | ||||
| 519.93 | 151.45 | 94.64 | 111.65 | 906.59 | ||
| DOFh | 475 | 127 | 97 | 102 | 807 | |
| 1.09 | 1.19 | 0.98 | 1.09 | 1.12 | ||
| Fluxes and luminositiesi | ||||||
| Flux | 11.3 | 4.14 | 3.59 | 4.96 | ||
| Flux | 33 | 3.45 | 8 | 4.0 | ||
| Luminosity | 7.7 | 5.30 | 20.9 | 68 | ||
| Luminosity | 9.3 | 19 | 100 | 320 | ||
| a Exposures are given after filtering all bad events. Values are given in ks. | ||||||
| b Count rates are given in counts/second. | ||||||
| c is the index of the power law. | ||||||
| d NH is in units of 10. | ||||||
| e Normalizations of the power law model in units of photons keV-1 cm-2 s-1 at 1 keV. | ||||||
| f alpha:parameter of jdpileup pile-up model. Represents the probability, per photon count greater than one, that the piled event is not rejected by the spacecraft software. | ||||||
| g f is a parameter of jdpileup pile-up model and represents the fraction of pile-uped events extracted. | ||||||
| h DOF corresponds to the degrees of freedom. | ||||||
| i Flux in units of erg s-1 cm-2 and luminosity in units of erg s-1. | ||||||
6 Discussion
The new optical spectroscopic data of IRAS 05589+2828 show it has complex emission line profiles (c.f., Fig. 4, 5, 6 and 7). For the narrow emission line profiles, the best model is obtained using two Gaussian components. Therefore, we find that IRAS 05589+2828 has a double narrow line component that is shifted from the systemic restframe by 1 Å. On the other hand, the best model for the broad Balmer emission line profiles was obtained with three Gaussian components. One for the blueshifted or MC component (FWHM 5043 km s-1), that shows no evidence of outflows or winds; a very broad component VBC (with a FWHM 7479 km s-1) that shows a redshifted asymmetry; and a third Gaussian component that was used to fit the red-peaklet or RP.
The large H width and the modest FeII emission place IRAS 05589+2828 among Population B sources (Sulentic et al., 2011). Also, it is worth mentioning that the profile of the HeII4686 line is different from the profile of H. This result is in agreement with a VBC and also with having little or no contribution from the broad component as is frequently observed in Population B quasars (e.g., Boroson & Green, 1992; Marziani et al., 2003).
A relativistic disk model was used to fit the H broad component without successful results. Therefore, one possibility is that the origin of the VBC is gravitational redshift due to the presence of a very close disturber (e.g., Bon et al., 2018). Also, the RP was found with a radial velocity shifted by 3500 km s-1, with respect to the systemic velocity. The analysis done to the 2D spectrum of IRAS 05589+2828 suggests that the RP has a projected separation of 33 pc.
The most striking peculiar feature in the spectrum is the RP. Its large radial velocity suggests that it might be a component of a (bound) double BLR associated with a second black hole orbiting around a central, more massive black hole. Therefore, the separation between the SMBH of IRAS 05589+2828 and the RP can be obtained (the projected separation of 33 pc is a broad upper limit) using the SMBH mass estimate of IRAS 05589+2828 and the radial velocity of the RP of 3500 km s-1. The projected radial velocity , where is the Keplerian orbital velocity, is the orbit inclination, and an azimuthal angle ( if the velocity vector is aligned with the line of sight). Since the black hole mass is known, we can compute the orbital separation as and we obtain a separation 0.1 pc. Based on this result, the RP and IRAS 05589+2828 could be forming a binary-AGN system with a sub-pc scale separation. On the other hand, the possibility that the RP is the result of outflows from circumnuclear star clusters seems unlikely because of both, the high velocity and the red-ward displacements found. Even in the case of it being due to super star clusters, expected outflow velocities are 1000 km s-1 (e.g., Bik et al., 2018), and in the case of luminous starbursts, outflow velocities are km s-1(Le Tiran et al., 2011). Finally, the possibility of a feature associated with shocked gas in a hot spot within the accretion disk cannot be ruled out, and is actually a likely alternative to a second BLR associated with a massive compact object (see the thorough discussion for two of the most-extensively-monitored type-1 AGN, NGC 4151 and NGC 5548 (Bon et al., 2012, 2016)). Therefore, in order to confirm the nature of the RP, spatially-resolved spectroscopic observations are needed.
Among the neighbours of IRAS 05589+2828 we find that apparently, there is a broad feature on the blue side of H on IRAS 05589+2828 NE, shown in panel b of Figure 1. This feature may not be a real broad component, but produced by the addition of narrow lines emitted by gas with a steep velocity gradient, as was found in the study of the interacting mixed galaxy pair CPG 29 (see Marziani et al., 1994). The spectrum of 2MASXJ06021038+2828112, shown in panel c of Figure 1, has stellar-like features. Finally, the spectrum of 2MASX J06021107+2828382 shown in panel d of Figure 1, reveals that it is an obscured Sy2 galaxy.
The BPT diagrams of the bridge zone show that there is a LINER-like extended emission region. This is consistent with our results obtained in the 2D spectra analysis of IRAS 05589+2828, where extended emission is found both in the blue and red spectral regions with an estimated size of 4.9 kpc. This result suggest that the bridge of ionized gas is connecting both AGN probably as a consequence of an ongoing wet merger. For instance, the extended LINER-like emission has been proposed to be due to shocks (e.g. Rich et al., 2011), so in this case, the shocked gas in the bridge zone will support evidence for the merger scenario.
The SMBH mass estimates for IRAS 05589+2828 were obtained applying two different corrections given in Marziani et al. (2019). The results are log MBHsymm = 8.59 0.14 (M⊙) and log MBHvir = 8.440.13 (M⊙) and both results are in agreement within a factor of 1.4. On the other hand, the SMBH of 2MASX J06021107+2828382 is log MBH = 8.210.2 (M⊙). This result was obtained using the MBH- relation.
The IRAS 05589+2828 field of view has been pointed in X-ray three times with the Swift satellite, and once with Chandra, see Figure 12, and it is included in the XMM-Newton Slew-Catalog. The exposures range from 2.4 to 14.5 ks. IRAS 05589+2828 is a bright source in X-ray with flux of the order of erg s-1 cm-2 and luminosity of the order of 1044 erg s-1 in the 0.5 - 10 keV band, and has been detected in all observations (c.f. Figs. 12, 13 and 14). In fact, the Chandra observation suffers from pile-up.
The Chandra spatial resolution allows detecting also the companion galaxy 2MASX J06021107+2828382, embedded in the PSF of the IRAS 05589+2828 in the XRT-Swift observations. The location of both IRAS 05589+2828 and 2MASX J06021107+2828382 coincides with the location of the optical counterparts, as can be seen in Figure 13. A closer look at the Chandra image (see Figure 14) shows that while IRAS 05589+2828 soft emission dominates over the hard emission, as expected for a Type 1 source, while 2MASX J06021107+2828382 soft emission is negligible, favouring a Type 2 class for this source. These findings are in good agreement with the results on the optical spectral analysis for both sources.
The four available X-ray spectra of IRAS 05589+2828 have been extracted. All the spectra can be fitted with a single power law model. The inclusion of intrinsic absorption at the location of the galaxy does not improve any of the fits. The results of all fits can be seen in Table 7. Except for the 35255001 Swift observation, the fits are statistically acceptable, with in the 1.22 to 1.00 range. However, this Swift image show hints of point-like X-ray sources surrounding the emission of IRAS 05589+2828. The spectrum extracted in a region which avoids these sources, = 18″, provides a much better fit, = 0.99, but leaving unchanged the value of the power law index, = 1.230.07.
Source flux variations in IRAS 05589+2828 were detected. These are more evident in the soft band, and also in the power law index, being the Chandra ones showing the highest values. A comparison of the Chandra observed flux with the mean fluxes from the three SWIFT observations, in the soft and hard bands, shows that Chandra flux is 2.6 and 1.6 higher, respectively. The flux variation is evident by comparing these results with the flux estimated in the XMM-Newton Slew Catalogue, F = 1.110-11 erg s-1 cm-2, and with the ones obtained in the three Swift and Chandra observations, in the same energy band: 3.2 erg s-1 cm-2, 3.2 erg s-1 cm-2, 3.5 erg s-1 cm-2, and 5.7 erg s-1 cm-2, respectively.
The source is therefore clearly variable and although one of these fluxes is only an estimate, the flux of the Chandra observation, obtained in 2011 January 6 is more than five times higher than the lowest flux measured earlier by XMM-Newton in 2003 March 26. The counts detected for 2MASX J06021107+2828382 in the Chandra observation are too low to allow an extraction and analysis of its spectrum. However, we have estimated the flux using the count rate of the source. The values obtained are F = 6.3 erg s-1 cm-2 and F = 5.0 erg s-1 cm-2, being the soft band flux two orders of magnitude lower than that of the hard band, revealing the hard (obscured) nature of this source as a Type 2 AGN.
The multiwavelength analysis done in this work strongly suggests that the previously identify DAGN in IRAS 05589+2828 and 2MASX J06021107+2828382 consists of a pair of Sy1–Sy2 galaxies. The overlayed optical and radio maps presented in the lower panel of Figure 11 show that IRAS 05589+2828 and 2MASX J06021107+2828382 are compact radio sources. The detection of 2MASX J06021107+2828382 in the radio bands, along with its black hole mass estimate and systemic velocity are presented for the first time in this work. Finally, the obtained projected separation with the VLA data of this DAGN system is 20.08 ″ that corresponds to 13.3 kpc.
Data Availability
The optical data underlying this article will be shared on reasonable request to the corresponding author. The PanSTARSS images are available at http://ps1images.stsci.edu/cgi-bin/ps1cutouts. The VLA data are available at htpps://science.nrao.edu/vlass/data-access. Swift data are available at https://swift.ac.uk/archive/ (Obs.ID 3525501,3525502,3525503). Chandra data are available at https://asc.harvard.edu/cda/ (Obs.ID 12864).
Acknowledgements
We thank the anonymous referee for useful comments and suggestions that helped to improve the manuscript. EB and ICG acknowledge support from DGAPA-UNAM grant IN113320. CAN thanks support from DGAPA-UNAM grant IN113719 and from CONACyT project Paradigmas y Controversias de la Ciencia 2022-320020. DRD acknowledges support from the Brazilian funding agency CAPES, via the PNPD program. JMRE acknowledges the Spanish State Research Agency under grant number AYA2017-84061-P. JMRE also acknowledges the Canarian Governement under the project PROID2021010077, and is indebted to the Severo Ochoa Programme at the IAC. This work was partially supported by CONACYT research grant 280789. The WHT is operated on the island of La Palma by the Isaac Newton Group in the Spanish Observatorio del Roque de los Muchachos of the Instituto de Astrofísica de Canarias. This work is partly based upon observations carried out at the Observatorio Astronómico Nacional on the Sierra San Pedro Mártir (OAN-SPM), Baja California, Mexico.This work is partly based upon observations collected at Copernico telescope (Asiago, Italy) of the INAF - Osservatorio Astronomico di Padova. Our thanks to the supporting staff during the observing runs. This research has made use of data obtained from the Chandra Data Archive and the Chandra Source Catalog, and software provided by the Chandra X-ray Center (CXC) in the application packages CIAO, ChIPS, and Sherpa. We acknowledge the use of public data from the Swift data archive. This research has made use of the NASA/IPAC Extragalactic Database (NED), which is operated by the Jet Propulsion Laboratory, California Institute of Technology, under contract with the National Aeronautics and Space Administration.
References
- Antonucci (1993) Antonucci R., 1993, ARA&A, 31, 473
- Baldwin et al. (1981) Baldwin J. A., Phillips M. M., Terlevich R., 1981, PASP, 93, 5
- Barnes & Hernquist (1991) Barnes J. E., Hernquist L. E., 1991, ApJ, 370, L65
- Barthelmy et al. (2005) Barthelmy S. D., et al., 2005, SSRv, 120, 143
- Baumgartner et al. (2013) Baumgartner W. H., Tueller J., Markwardt C. B., Skinner G. K., Barthelmy S., Mushotzky R. F., Evans P. A., Gehrels N., 2013, ApJS, 207, 19
- Begelman et al. (1980) Begelman M. C., Blandford R. D., Rees M. J., 1980, Nature, 287, 307
- Benítez et al. (2018) Benítez E., Rodríguez-Espinosa J. M., Cruz-González I., González-Martín O., Negrete C. A., Ruschel-Dutra D., Gutiérrez L., Jiménez-Bailón E., 2018, MNRAS, 474, L56
- Benítez et al. (2019) Benítez E., et al., 2019, MNRAS, 490, 5521
- Bennett et al. (2014) Bennett C. L., Larson D., Weiland J. L., Hinshaw G., 2014, ApJ, 794, 135
- Bik et al. (2018) Bik A., Östlin G., Menacho V., Adamo A., Hayes M., Herenz E. C., Melinder J., 2018, A&A, 619, A131
- Blecha et al. (2013) Blecha L., Loeb A., Narayan R., 2013, MNRAS, 429, 2594
- Blumenthal & Barnes (2018) Blumenthal K. A., Barnes J. E., 2018, MNRAS, 479, 3952
- Bon et al. (2007) Bon E., Popović L. Č., Gavrilović N., 2007, in Popovic L. C., Dimitrijevic M. S., eds, American Institute of Physics Conference Series Vol. 938, Spectral Line Shapes in Astrophysics. pp 59–64, doi:10.1063/1.2800153
- Bon et al. (2009) Bon E., Popović L. Č., Gavrilović N., Mura G. L., Mediavilla E., 2009, MNRAS, 400, 924
- Bon et al. (2012) Bon E., et al., 2012, ApJ, 759, 118
- Bon et al. (2016) Bon E., et al., 2016, ApJS, 225, 29
- Bon et al. (2018) Bon E., Jovanović P., Marziani P., Bon N., Otašević A., 2018, Frontiers in Astronomy and Space Sciences, 5, 19
- Boroson & Green (1992) Boroson T. A., Green R. F., 1992, ApJS, 80, 109
- Briggs (1995) Briggs D. S., 1995, in American Astronomical Society Meeting Abstracts. p. 112.02
- Brooks et al. (2022) Brooks J. E., Argo M. K., Cho H., Woo J.-H., Jung T., Wrigley N., 2022, MNRAS, 512, L27
- Cardelli et al. (1989) Cardelli J. A., Clayton G. C., Mathis J. S., 1989, ApJ, 345, 245
- Chen & Halpern (1989) Chen K., Halpern J. P., 1989, ApJ, 344, 115
- Chen et al. (1989) Chen K., Halpern J. P., Filippenko A. V., 1989, ApJ, 339, 742
- Cid Fernandes et al. (2005) Cid Fernandes R., Mateus A., Sodré L., Stasińska G., Gomes J. M., 2005, MNRAS, 358, 363
- Comerford et al. (2009) Comerford J. M., et al., 2009, ApJ, 698, 956
- Comerford et al. (2012) Comerford J. M., Gerke B. F., Stern D., Cooper M. C., Weiner B. J., Newman J. A., Madsen K., Barrows R. S., 2012, ApJ, 753, 42
- Comerford et al. (2018) Comerford J. M., Nevin R., Stemo A., Müller-Sánchez F., Barrows R. S., Cooper M. C., Newman J. A., 2018, ApJ, 867, 66
- Crenshaw & Kraemer (2000) Crenshaw D. M., Kraemer S. B., 2000, ApJ, 532, L101
- Davis (2001) Davis J. E., 2001, ApJ, 562, 575
- De Rosa et al. (2019) De Rosa A., et al., 2019, New Astron. Rev., 86, 101525
- Deane et al. (2014) Deane R. P., et al., 2014, Nature, 511, 57
- Di Matteo et al. (2005) Di Matteo T., Springel V., Hernquist L., 2005, Nature, 433, 604
- Ellison et al. (2017) Ellison S. L., Secrest N. J., Mendel J. T., Satyapal S., Simard L., 2017, MNRAS, 470, L49
- Fabbiano et al. (2020) Fabbiano G., Paggi A., Karovska M., Elvis M., Nardini E., Wang J., 2020, ApJ, 902, 49
- Ferrarese & Ford (2005) Ferrarese L., Ford H., 2005, Space Sci. Rev., 116, 523
- Ferrarese & Merritt (2000) Ferrarese L., Merritt D., 2000, The Astrophysical Journal, 539, L9
- Fischer et al. (2011) Fischer T. C., Crenshaw D. M., Kraemer S. B., Schmitt H. R., Mushotsky R. F., Dunn J. P., 2011, ApJ, 727, 71
- Freeman et al. (2001) Freeman P., Doe S., Siemiginowska A., 2001, in Starck J.-L., Murtagh F. D., eds, Society of Photo-Optical Instrumentation Engineers (SPIE) Conference Series Vol. 4477, Astronomical Data Analysis. pp 76–87 (arXiv:astro-ph/0108426), doi:10.1117/12.447161
- Fruscione et al. (2006) Fruscione A., et al., 2006, in Silva D. R., Doxsey R. E., eds, Society of Photo-Optical Instrumentation Engineers (SPIE) Conference Series Vol. 6270, Society of Photo-Optical Instrumentation Engineers (SPIE) Conference Series. p. 62701V, doi:10.1117/12.671760
- Fu et al. (2012) Fu H., Yan L., Myers A. D., Stockton A., Djorgovski S. G., Aldering G., Rich J. A., 2012, ApJ, 745, 67
- Fu et al. (2015a) Fu H., Myers A. D., Djorgovski S. G., Yan L., Wrobel J. M., Stockton A., 2015a, ApJ, 799, 72
- Fu et al. (2015b) Fu H., Wrobel J. M., Myers A. D., Djorgovski S. G., Yan L., 2015b, ApJ, 815, L6
- Gebhardt et al. (2000) Gebhardt K., et al., 2000, The Astrophysical Journal, 539, L13
- Gültekin et al. (2009) Gültekin K., et al., 2009, ApJ, 698, 198
- HI4PI Collaboration et al. (2016) HI4PI Collaboration et al., 2016, A&A, 594, A116
- Hickox & Alexander (2018) Hickox R. C., Alexander D. M., 2018, ARA&A, 56, 625
- Hopkins et al. (2008) Hopkins P. F., Hernquist L., Cox T. J., Kereš D., 2008, ApJS, 175, 356
- Hou et al. (2019) Hou M., Liu X., Guo H., Li Z., Shen Y., Green P. J., 2019, ApJ, 882, 41
- Ilić et al. (2006) Ilić D., Popović L. Č., Bon E., Mediavilla E. G., Chavushyan V. H., 2006, MNRAS, 371, 1610
- Kauffmann et al. (2003) Kauffmann G., et al., 2003, MNRAS, 346, 1055
- Kewley et al. (2001) Kewley L. J., Dopita M. A., Sutherland R. S., Heisler C. A., Trevena J., 2001, ApJ, 556, 121
- Kewley et al. (2006) Kewley L. J., Groves B., Kauffmann G., Heckman T., 2006, MNRAS, 372, 961
- Kharb et al. (2017) Kharb P., Subramanian S., Vaddi S., Das M., Paragi Z., 2017, ApJ, 846, 12
- Kim et al. (2020) Kim D. C., Yoon I., Evans A. S., Kim M., Momjian E., Kim J. H., 2020, ApJ, 904, 23
- Kollatschny et al. (2020) Kollatschny W., Weilbacher P. M., Ochmann M. W., Chelouche D., Monreal-Ibero A., Bacon R., Contini T., 2020, A&A, 633, A79
- Komossa et al. (2003) Komossa S., Burwitz V., Hasinger G., Predehl P., Kaastra J. S., Ikebe Y., 2003, ApJ, 582, L15
- Kormendy & Ho (2013) Kormendy J., Ho L. C., 2013, ARA&A, 51, 511
- Koss et al. (2010) Koss M., Mushotzky R., Veilleux S., Winter L., 2010, ApJ, 716, L125
- Koss et al. (2011) Koss M., et al., 2011, ApJ, 735, L42
- Koss et al. (2012) Koss M., Mushotzky R., Treister E., Veilleux S., Vasudevan R., Trippe M., 2012, ApJ, 746, L22
- Kriss (1994) Kriss G., 1994, in Crabtree D. R., Hanisch R. J., Barnes J., eds, Astronomical Society of the Pacific Conference Series Vol. 61, Astronomical Data Analysis Software and Systems III. p. 437
- Lacy et al. (2020) Lacy M., et al., 2020, PASP, 132, 035001
- Lamastra et al. (2009) Lamastra A., Bianchi S., Matt G., Perola G. C., Barcons X., Carrera F. J., 2009, A&A, 504, 73
- Le Tiran et al. (2011) Le Tiran L., Lehnert M. D., van Driel W., Nesvadba N. P. H., Di Matteo P., 2011, A&A, 534, L4
- Liu et al. (2010) Liu X., Greene J. E., Shen Y., Strauss M. A., 2010, ApJ, 715, L30
- Liu et al. (2019) Liu X., et al., 2019, ApJ, 887, 90
- Magorrian et al. (1998) Magorrian J., et al., 1998, AJ, 115, 2285
- Marziani et al. (1994) Marziani P., Keel W. C., Dultzin-Hacyan D., Sulentic J. W., 1994, ApJ, 435, 668
- Marziani et al. (2003) Marziani P., Sulentic J. W., Zamanov R., Calvani M., Dultzin-Hacyan D., Bachev R., Zwitter T., 2003, ApJS, 145, 199
- Marziani et al. (2010) Marziani P., Sulentic J. W., Negrete C. A., Dultzin D., Zamfir S., Bachev R., 2010, MNRAS, 409, 1033
- Marziani et al. (2019) Marziani P., et al., 2019, A&A, 627, A88
- Massey et al. (1988) Massey P., Strobel K., Barnes J. V., Anderson E., 1988, ApJ, 328, 315
- Max et al. (2007) Max C. E., Canalizo G., de Vries W. H., 2007, Science, 316, 1877
- McConnell & Ma (2013) McConnell N. J., Ma C.-P., 2013, ApJ, 764, 184
- Milosavljević & Merritt (2001) Milosavljević M., Merritt D., 2001, ApJ, 563, 34
- Müller-Sánchez et al. (2015) Müller-Sánchez F., Comerford J. M., Nevin R., Barrows R. S., Cooper M. C., Greene J. E., 2015, ApJ, 813, 103
- Netzer (2013) Netzer H., 2013, The Physics and Evolution of Active Galactic Nuclei
- Oke (1990) Oke J. B., 1990, AJ, 99, 1621
- Raimundo et al. (2012) Raimundo S. I., Fabian A. C., Vasudevan R. V., Gand hi P., Wu J., 2012, MNRAS, 419, 2529
- Rich et al. (2011) Rich J. A., Kewley L. J., Dopita M. A., 2011, ApJ, 734, 87
- Richards et al. (2006) Richards G. T., et al., 2006, ApJS, 166, 470
- Rosario et al. (2010) Rosario D. J., Shields G. A., Taylor G. B., Salviander S., Smith K. L., 2010, ApJ, 716, 131
- Rubinur et al. (2018) Rubinur K., Das M., Kharb P., 2018, Journal of Astrophysics and Astronomy, 39, 8
- Rubinur et al. (2019) Rubinur K., Das M., Kharb P., 2019, MNRAS, 484, 4933
- Satyapal et al. (2017) Satyapal S., et al., 2017, ApJ, 848, 126
- Saxton et al. (2008) Saxton R. D., Read A. M., Esquej P., Freyberg M. J., Altieri B., Bermejo D., 2008, A&A, 480, 611
- Schlegel et al. (1998) Schlegel D. J., Finkbeiner D. P., Davis M., 1998, ApJ, 500, 525
- Schutte et al. (2019) Schutte Z., Reines A. E., Greene J. E., 2019, ApJ, 887, 245
- Shen & Ho (2014) Shen Y., Ho L. C., 2014, Nature, 513, 210
- Smith et al. (2020) Smith K. L., et al., 2020, MNRAS, 492, 4216
- Stemo et al. (2021) Stemo A., Comerford J. M., Barrows R. S., Stern D., Assef R. J., Griffith R. L., Schechter A., 2021, ApJ, 923, 36
- Sulentic et al. (2000) Sulentic J. W., Marziani P., Dultzin-Hacyan D., 2000, ARA&A, 38, 521
- Sulentic et al. (2002) Sulentic J. W., Marziani P., Zamanov R., Bachev R., Calvani M., Dultzin-Hacyan D., 2002, ApJL, 566, L71
- Sulentic et al. (2011) Sulentic J., Marziani P., Zamfir S., 2011, Baltic Astronomy, 20, 427
- Sun et al. (2011) Sun J., Li G., Wen D., Xue B., Yang S., 2011, Japan Society of Aeronautical Space Sciences Transactions, 53, 307
- Tozzi et al. (2006) Tozzi P., et al., 2006, A&A, 451, 457
- Tremaine et al. (2002) Tremaine S., et al., 2002, ApJ, 574, 740
- Van Wassenhove et al. (2012) Van Wassenhove S., Volonteri M., Mayer L., Dotti M., Bellovary J., Callegari S., 2012, ApJ, 748, L7
- Vazdekis et al. (2010) Vazdekis A., Sánchez-Blázquez P., Falcón-Barroso J., Cenarro A. J., Beasley M. A., Cardiel N., Gorgas J., Peletier R. F., 2010, MNRAS, 404, 1639
- Veilleux & Osterbrock (1987) Veilleux S., Osterbrock D. E., 1987, ApJS, 63, 295
- White & Frenk (1991) White S. D. M., Frenk C. S., 1991, ApJ, 379, 52
- White & Rees (1978) White S. D. M., Rees M. J., 1978, MNRAS, 183, 341
- Wilms et al. (2000) Wilms J., Allen A., McCray R., 2000, ApJ, 542, 914
- Winter et al. (2010) Winter L. M., Lewis K. T., Koss M., Veilleux S., Keeney B., Mushotzky R. F., 2010, ApJ, 710, 503
- Woo et al. (2014) Woo J.-H., Cho H., Husemann B., Komossa S., Park D., Bennert V. N., 2014, MNRAS, 437, 32
- Zamfir et al. (2010) Zamfir S., Sulentic J. W., Marziani P., Dultzin D., 2010, MNRAS, 403, 1759
- Zhang et al. (2011) Zhang K., Dong X.-B., Wang T.-G., Gaskell C. M., 2011, ApJ, 737, 71
- Zhang et al. (2021) Zhang Y.-W., Huang Y., Bai J.-M., Liu X.-W., Wang J.-g., Dong X.-b., 2021, AJ, 162, 289
- Zhou et al. (2004) Zhou H., Wang T., Zhang X., Dong X., Li C., 2004, ApJ, 604, L33