Optimizing the laser coupling, matter heating, and particle acceleration from solids by using multiplexed ultraintense lasers
Abstract
The new generation of multi-petawatt (PW) class laser systems will generally combine several beamlines. We here investigate how to arrange their irradiation geometry in order to optimize their coupling with solid targets, as well as the yields and beam quality of the produced particles. We first report on a proof-of-principle experiment, performed at the Rutherford Appleton Laboratory Vulcan laser facility, where two intense laser beams were overlapped in a mirror-like configuration onto a solid target, preceded by a long preplasma. We show that when the laser beams were close enough to each other, the generation of hot electrons at the target front was much improved and so was the ion acceleration at the target backside, both in terms of their maximum energy and collimation. The underlying mechanism is pinpointed with multidimensional particle-in-cell simulations, which demonstrate that the magnetic fields self-induced by the electron currents driven by the two laser beams at the target front can reconnect, thereby enhancing the production of hot electrons, and favoring their subsequent magnetic guiding across the target. Our simulations also reveal that the laser coupling with the target can be further improved when overlapping more than two beamlines. This multi-beam scheme would obviously be highly beneficial to the multi-PW laser projects proposed now and in the near future worldwide.
Author Contributions Statement
J.F. conceived the project. M.N., S.B., P.A., M.B., R.H., M.Q., L.R., G.S., H.P.S., T.T., O.T., L.V., O.W., and J.F. performed the experiments. W.Y., S.B., S.N.C., M.N., and J.F. analyzed the data. W.Y. performed and analyzed the SMILEI simulations with discussions with R.R., Y.S., V.H., E.d.H., L.G., and J.F. W.Y., S.N.C., and J.F. wrote the bulk of the paper, with major contributions from E.d.H. and L.G. All authors commented and revised the paper.
Significance Statement
Nowadays present laser beamlines meet a technological limitation at the level of 10 petawatt (PW) for single beam, leading to the challenge on how to optimally combine individual beamlines to deliver even more power to a target. This manuscript is focusing, through experiments and detailed numerical simulations, on optimizing the coupling of multi-PW class lasers onto solid targets, which we show can be achieved by optimally stacking the beams in a mirror-like configuration. We believe that the comprehensive understanding of overlapping-beam effects detailed here paves the way to boosting the production of particle/radiation sources in PW-class high-intensity picosecond laser platforms worldwide by properly designing the beamlets irradiation scheme.
I Introduction
The advent of multi-petawatt (PW) laser systems [1] opens novel perspectives in many research domains, including compact particle and radiation sources [2, 3, 4, 5], condensed matter physics [6, 7], probing of dense matter [8, 9, 10, 11], laboratory astrophysics [12, 13], chemistry [14], and even cultural heritage [15]. Moreover, it offers promising prospects for high-impact societal applications such as clean energy production through inertial confinement fusion [16, 17], biological imaging [18, 19] and radiation therapy [20, 21, 22]. Yet the feasibility of large surface area gratings [23] and mirrors having simultaneously broadband reflectivity and high-fluence resistant coating [24] currently limits the maximum power that can be delivered by a single laser beam to about 10 PW. Therefore, the quest for ever-increasing laser power will necessarily involve the combination of multiple beamlets, each being at the limit of the technology. This approach is already pursued in several projects, such as the Laser MégaJoule’s PETAL system in France [25], the National Ignition Facility’s Advanced Radiographic Capability (NIF-ARC) in the US [26], the Laser for Fast Ignition Experiment (LFEX) in Japan [27, 28], the Superintense Ultrafast Laser Facility (SULF) in China [29], and the Exawatt Center for Extreme Light Studies (XCELS) in Russia [30]. Such a strategy, however, raises the question of how the individual beamlets should be arranged in order to maximize their overall coupling with the target. The present study will focus on opaque, solid targets, since the interaction of intense lasers with transparent, dilute plasmas, such as those suitable for wakefield acceleration of electrons, presents different challenges [31, 32, 33, 34]. In addition, our investigations show that it is in fact interesting to not just increase the energy of a single laser beam, as the multi-beams scheme benefits the quality of the produced particles.
The optimization of the coupling of a single, intense laser beam with a dense plasma has been the subject of many investigations [35, 36, 37, 38, 39, 40]. It was shown experimentally that temporally stacked laser pulses could be advantageously used to enhance the guiding of hot electrons within the target [41, 42], or the target normal sheath acceleration (TNSA) of ions at the target rear side [43, 44]. The improvement of the latter process was achieved either by laser shaping the target [45, 46, 47] or by lengthening the effective ion acceleration time [48]. Recently, an alternative scheme employed two synchronized, but this time spatially separated, intense laser pulses, so that the anti-parallel magnetic fields produced around the target surface by the laser-driven electron currents [49, 50] could reconnect and thus boost the non-thermal electron generation [51, 52]. Another study using a similar beam arrangement conjectured that magnetic reconnection (MR) could also arise at the target back side [53], and hence impact ion acceleration. Relativistic MR could also be triggered by laser pulses propagating side by side in under-critical plasmas [54]. Furthermore, numerical simulations showed that two laser pulses focused at opposite incidence angles onto preplasma-free, thin solid foils could favor the generation of energetic electrons via vacuum heating, and therefore the acceleration of protons as well [55, 56].
In this work, we investigate in detail, both experimentally and numerically, the case of transversely separated laser beams in order to find an optimum in the multiplexing of laser irradiation of solids, improving the particle yields and beam qualities. In contrast with the aforementioned studies, here we consider configurations involving an extended preplasma in front of the dense target, a common situation in petawatt-level laser interactions [57, 58]. We first provide experimental evidence that the use of two overlapping laser beams in a mirror-like geometry can substantially augment the hot-electron generation at the front side, the subsequent ion acceleration at the rear side, and the collimation of both outgoing electron and ion beams. To explain these findings, we perform three-dimensional (3D) particle-in-cell (PIC) simulations of the laser-plasma interaction at the target front, which reveal the occurrence of MR in the overlap region of the two laser beams, and its role in enhancing locally the electron energization. Further, by means of two-dimensional (2D) PIC simulations including collisions and ionization, we show that the increased hot-electron current that is expected to be injected into the target bulk as a consequence of MR in the preplasma can drive stronger resistive fields, leading in turn to a more collimated hot-electron transport [59]. In short, although such a scheme has been little exploited up to now [60], we here demonstrate through experiment and numerical simulations that overlapping multiple laser beams can prove highly beneficial to laser-to-plasma coupling, non-thermal particle generation, and plasma heating. Our aim is to make a test-bed for future 10 PW scale laser facilities at the limit of technology, where the energy of a single laser beam cannot be increased.
The paper is organized as follows. In Sec. II, we describe the experimental setup and the results of the measurements. In Sec. III, the experimental observations are interpreted through PIC simulations. Specifically, the 3D PC simulations presented in Sec. III.1 reveal that MR can set in in the preplasma irradiated by two overlapping beams, and cause the hot-electron generation to be enhanced. In Sec. III.2, we report on 2D collisional PIC simulations that indicate that the intensified hot-electron source that follows from the laser beam overlap and associated MR can propagate in a more collimated manner through the target due to stronger self-induced fields. Our findings are summarized in Sec. IV.
II Experimental results
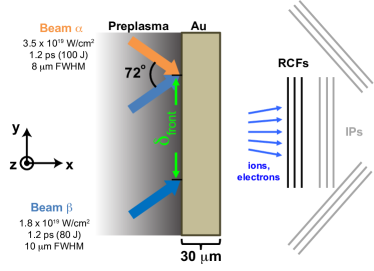
The dual-beam experiment was carried out at the Vulcan Target Area West (TAW) laser facility at the Rutherford Appleton Laboratory (RAL). Its setup is sketched in Fig. 1. One beam (), of pulse duration and pulse energy, was focused on target to a FWHM spot at an incidence angle of . This resulted in an on-target intensity of . The other beam (), of pulse energy and same duration, irradiated symmetrically the target, i.e., at the incidence angle of . It was focused to a FWHM spot, reaching an on-target intensity of . Both laser beams had a central wavelength and impinged onto the targets at -polarization. Note that there’s no shot-to-shot jitter because the two beams are split from the same oscillator. The targets consisted of -thick gold foils. The outgoing proton distribution was recorded using a stack of radiochromic films (RCFs) [61], centered along the rear target normal direction. The fast electrons escaping the target [62] were detected by several stacks [63] of five photostimulable, FUJIFILM TR type image plates (IPs), each coated with a 1.5 mm Aluminum layer to filter out low-energy electrons. The IP stacks were placed along both the laser axis and the target normal directions. Finally, the preplasma expansion [64] and the optical self-emission at nm from the plasma were monitored along a line of sight parallel to the target surface, see Fig. 2. Using the radiation-hydrodynamic code MULTI, the pre-plasma scale length L (fitting the density profile as , where is the spatial coordinate), generated by the measured pre-pulse of and 0.5 ns duration [65], is estimated to be around m. Such preplasma is consistent with the observation of the edge of the refraction of the probe beam [66] being around 200 m away from the target surface.
The distance between the centers of the two laser spots (), as measured at the initial (before preplasma formation) front side of the target, was consistently varied from to , while keeping constant all the other parameters. We will now address three distinctive cases, as listed below:
- Case 0
-
A single laser beam, either beam or beam , irradiated the target.
- Case 1
-
Two non-overlapping laser beams were used with up to .
- Case 2
-
Two laser beams are overlapped at the front side of the target with .
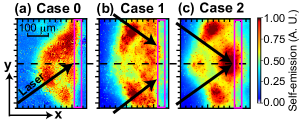
Figure 2 shows side-view images of the plasma. For Case 0 with a single laser beam () coming from below [panel (a)], the emission is stronger on the upper side than on the lower side of the middle plane (indicated by the black dashed line). We note the presence of a strong emission zone far from the target surface and in the specular direction. This could be linked with the jet-like features in similar long scale length plasmas discussed in Kodama et al. [67]. For Case 1, corresponding to two non-overlapping laser beams [panel (b)], two bright spots are observed on both sides of the middle plane in the large preplasma extending ahead of the target. While the same bright spots are visible in Case 2 when two laser beams are overlapped on the target [panel (c)], a stronger signal can be seen in the middle plane, closer to the initial target front surface. This is indicative of an improved laser coupling with the target, as will be detailed later.
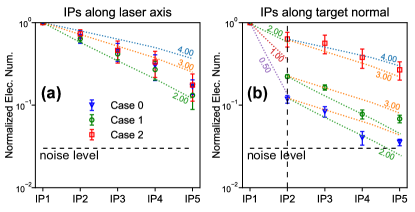
For a quantitative analysis of the IP data, we have performed Monte Carlo FLUKA simulations [69, 70, 71]. Following a standard procedure detailed in Rusby et al. [63], we compare the experimental signal deposited by electrons in the IP stack to simulations (with the injection of electron beams with different temperatures) of the same IP stack setup. This way, we can retrieve the temperature of the hot-electron distribution (). Fig. 3 shows the experimental data (points with error bars) overlaid with the FLUKA simulation results (dashed lines as a ruler). The retrieved hot electron temperature is given in the numbers associated with the dotted lines. Specifically, in Fig. 3 (a), the IP data obtained along the laser axis shows that the three cases have quite similar hot-electron temperatures around MeV, which is in accordance with the ponderomotive scaling [72]. Note that the X-ray contribution from Bremsstrahlung photons generated in the laser target to the IP signals is expected to be negligible [63]. However, in Fig. 3 (b), the three cases have distinguishable hot-electron temperatures along the target normal, which shows a two-temperature distribution, separated by IP2.
In the case of well-separated laser beams (Case 1, green) and the single laser (Case 0, blue), the retrieved hot-electron temperatures along the target normal after IP2 is similar, around MeV. However, when using two overlapped laser beams (Case 2, red), the temperature of the hot electron emitted along the target normal is substantially increased to MeV. Note that not only is the temperature increased in Case 2 compared to Case 0 and 1, but also importantly, the number of hot electrons produced along the target normal is strongly increased. Consistently, we notably observe a self-emission hot spot in the middle plane between the 2 lasers, see Fig. 2(c).
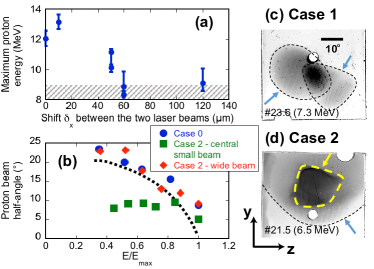
The characteristics of the accelerated protons, as diagnosed by the RCFs, are summarized in Fig. 4. The highest proton cutoff energy [Fig. 4(a)] is obtained for a laser beam separation , while it quickly drops to the value associated with a single beam (represented by the grey hashed area) when , i.e., when the two beams no longer overlap. While it is not a surprise that the proton energy increases when the laser beams are combined, as this leads to a higher density of hot electrons in the sheath, there is clearly an unexpected beneficial aspect in terms of proton beam collimation. The variation in the proton divergence as a function of energy (normalized to the corresponding cutoff energy) is depicted in Fig. 4(b) for the three cases considered. As a reference, the dashed curve plots the energy-dependent angular divergence obtained in Ref. [61]. As expected, the use of a single laser beam (Case 0, blue dots) leads to an angular distribution typical of TNSA. Different results are obtained using the overlapped laser beams of Case 2. As evidenced by Fig. 4(d), the raw RCF signal then reveals the generation of a relatively wide proton beam (indicated by a blue arrow), characterized by a standard TNSA-type angular distribution [red diamonds in Fig. 4(b)], inside which lies a narrower and denser beam (indicated by a yellow arrow) with a markedly smaller divergence [green squares in Fig. 4(b)]. The energy cutoff of the wide beam is measured to be , which is similar to that found in Case 0, but also smaller than the cutoff energy of the central, more collimated beam. If the laser beams do not overlap, as in Case 1 [Fig. 4(c)], two standard TNSA-like proton beams are obtained without any enhancement, i.e., neither in energy nor in collimation. The two distinct proton beam envelops that we observe simply comes from the fact that in this case the two laser beams are separated (by 120 m). Thus, the locations of the centers of the sheaths produced by each beam are similarly separated. Knowing that each sheath has a diameter of the same order [73], and that the proton beam pattern merely reflects the electron spatial distribution on the target rear [74], it is not a surprise to observe two distinct proton beams separated by an amount of the order of each sheath diameter. Note that the darker area at the intersection of the two proton beams observed in Fig. 4(c) simply originates from the addition of their respective dose depositions in the RCF; it is observed to disappear at higher proton energies, as the corresponding protons have their angular opening reduced [75, 61].
It is known that in TNSA, the cutoff proton energy increases with the hot-electron temperature and density [2, 44, 76]. The observed enhancement of the proton cutoff energy therefore points to a more efficient conversion of the laser energy into hot electrons. It is also known that, as mentioned above, due to their extremely low emittance, the protons beams detected on RCFs are a magnified projection of the surface of the accelerating sheath they stem from [74]. Hence, the reduced area of the fastest protons that we report here would be consistent with an accelerating sheath narrower than that created in standard conditions, which results from the typical divergence of the hot electrons driven by a single laser pulse [36, 77]. Our RCF data thus suggest that the protons have been accelerated by a beam of higher-energy, lower-divergence electrons, which is consistent with the IP measurements of the hot-electron source [see Fig. 3 (b)]. This is what our analysis of the hot electron transport within the target detailed below in Sec. III.2 also shows. We will now turn to numerical simulations in order to interpret these results.
III Particle-in-cell simulations
To pinpoint the mechanism for the enhancement of the hot electron beam (HEB) generation and collimation, we have carried out a series of Particle-in-Cell (PIC) simulations with the fully kinetic code SMILEI [78]. Due to the difficulties in simulating a solid Au target on a ps-scale with dynamic ionization and collisions in three dimensions (3D), the PIC simulations were separated into two stages. These simulations are performed in down-scaled conditions i.e., with a similar reduction factor for both the laser separation distance and the laser spot size. This allows us to simulate the large separation (seen in Fig. 2) with available computational resources. At the same time, the down-scaled model allows us to reproduce the essence of the physical mechanisms (in enhancing the HEB temperature and collimation) in each stage qualitatively.
- Stage 1
-
is focused on the HEB enhanced temperature (or particle yields), when the laser beams propagate in the pre-plasma. Since the potential mechanism is the MR induced in the low-density fully-ionized pre-plasma, 3D geometry is used, without ionization or collision.
- Stage 2
-
is focused on the HEB improved beam quality, i.e., the collimation. Since the potential mechanism is the resistive magnetic field generated when the HEB propagates inside the Au solid target through the resistive return current, dynamic ionization and collisions are considered in 2D geometry.
III.1 Stage 1, MR-enhanced HEB generation in pre-plasma
For stage 1, our proof-of-principle simulation has a 3D box size of m3. For the target, we use stationary ions with a 3 m thickness of for m. While for the pre-plasma, we used a fully ionized He plasma with a maximum density of and an exponential profile along the x-direction from the left boundary of the simulation box (located at ) to m:
| (1) |
where , and m. It corresponds to a pre-plasma scale length of m due to the limitation of our computational resources. Note that we have managed to double and , and the essential physical processes are the same. The critical density of the plasma for a laser with wavelength of m is defined by cm-3, with the ion mass (, , and are the permittivity of free space, the electron mass, the speed of light, and the elementary charge, respectively). The location of the electron critical density is at m [see Fig. 5 (a)]. For simplicity, the transverse density profiles (along the y- and z-directions) are uniform.
The laser beams obliquely irradiate the target from the left boundary (at ) and focus on the target front surface (at m. The spatial envelopes of the p-polarized lasers are Gaussian with a waist of m. Both focus to W/cm2 when in vacuum (i.e. the normalized amplitude is ), with 15 angle of incidence with respect to the target normal. Note that since we have a large pre-plasma, there cannot be any coherent beating wave pattern between the laser beams [55, 56]. Note also that the angular separation between the two beams is smaller than in the experiment. This results from a constrain of the simulation box size and related computing resources, but it also corresponds to what would be a compact beam stacking geometry, i.e., one where two laser beams would be irradiating the target side-by-side. To simplify the MR process during the interaction between the laser and the pre-plasma, the laser intensity temporal profile is chosen to be trapezoidal with a ramp of fs and a plateau of ps. We have performed a test case with a gaussian temporal profile with around 500 fs FWHM, and we find that the essential physical processes are not sensitive to the laser temporal profile. The distance between these two beams (when there are two) is changed via their focus position at the target front.
The spatial resolution of the simulation is , with being the electron inertial length, corresponding to 16 cells per micron; the temporal resolution is . We use 8 particles of each species per cell, and a fourth-order particle shape-function. Boundary conditions for both particles and fields are absorbing along the x-direction and periodic on the other directions. Note that in stage 1, collisions are not included, because with the electron temperature above hundreds of keV, the cross-section of electron-ion collision at critical density is significantly reduced.
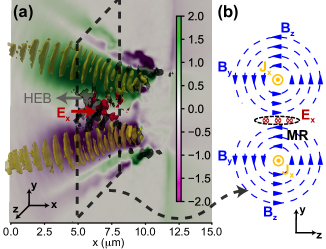
From Fig. 5, it is clear that when the laser pulses penetrate the pre-plasma in front of the target in (a), HEB are generated stochastically [79] and directed along the laser paths. The reason is due to the magnetic field generated via hot electron currents [80], as illustrated by the 2D projection in the xy-plane. With a strength of the order of T (which is of the order of experimental observations on the same laser system [49]), the magnetic field is strong enough to confine MeV-level electrons on its path. This coincides with the experimental diagnostic in Fig. 3, and is consistent with related simulations [81].
A schematic diagram of the magnetic reconnection in the yz-plane is shown in Fig. 5 (b). When the two laser spots are close enough to each other ahead of the target surface, the HEB generated in the pre-plasma along the laser pulse will also be close to each other. Thus, from the currents carried by the HEB, their self-generated anti-parallel in the middle plane (around ) will break and reconnect, thus supporting an electric field in the target-normal direction (i.e., the x-direction) and creating a current sheet. Note that the MR-induced electric field direction is opposite to the case when the MR is induced from the electron current expanding radially at the surface of the solid target [51], in which the MR-induced electric field is directed in the -direction. Locally, the magnetic field energy will be transferred into the kinetic energy of the plasma, with electrons accelerated (by the reconnecting electric field) and then thermalized (by the magnetic fields).
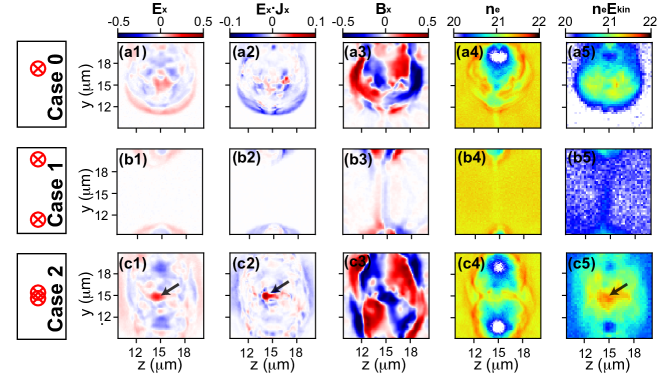
Features of the MR occurrence, as well as the evidence for the HEB enhancement, are summarized in Fig. 6. Three cases are demonstrated, i.e., single beam (Case 0) in the top row, two laser beams without overlapping (Case 1) in the middle row, and two laser beams with overlapping (Case 2) in the bottom row.
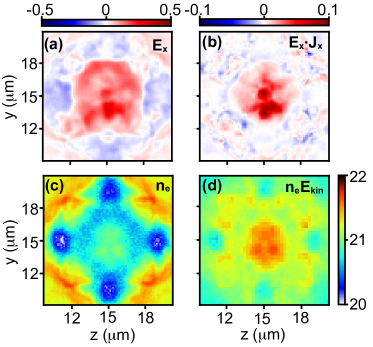
Here we first analyze the MR features of Case 2 (i.e. for the two laser beams in proximity), in comparison with the features of Case 0. The first column of Fig. 6 is the (i.e. the out-of-plane electric field) distribution in the yz-plane. For Case 2 (c1), it reaches 0.3 around the middle point (indicated by the black arrow), whereas for Case 0 (a1), it is less than 0.1. With in Case 2 more than twice that in Case 0, it indicates an additional source of , other than the sheath field at the target front. The second column is the time-averaged , i.e. the work done by the field on the electrons, in which is the electron velocity along the x-direction. For Case 2 in (c2), there exists a clear positive signal around the middle point (indicated by the black arrow), meaning the energy has been transferred from the electromagnetic fields to the electrons, thus enhancing the generation of HEB. On the contrary, for Case 0 in (a2), no such signal can be seen. In addition, with the quadruple structure of the out-of-plane magnetic field formed in Case 2, we confirm that it is the MR that provides the additional around the middle point region.
Besides the MR occurrence, enhancement of the HEB can be seen clearly at the same time. Comparing Case 0 and Case 2, as shown in panels (a4) and (c4), we observe that around the laser spots positions the pre-plasma electrons have been pushed away by the laser beam(s), inducing the formation of electron density holes (with number density lower than in the fourth column). However, the density at the center of the yz-plane, i.e. at m stays in both cases around . Now, with regards to the energy density (in the fifth column), at the same middle point of the yz-plane (here, indicated by the black arrow), the energy density of the HEB in Case 2 (c5) shows a substantial enhancement, comparing to that of Case 0 (a5). This coincides with our experimental diagnostic in Fig. 2.
To demonstrate the effects of , now we compare the MR features and the HEB enhancement in Case 2 and Case 1. Both of them use the two laser beams configuration, the former has m (i.e. the two laser beams overlap at the target front), whereas the latter has m (i.e. the two laser beams do not overlap at all on the target surface). Note that due to our limited simulation size, we use m for Case 1 in the simulation, instead of m in the experiment. As the two focal spots are relatively far away in Case 1, both (and the work done by it) and the quadruple structure of are weak and can hardly be seen in (b1)-(b3) at the same time in the same region. Also, an almost homogeneous electron number density distribution between m can be seen in (b4) and no HEB generation is observed in (b5). We have checked that at a later time (around 900 fs), when the self-generated magnetic field extends close enough to each other in Case 1, no MR features and therefore no HEB enhancement can be seen. This is because the strength of the magnetic fields generated from the laser-preplasma interaction drops as (where is the expansion radius). Therefore, and becomes much less at the middle point at later times. At this late time, the magnetic energy transferred to the kinetic energy of electrons via MR might be very limited, and the enhancement of HEB will not be clear.
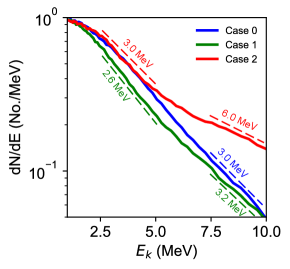
More importantly, the energy spectra in Fig. 7 demonstrate the same trend as the experiment (see Fig. 3). Specifically, for case 1 (i.e., two beams w/o overlapping) along the target normal, we observe a reduction of the hot electron temperature (i.e., 2.6 MeV) compared to case 0 (i.e., single beam) along the laser direction (i.e., 3.0 MeV), at the energy range of 2.5 to 5 MeV, as expected, since the hot electron is generated along the laser direction. Conversely, for case 2 (i.e., two overlapped beams) along the target normal, we observe an increase in the hot electron temperature (i.e., 6.0 MeV) compared to case 0 (i.e., 3.0 MeV), especially at the range of 7.5 to 10 MeV. Note that the simulated temperatures here can only be qualitatively compared to the experimental data, since (i) we use down-scaled models because of the computational limits and (ii) the laser incidence angle in the simulation is 15 (due to the spatial limitation of the down-scaled model), while in the experiment it is 36. Thus, the simulated temperatures are in general higher than those in the experiments, as expected.
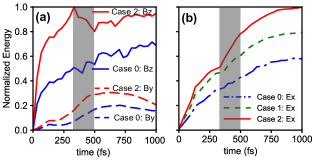
In addition to the above analysis, another feature of MR lies in the time evolution of the simulated energy partition. As is shown in Fig. 8 (a), for Case 2, in which MR occurs, we can see that the energy of (red solid line) decreases from 330 fs to 500 fs (identified by the dark vertical band), whereas the energy of (red dashed line) increases. This is in accordance with the MR process illustrated in Fig. 5 (b), i.e. annihilation of the magnetic field along the z-direction and “reconnection” of those along the y-direction. However, no such behavior can be seen in Case 0 with single laser beams. Both the energy of and are increasing due to the laser input into the simulation box. Note that here also contains the laser energy, which explains why its energy is much larger than that of . The decrease of in the end is due to the boundary condition of the limited simulation box.
In the meantime, the energy of quickly increases in Case 2 (red solid line) during the time frame of MR. This is to compare to the steady increase seen in Case 0 (blue dash-dotted line), and which is due to the increasing laser input. This is shown in Fig. 8 (b). The energy evolution in Case 1 (green dashed line) is also shown to confirm that the energy enhancement in Case 2 is not only because of the additional laser beam. The fact that the energy in Case 2 is also higher than that in Case 1 indicates that there exists an additional energy source for (i.e., MR) when overlapping the two laser beams. Note that the laser absorption rate, above 70% for both cases, is in accordance with experimental observations [82].
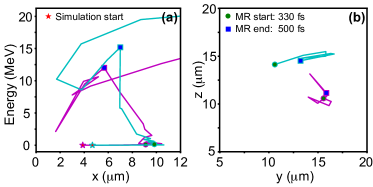
Besides, in Fig. 9, two electron trajectories in the diagram and the yz-plane are shown in order to further illustrate the role played by MR in the HEB energy enhancement. For about 1 million particles that we tracked within the MR region (within m along the x-direction and m along the y&z-directions), these two electrons represent about 10000 particles (1%) that show energy enhancement within the MR duration (around fs), as can be seen in Fig. 8 (a). From these trajectories, we can see that before the MR starts (from the red stars to the green circles), these electrons stay at quite low energy (less than MeV). However, during the MR (from the green circles to the blue squares), their energy experiences a large increase to above 10 MeV within the MR region, i.e., m along the x-direction and also within m along the y&z-directions. Note that during this energy increase, their movement is towards the -x-direction, which is in accordance with the positive MR electric field (i.e., towards the +x-direction). After MR, they end up moving toward the +x-direction in the pre-plasma, possibly by a combination of the laser field and self-generated magnetic field. Thus, they will be received by the diagnostic screen on the right side of the simulation box. Also note that in the case with doubled pre-plasma scale length, as well as the case with four beams below, we can find the same MR processes and there are more particles with energy enhanced by the MR process.
The scheme analyzed here in details is restricted to using two beams. To evaluate whether using more beams would induce an even stronger HEB enhancement, we have tested a case with four beams. This is shown in Fig. 10. Comparing the out-of-plane electric field in the case using four laser beams in Fig. 10 (a) to Case 2 in Fig. 6 (c1), it is clear that the region with positive value becomes much larger and so does the work done by it, i.e., , in Fig. 10 (b), comparing to that in Fig. 6 (c2). As a result, more of the HEB is further enhanced (both in energy and number density) within the corresponding larger region, as is shown in Fig. 10 (d).
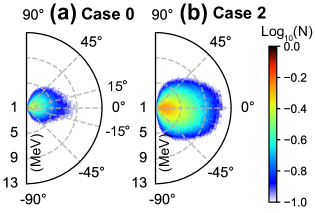
Last but not least, the angular-energy distributions of the electrons are shown in Fig. 11. Note that here the results are for electrons passing through a diagnostic screen located at m in the forward direction, similar to the IP diagnostic in the experiment. For the single laser beam case in (a), the angular distribution is slightly directed toward the upper half plane, owing to the small incidence angle that we use in the simulation (i.e., ); and the electron energy is below 9 MeV in every direction. As for the overlapped double laser beam case in (b), the angular distribution becomes axisymmetric and the electron energy increases to around 12 MeV. Yet, the divergence is still quite large and no collimation is achieved. It confirms the HEB enhancement observed in Fig. 6 but also implies that the collimation we see in the experiment results does not originate from MR. We will see in the simulation of the hot electron beam collimation can be achieved through transport within the target, as detailed below in the following Sec. III.2.
In short, the 3D PIC simulations detailed above support the experimental results of boosted HEB generation using the mirror-like configuration of two overlapped laser beams. Note that we have checked the robustness of our simulations with other cases using a larger simulation box size (i.e., m), a doubled pre-plasma scale length (i.e., m), and a gaussian temporal profile, all leads to similar results.
However, as shown above, in Fig. 11, these simulations do not exhibit any improvement in the collimation of the HEB, i.e. no clear HEB collimation can be seen during the first stage of the 3D simulations when the laser is propagating inside the pre-plasma. As discussed above, such collimation is expected in order to explain the reduced angular imprint of the central, high-energy proton beam seen in Fig. 4 (d). Thus, we will now address this collimation feature in the second simulation stage below, i.e., when the HEB transport inside the solid target and induces the growth of resistive magnetic fields. This is done using 2D PIC simulations with collisions and ionization.
III.2 Stage 2, resistive-collimated HEB transport in solid target
In order to simulate the collisional transport of the HEB in the high-Z target in Stage 2, a 2D box of m2 in size is used. The number density profile follows Eq. 1, with m, starting from at m to at m. For the ion species of the pre-plasma, we use Aluminum () with an initial ionization state and an initial temperature of eV. For the dense target, we use Aluminum with and eV. It has a 4 m plateau of density located at m. The electron number density for both the pre-plasma and the dense target is , considering dynamic field ionization [83] using the tunnel model [84], with . The spatial resolution of the simulation is also . Note that here the electron inertial length is , and , which corresponds to 160 cells per micron. The temporal resolution is chosen as , in order to safely use the Friedman electric field time-filter [85]. Note that a multi-pass binomial filter on the current densities [86] is also used. Similar laser parameters are adopted here, with the enlarged FWHM m and elongated temporal up ramp of fs. Their focus position is at the target front, like the Case 2 with . 32 particles of each species per cell are used, with fourth-order particle shape function. Boundary conditions for fields in both directions are absorbing; while for particles we use the following conditions: absorbing along the x-direction and thermalizing along the y-direction. The collisions between the electrons and ions in the target are now considered [87, 88]. It is known that collisional effects, from which the resistive return current and thus the resistive magnetic fields can grow, can lead to further collimation of the otherwise divergent HEB when it propagates in the solid target [89, 90]. The resistive magnetic field generation is driven by the Ohmic fields as follows [59]:
| (2) |
where is the resistive current from the cold electrons of the solid target, and is the resistivity, which dynamically changes during the target heating.
Note that due to the limitation of computational resources, the simulation box size (10 m) is small, and so is the thickness of the solid target (4 m) compared to that in the experiment (30 m). This indicates a much limited transport process in our simulations, compared to that in the experiment. Also as already mentioned, rather than using gold as the target material like in the experiment, in the simulation we use Aluminum. Therefore, the heating of the target from the laser will be overestimated in the simulation, leading to a higher ion temperature and lower resistivity in the solid target. As a result, the resistive magnetic field in our simulation will be underestimated.
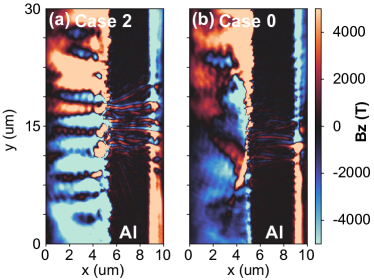
However, as is shown in Fig. 12, we can still qualitatively see a clear difference between Case 2 (using two laser beams with ) and Case 0 (using only one laser beam). In Case 2 (a), with the overlapped two laser beams, a stronger is induced inside the solid target, and we can see that the resistive magnetic field there reaches T at the end of the simulation (1 ps). On the contrary, in Case 0 (b), with one laser beam irradiating the solid target at an incidence angle of 15, the resistive magnetic field inside the solid target is only about T at the same time. We can expect that with the MR enhancement of the HEB (which we do not have here in our 2D simulations), the resistive magnetic field will be even larger in Case 2, and the collimation effect will be stronger.
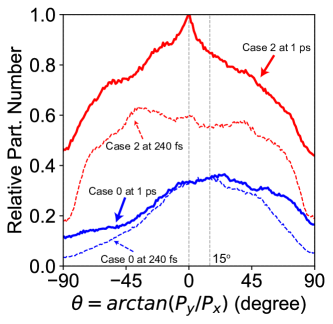
With the limited transport time and distance simulated here, the collimation effect of the resistive magnetic field on the HEB is also expected to be underestimated. However, we can still observe the collimation of the HEB during its transport in the solid target, as is shown in Fig. 13. On one hand, for Case 2 (red lines), at 240 fs, the angular divergence of the HEB (thin dashed red line) is quite wide, with half of the electrons having divergence less than 60°; while after transport through the solid target at 1 ps, the HEB angular divergence becomes narrower with one single peak at 0 (thick solid red line), with half of the electrons have divergence less than 30°. It demonstrates clearly the collimation effects of the resistive magnetic field on the HEB transport. On the other hand, for Case 0 (blue lines), at 240 fs, a wide angular divergence distribution peaks at around 15 (thin dashed blue line), i.e. the laser incidence angle; while at 1 ps, its distribution becomes even wider and the peak becomes larger than 15. Moreover, it is clear that in Case 2, the particle numbers are more than twice as high as that in Case 0. All the above simulation results (the enhancement and collimation of the HEB) are qualitatively consistent with our experimental results. Also, the fact that in Case 0 the angular divergence peaks at the laser incidence angle confirms our experimental observation about the guiding of the HEB along the laser forward direction. Note that the magnetic field at the rear side of the target is not our focus here, because, as our former study shows, its impact on the proton beam only appears at a much higher intensity [91].
IV Conclusion
To conclude, we have investigated the effects of spatially overlapped and temporally synchronized multiple laser beams in laser-matter interaction. Our experimental results indicate that a mirror-like configuration with multiple laser beams offers significant enhancement and optimization in the generation of the HEB and the subsequent ion acceleration. This is of particular interest for the next generation of multi-PW-class laser platforms, which will be composed of multiple laser beamlets. When using properly distributed beams on target, our 3D PIC simulations pinpoint that MR in the pre-plasma can significantly enhance the HEB generation, inducing as well an enhancement in the subsequent ion acceleration. Besides, 2D PIC simulations with ionization and collisions show a further benefit of having an enhanced HEB: a stronger growth of the resistive magnetic field during the HEB transport in the solid, which in turn helps optimize the collimation of the HEB. The comprehensive understanding of overlapping-beam effects detailed here paves the way to boosting the production of particle/radiation sources in PW-class high-intensity ps laser platforms by properly designing the beamlets irradiation scheme.
Acknowledgement
The authors would like to thank the teams of the Vulcan laser facility for their expert support. We also thank the SMILEI dev-team for technical support. W.Y. would like to thank X. F. Shen (HHU, Germany) for the discussions.
Funding
This work was supported by the European Research Council (ERC) under the European Union’s Horizon 2020 research and innovation program (Grant Agreement No. 787539). We also acknowledge funding from EPRSC (grants EP/E035728, EP/C003586 and EP/P010059/1). The computational resources of this work were supported by the National Sciences and Engineering Research Council of Canada (NSERC) and Compute Canada (Job: pve-323-ac, PA). The research leading to these results is supported by Extreme Light Infrastructure Nuclear Physics (ELI-NP) Phase II, a project co-financed by the Romanian Government and European Union through the European Regional Development Fund.
Competing Interests Statement
The authors declare no competing interests.
Data availability
All data needed to evaluate the conclusions in the paper are present in the paper. Experimental data and simulations are archived on servers at LULI laboratory and are available from the corresponding author upon reasonable request.
References
- Danson et al. [2019] C. N. Danson, C. Haefner, J. Bromage, T. Butcher, J.-C. F. Chanteloup, E. A. Chowdhury, A. Galvanauskas, L. A. Gizzi, J. Hein, D. I. Hillier, et al., Petawatt and exawatt class lasers worldwide, High Power Laser Science and Engineering 7, E54 (2019).
- Fuchs et al. [2006] J. Fuchs, P. Antici, E. d’Humières, E. Lefebvre, M. Borghesi, E. Brambrink, C. Cecchetti, M. Kaluza, V. Malka, M. Manclossi, et al., Laser-driven proton scaling laws and new paths towards energy increase, Nature Physics 2, 48–54 (2006).
- Roth et al. [2013] M. Roth, D. Jung, K. Falk, N. Guler, O. Deppert, M. Devlin, A. Favalli, J. Fernandez, D. Gautier, M. Geissel, et al., Bright laser-driven neutron source based on the relativistic transparency of solids, Physical Review Letters 110, 044802 (2013).
- Higginson et al. [2018] A. Higginson, R. Gray, M. King, R. Dance, S. Williamson, N. Butler, R. Wilson, R. Capdessus, C. Armstrong, J. Green, et al., Near-100 MeV protons via a laser-driven transparency-enhanced hybrid acceleration scheme, Nature Communications 9, 1–9 (2018).
- Gonsalves et al. [2019] A. Gonsalves, K. Nakamura, J. Daniels, C. Benedetti, C. Pieronek, T. De Raadt, S. Steinke, J. Bin, S. Bulanov, J. Van Tilborg, et al., Petawatt laser guiding and electron beam acceleration to 8 GeV in a laser-heated capillary discharge waveguide, Physical Review Letters 122, 084801 (2019).
- Barberio et al. [2018] M. Barberio, M. Scisciò, S. Vallières, F. Cardelli, S. Chen, G. Famulari, T. Gangolf, G. Revet, A. Schiavi, M. Senzacqua, et al., Laser-accelerated particle beams for stress testing of materials, Nature Communications 9, 1–7 (2018).
- Barberio et al. [2020] M. Barberio, S. Giusepponi, S. Vallières, M. Scisció, M. Celino, and P. Antici, Ultra-fast high-precision metallic nanoparticle synthesis using laser-accelerated protons, Scientific Reports 10, 1–17 (2020).
- Glinec et al. [2005] Y. Glinec, J. Faure, L. Le Dain, S. Darbon, T. Hosokai, J. Santos, E. Lefebvre, J.-P. Rousseau, F. Burgy, B. Mercier, et al., High-resolution -ray radiography produced by a laser-plasma driven electron source, Physical Review Letters 94, 025003 (2005).
- Mančić et al. [2010] A. Mančić, A. Lévy, M. Harmand, M. Nakatsutsumi, P. Antici, P. Audebert, P. Combis, S. Fourmaux, S. Mazevet, O. Peyrusse, et al., Picosecond short-range disordering in isochorically heated aluminum at solid density, Physical Review Letters 104, 035002 (2010).
- Mahieu et al. [2018] B. Mahieu, N. Jourdain, K. T. Phuoc, F. Dorchies, J.-P. Goddet, A. Lifschitz, P. Renaudin, and L. Lecherbourg, Probing warm dense matter using femtosecond x-ray absorption spectroscopy with a laser-produced betatron source, Nature Communications 9, 1–6 (2018).
- Fernández et al. [2019] J. C. Fernández, C. W. Barnes, M. J. Mocko, and L. Zavorka, Requirements and sensitivity analysis for temporally-and spatially-resolved thermometry using neutron resonance spectroscopy, Review of Scientific Instruments 90, 094901 (2019).
- Chen et al. [2015] H. Chen, F. Fiuza, A. Link, A. Hazi, M. Hill, D. Hoarty, S. James, S. Kerr, D. Meyerhofer, J. Myatt, et al., Scaling the yield of laser-driven electron-positron jets to laboratory astrophysical applications, Physical Review Letters 114, 215001 (2015).
- Higginson et al. [2019] D. Higginson, P. Korneev, C. Ruyer, R. Riquier, Q. Moreno, J. Béard, S. Chen, A. Grassi, M. Grech, L. Gremillet, et al., Laboratory investigation of particle acceleration and magnetic field compression in collisionless colliding fast plasma flows, Communications Physics 2, 1–7 (2019).
- Prasselsperger et al. [2021] A. Prasselsperger, M. Coughlan, N. Breslin, M. Yeung, C. Arthur, H. Donnelly, S. White, M. Afshari, M. Speicher, R. Yang, et al., Real-Time Electron Solvation Induced by Bursts of Laser-Accelerated Protons in Liquid Water, Physical Review Letters 127, 186001 (2021).
- Barberio et al. [2017] M. Barberio, S. Veltri, M. Scisciò, and P. Antici, Laser-accelerated proton beams as diagnostics for cultural heritage, Scientific Reports 7, 1–8 (2017).
- Roth et al. [2001] M. Roth, T. Cowan, M. Key, S. Hatchett, C. Brown, W. Fountain, J. Johnson, D. Pennington, R. Snavely, S. Wilks, et al., Fast ignition by intense laser-accelerated proton beams, Physical Review Letters 86, 436 (2001).
- Fernández et al. [2009] J. C. Fernández, J. Honrubia, B. J. Albright, K. A. Flippo, D. C. Gautier, B. M. Hegelich, M. J. Schmitt, M. Temporal, and L. Yin, Progress and prospects of ion-driven fast ignition, Nuclear Fusion 49, 065004 (2009).
- Kraft et al. [2010] S. Kraft, C. Richter, K. Zeil, M. Baumann, E. Beyreuther, S. Bock, M. Bussmann, T. Cowan, Y. Dammene, W. Enghardt, et al., Dose-dependent biological damage of tumour cells by laser-accelerated proton beams, New Journal of Physics 12, 085003 (2010).
- Ehlert et al. [2021] J. Ehlert, M. Piel, F. Boege, M. Cerchez, R. Haas, G. Iliakis, R. Prasad, O. Willi, and C. Monzel, An experimental platform for studying the radiation effects of laser accelerated protons on mammalian cells, AIP Advances 11, 065208 (2021).
- Bulanov et al. [2002] S. Bulanov, T. Z. Esirkepov, V. Khoroshkov, A. Kuznetsov, and F. Pegoraro, Oncological hadrontherapy with laser ion accelerators, Physics Letters A 299, 240–247 (2002).
- Ostermayr et al. [2020] T. Ostermayr, C. Kreuzer, F. Englbrecht, J. Gebhard, J. Hartmann, A. Huebl, D. Haffa, P. Hilz, K. Parodi, J. Wenz, et al., Laser-driven x-ray and proton micro-source and application to simultaneous single-shot bi-modal radiographic imaging, Nature Communications 11, 1–9 (2020).
- Zeil et al. [2013] K. Zeil, M. Baumann, E. Beyreuther, T. Burris-Mog, T. Cowan, W. Enghardt, L. Karsch, S. Kraft, L. Laschinsky, J. Metzkes, et al., Dose-controlled irradiation of cancer cells with laser-accelerated proton pulses, Applied Physics B 110, 437–444 (2013).
- Nguyen et al. [2006] H. Nguyen, J. Britten, T. Carlson, J. Nissen, L. Summers, C. Hoaglan, M. Aasen, J. Peterson, and I. Jovanovic, Gratings for high-energy petawatt lasers, Proceedings Volume 5991, Laser-Induced Damage in Optical Materials: 2005 , 59911M (2006).
- Chorel et al. [2018] M. Chorel, T. Lanternier, E. Lavastre, N. Bonod, B. Bousquet, and J. Néauport, Robust optimization of the laser induced damage threshold of dielectric mirrors for high power lasers, Optics Express 26, 11764–11774 (2018).
- Batani et al. [2014] D. Batani, M. Koenig, J. Miquel, J. Ducret, E. d’Humieres, S. Hulin, J. Caron, J. Feugeas, P. Nicolai, V. Tikhonchuk, et al., Development of the PETawatt Aquitaine Laser system and new perspectives in physics, Physica Scripta 2014, 014016 (2014).
- Di Nicola et al. [2015] J. Di Nicola, S. Yang, C. Boley, J. K. Crane, J. Heebner, T. M. Spinka, P. Arnold, C. Barty, M. Bowers, T. Budge, et al., The commissioning of the advanced radiographic capability laser system: experimental and modeling results at the main laser output, High Power Lasers for Fusion Research III 9345, 93450I (2015).
- Kawanaka et al. [2008] J. Kawanaka, N. Miyanaga, H. Azechi, T. Kanabe, T. Jitsuno, K. Kondo, Y. Fujimoto, N. Morio, S. Matsuo, Y. Kawakami, et al., 3.1-kJ chirped-pulse power amplification in the LFEX laser, Journal of Physics: Conference Series 112, 032006 (2008).
- Arikawa et al. [2016] Y. Arikawa, S. Kojima, A. Morace, S. Sakata, T. Gawa, Y. Taguchi, Y. Abe, Z. Zhang, X. Vaisseau, S. H. Lee, et al., Ultrahigh-contrast kilojoule-class petawatt LFEX laser using a plasma mirror, Applied Optics 55, 6850–6857 (2016).
- Liang et al. [2020] X. Liang, Y. Leng, R. Li, and Z. Xu, Recent Progress on the Shanghai Superintense Ultrafast Laser Facility (SULF) at SIOM, OSA High-brightness Sources and Light-driven Interactions Congress 2020 (EUVXRAY, HILAS, MICS) , HTh2B.2 (2020).
- SHAYKIN et al. [2014] A. SHAYKIN, I. KOSTYUKOV, A. SERGEEV, and E. KHAZANOV, Prospects of PEARL 10 and XCELS laser facilities, The Review of Laser Engineering 42, 141 (2014).
- Kim et al. [2013] H. T. Kim, K. H. Pae, H. J. Cha, I. J. Kim, T. J. Yu, J. H. Sung, S. K. Lee, T. M. Jeong, and J. Lee, Enhancement of electron energy to the multi-GeV regime by a dual-stage laser-wakefield accelerator pumped by petawatt laser pulses, Physical Review Letters 111, 165002 (2013).
- Gu et al. [2015] Y. Gu, O. Klimo, D. Kumar, S. Bulanov, T. Z. Esirkepov, S. Weber, and G. Korn, Fast magnetic field annihilation driven by two laser pulses in underdense plasma, Physics of Plasmas 22, 103113 (2015).
- Steinke et al. [2016] S. Steinke, J. Van Tilborg, C. Benedetti, C. Geddes, C. Schroeder, J. Daniels, K. Swanson, A. Gonsalves, K. Nakamura, N. Matlis, et al., Multistage coupling of independent laser-plasma accelerators, Nature 530, 190–193 (2016).
- Debus et al. [2019] A. Debus, R. Pausch, A. Huebl, K. Steiniger, R. Widera, T. E. Cowan, U. Schramm, and M. Bussmann, Circumventing the dephasing and depletion limits of laser-wakefield acceleration, Physical Review X 9, 031044 (2019).
- Santala et al. [2000] M. Santala, M. Zepf, I. Watts, F. Beg, E. Clark, M. Tatarakis, K. Krushelnick, A. Dangor, T. McCanny, I. Spencer, et al., Effect of the plasma density scale length on the direction of fast electrons in relativistic laser-solid interactions, Physical Review Letters 84, 1459 (2000).
- Green et al. [2008] J. Green, V. Ovchinnikov, R. Evans, K. Akli, H. Azechi, F. Beg, C. Bellei, R. Freeman, H. Habara, R. Heathcote, et al., Effect of laser intensity on fast-electron-beam divergence in solid-density plasmas, Physical Review Letters 100, 015003 (2008).
- Chawla et al. [2013] S. Chawla, M. Wei, R. Mishra, K. Akli, C. Chen, H. McLean, A. Morace, P. Patel, H. Sawada, Y. Sentoku, et al., Effect of target material on fast-electron transport and resistive collimation, Physical Review Letters 110, 025001 (2013).
- Chen et al. [2013] C. Chen, A. Kemp, F. Perez, A. Link, F. Beg, S. Chawla, M. Key, H. McLean, A. Morace, Y. Ping, et al., Comparisons of angularly and spectrally resolved Bremsstrahlung measurements to two-dimensional multi-stage simulations of short-pulse laser-plasma interactions, Physics of Plasmas 20, 052703 (2013).
- Fujioka et al. [2015] S. Fujioka, T. Johzaki, Y. Arikawa, Z. Zhang, A. Morace, T. Ikenouchi, T. Ozaki, T. Nagai, Y. Abe, S. Kojima, et al., Heating efficiency evaluation with mimicking plasma conditions of integrated fast-ignition experiment, Physical Review E 91, 063102 (2015).
- Ziegler et al. [2021] T. Ziegler, D. Albach, C. Bernert, S. Bock, F.-E. Brack, T. Cowan, N. Dover, M. Garten, L. Gaus, R. Gebhardt, et al., Proton beam quality enhancement by spectral phase control of a PW-class laser system, Scientific Reports 11, 1–7 (2021).
- Scott et al. [2012a] R. Scott, C. Beaucourt, H.-P. Schlenvoigt, K. Markey, K. Lancaster, C. Ridgers, C. Brenner, J. Pasley, R. Gray, I. Musgrave, et al., Controlling fast-electron-beam divergence using two laser pulses, Physical Review Letters 109, 015001 (2012a).
- Malko et al. [2019] S. Malko, X. Vaisseau, F. Perez, D. Batani, A. Curcio, M. Ehret, J. Honrubia, K. Jakubowska, A. Morace, J. J. Santos, et al., Enhanced relativistic-electron beam collimation using two consecutive laser pulses, Scientific Reports 9, 1–7 (2019).
- Wilks et al. [2001] S. Wilks, A. Langdon, T. Cowan, M. Roth, M. Singh, S. Hatchett, M. Key, D. Pennington, A. MacKinnon, and R. Snavely, Energetic proton generation in ultra-intense laser–solid interactions, Physics of Plasmas 8, 542–549 (2001).
- Mora [2003] P. Mora, Plasma expansion into a vacuum, Physical Review Letters 90, 185002 (2003).
- Markey et al. [2010] K. Markey, P. McKenna, C. Brenner, D. Carroll, M. Günther, K. Harres, S. Kar, K. Lancaster, F. Nürnberg, M. Quinn, et al., Spectral enhancement in the double pulse regime of laser proton acceleration, Physical Review Letters 105, 195008 (2010).
- Scott et al. [2012b] G. Scott, J. Green, V. Bagnoud, C. Brabetz, C. Brenner, D. Carroll, D. MacLellan, A. Robinson, M. Roth, C. Spindloe, et al., Multi-pulse enhanced laser ion acceleration using plasma half cavity targets, Applied Physics Letters 101, 024101 (2012b).
- Morace et al. [2019] A. Morace, N. Iwata, Y. Sentoku, K. Mima, Y. Arikawa, A. Yogo, A. Andreev, S. Tosaki, X. Vaisseau, Y. Abe, et al., Enhancing laser beam performance by interfering intense laser beamlets, Nature Communications 10, 1–9 (2019).
- Yogo et al. [2017] A. Yogo, K. Mima, N. Iwata, S. Tosaki, A. Morace, Y. Arikawa, S. Fujioka, T. Johzaki, Y. Sentoku, H. Nishimura, et al., Boosting laser-ion acceleration with multi-picosecond pulses, Scientific Reports 7, 1–10 (2017).
- Sarri et al. [2012] G. Sarri, A. Macchi, C. Cecchetti, S. Kar, T. Liseykina, X. Yang, M. E. Dieckmann, J. Fuchs, M. Galimberti, L. Gizzi, et al., Dynamics of self-generated, large amplitude magnetic fields following high-intensity laser matter interaction, Physical Review Letters 109, 205002 (2012).
- Schumaker et al. [2013] W. Schumaker, N. Nakanii, C. McGuffey, C. Zulick, V. Chyvkov, F. Dollar, H. Habara, G. Kalintchenko, A. Maksimchuk, K. Tanaka, et al., Ultrafast electron radiography of magnetic fields in high-intensity laser-solid interactions, Physical Review Letters 110, 015003 (2013).
- Raymond et al. [2018] A. Raymond, C. Dong, A. McKelvey, C. Zulick, N. Alexander, A. Bhattacharjee, P. Campbell, H. Chen, V. Chvykov, E. Del Rio, et al., Relativistic-electron-driven magnetic reconnection in the laboratory, Physical Review E 98, 043207 (2018).
- Palmer et al. [2019] C. Palmer, P. Campbell, Y. Ma, L. Antonelli, A. Bott, G. Gregori, J. Halliday, Y. Katzir, P. Kordell, K. Krushelnick, et al., Field reconstruction from proton radiography of intense laser driven magnetic reconnection, Physics of Plasmas 26, 083109 (2019).
- Golovin et al. [2020] D. O. Golovin, S. R. Mirfayzi, Y. J. Gu, Y. Abe, Y. Honoki, T. Mori, H. Nagatomo, K. Okamoto, S. Shokita, K. Yamanoi, et al., Enhancement of ion energy and flux by the influence of magnetic reconnection in foam targets, High Energy Density Physics 36, 100840 (2020).
- Gu et al. [2019] Y. Gu, F. Pegoraro, P. Sasorov, D. Golovin, A. Yogo, G. Korn, and S. Bulanov, electromagnetic Burst Generation during Annihilation of Magnetic field in Relativistic Laser-plasma interaction, Scientific Reports 9, 1–10 (2019).
- Ferri et al. [2019] J. Ferri, E. Siminos, and T. Fülöp, Enhanced target normal sheath acceleration using colliding laser pulses, Communications Physics 2, 1–8 (2019).
- Ferri et al. [2020] J. Ferri, E. Siminos, L. Gremillet, and T. Fülöp, Effects of oblique incidence and colliding pulses on laser-driven proton acceleration from relativistically transparent ultrathin targets, Journal of Plasma Physics 86 (2020).
- Burdonov et al. [2021] K. Burdonov, A. Fazzini, V. Lelasseux, J. Albrecht, P. Antici, Y. Ayoul, A. Beluze, D. Cavanna, T. Ceccotti, M. Chabanis, et al., Characterization and performance of the Apollon Short-Focal-Area facility following its commissioning at 1 PW level, Matter and Radiation at Extremes 6, 064402 (2021).
- Raffestin et al. [2021] D. Raffestin, L. Lecherbourg, I. Lantuéjoul, B. Vauzour, P. Masson-Laborde, X. Davoine, N. Blanchot, J. Dubois, X. Vaisseau, E. d’Humières, et al., Enhanced ion acceleration using the high-energy petawatt PETAL laser, Matter and Radiation at Extremes 6, 056901 (2021).
- Sentoku et al. [2011] Y. Sentoku, E. d’Humières, L. Romagnani, P. Audebert, and J. Fuchs, Dynamic control over mega-ampere electron currents in metals using ionization-driven resistive magnetic fields, Physical Review Letters 107, 135005 (2011).
- Mariscal et al. [2019] D. Mariscal, T. Ma, S. Wilks, A. Kemp, G. Williams, P. Michel, H. Chen, P. Patel, B. Remington, M. Bowers, et al., First demonstration of ARC-accelerated proton beams at the National Ignition Facility, Physics of Plasmas 26, 043110 (2019).
- Bolton et al. [2014] P. Bolton, M. Borghesi, C. Brenner, D. Carroll, C. De Martinis, F. Fiorini, A. Flacco, V. Floquet, J. Fuchs, P. Gallegos, et al., Instrumentation for diagnostics and control of laser-accelerated proton (ion) beams, Physica Medica 30, 255–270 (2014).
- Link et al. [2011] A. Link, R. R. Freeman, D. Schumacher, and L. Van Woerkom, Effects of target charging and ion emission on the energy spectrum of emitted electrons, Physics of Plasmas 18, 053107 (2011).
- Rusby et al. [2015] D. Rusby, L. Wilson, R. Gray, R. Dance, N. Butler, D. MacLellan, G. Scott, V. Bagnoud, B. Zielbauer, P. McKenna, et al., Measurement of the angle, temperature and flux of fast electrons emitted from intense laser–solid interactions, Journal of Plasma Physics 81, 475810505 (2015).
- Wagner et al. [2014] F. Wagner, S. Bedacht, A. Ortner, M. Roth, A. Tauschwitz, B. Zielbauer, and V. Bagnoud, Pre-plasma formation in experiments using petawatt lasers, Optics Express 22, 29505–29514 (2014).
- Chen et al. [2007] S. Chen, G. Gregori, P. Patel, H.-K. Chung, R. Evans, R. Freeman, E. Garcia Saiz, S. Glenzer, S. Hansen, F. Khattak, et al., Creation of hot dense matter in short-pulse laser-plasma interaction with tamped titanium foils, Physics of Plasmas 14, 102701 (2007).
- Michaelis and Willi [1981] M. Michaelis and O. Willi, Refractive fringe diagnostics of laser produced plasmas, Optics Communications 36, 153–158 (1981).
- Kodama et al. [2000] R. Kodama, K. Tanaka, Y. Sentoku, T. Matsushita, K. Takahashi, H. Fujita, Y. Kitagawa, Y. Kato, T. Yamanaka, and K. Mima, Long-scale jet formation with specularly reflected light in ultraintense laser-plasma interactions, Physical Review Letters 84, 674 (2000).
- Boutoux et al. [2015] G. Boutoux, N. Rabhi, D. Batani, A. Binet, J.-E. Ducret, K. Jakubowska, J.-P. Nègre, C. Reverdin, and I. Thfoin, Study of imaging plate detector sensitivity to 5-18 MeV electrons, Review of Scientific Instruments 86, 113304 (2015).
- Fasso et al. [2005] A. Fasso, A. Ferrari, J. Ranft, and P. R. Sala, FLUKA: a multi-particle transport code, Tech. Rep. (CERN-2005-10, 2005).
- Battistoni et al. [2007] G. Battistoni, F. Cerutti, A. Fasso, A. Ferrari, S. Muraro, J. Ranft, S. Roesler, and P. Sala, The FLUKA code: Description and benchmarking, AIP Conference proceedings 896, 31–49 (2007).
- Böhlen et al. [2014] T. Böhlen, F. Cerutti, M. Chin, A. Fassò, A. Ferrari, P. G. Ortega, A. Mairani, P. R. Sala, G. Smirnov, and V. Vlachoudis, The FLUKA code: developments and challenges for high energy and medical applications, Nuclear Data Sheets 120, 211–214 (2014).
- Kluge et al. [2011] T. Kluge, T. Cowan, A. Debus, U. Schramm, K. Zeil, and M. Bussmann, Electron temperature scaling in laser interaction with solids, Physical Review Letters 107, 205003 (2011).
- Antici et al. [2008] P. Antici, J. Fuchs, M. Borghesi, L. Gremillet, T. Grismayer, Y. Sentoku, E. d’Humières, C. Cecchetti, A. Mančić, A. Pipahl, et al., Hot and cold electron dynamics following high-intensity laser matter interaction, Physical Review Letters 101, 105004 (2008).
- Cowan et al. [2004] T. Cowan, J. Fuchs, H. Ruhl, A. Kemp, P. Audebert, M. Roth, R. Stephens, I. Barton, A. Blazevic, E. Brambrink, et al., Ultralow emittance, multi-MeV proton beams from a laser virtual-cathode plasma accelerator, Physical Review Letters 92, 204801 (2004).
- Snavely et al. [2000] R. Snavely, M. Key, S. Hatchett, T. Cowan, M. Roth, T. Phillips, M. Stoyer, E. Henry, T. Sangster, M. Singh, et al., Intense high-energy proton beams from petawatt-laser irradiation of solids, Physical Review Letters 85, 2945 (2000).
- Mora [2005] P. Mora, Thin-foil expansion into a vacuum, Physical Review E 72, 056401 (2005).
- Adam et al. [2006] J. Adam, A. Héron, and G. Laval, Dispersion and transport of energetic particles due to the interaction of intense laser pulses with overdense plasmas, Physical Review Letters 97, 205006 (2006).
- Derouillat et al. [2018] J. Derouillat, A. Beck, F. Pérez, T. Vinci, M. Chiaramello, A. Grassi, M. Flé, G. Bouchard, I. Plotnikov, N. Aunai, et al., Smilei: A collaborative, open-source, multi-purpose particle-in-cell code for plasma simulation, Computer Physics Communications 222, 351–373 (2018).
- Mendonca and Doveil [1982] J. Mendonca and F. Doveil, Stochasticity in plasmas with electromagnetic waves, Journal of Plasma Physics 28, 485–493 (1982).
- Willingale et al. [2009] L. Willingale, S. Nagel, A. Thomas, C. Bellei, R. Clarke, A. Dangor, R. Heathcote, M. Kaluza, C. Kamperidis, S. Kneip, et al., Characterization of high-intensity laser propagation in the relativistic transparent regime through measurements of energetic proton beams, Physical Review Letters 102, 125002 (2009).
- Pérez et al. [2013] F. Pérez, A. Kemp, L. Divol, C. Chen, and P. Patel, Deflection of MeV electrons by self-generated magnetic fields in intense laser-solid interactions, Physical Review Letters 111, 245001 (2013).
- Ping et al. [2008] Y. Ping, R. Shepherd, B. Lasinski, M. Tabak, H. Chen, H. Chung, K. Fournier, S. Hansen, A. Kemp, D. Liedahl, et al., Absorption of short laser pulses on solid targets in the ultrarelativistic regime, Physical Review Letters 100, 085004 (2008).
- Nuter et al. [2011] R. Nuter, L. Gremillet, E. Lefebvre, A. Lévy, T. Ceccotti, and P. Martin, Field ionization model implemented in particle in cell code and applied to laser-accelerated carbon ions, Physics of Plasmas 18, 033107 (2011).
- Ammosov [1987] M. V. Ammosov, Tunnel ionization of complex atoms and of atomic ions in an altemating electromagnetic field, Sov. Phys. JETP 64, 1191 (1987).
- Greenwood et al. [2004] A. D. Greenwood, K. L. Cartwright, J. W. Luginsland, and E. A. Baca, On the elimination of numerical Cerenkov radiation in PIC simulations, Journal of Computational Physics 201, 665–684 (2004).
- Vay et al. [2011] J.-L. Vay, C. G. Geddes, E. Cormier-Michel, and D. P. Grote, Numerical methods for instability mitigation in the modeling of laser wakefield accelerators in a Lorentz-boosted frame, Journal of Computational Physics 230, 5908–5929 (2011).
- Pérez et al. [2012] F. Pérez, L. Gremillet, A. Decoster, M. Drouin, and E. Lefebvre, Improved modeling of relativistic collisions and collisional ionization in particle-in-cell codes, Physics of Plasmas 19, 083104 (2012).
- Higginson et al. [2020] D. P. Higginson, I. Holod, and A. Link, A corrected method for Coulomb scattering in arbitrarily weighted particle-in-cell plasma simulations, Journal of Computational Physics 413, 109450 (2020).
- Debayle et al. [2010] A. Debayle, J. Honrubia, E. d’Humieres, and V. Tikhonchuk, Divergence of laser-driven relativistic electron beams, Physical Review E 82, 036405 (2010).
- Perez et al. [2010] F. Perez, S. Baton, M. Koenig, C. Chen, D. Hey, M. Key, S. Le Pape, T. Ma, H. McLean, A. MacPhee, et al., Single-shot divergence measurements of a laser-generated relativistic electron beam, Physics of Plasmas 17, 113106 (2010).
- Nakatsutsumi et al. [2018] M. Nakatsutsumi, Y. Sentoku, A. Korzhimanov, S. Chen, S. Buffechoux, A. Kon, B. Atherton, P. Audebert, M. Geissel, L. Hurd, et al., Self-generated surface magnetic fields inhibit laser-driven sheath acceleration of high-energy protons, Nature Communications 9, 1–9 (2018).