CodeBERT-nt: code naturalness via CodeBERT
Abstract
Much of software-engineering research relies on the naturalness of code, the fact that code, in small code snippets, is repetitive and can be predicted using statistical language models like n-gram. Although powerful, training such models on large code corpus is tedious, time consuming and sensitive to code patterns (and practices) encountered during training. Consequently, these models are often trained on a small corpora and estimate the language naturalness that is relative to a specific style of programming or type of project. To overcome these issues, we propose using pre-trained language models to infer code naturalness. Pre-trained models are often built on big data, are easy to use in an out-of-the-box way and include powerful learning associations mechanisms. Our key idea is to quantify code naturalness through its predictability, by using state-of-the-art generative pre-trained language models. To this end, we infer naturalness by masking (omitting) code tokens, one at a time, of code-sequences, and checking the models’ ability to predict them. To this end, we evaluate three different predictability metrics; a) measuring the number of exact matches of the predictions, b) computing the embedding similarity between the original and predicted code, i.e., similarity at the vector space, and c) computing the confidence of the model when doing the token completion task irrespective of the outcome. We implement this workflow, named CodeBERT-nt, and evaluate its capability to prioritize buggy lines over non-buggy ones when ranking code based on its naturalness. Our results, on 2,510 buggy versions of 40 projects from the SmartShark dataset, show that CodeBERT-nt outperforms both, random-uniform and complexity-based ranking techniques, and yields comparable results (slightly better) than the n-gram models.
I Introduction
There is a large body of research demonstrating that code, in small snippets, is repetitive and thus predictable [1]. This repetitiveness of code is typically captured by statistical language models, like n-grams [2], that determine the appearance likelihood of a token given its preceding (or subsequent) ones. By computing the likelihood of tokens, in a sequence, and by using cross-entropy [3, 4], we can estimate the appearance likelihood of a given token sequence.
In essence, n-gram-based cross-entropy quantifies the conformance of a given code sequence to the sequences appearing within the code corpus that was used during the n-gram training process. This naturalness metric of code can be quite powerful since it can identify unusual code sequences, that may reflect code that is smelly [5, 6], of low readability [7, 8], or simply a rare specific implementation instance [9].
Although powerful, training such models on large code corpus is tedious, time consuming and sensitive to code patterns (and specificities) of the used projects. Additionally, the models are sensitive to a number of meta-parameters such as tokenizers, smoothing techniques, unknown threshold and values [10]. Consequently, these models are often trained on a small corpus and estimate the language naturalness that is relative to a specific style of programming or type of project [1]. Moreover, their generalization ability, in a cross-project fashion, when trained on large corpus remains unclear since no such evidence appear in the related literature.
To overcome these issues, we propose using generative pre-trained language models, such as CodeBERT, to infer code naturalness. Pre-trained models have been shown to provide strong results on several code-related tasks such as code generation and translation. They are often built on big data, are easy to use in an out-of-the-box way and include powerful learning associations mechanisms that allow them to generalize well to unseen code and projects.
Therefore, our key objective is to form a powerful and flexible – easy to use – tool for computing code naturalness that is applicable in a cross-project fashion. However, due to the generative nature of these models, they do not allow the computation of cross-entropy like measures, i.e., the probability of the appearance of given tokens of code.
To deal with this issue we view code naturalness as a predictability metric. Thus, we measure how well code tokens can be generated by the models, and use it to infer naturalness. In particular, we mask (omit) code tokens, one at a time, of code sequences, and check the models’ ability to predict them. We then define and investigate the use of predictability metrics, that can be computed based on CodeBERT, to infer code naturalness. To this end, we evaluate three different predictability metrics:
-
•
counting the number of exact matches of the predictions.
-
•
computing the embedding similarity between the original and predicted code, i.e., similarity at the vector space.
-
•
computing the confidence of the model when doing the token completion task, regardless to the outcome.
We implement this workflow, which we call CodeBERT-nt, and evaluate its suitability in inferring code naturalness. We also investigated the use of different aggregation methods on top of the above-defined token predictability metrics, such as minimum, maximum, mean, median and cross-entropy to infer the naturalness of code statements/lines as a whole thereby computing (n-token) naturalness and going beyond single tokens.
Since naturalness of code is a relative measure, i.e., it strongly depends on the models and training data used, and every metric involves its own specific building blocks, we cannot directly contrast the values of one metric over the others. To bypass this problem we compare the metrics according to the relative performance differences on an end task, for which we have a solid ground truth. In particular, we evaluate the performance of our metrics w.r.t. their ability to rank buggy lines of code.
Previous work has shown that unusual code is often linked with bug-proneness and bugginess, thereby making n-gram-based cross entropy a tool capable to identify likely buggy code [9, 11]. This means that buggy lines tend to be unnatural (entropy is high), or at least more unnatural compared to the clean ones that tend to be natural (entropy is low). Moreover, empirical studies [11], have shown that code naturalness has a comparable performance to other static bug finding approaches such as PMD [12] and FindBugs [13].
We, therefore, investigate the ability of CodeBERT-nt to distinguish natural (clean) from unnatural (buggy) code. To do so, we need a solid ground truth of buggy and clean code. Hence we select the SmartShark dataset [14], which contains manually untangled buggy and fixed code versions. This allows us to know the buggy code lines for which we can perform our experiment. We thus, used 2,510 buggy versions from 40 projects and investigated the performance of CodeBERT-nt and contrast it with that of typical baselines such as uniform-random and complexity-based rankings [15].
To further strengthen our study, we also compared our results with that of n-gram models when trained on an intra-project fashion (as typically performed in literature [10, 11]). Precisely, for every subject bug, we split its corresponding project-version code into two sets of lines: 1) the training set which counts all neutral file lines (files not impacted by the fix-commit) and 2) the evaluation lines set which counts all lines from the remaining files. We used recommended settings by Jimenez et al. [10] – unknown threshold, with KN as smoother – and two fundamentally different tokenizers; 1) UTF8 which tokenize the code as a natural-language text including the comments and javadoc and 2) Java Parser [16] which tokenize the code according to the java language grammar, excluding comments and documentation. Finally, we compared CodeBERT-nt metrics with the cross-entropy measured by these models in terms of ranking the buggy lines. Our results suggest that our (inter-project) CodeBERT-nt yields comparable results (slightly better) than the (intra-project) naturalness predictions of the n-gram models.
Overall, our primary contributions are:
-
•
We demonstrate that pre-trained generative models like CodeBERT capture the language naturalness notion. We can infer the naturalness aspect of a source-code from the CodeBERT prediction results.
-
•
We introduce a novel approach to detect source-code naturalness that works in cross-project context and does not rely on the aspects of naturalness that are tight to a specific project. For instance, It does not require any further training or specific knowledge of the target project, to rank its lines by bugginess likelihood, thus can be easily used in the future as a baseline.
-
•
We provide empirical evidence demonstrating that the proposed approach is comparable to the current state-of-the-art.
II Background and related work
II-A Code-naturalness
Estimating the source-code naturalness and predictability has been widely investigated. Based on the fact that code is repetitive, the measure of naturalness was adopted on programming languages [1], using fundamentally the same techniques as for natural languages. Notably, Language models and particularly n-grams are the most popular medium of computing this measure. N-gram models approximate the naturalness of a sequence of tokens based on its occurrence likely-hood, estimated relatively to the sequences observed in the training set. This probability follows a Markov chain conditional probability series, where the probability of a token to occur depends on the preceding tokens. To highlight irregular sequences (low probabilities of occurring), the naturalness of a sequence is expressed as a cross-entropy [3, 4] which is computed by aggregating the logarithm of its token probabilities as follows:
| (1) |
where denotes the order of the n-gram model, the set of tokens forming the sequence and the probability knowing . Consequently, n-gram models attribute high entropy values to unusual (not natural) code relatively to regular (natural) code. To avoid assigning a zero probability to tokens that do not appear in the model vocabulary (which is often the case of variable names), n-gram models replace every token occurring less than times by a placeholder <UNK> and attributes a not zero probability to it, where and <UNK> are usually called the unknown threshold and unknown word [2, 17, 10]. Similarly, to deal with unseen sequences of tokens in the training set, several smoothing techniques have been proposed and evaluated, among which Kneser Ney (KN) [18] and Modified Kneser Ney (NKM) [17] are the best performing smoothers [17, 1], with an eventual advantage for the latter one [10]. Among the potential applications of the naturalness of code property, Baishakhi et al.[11] have shown empirical evidence that buggy lines are on average less natural than not-buggy ones and that n-gram entropy can be useful in guiding bug-finding tasks at both file- and line-level. Jimenez et al. [10] evaluated the sensitivity of n-gram w.r.t. its parameters and code tokenization techniques, via a file level naturalness-study. Their results confirmed Baishakhi et al. findings and provided recommendations on the best n-gram configurations for naturalness based applications, including the differentiation between buggy and fixed code.
II-B CodeBERT
Microsoft has recently introduced CodeBERT [19], a bimodal pre-trained language model that supports multiple NL-PL (Natural Language and Programming Language) applications such as code search, code documentation generation, etc. The model was developed with a Multilayer Transformer [20] architecture, which is adopted by the majority of large pre-trained models like BERT [21]. It has been trained on a large-scale dataset counting over 6 million projects from GitHub in 6 different programming languages, including Java. To ensure its bimodal functionalities, CodeBERT was trained towards a hybrid objective function (based on replaced token detection) in a cross-modal style, based on bimodal NL-PL data (precisely, source-code paired with its documentation) and unimodal data (including NL and PL sequences). In this work, we incorporate its Masked Language Modeling (MLM) functionality [22] in our experiments pipeline, in order to study the possibility of inferring code naturalness from the CodeBERT prediction results.
III Research Questions
Our main objective is to form a flexible and easy-to-use tool for computing naturalness of code in a cross-project fashion. We thus, aim at using pre-trained generative language models, such as CodeBERT, that are powerful, readily available and trained over very large corpora. Since naturalness is a metric of how predictable a piece of code is and such pre-trained models are trained to predict code tokens, given their surrounding code, there should be a way to exploit them and compute code naturalness. However, since these models are generative, they do not compute the probability of the appearance of given tokens of code thereby obviating the naturalness calculation. To this end, we investigate the use of potential predictability metrics, that can be computed based on CodeBERT, and allow quantifying the predictability of code, which in fact represents code naturalness.
Since naturalness of code is a relative measure, i.e., it strongly depends on the models and training data used, we cannot directly contrast the values of one metric over the others. We therefore, contrast them based on their performance on an end task, for which we have a solid ground truth. In particular, we evaluate the performance of our metrics w.r.t. the naturalness of bugs hypothesis that states: ”unnatural code is more likely to be buggy than natural code” [11]. This means that a good naturalness metric should be capable of distinguishing natural (clean) from unnatural (buggy) code. Hence, we ask:
- RQ1
-
(Metrics and aggregation methods): Which metrics and line-level aggregation methods lead to the best segregation between buggy and not buggy lines?
To answer this question, we check if any pairs of metric-aggregation discriminate better the buggy from the clean lines. To do so, we rank and compare the results of both - ascendant and descendant - sorting orders on all possible pairs to determine the one that discriminates best. Using these matching sorting orders for every pair, we select the most effective aggregation method for every metric in terms of ranking buggy lines.
However, getting the best ranking does not necessarily mean that our metrics perform well. We thus, turn our attention to the significance of these results and contrast them with some obvious baselines, such as the random order and source-code complexity order (ranking the most complex lines first). Random order offers a sanity check for coincidental results, and complexity offers an unsupervised baseline [23], i.e., shows that our metrics do not simply measure complexity instead of naturalness. Therefore, we ask:
- RQ2
-
(Comparison with random and complexity based rankings): How does CodeBERT naturalness compares with random and source-code complexity, in terms of buggy lines ranking?
To check whether the naturalness captured by CodeBERT is useful, we compare with 1) a uniform random selection based technique and 2) a code-complexity based one, where the complexity is measured in terms of number of tokens and the most complex lines are considered more likely to be buggy. To make a fair comparison, we compare the techniques on ranking the same subject lines and the same buggy versions, which have each at least one buggy line.
As the above-mentioned baselines are relatively weak, we also compare our metrics with n-gram models that were originally used to show the naturalness of buggy code hypothesis. This leads us to the following question:
- RQ3
-
(Comparison with n-gram): How does CodeBERT compare with n-gram language models, in terms of lines ranking by bugginess?
We answer this question by ranking the subject lines based on their cross-entropies measured by n-gram models trained on the source-code of the same version of the considered project. In fact, for every considered bug we create two n-gram models (using each of UTF8 and Java Parser tokenizers) trained on the source code of the files that has not been changed by the fix patch. Then, we use these models to calculate the cross-entropies of the subject lines. Finally, we compare the ranking results by the n-gram models with our proposed approach, the same way as we did in RQ2.
Obviously, the RQ3 comparison does not aim at answering the question of which model is best, but to show a relative performance of the models. This is because the training corpora of the models are significantly different with each one having significant associated advantages. In particular, CodeBERT has an advantage of being trained on a much larger corpus than the n-grams. However, n-grams have the advantage of operating on an intra-project fashion, which is significantly more powerful [24] than the inter-project cases, as the one of CodeBERT.
IV Experimental Setup
IV-A Dataset & Benchmark
To perform our study, we use a recently crafted dataset of commits; SmartSHARK [14]. This dataset is distributed as a MongoDB database describing commit-details extracted from multiple open-source python and java projects. A specificity of Smartshark is that its data are manually refined, i.e., the commits are untangled and the fix validated, hence reducing the threat of noisy data.
In our study, we use the issue-fixing commits of the 40 available java projects the dataset includes.
IV-A1 Buggy versions selection
For most of the issues, SmartSHARK provides one or more related commits, among which the fixing-commits are labeled as validated fix-commits. Thus, to build our bugs dataset, we exclude all issues having no corresponding fix-commit, or having multiple fix-commits. While the first case is straight forward, the latter is applied to further reduce noise in the data as pinpointing bugs origin from multiple fixing commits is harder and more error prone. This way, we obtain one fix-commit per issue where the changed lines form the complete set of buggy lines. Then, as we focus on Java source-code naturalness, we exclude the issues whose fixes are not involving java files, e.g., configuration files. Finally, we map the resulting issues to their related buggy version, i.e., the project version preceding the fix commit.
IV-A2 Lines subject to study
For every considered issue, we retrieve the files changed by the patching commit, among which we mark as buggy any line changed by the fixed commit and define as neutral ones the remaining lines in these files.
Then to ensure that the observed ranking performances are related to code naturalness extraction and not to any non-uniform distribution of the buggy-lines over the code, we exclude all lines that are not part of the business-logic of the program like the imports, the fields declaration, the brackets, etc. We do so to focus on logic types of faults, which are unlikely to be caused by non-business-logic statements as also suggested by the work of Rahman et al. [25]. Moreover, the naturalness of these lines is unlikely to be insightful.
Additionally, this allows us to exclude any interference between comparing the ranking-performance by naturalness and other forms of rankings related to the buggy lines unequal distribution between business-logic and not business-logic related source-code portions. In fact, close to half of the considered bugs see all of their buggy lines located within the business-logic code, while only 10% of the bugs see all of their buggy-lines outside of it. Unaccounting for those 10%, we observe a median of 90% of buggy lines located within the business-logic code per bug, while this type of line only amounts to 60% of the lines overall.
To sum-up, by excluding these lines we exclude 257 bugs out of 2510 to end up with a final dataset counting 2253 buggy versions, represented by a set of business-logic buggy and not buggy lines.
IV-B Experimental Procedure
IV-B1 CodeBERT-based naturalness metrics
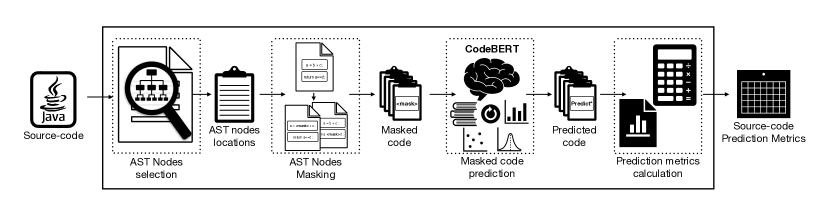
To infer the naturalness aspect of source-code from CodeBERT predictions we propose a 3-steps process that we name CodeBERT-nt. CodeBERT-nt operates in 3 steps as illustrated in the Figure 1:
For every selected buggy file, the tool starts by parsing the Abstract Syntax Tree (AST) and extracting the interesting nodes to mask, excluding the language-specific tokens such as control flow and import-related tokens, e.g., if, else, for, while, import, etc. Then, for every line, the tool iterates over the selected set of nodes and replaces each node’s content by the placeholder <mask>, thus, generating one masked version of the input code per selected node.
Next, every masked version is tokenized into a vector of tokens using the CodeBERT tokenizer, and shrink to only encompass the masked token and its surroundings, as the model encoder can only take up to 512 tokens. Once the shrinking is done, the sequences of masked codes are fed to CodeBERT to determine the best fitting substitute for the mask placeholder. By default, the model provides 5 propositions ranked by likelihood (also called confidence) to match the masked node original value. In our setting, we only consider the first proposition as we believe it to be the most naturalness-revealing one (we discuss this choice further in Section VI-C) and compute the following metrics from it:
-
•
CBnt_conf: the prediction confidence score of CodeBERT. This metric represents a probability, thus is a floating number varying between 0 and 1, where the closer to 1 its value is, the more CodeBERT is confident about the prediction. We believe that this metric may mirror directly the naturalness of code as it reflects how predictable and usual is the code, relatively to the code knowledge learned by the model through its training phase on a large scale code dataset. Thus, low confidence score may imply low naturalness.
-
•
CBnt_cos: the cosine similarity between the CodeBERT embeddings of the predicted and the original source-code. This metric has a float value varying between 0 and 1, where 1 implies an exact similarity between the two embeddings and 0 the absence of similarity. This metric is often used in NLP and has shown some interesting results in filtering unnatural sentences [26]. CodeBERT embedding is the encoded representation of the code in the latin-space, where every token is represented by 1 vector. To calculate the cosine similarity between the embeddings, we start by concatenating their token-vectors into two vectors, one for each embedding, then we compute the cosine as follows:
(2) where and are the concatenated embedding vectors of respectively the original and predicted code.
Our intuition is that, the less natural the code is, the more CodeBERT will have issues to notice small changes in it, i.e., a difference in a single node, and thus, the higher the cosine will be. Consequently, the high similarity between both embeddings – of the original and predicted code – may be a symptom of unnaturalness of the code.
-
•
CBnt_acc: the accuracy of prediction (whether the predicted code matches the original one or not). This is a boolean metric where 1 is attributed to a matching prediction and 0 otherwise. Intuitively, we believe that the more the code is natural, the more CodeBERT predictions are accurate.
Finally, each line is mapped with its prediction-scores forming a matrix where is the number of collected propositions in that source-code line.
The AST parsing and node-location extraction part has been implemented in Java and uses Spoon [27], a Java code-source analysis library. Whereas, the rest of the process has been implemented in python and uses the CodeBERT Masked Language Modeling (MLM) task to predict the masked codes.
IV-B2 n-gram ranking
To compare CodeBERT with n-gram models in terms of code naturalness aspect capturing, we proceed as follows:
For every considered issue, we train two n-gram models specific to that version of the project using two distinct tokenization techniques111We use UTFLineTokenizer and JavaLemmeLineTokenizer available in Tuna [28] GitHub repository under tokenizer/line/ (branch=master,repo=https://github.com/electricalwind/tuna, rev-id=44188e1) :
-
•
Java Paraser tokenizer (noted JP) which tokenizes the code according to the Java grammar, and thus, discarding empty lines as well as java-doc and code-comment lines.
-
•
UTF8 tokenizer (noted UTF8), which operates on the full raw representation of the source-code.
We name the created models based on their underlying tokenization technique, JP and UTF8 n-gram. In the training phase, we use all the lines from the files that have not been changed by the fix commit, then we use each of these models to attribute a cross-entropy score to the subject lines of the buggy files, counting buggy and neutral lines as detailed in Sub-section IV-A2. Finally, we rank the lines according to their cross-entropy score in a descendant order such-as high values of cross-entropy are associated with less code naturalness and higher likelihood of bugginess.
To run this experiment, we use the current version of the n-gram utilities library Tuna [28] with one of the recommended configurations by Jimenez et al. [10] for distinguishing buggy and fixed lines: 4 as n-order, 1 as unknown threshold and Kneser Ney smoothing (KN). Note that we use KN instead of the Modified Kneser Ney smoothing (MKN) because it is not suited for short sequences.
IV-C Lines ranking
To assess the relevance of the information inferred from the CodeBERT predictions, we rely on its ability to rank the buggy lines before the supposed neutral ones. As we do not have any labelling of ”natural” and ”unnatural” source-code dataset and based on the naturalness hypothesis which assumes that ”not natural lines are more likely to be buggy”, we believe that the prediction variation of CodeBERT under naturalness variation of the input source-code can be observed through its ranking of buggy and not buggy lines.
For every considered approach, metric and aggregation method considered in our experiments, we rank all the lines by bug first, then normalise the ranks by the total number of studied lines for that bug. We report two ranking results per bug per approach:
-
•
the first hit: corresponds to the rank of the first-ranked buggy line.
-
•
mean: corresponds to the mean ranks of all buggy lines.
To cut ties when multiple lines share the same score, we attribute the estimated rank by a uniform random selection. For instance, if we have 100 lines sharing the same rank, among which 3 lines are buggy, the random first hit rank will be equal to 25, while the mean rank of the 3 buggy lines will be 50.
To check whether any of the 3 aforementioned metrics are impacted by the naturalness variance of the source-code (answer to RQ1), we generate one CodeBERT prediction only by masked token. Then we aggregate the scores of each line’ predictions by applying one of the following aggregation metrics: minimum, maximum, mean, median and entropy. Where the entropy is calculated as the following:
| (3) |
where denotes the set of scores attributed to the line for the metric .
We then rank the subject lines by each of the metrics using the different aggregation methods and following both sorting directions: ascending and descending. As most of the results are close to each other, we calculate the paired Vargha and Delaney ratios, to conclude which combinations are the best in terms of buggy lines ranking.
To check whether the extracted naturalness information from CodeBERT predictions (answer RQ2), we compare the ranking results of the 3 metrics using their best performing aggregation method and sorting order, with the rankings results of random and complexity-based rankings. Where, the complexity of a line corresponds to its number of Java Parser tokens. This is inspired from the study of Leszak et al. [29], where complex source code has been proven to be more likely to be buggy. For the random ranking, instead of rerunning the ranking multiple times, we simply used a basic probability calculation of the rankings.
Finally, to compare the effectiveness of CodeBERT-nt with similar techniques in capturing code naturalness we compare its buggy-line rankings with the n-gram cross-entropy, measured as described in Sub-section IV-B2 (answer to RQ3). For this comparison, we consider the CodeBERT-nt rankings effectuated by its best performing metric, selected from the previous research questions.
To have a better understanding on the differences significance we run statistical tests of Wilkixon and Vargha and Delaney on all of our comparison results.
IV-D Threats to Validity
The question of whether our findings generalise, forms a typical threat to validity of empirical studies. To reduce this threat, we used real-world projects, real faults and their associated commits, from an established and independently built benchmark. Still, we have to acknowledge that these may not be representative of projects from other programming languages, domains or industrial systems.
Other threats may also arise from the assumption that all changed lines by the fix commits are buggy lines. While our heuristics are the standard in the literature, we believe that this selection process is sufficient given that we have used a dataset where the fix commits have been manually untangled. Additionally, we focus our study on the sole business logic lines, thus reducing further the risk of considering as buggy, lines irrelevant to the bug at hand.
Finally, our evaluation metrics may induce some additional threats. Our comparison basis measurement, i.e., comparing the ranking of source-code lines that has been trained on the same source-code’s project with approaches that are agnostic and has been trained on multiple projects. It is hard to compare the advantage gained by training CodeBERT on a large number of projects, including eventually the projects in our dataset, against the advantage gained by the n-gram models when trained on a specific project source-code and predicting the naturalness of lines of that same project.
V Results
V-A RQ1: Metrics and aggregation methods
| Metric | conf min | conf max | conf mean | conf median | conf entropy | cos min | cos max | cos mean | cos median | cos entropy | acc min | acc max | acc mean | acc median |
|---|---|---|---|---|---|---|---|---|---|---|---|---|---|---|
| 1st hit | 0.6196 | 0.4993 | 0.5528 | 0.5542 | 0.4387 | 0.5084 | 0.4763 | 0.5016 | 0.4989 | 0.4980 | 0.5004 | 0.4996 | 0.5118 | 0.4996 |
| Mean | 0.6325 | 0.5009 | 0.5613 | 0.5530 | 0.4350 | 0.5138 | 0.4818 | 0.5027 | 0.5058 | 0.4980 | 0.5004 | 0.4996 | 0.5122 | 0.4996 |
To evaluate the CodeBERT-nt metrics, we ranked the subject lines according to the aforementioned metrics. We start by calculating one score per line for every metric, by aggregating the scores of the predictions in that line. Then, we sort the lines according to their score in both orders - ascendant and descendant - and calculate the paired (by bug) Vargha and Delaney difference between both orders effectiveness in terms of attributing the lowest ranks to the buggy lines; more precisely the average ranking of the buggy lines and the smallest rank attributed to a buggy line, per bug. (Please refer to section IV for details)
These results are depicted in Table I where values around 0,5 depict that the considered pair of metric-aggregation method does not bring any advantage in ranking buggy lines first, while values above 0,5 confirm an advantage for the ascendant sorting order and below 0,5 an advantage for the descendant one.
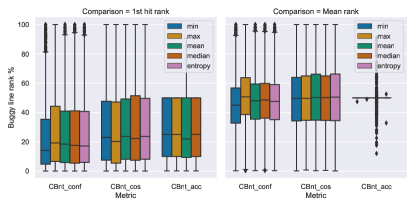
Figure 2 depicts the box-plots of the normalised rankings by number of lines of each bug. Interestingly, the prediction confidence score seems to be a good indicator of naturalness and thus of bugginess likelihood. Noticeably, low confidence scores are more often attributed to buggy lines than neutral ones. This explains why aggregating this metric by using the maximum value by line gives the worst guidance to our target, while sorting by the minimum score gives the best ranking over all considered pairs metric-aggregation.
At the same time, we do not observe any relevant differences when ranking the lines by either the cosine of the embedding or the correctness of predictions. This is also confirmed by the Table I where most of the values are around 0,5 when using each of the aggregation methods on these two metrics. Nevertheless, we notice that the best method to rank the buggy lines by cosine similarity is via ranking the lines by their highest scores of similarity, where the high (max) values are considered as symptoms of unnaturalness. We also notice a trend that confirms the correlation between naturalness and code predictability, such as the lower the mean of correct predictions in a code is, the less natural is the code.
By checking Table I we also see that the difference of ranking the lines by low confidence, from the other metric-aggregation methods is significant, Vargha and Delaney effect size values are more than 0.6, which are significantly higher to the rest of confidence aggregation rankings. Less noticeable, the ranking by increase of the line’s maximum embeddings cosine-simalirity and mean prediction accuracy yield respectively values of around 0,52 and 0,51 when compared to the other studied aggregation methods when applied on the same metrics.
V-B RQ2: Comparison with random and complexity based rankings
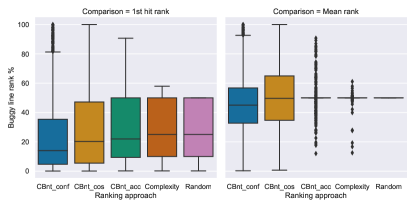
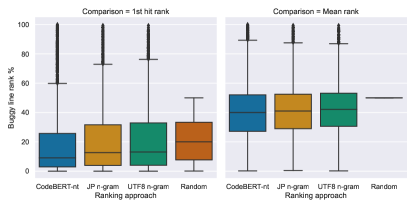
Figure 3 shows the distribution of the normalised rankings of the first ranked buggy line and the average rank of buggy lines by bug when using CodeBERT-nt metric-aggregation pairs selected from the results of RQ1 (ascendant minimum CBnt_conf, descendent maximum CBnt_cos and ascendant mean CBnt_acc), uniform random ranking and token-number-complexity descendant ranking.
Surprisingly, random and complexity lead to similar rankings with a small advantage for random. This observation implies that tokens-number-complexity does not capture well the code naturalness in the studied setup: naturalness on the line-level-granularity of the business-logic code.
As can be seen from the boxplots, CodeBERT-nt outperforms the baseline techniques in ranking the buggy lines first, using any of its three metrics. In fact, except for a small portion of our dataset bugs, CodeBERT-nt low-confidence performs the best in estimating the bugginess of the target lines, with respectively a 1st hit and mean buggy-line ranks lower in average by around 6% and 4.7% than the following ranks – attributed by the cosine similarity – and around 11% and 5% lower than the least performing ranking effectuated by uniform random. This noticeable difference between the CodeBERT-nt results with the two considered techniques, more specifically the low confidence CBnt_conf ranking, endorses the fact that CodeBERT-nt can be considered as a comparison baseline and a new method for naturalness based tasks.
Although, the two remaining CodeBERT-nt metrics, average accuracy CBnt_acc and high embeddings similarity CBnt_cos, outperform both baselines and yield lower rankings than uniform random by respectively 3% and 5% in ranking the first hit buggy line, they perform however similarly to the baselines when comparing their mean ranking of all the buggy lines, with a small advantage of only 0,4% for the ranking by embeddings similarity.
| CBnt_conf Vs | CBnt_cos | CBnt_acc | Complexity | Random |
|---|---|---|---|---|
| 1st hit | 0.578 | 0.609 | 0.605 | 0.607 |
| mean | 0.565 | 0.619 | 0.620 | 0.622 |
To validate this finding, we perform a statistical test (Wilcoxon paired test) on the data of Figure 3 to check for significant differences. Our results showed that the differences are significant, indicating the low probability of this effect to be happening by chance. As illustrated in Table II, the size of the difference is also big, with CodeBERT-nt low-confidence yielding Vargha and Delaney values between 0.58 and 0.6 indicating that CBnt_conf ranks the buggy lines the best in the great majority of the cases. However, the CodeBERT-nt accuracy and embeddings-similarity metrics outperform random respectively, in only 51% and 48% of the cases.
V-C RQ3: Comparison with n-gram
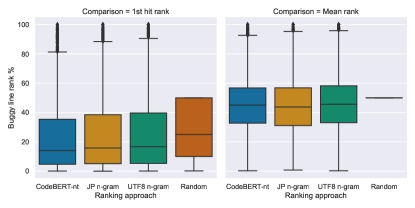
To answer this question, we train two n-gram models per buggy version of our dataset that we then use to compute the cross-entropies of the subject lines corresponding to the corresponding bug, then we rank these lines according to the resulting values and reproduce the same analysis as in RQ2. We illustrate in Figure 4 the distribution of the normalised rankings of the first ranked buggy line and the average rank of buggy lines by bug when using CodeBERT-nt low confidences ranking – CBnt_conf –, the descendant cross-entropy ranking from a UTF8-tokenizer-based n-gram model and a JavaParser-tokenizer-based one. Additionally, we illustrate the random ranking in the boxplots as the simplest baseline for this task.
As expected, the three approaches outperform the uniform-random-ranking in most of the cases and yield very comparable results with a small advantage to CodeBERT-nt on ranking the first buggy line over the n-gram techniques and a small advantage to JP n-gram in regards of the average rank of buggy lines. In both comparisons, UTF8 n-gram falls slightly behind these two latter techniques.
| Approaches | Random | UTF8 | JP | |||
|---|---|---|---|---|---|---|
| 1st hit | mean | 1st hit | mean | 1st hit | mean | |
| CBnt_conf | 0.606 | 0.621 | 0.536 | 0.502 | 0.518 | 0.468 |
| JP | 0.575 | 0.630 | 0.559 | 0.588 | ||
| UTF8 | 0.560 | 0.602 | ||||
To validate this finding, we performed a similar statistical test as in RQ2 on the data of Figure 4 and found that the differences with random are significant, while the differences between n-gram cross-entropy and CodeBERT-nt low-confidence rankings are negligible. As illustrated in Table III, the size of the differences are equal to 0.518 and 0.468 between CodeBERT-nt and JP n-gram models and 0.536 and 0.502 for both reported rankings, meaning that both approaches yield comparable results, which confirms that CodeBERT-nt can carry out code naturalness related applications with similar effectiveness as the statistical language n-gram models.
VI Discussion
VI-A Impact of interesting lines selection
Our empirical results show evidence that CodeBERT-nt can infer source-code naturalness yielding the same results as n-gram models and outperforming the uniform-random and code-complexity based techniques in attributing higher ranks to buggy lines when sorting source-code by naturalness. These experiments have been driven on the same buggy versions source-code whose lines count at least one buggy line. Precisely, we have excluded all the lines outside the business-logic source-code and kept only the bugs that counted at least one buggy line within their remaining lines.
To better understand the impact of this line selection step, we reintroduce all the bugs with their full source-code in our dataset and reproduce the same study as in RQ3. We have then attributed the worst rank to all unranked lines by CodeBERT-nt, i.e., outside of the business-logic. This implies that for CodeBERT-nt, the business-logic lines are ranked first by their min-confidence and the remaining lines are ranked after with a random uniform selection logic. The n-gram approaches ranking is applied as described previously, the same way on all lines – business- and non-business-logic related ones – having each two cross-entropy values from every corresponding n-gram model. The ranking distributions are illustrated in Figure 5.
Although the results of the three approaches remain comparable, the trend is that for a noticeable portion of studied bugs, CodeBERT-nt remains able to rank buggy lines better than the n-gram models. The difference is wider and more visible between the ranks of the first buggy line which can be seen in the left boxplot of Figure 5. Interestingly, we observe that ranking the business-logic lines with CodeBERT-nt and the remaining lines with a uniform random ranking outperforms ranking all the lines (business- and not business-logic related ones) by their n-gram calculated cross-entropies. These results lead to the conclusion that the naturalness analysis of the non-business-logic lines do not contribute with useful information to the considered ranking tasks, but instead alters its results when attributing a higher rank to the targeted lines.
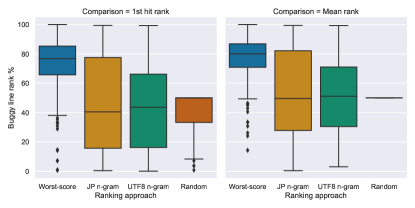
To check whether this observed decrease of performance for n-gram is indeed caused by the additional lines or because they performed worst on the previously excluded bugs from our dataset, we reproduce the same comparison on the subset of our dataset where all bugs are located outside of the business-logic code, implying that CodeBERT-nt will attribute the worst score to every buggy line. We illustrate the rankings distribution of the ”worst-score” strategy (ranking all buggy-lines last), JP and UTF8 n-gram models and uniform-random in Figure 6.
Although small, the n-gram models kept some advantage over random ranking as in the Figures 4 and 5, in contrast to CodeBERT-nt’s ”worst-score” results.The contrasting results between the Figures 6 and 5 highlight the negative impact of ranking the not business-logic lines by naturalness as they compensated CodeBERT-nt’s disadvantage of attributing the worst ranks to buggy lines, in 10% of the studied cases. Consequently, these results reinforce our conclusion that including the non-business-logic lines in the analysis adds noise to the search-space [25], and consequently hinders the ranking accuracy.
VI-B Which metric to use for which bug?
.
The empirical results driven on our large set of buggy versions highlight the effectiveness of CodeBERT-nt in capturing the naturalness of source-code, especially via its low-confidence metric. However, from the outliers in the Figures 2, 3, 4 and 5, we notice that CodeBERT-nt does not perform equally on all considered bugs. Which means for instance that it outperforms uniform-random ranking in the majority of the cases, but yields worst rankings for a small portion of the dataset. Therefore, we turn our attention towards investigating the possibility of better handling those bugs, leveraging one of the other CodeBERT-nt metrics.
We start by mapping every metric with the bugs on which it attributed the best mean ranking to the buggy lines. In figure 7, we illustrate a Venn diagram of this distribution, including uniform-random-ranking as baseline. As shown in our results, the CodeBERT-nt confidence is the best naturalness indicator for the majority of bugs, followed by the cosine similarity and the prediction accuracy. We also notice that except for a minority of 20 bugs, at least one of the CodeBERT-nt metrics achieves better scores or similar to random-uniform ranking. Additionally, except the large intersection set of bugs that are best-ranked by the prediction accuracy and uniform-random-ranking, the metrics rarely achieve their best rankings of the buggy lines for the same bugs. This observation introduces the hypothesis that the metrics are complementary and eventually, one could rely on different metrics for different bugs.
Aiming at distinguishing between our dataset bugs, we measure the metrics standard deviation (SD) per studied lines. In this setup, we exclude from our clusters the bugs that are intersecting with random and plot the SD distributions of the remaining ones, in Figure 8(b). The plots illustrate that the bugs from different clusters share similar ranges of SD with mean values around 0.27, 0.09 and 0.31 for respectively CBnt_conf, CBnt_cos and CBnt_acc. Also in the majority of the cases, the SD of the bugs best treated by other metrics than CBnt_conf fall in the same range of this latter, thus, cannot be distinguished from each other. However, we notice that for some SD values, CBnt_cos ranks better more bugs than CBnt_conf. This difference is noticeable for roughly: values between 0.2 and 0.24 or above 0.35, values above 0.14 and values below 0.05 or between 0.19 and 0.28 or between 0.395 and 0.42. These SD ranges represent a small fraction of our dataset, exactly 357 bugs, among which 193 where CBnt_cos performed the best and 200 where it outperformed CBnt_conf, which correspond respectively to 15.8%, 8.5% and 8.8% of the studied bugs. Nevertheless, these results may motivate future investigation on the use of CBnt_cos over CBnt_conf in similar cases, on different setups.
VI-C Impact of generating more predictions per token?
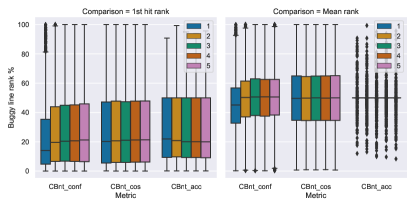
To have a better understanding on whether generating more predictions from the model could improve the bugginess information retrieved by CodeBERT-nt, we extend our experiment of RQ1 by comparing the ranking results using the best proven pairs of metric-aggregation from our results, when generating 1, 2, 3, 4 and 5 predictions per token. We illustrate in Figure 9 the box-plots of the normalised rankings by number of lines of each bug. Although comparable, the results depict a clear dissipation of the bugginess indicators retrieved from the prediction confidence and the cosine similarity metric, when we aggregate the values of more than one prediction by token. In the other hand, we can see that the ranking performance effectuated by the prediction accuracy raises when we consider 2 and 3 predictions then converges to a stable value. Besides the fact that this increase confirms further the correlation between code-naturalness and predictability, it remains negligible and keeps this metric-ranking far below the low-confidence one. Therefore, we believe that it would be more cost-efficient and appealing for similar studies, to generate only 1 – eventually up to 3 – predictions instead of 5, as the default setting of CodeBERT.
VII Conclusion
Naturalness of code forms an important attribute often needed by researchers when building automated code analysis techniques. However, computing the naturalness of code using n-gram requires significant amount of work and a salable infrastructure that is not often available. An alternative solution is to use other readily available language models, perhaps more powerful than n-grams, such as transformer-based generative models (CodeBERT-like). Unfortunately, these models do not offer any token-based appearance estimations since they aim at generating tokens rather than computing their likelihood. To this end, we investigate the use of predictability metrics, of code tokens using the CodeBERT model and check their appropriateness in bug detection. Our results show that computing the confidence of the model when masking and generating a token, irrespective of whether the predicted token is the one that was actually predicted by the model, offers the best results, which are comparable (slightly better) to that of n-gram models trained on the code of the same project (intra-project predictions).
References
- [1] A. Hindle, E. T. Barr, Z. Su, M. Gabel, and P. Devanbu, “On the naturalness of software,” in Proceedings of the 34th International Conference on Software Engineering, ser. ICSE ’12. IEEE Press, 2012, p. 837–847.
- [2] M. Allamanis and C. Sutton, “Mining source code repositories at massive scale using language modeling,” in 2013 10th working conference on mining software repositories (MSR). IEEE, 2013, pp. 207–216.
- [3] C. E. Shannon, “Prediction and entropy of printed english,” The Bell System Technical Journal, vol. 30, no. 1, pp. 50–64, 1951.
- [4] ——, “A mathematical theory of communication,” The Bell System Technical Journal, vol. 27, no. 3, pp. 379–423, 1948.
- [5] T. Sharma, V. Efstathiou, P. Louridas, and D. Spinellis, “Code smell detection by deep direct-learning and transfer-learning,” Journal of Systems and Software, vol. 176, p. 110936, 2021. [Online]. Available: https://www.sciencedirect.com/science/article/pii/S0164121221000339
- [6] B. Lin, C. Nagy, G. Bavota, and M. Lanza, “On the impact of refactoring operations on code naturalness,” in 2019 IEEE 26th International Conference on Software Analysis, Evolution and Reengineering (SANER), 2019, pp. 594–598.
- [7] D. Posnett, A. Hindle, and P. Devanbu, “Reflections on: A simpler model of software readability,” SIGSOFT Softw. Eng. Notes, vol. 46, no. 3, p. 30–32, jul 2021. [Online]. Available: https://doi.org/10.1145/3468744.3468754
- [8] V. J. Hellendoorn, P. T. Devanbu, and A. Bacchelli, “Will they like this? evaluating code contributions with language models,” in 2015 IEEE/ACM 12th Working Conference on Mining Software Repositories, 2015, pp. 157–167.
- [9] S. Wang, D. Chollak, D. Movshovitz-Attias, and L. Tan, “Bugram: Bug detection with n-gram language models,” in Proceedings of the 31st IEEE/ACM International Conference on Automated Software Engineering, ser. ASE 2016. New York, NY, USA: Association for Computing Machinery, 2016, p. 708–719. [Online]. Available: https://doi.org/10.1145/2970276.2970341
- [10] M. Jimenez, C. Maxime, Y. Le Traon, and M. Papadakis, “On the impact of tokenizer and parameters on n-gram based code analysis,” in 2018 IEEE International Conference on Software Maintenance and Evolution (ICSME). IEEE, 2018, pp. 437–448.
- [11] B. Ray, V. Hellendoorn, S. Godhane, Z. Tu, A. Bacchelli, and P. Devanbu, “On the ”naturalness” of buggy code,” in 2016 IEEE/ACM 38th International Conference on Software Engineering (ICSE), 2016, pp. 428–439.
- [12] T. Copeland, PMD applied. Centennial Books San Francisco, 2005, vol. 10.
- [13] D. Hovemeyer and W. Pugh, “Finding more null pointer bugs, but not too many,” in Proceedings of the 7th ACM SIGPLAN-SIGSOFT workshop on Program analysis for software tools and engineering, 2007, pp. 9–14.
- [14] S. H. Alexander Trautsch, Fabian Trautsch, “The smartshark repository mining data,” 2021.
- [15] T. T. Chekam, M. Papadakis, T. F. Bissyandé, Y. L. Traon, and K. Sen, “Selecting fault revealing mutants,” Empir. Softw. Eng., vol. 25, no. 1, pp. 434–487, 2020. [Online]. Available: https://doi.org/10.1007/s10664-019-09778-7
- [16] “Javaparser,” Available on https://github.com/javaparser/javaparser, https://javaparser.org/.
- [17] S. F. Chen and J. Goodman, “An empirical study of smoothing techniques for language modeling,” Computer Speech & Language, vol. 13, no. 4, pp. 359–394, 1999. [Online]. Available: https://www.sciencedirect.com/science/article/pii/S0885230899901286
- [18] R. Kneser and H. Ney, “Improved backing-off for m-gram language modeling,” in 1995 International Conference on Acoustics, Speech, and Signal Processing, vol. 1, 1995, pp. 181–184 vol.1.
- [19] Z. Feng, D. Guo, D. Tang, N. Duan, X. Feng, M. Gong, L. Shou, B. Qin, T. Liu, D. Jiang, and M. Zhou, “Codebert: A pre-trained model for programming and natural languages,” in Proceedings of the 2020 Conference on Empirical Methods in Natural Language Processing: Findings, EMNLP 2020, Online Event, 16-20 November 2020, ser. Findings of ACL, T. Cohn, Y. He, and Y. Liu, Eds., vol. EMNLP 2020. Association for Computational Linguistics, 2020, pp. 1536–1547. [Online]. Available: https://doi.org/10.18653/v1/2020.findings-emnlp.139
- [20] A. Vaswani, N. Shazeer, N. Parmar, J. Uszkoreit, L. Jones, A. N. Gomez, Ł. Kaiser, and I. Polosukhin, “Attention is all you need,” Advances in neural information processing systems, vol. 30, 2017.
- [21] J. Devlin, M.-W. Chang, K. Lee, and K. Toutanova, “Bert: Pre-training of deep bidirectional transformers for language understanding,” arXiv preprint arXiv:1810.04805, 2018.
- [22] “Codebert,” https://github.com/microsoft/CodeBERT.
- [23] M. K. Thota, F. H. Shajin, and P. Rajesh, “Survey on software defect prediction techniques,” International Journal of Applied Science and Engineering, vol. 17, pp. 331–344, December 2020.
- [24] M. Allamanis, E. T. Barr, P. T. Devanbu, and C. Sutton, “A survey of machine learning for big code and naturalness,” CoRR, vol. abs/1709.06182, 2017. [Online]. Available: http://arxiv.org/abs/1709.06182
- [25] M. Rahman, D. Palani, and P. C. Rigby, “Natural software revisited,” in 2019 IEEE/ACM 41st International Conference on Software Engineering (ICSE), 2019, pp. 37–48.
- [26] Z. Sun, J. M. Zhang, Y. Xiong, M. Harman, M. Papadakis, and L. Zhang, “Improving machine translation systems via isotopic replacement,” in 2022 IEEE/ACM 44th International Conference on Software Engineering (ICSE), 2022, pp. 1181–1192.
- [27] R. Pawlak, M. Monperrus, N. Petitprez, C. Noguera, and L. Seinturier, “Spoon: A Library for Implementing Analyses and Transformations of Java Source Code,” Software: Practice and Experience, vol. 46, pp. 1155–1179, 2015. [Online]. Available: https://hal.archives-ouvertes.fr/hal-01078532/document
- [28] M. Jimenez, C. Maxime, Y. Le Traon, and M. Papadakis, “Tuna: Tuning naturalness-based analysis,” in 2018 IEEE International Conference on Software Maintenance and Evolution (ICSME), 2018, pp. 715–715.
- [29] M. Leszak, D. E. Perry, and D. Stoll, “Classification and evaluation of defects in a project retrospective,” Journal of Systems and Software, vol. 61, no. 3, pp. 173–187, 2002. [Online]. Available: https://www.sciencedirect.com/science/article/pii/S0164121201001467