Reconciling spectroscopy with dynamics in global potential energy surfaces: the case of the astrophysically relevant SiC2
Abstract
SiC2 is a fascinating molecule due to its unusual bonding and astrophysical importance. In this work, we report the first global potential energy surface (PES) for ground-state SiC2 using the combined-hyperbolic-inverse-power-representation (CHIPR) method and accurate ab initio energies. The calibration grid data is obtained via a general dual-level protocol developed afresh herein that entails both coupled-cluster and multireference configuration interaction energies jointly extrapolated to the complete basis set limit. Such an approach is specially devised to recover much of the spectroscopy from the PES, while still permitting a proper fragmentation of the system to allow for reaction dynamics studies. Besides describing accurately the valence strongly-bound region that includes both the cyclic global minimum and isomerization barriers, the final analytic PES form is shown to properly reproduce dissociation energies, diatomic potentials, and long-range interactions at all asymptotic channels, in addition to naturally reflect the correct permutational symmetry of the potential. Bound vibrational state calculations have been carried out, unveiling an excellent match of the available experimental data on -. To further exploit the global nature of the PES, exploratory quasi-classical trajectory calculations for the endothermic reaction are also performed, yielding thermalized rate coefficients for temperatures up to . The results hint for the prominence of this reaction in the innermost layers of the circumstellar envelopes around carbon-rich stars, thence conceivably playing therein a key contribution to the gas-phase formation of SiC, and eventually, solid SiC dust.
I Introduction
Silicon dicarbide, SiC2, has enjoyed a great deal of attention for its applications in astrochemistry Thaddeus, Cummins, and Linke (1984); Nyman et al. (1993); Gensheimer and Snyder (1997); Sarre, Hurst, and Lloyd Evans (2000); Morgan, Hatzidimitriou, and Cannon (2004); Cernicharo et al. (2010); Kokkin et al. (2011); Müller et al. (2012); Gobrecht et al. (2017); Massalkhi et al. (2018); Cernicharo et al. (2018); McCarthy, Gottlieb, and Cernicharo (2019); Agúndez et al. (2020); Sharma and Sharma (2020):
-
(i).
Its most stable cyclic isomer, -, was the first molecular ring identified in the interstellar medium Thaddeus, Cummins, and Linke (1984).
-
(ii).
Its Merrill-Sanford band system (– electronic transition) near 5000 Å was first observed in the optical absorption spectra of evolved stars, and continues to be a particularly valuable astronomical probe of stellar atmospheres Sarre, Hurst, and Lloyd Evans (2000); Morgan, Hatzidimitriou, and Cannon (2004).
-
(iii).
Besides rovibronic transitions, the pure rotational signatures of both main (28Si12C2) and singly-substituted isotopologues (29SiC2, 30SiC2, and 28Si13CC) of - have been identified in several astrophysical sources Thaddeus, Cummins, and Linke (1984); Nyman et al. (1993); Cernicharo et al. (2010); Kokkin et al. (2011); Müller et al. (2012); Massalkhi et al. (2018); Cernicharo et al. (2018) and serve as sensitive molecular diagnostic tools for probing the chemical and physical conditions of the regions in which they reside Thaddeus, Cummins, and Linke (1984); Cernicharo et al. (2010).
-
(iv).
Together with SiC and Si2C parent molecules, - is ranked among the most likely gas-phase precursors leading to the formation of SiC dust grains in the inner envelopes of late-type carbon-rich stars Gobrecht et al. (2017); Massalkhi et al. (2018); McCarthy, Gottlieb, and Cernicharo (2019); Agúndez et al. (2020).
Apart from its intrinsic interest in an astronomical context, SiC2 is also a fascinating molecule from a chemical viewpoint owing to its unique structure and dynamics Ross et al. (1994); Nielsen et al. (1997). Previous laboratory Michalopoulos et al. (1984); Butenhoff and Rohlfing (1991); Ross et al. (1994) and quantum mechanical studies Nielsen et al. (1997); Kenny, Allen, and Schaefer (2003); Fortenberry, Lee, and Müller (2015); Koput (2016) jointly provided ample evidence that its lowest energy minimum (as definitively assigned by Michalopoulos et al. Michalopoulos et al. (1984)) has an exceedingly flat potential energy surface (PES) along the internal rotation of the C2 moiety within the molecule Michalopoulos et al. (1984); Butenhoff and Rohlfing (1991); Ross et al. (1994); Nielsen et al. (1997); Kenny, Allen, and Schaefer (2003); Fortenberry, Lee, and Müller (2015); Koput (2016). Such an untypical, nondirectional Si–C2 bonding in - (with reportedly high ionic character) has been classified Nielsen et al. (1997); Oddershede et al. (1985) as polytopic Clementi, Kistenmacher, and Popkie (1973) in nature, and hence characterized by the nearly-free circumnavigation of Si about C2 Clementi, Kistenmacher, and Popkie (1973). Indeed, the expectedly low energy difference between - and the linear (-) saddle-point structure was first confirmed experimentally by Ross et al. Ross et al. (1994) as being only . Clearly, like in C3 Rocha and Varandas (2015, 2018), the expected high vibrational state populations and their delocalization over large regions of the PES make -SiC2’s intramolecular motion lying at the borderlines of spectroscopy and chemical dynamics.
The conclusions drawn from these early experimental works by Michalopoulos et al. Michalopoulos et al. (1984) and Ross et al. Ross et al. (1994) motivated a plethora of detailed spectroscopic studies on - aiming to further characterize its spectral signatures in both microwave Gottlieb, Vrtilek, and Thaddeus (1989); Kokkin et al. (2011); Müller et al. (2012); Cernicharo et al. (2018); McCarthy, Gottlieb, and Cernicharo (2019), infrared Shepherd and Graham (1985); Presilla-Márquez, Graham, and Shepherd (1990); Izuha, Yamamoto, and Saito (1994) and optical Butenhoff and Rohlfing (1991); Zhang et al. (2020) regions; for a comprehensive review, see Ref. 30 and references therein.
From the theoretical perspective, several concurring investigations were also ignited towards unraveling the SiC2’s unusual polytopic bonding nature and its large-amplitude dynamics Green (1983); Oddershede et al. (1985); Arulmozhiraja and Kolandaivel (1995); Nielsen et al. (1997); Zhang et al. (1998); Kenny, Allen, and Schaefer (2003); Fortenberry, Lee, and Müller (2015); Koput (2016); for a complete account of the earlier theoretical literature the reader is addressed to Refs. 16 and 21. In the most recent studies by Fortenberry et al. Fortenberry, Lee, and Müller (2015) and Koput Koput (2016), special emphasis were put into the characterization of the -’s local PES using state-of-the-art ab initio composite methods. By relying on the so-called CcCR protocol Fortenberry, Lee, and Müller (2015), Fortenberry et al. reported a near-equilibrium quartic force field (QFF) for silicon dicarbide; the QFF was based on CCSD(T) energies extrapolated to the complete basis set (CBS) limit, augmented by additive corrections due to core-electron correlation and relativistic effects Fortenberry, Lee, and Müller (2015). Using standard vibrational perturbational theory (VPT2), the CcCR QFF has shown to reproduce the -’s stretching fundamentals ( and ) to within of experiment Butenhoff and Rohlfing (1991), whereas larger deviations of up to have been found for the (C2 hindered rotation) mode Fortenberry, Lee, and Müller (2015). As noted by Nielsen et al. Nielsen et al. (1997) and Koput Koput (2016), this is not surprising given the inherent deficiencies of VPT2 in properly describing such highly-anharmonic, large-amplitude pinwheel dynamics of -. In the most sophisticated theoretical study to date by Jacek Koput Koput (2016), a more extended PES (hereinafter referred to as JK PES) was reported that describes locally not only - but also the - saddle-point, in addition to the minimum energy path connecting them; the calibration data set included ab initio CCSD(T)-F12b/cc-pCVQZ-F12 energies additively corrected for higher-order valence-electron correlation beyond CCSD(T) and scalar relativistic effects Koput (2016). Its barrier to linearity was predicted to be which is lower than the previous high-level ab initio estimates by Nielsen et al. Nielsen et al. (1997) (), and Kenny et al. Kenny, Allen, and Schaefer (2003) (), but closer to the experimental value Ross et al. (1994) of . Based on a variational approach, Koput Koput (2016) also performed bound-state calculations on his final potential; the results have shown that the JK PES is capable of reproducing the -’s experimental vibrational term values reported by Ross et al. Ross et al. (1994) with a root-mean-square deviation (rmsd) of .
Clearly, all the above distinctive features of make it a challenging testing ground for any theoretical methodological development. Moreover, the expected implications its unique spectroscopy and reaction dynamics might have in molecular astrophysics, render this molecule a tempting target for further studies. As noted above, previous theoretical studies were mainly concerned with the determination of locally valid spectroscopic potentials for - Nielsen et al. (1997); Fortenberry, Lee, and Müller (2015); Koput (2016) and there is not as yet a global PES for the title system that is capable of accurately describing both its valence and dissociation features at once. In this work, we delve deeper into the silicon dicarbide saga Nielsen et al. (1997) and provide for the first time such a form for ground-state . To allow for both bound-state and reaction dynamics calculations, the PES will be based on an accurate ab initio protocol that incorporates the best of two worlds: coupled-cluster [CCSD(T)] and multireference configuration interaction [MRCI(Q)] energies jointly extrapolated to the CBS limit. For the analytical modeling, we employ the Combined-Hyperbolic-Inverse-Power-Representation (CHIPR) method Varandas (2013a, b); Rocha and Varandas (2020, 2021) as implemented in the CHIPR-4.0 program Rocha and Varandas (2021). The quality of the final potential is further judged via both spectroscopic and exploratory reaction dynamics calculations.
II Methodology
II.1 Ab initio calculations
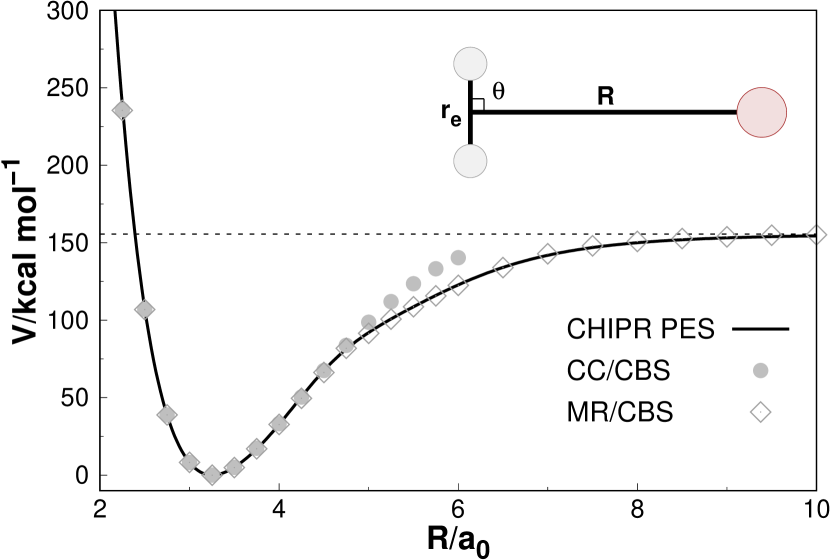
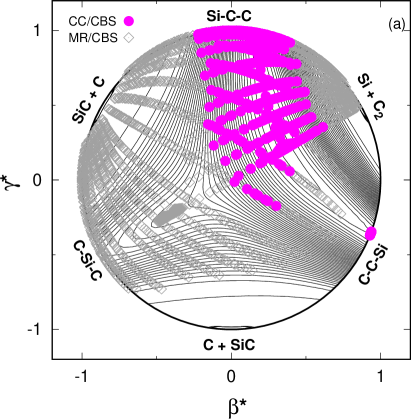
All electronic structure calculations have been done with MOLPRO (Werner et al., 2010). To ensure an accurate description of both valence and long-range features of the PES, the full set of ab initio grid points were herein generated using a combination Galvão and Varandas (2009) of CCSD(T) Knowles, Hampel, and Werner (1993); Piecuch, Wloch, and Varandas (2007); Bartlett and Musiał (2007) (CC for brevity) and MRCI(Q) Szalay et al. (2012) (MR) levels of theory. The first is specially devised to improve the spectroscopy of the global minimum and is limited [due to the well-known Galvão and Varandas (2009); Szalay et al. (2012) erratic behaviour of such single-reference method for stretched bond distances (Figure 1)] to a small region of the PES near the -/- stationary points. The MR set is in turn responsible to cover the bulk of the PES Szalay et al. (2012), being restricted to sample the fragmentation region and geometries with high and diagnostics Lee and Taylor (1989); Janssen and Nielsen (1998) [e.g., those characterized by larger bond distances, away from the equilibrium region; see Figure 3(a) later]. Both data sets were subsequently extrapolated to the CBS limit Varandas (2018, 2020) (see below). The AVZ () basis sets of Dunning and co-workers Dunning (1989); Kendall, Dunning, and Harrison (1992) including additional tight- functions () for the Si atom Werner et al. (2010) were employed throughout.
At each selected geometry , the CC/CBS energy was defined as Rocha and Varandas (2019a)
| (1) |
where and are the extrapolated HF and CC correlation (cor) components. In Eq. (1), is obtained via a two-point extrapolation protocol Pansini, Neto, and Varandas (2016)
| (2) |
where are hierarchical numbers Varandas and Pansini (2014); Pansini, Neto, and Varandas (2015) that parallel the traditional cardinal ones, , and and are parameters to be calibrated from the raw RHF/AVZ () energies Pansini, Neto, and Varandas (2016). In turn, is obtained using the inverse-power formula Varandas and Pansini (2014)
| (3) |
where are CC-type numbers Varandas and Pansini (2014), with and calibrated from the raw CC/AVZ () cor energies.
Similarly to Eq. (1), the CBS extrapolations of MR energies were performed individually for the non-dynamical (CAS) and dynamical (dc) correlations Rocha and Varandas (2019b)
| (4) |
where is obtained using Eq. (2) but with CASSCF(12,12)/AVZ () raw energies Pansini, Neto, and Varandas (2016) and is given by the two-point law Varandas (2007)
| (5) |
here, and are universal-type parameters Varandas (2007), and and are obtained from the raw MRCI(Q)/AVZ () dc energies. The full-valence CASSCF active space includes the 3s- and 3p-like orbitals of Si and the 2s- and 2p-like orbitals of the C atoms. Note that, in the CC calculations, core correlation was not taken into account as this would imply, for reasons of consistency between both data sets, the consideration of such effects also at MR level, making the task of obtaining the global PES computationally unaffordable with current available resources. Thus, in all CC and MR calculations, only the valence electrons were correlated, with the 2s- and 2p-like orbitals of Si being included into the core.
Using the above dual-level CC/MR CBS protocol, a total of 3682 symmetry unique points (1144 and 2538 at CC/CBS and MR/CBS levels, respectively) have been selected to map all relevant regions of the ground-state PES of SiC2 using atom–diatom Jacobi coordinates Murrell et al. (1984) (, , and in Figure 1); the ranges are , , and for the Si–C2 channel and , , and for C–SiC interactions. Recall that, in partitioning the nuclear configuration space, the CC/CBS data set was chosen to cover only a limited region around the global minimum (including -), while the MR/CC method was utilized elsewhere. Note that the corresponding C2 and SiC curves were obtained solely at the MR/CBS level by making atom-diatom calculations with the Si and C atoms far apart, varying the diatomic internuclear distance only; the total number of computed points for each curve amounts to and covers the coordinate range of . The reader is addressed to Figure 3(a) and Figures S1 and S2 of the Supplementary Material (SM) to assess the full set of ab initio grid points.
Finally, it should be noted that, while the use of larger basis sets would be desirable in estimating the CBS limits in Eqs. (1)-(5), preliminary test calculations have shown that the associated computational cost to obtain the full global PES would be nearly three times as high if the cardinal numbers in the above extrapolation formulas were increased by one unit. Because our proposed MR/CBS() and CC/CBS() protocols have already shown excellent performances when assessed against benchmark CBS energies Varandas (2020, 2018); Pansini, Neto, and Varandas (2016); Varandas and Pansini (2014); Pansini, Neto, and Varandas (2015); Varandas (2007), we deeemed that there was no reason to extend the one-particle bases further.
II.2 Calibration of CHIPR PES
| max. dev.c | rmsd | d | ||
|---|---|---|---|---|
| 1.5 | 0.2 | 156 | ||
| 3.0 | 0.3 | 179 | ||
| 3.5 | 0.5 | 249 | ||
| 5.0 | 0.8 | 453 | ||
| 5.1 | 0.9 | 588 | ||
| 5.1 | 0.9 | 658 | ||
| 5.1 | 0.9 | 680 |
-
a
The units of energy are . Energy strata defined with respect to the absolute minimum of SiC2: at CCSD(T)/CBS level. Its relative energy (as predicted from the PES with respect to the infinitely separated C+C+Si atoms) is .
-
b
Number of calculated points up to indicated energy range.
-
c
Maximum deviation up to indicated energy range.
-
d
Number of calculated points with an energy deviation larger than the rmsd.

Within the CHIPR Varandas (2013a, b); Rocha and Varandas (2020, 2021) formalism, the global adiabatic PES of ground-state assumes the following many-body expansion form Murrell et al. (1984)
| (6) |
where the ’s represent the diatomic (two-body) potentials of and and is the three-body term; is the set of interatomic separations, with the energy zero set to the infinitely separated atoms. As Eq. (II.2) indicates, our analytic CHIPR PES dissociates adiabatically into and , thence modeling only the lowest electronic singlet state of correlating to such open shell fragments; this is warranted by including in Eq. (II.2) the proper diatomic two-body terms and ensuring that naturally vanishes for large interatomic separations Rocha and Varandas (2020, 2021). Note that, similarly to Rocha and Varandas (2015, 2018), the ground-state singlet PES of does not dissociate adiabatically into ground-state fragments which, according to spin-correlation rules Herzberg (1966), correlate with the triplet manifold of states; see Figure S3 for further details. Note further that the spin-allowed channel lies Kramida (2018); Huber and Herzberg (1979) above the asymptote and correlates with excited singlet PESs Rocha and Varandas (2015, 2018).
In Eq. (II.2), the CHIPR diatomic curves are expressed by the general form Rocha and Varandas (2021)
| (7) |
where and denote the nuclear charges of atoms A and B and the ’s are expansion coefficients; the coordinate is herein defined as a linear combination of -dependent basis functions Rocha and Varandas (2021) (see Eq. (9) below). In turn, in Eq. (II.2) is represented via CHIPR’s three-body model which for AB2-type species assumes the simplified form Rocha and Varandas (2021); Varandas (2013c, b)
| (8) |
In the above equation, are expansion coefficients of a -degree polynomial, and the ’s are (transformed) coordinates. These latter are expressed in terms of distributed-origin constracted basis sets Rocha and Varandas (2021)
| (9) |
where
| (10) |
and
| (11) |
are primitive bases with origin at and the ’s are non-linear parameters. All steps involved in the calibration of Eqs. (7)-(11) using ab initio data points are fully described in Refs. 36 and 37, with the reader being addressed to them for further details. Note that, to obtain the global analytic form of the PES [Eq. (II.2)], we herein employ the newly-developed CHIPR-4.0 program Rocha and Varandas (2021). With this code, the final CHIPR diatomic potentials of and [Eq. (7)] were calibrated using MR/CBS points with rmsds of and , respectively. For completeness, they are plotted in Figure S1. As for the three-body term, all 3682 ab initio dual-level CC/MR CBS points could be least-squares fitted to Eq. (8) with chemical accuracy (). The weights () so employed were: for calculated points with energies above the global minimum, for those within the interval , and for geometries with above -. Our fit involves a total of 180 linear coefficients in the polynomial expansion [ in Eq. (8)]; see Tables S1-S4 of the SM to access the numerical coefficients of all parameters resulting from the fit. Figure S2 also portrays some representative cuts of the final analytic CHIPR potential [Eq. (II.2)] alongside the corresponding ab initio ones. Table 1 displays the stratified rmsd, while Figure 2 shows the distribution of errors of the fitted data set. Accordingly, we note that of the data is herein fitted with accuracy. Moreover, Figure 2 indicates that most of the calculated grid points (95% of the total population) are primarily distributed within the range above -, thence approximately spanning the energy interval of up to its complete atomization Deutsch and Curtiss (1994); Oyedepo, Peterson, and Wilson (2011) (if we consider the atom+diatom geometries utilized to calibrate the diatomic curves). The high-energy points, particularly those within (see Table 1 and Figure 2), are characterized by short CC and/or SiC bond distances which, despite carrying lower weights in the least-squares fitting procedure (see above), are shown to be important to properly model the repulsive walls of the global potential, preventing the three-body term [ in Eq. (II.2)] from attaining large negative values at these regions.
In relation to our combined CC/MR protocol, we should mention that, despite being extrapolated to the CBS limit, the two ab initio theories unavoidably diverge, specially at long distances; a prototypical case is illustrated in Figure 1. This latter is clearly due to single-reference CC which is not expected to properly describe dissociation Szalay et al. (2012). These CC points, whenever present, were eliminated from the fit, warranting a smooth transition between the two data sets and the lowest rmsd; see Figures 1 and S2. In the valence region, correlation energy differences between CC and MR also exist (even at CBS limit) but are less evident (Figure 1), showing the smallest deviations near the global minimum; for example, at -, the CC/CBS and MR/CBS total energies differ by , a value that compares quite well with the corresponding estimate of calculated using CCSD(T)-F12b/VQZ-F12 and MRCI(Q)-F12/VQZ-F12 energies. These inherent discrepancies in CC and MR correlation energies are expected to increase when going up in energy, likely attaining larger values at long-range distances (Figure 1). Note, however, that, because the low-energy part of our potential is primarily sampled by CC/CBS points [Figure 3(a)], we expect that the existence of such a CC/MR seam (lying higher in energy) influences little the final spectroscopic properties of the PES to be discussed next.
III Features of PES
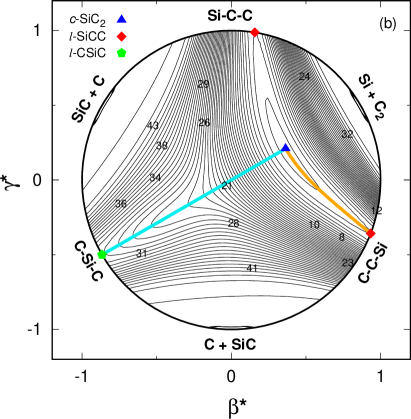
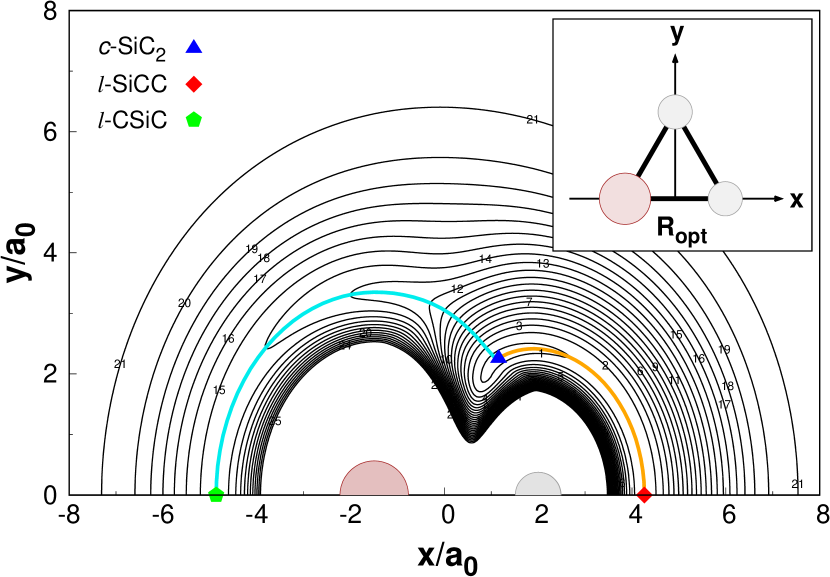
All major features of the final CHIPR PES are depicted in Figures 3-8. The properties of its stationary points are collected in Table 2 wherein the most accurate results from the literature Fortenberry, Lee, and Müller (2015); Koput (2016); Thaddeus, Cummins, and Linke (1984); Michalopoulos et al. (1984); Butenhoff and Rohlfing (1991); Ross et al. (1994) as well as our own ab initio CC and MR values are also included for comparison. Note that, to allow for a complete visualization of all topographical attributes of our global CHIPR analytic potential, Figure 3 shows a relaxed-triangular contour plot in scaled hyperspherical coordinates (Varandas, 1987), = and =, where
| (12) |
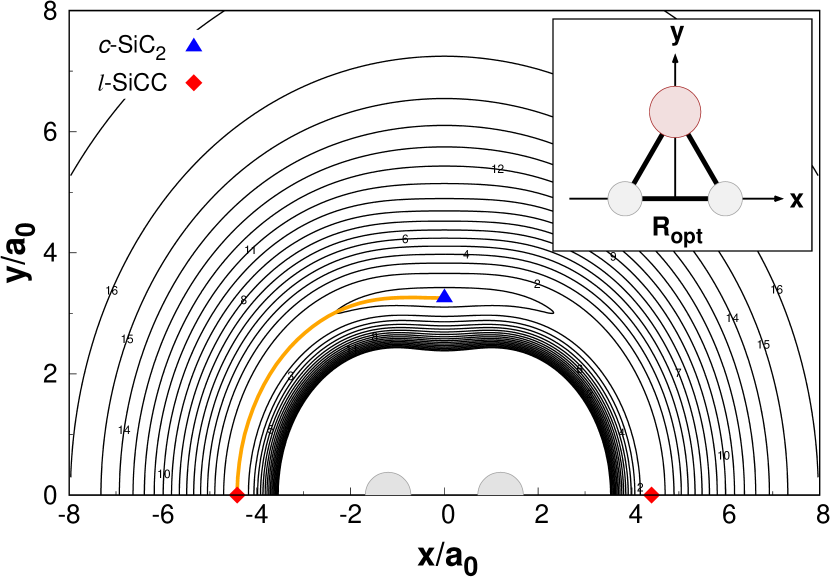
and , , and are interatomic distances. Thus, by relaxing the “size” of the molecule such as to give the lowest energy for a given “shape“ ( and ) of the triangle formed by the three atoms, the contour plot shown in Figure 3 is then obtained; see legend therein and Refs. 39 and 24 for further details. The corresponding version of this plot is shown later in Figure 8. In turn, Figures 4 and 5 illustrate the PES for the Si and C atoms moving around relaxed C2 and SiC fragments, respectively. They also summarize in a comprehensive manner all predicted stationary structures from the analytic CHIPR PES to be discussed next.
III.1 Valence region & spectroscopic calculations
| Structure | Methoda | a | ||||||
|---|---|---|---|---|---|---|---|---|
|
|
CC/AVZ | |||||||
| MR/AVZ | ||||||||
| CC/CBSb | ||||||||
| MR/CBSb | ||||||||
| CcCR QFFc | ||||||||
| JK PESd | ||||||||
| CHIPR PES | ||||||||
| exp. | ||||||||
|
|
CC/AVZ | |||||||
| MR/AVZ | ||||||||
| CC/CBSb | ||||||||
| MR/CBSb | ||||||||
| JK PESd | ||||||||
| CHIPR PES | ||||||||
| exp. | ||||||||
|
|
CC/AVZ | |||||||
| MR/AVZ | ||||||||
| CC/CBSb | ||||||||
| MR/CBSb | ||||||||
| CHIPR PES |
-
a
This work unless stated otherwise.
-
b
CC/CBS and MR/CBS single-point energies calculated at CHIPR PES stationary points.
-
c
Quartic force field of Ref. 20.
-
d
Jacek Koput (JK) local PES of Ref. 21.
- e
-
f
Experimental harmonic frequencies taken from Ref. 18.
-
g
Experimental fundamental frequencies taken from Ref. 15.
-
g
Potential energy barrier determined by Ross et al. Ross et al. (1994) from experimental data.
| Calc | ||||||
| 0 | 0 | 0 | ||||
| 0 | 0 | 2 | ||||
| 0 | 0 | 4 | ||||
| 0 | 0 | 6 | ||||
| 0 | 1 | 0 | ||||
| 0 | 0 | 8 | ||||
| 0 | 0 | 10 | ||||
| 0 | 1 | 2 | ||||
| 0 | 0 | 12 | ||||
| 0 | 0 | 14 | ||||
| 0 | 1 | 4 | ||||
| 0 | 0 | 16 | ||||
| 0 | 2 | 0 | ||||
| 1 | 0 | 0 | ||||
| 1 | 0 | 2 | ||||
| 1 | 0 | 4 | ||||
| 0 | 3 | 0 | ||||
| 1 | 0 | 6 | ||||
| 1 | 1 | 0 | ||||
| 1 | 0 | 8 | ||||
| 1 | 0 | 10 | ||||
| 0 | 4 | 0 | ||||
| 1 | 2 | 0 | ||||
| 2 | 0 | 0 | ||||
| 2 | 1 | 0 | ||||
| 2 | 2 | 0 | ||||
| 3 | 0 | 0 | ||||
| 0 | 0 | 1 | ||||
| 0 | 0 | 3 | ||||
| 0 | 0 | 5 | ||||
| 0 | 1 | 1 | ||||
| 0 | 0 | 7 | ||||
| 0 | 0 | 9 | ||||
| 0 | 1 | 3 | ||||
| 0 | 0 | 11 | ||||
| 0 | 0 | 13 | ||||
| 0 | 1 | 5 | ||||
| 0 | 0 | 15 | ||||
| 0 | 1 | 7 | ||||
| 1 | 0 | 1 | ||||
| 0 | 2 | 1 | ||||
| 1 | 0 | 3 | ||||
| 1 | 0 | 5 | ||||
| 1 | 0 | 7 | ||||
| rmsdd | ||||||
According to Figures 3-8, the predicted global mininum on the ground-state singlet PES corresponds to a cyclic geometry, -. As Table 2 shows, its characteristic bond lengths and angle are and . These values are in excellent agreement with the most reliable theoretical estimates due to Fortenberry et al. Fortenberry, Lee, and Müller (2015) and Koput Koput (2016), differing by less than /. Recall that these authors include, in addition to CBS energies, contributions from core-core/core-valence electron correlation and scalar relativistic effects in their local PESs; Koput Koput (2016) further accounts for higher-order -particle electron correlation beyond CCSD(T). Close agreement is also found between the CHIPR’s - data and experimental attributes taken from the literature Thaddeus, Cummins, and Linke (1984); Michalopoulos et al. (1984); Butenhoff and Rohlfing (1991); Ross et al. (1994); see Table 2. Indeed, our predicted () and () stretching fundamentals reproduce exceedingly well () the corresponding experimental values Ross et al. (1994) and are quite consistent with those calculated from the JK PES (Table 2). Yet, larger discrepancies (of up to ) are found for the large-amplitude fundamental associated with the internal rotation of the C2 moiety. As noted elsewhere Nielsen et al. (1997); Koput (2016), the proper description of the expectedly highly anharmonic potential along this mode [Figures 4 and 6(a)] requires an iterative treatment of the connected triples () and quadruples () correlation contributions in the coupled-cluster expansion; this however would make the task of calculating the global PES of computationally unfeasible, even if limited to a smaller section of PES near - [Figure 3(a)]. Indeed, the corresponding value reported by Koput Koput (2016) differs by less than from its experimental estimate. Despite the expected lower performance of CHIPR relative to JK in predicting , we note that our variationally-computed fundamentals for - still appear to be slightly more accurate than those reported using the CcCR QFF/VPT2 protocol Fortenberry, Lee, and Müller (2015), even without considering here relativistic and core-valence correlation effects; see Table 2.
To further assess the accuracy of the final CHIPR PES, we have carried out anharmonic vibrational calculations for higher excited modes using the DVR3D software suite (Tennyson et al., 2004) and compared the results with the experimental term energies reported by Ross et al. Ross et al. (1994). All calculated data are gathered in Table 3. Also shown for comparison are the corresponding values reported from the JK local PES Koput (2016). Note that the vibrational band origins cover energies up to about () above the ground-state zero point level (bottom of the well) of - and excitations of up to as high as 16 quanta in ; the approximate quantum numbers and refer to the and stretching vibrations, while corresponds to the antisymmetric stretching of the triangular geometry. The results presented in Table 3 show that our CHIPR PES reproduces remarkably well the vibrational spectrum of - with a rmsd of (as expected, the largest deviations are ascribed to overtones and combination bands involving ). This is quite astounding given the global, purely ab initio nature of the PES and is clearly an asset of the present dual-level CC/MR protocol Galvão and Varandas (2009). It should be stressed that such a mixed protocol is herein devised to improve the spectroscopy of global potentials relative to global PESs calibrated solely using MR grid energies. Indeed, our experience shows (see, e.g., Refs. 66 and 25) that purely MR global forms, despite accurately describing the bulk of the PESs, do in general a relatively poor job at reproducing experimental vibrational band origins of triatomics, showing rmsds of or even greater. We reiterate that the lower performance of CHIPR when compared to the accurate JK local PES (see Table 3) is not surprising given the absence of higher-order effects in our CC calibration data, in addition to the fact that global analytic forms unavoidably entail larger fitting errors, even near the global minimum. In turn and differently from CHIPR, the JK potential cannot physically describe all dissociation channels and may show spurious features at regions of the PES characterized by large bond distances. Additionally, CHIPR describes by built-in the complete atomization of the system. Considering the -’s anharmonic zero point energy () and its stabilization energy relative to the C+C+Si atoms (), a total atomization energy of is predicted from our PES. This value is in excellent agreement with the best theoretical estimate of reported by Oyedepo et al. Oyedepo, Peterson, and Wilson (2011) using the MR-ccCA protocol Oyedepo, Peterson, and Wilson (2011) and the early G2 result by Deutsch et al. Deutsch and Curtiss (1994) (); the last known experimental value is Deutsch and Curtiss (1994) .
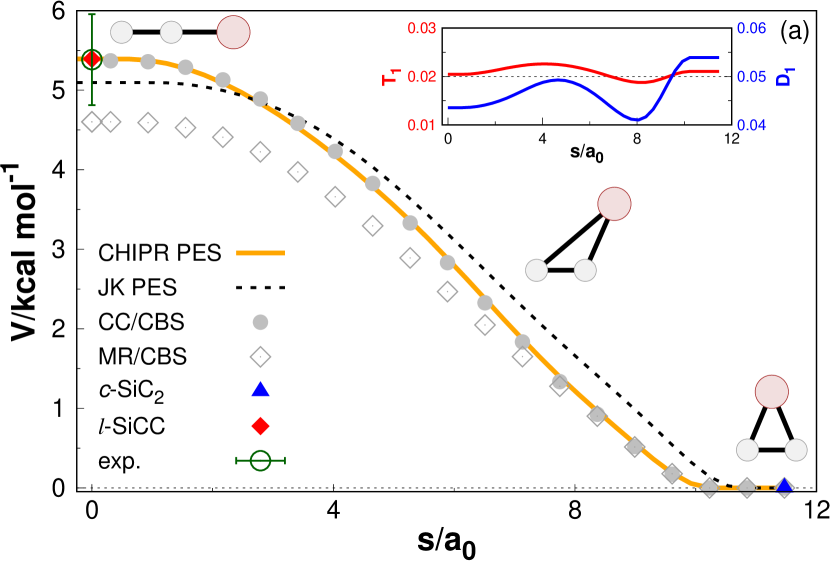
As Figures 3(b) and 4 portray, - is connected by two-symmetry equivalent linear () transition states, -, located at , and with an imaginary frequency of . The corresponding minimum energy path (MEP) calculated Zheng et al. (2017) from the PES is plotted in Figure 6(a) and clearly represents the large-amplitude nearly-free pinwheel motion of C2 around Si. Indeed, a close look at Figure 6(a) shows that the CHIPR form accurately reproduces the MEP at the CC/CBS level, with the corresponding MR/CBS path being actually lower in energy. Suffice it to say that such MR/CBS points are only shown therein for comparison – they were not included in the fit as this region is only sampled by CC/CBS points (section II.1). Our best theoretical estimate (taken from the analytic PES) places - at () above -, in excellent agreement with the reported value of () by Koput Koput (2016). Most notably, our predicted barrier to linearity is shown to match nearly perfectly the corresponding experimental estimate of Ross et al. (1994) (). These results provide compelling evidence that, at this level, CC appears to be more reliable in describing the -/- region, despite lying at the threshold of single-reference description with Lee and Taylor (1989); Janssen and Nielsen (1998) and ; see inset of Figure 6(a). The corresponding barrier predicted at MR/CC level is lower than the CC/CBS estimate (Table 2), being nearly coincident with the value of reported by Koput at MR-ACPF/cc-pV6Z level Koput (2016).
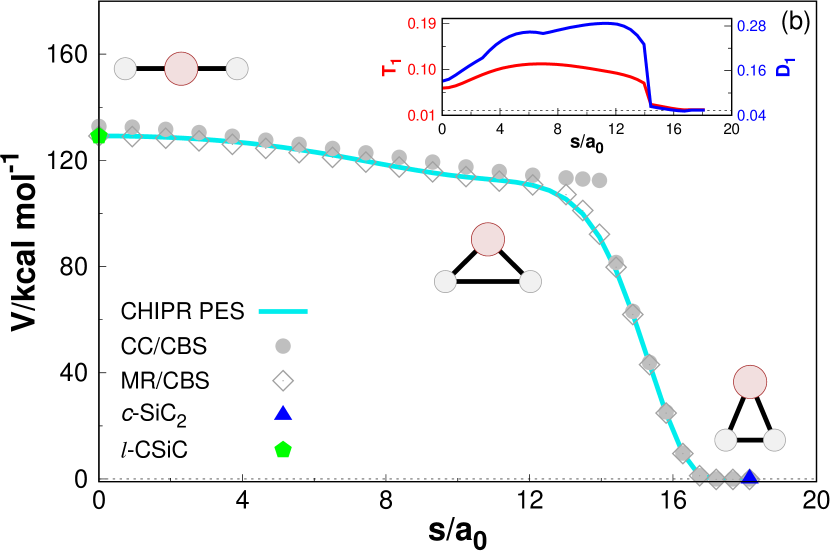
A notable aspect of the CHIPR PES, discussed previously in early studies Green (1983); Arulmozhiraja and Kolandaivel (1995); Zhang et al. (1998), is the existence of an auxiliary transition state, -. As Table 2 shows, this linear form has characteristic bond lengths of and an imaginary frequency of along the bending coordinate. Its connection to - is perhaps best seen from the contour plots in Figures 3(b) and 5; see the cyan solid lines represented therein. The associated isomerization pathway Zheng et al. (2017) in is presented in Figure 6(b), wherein the major topographical valence attributes of the CHIPR PES across geometries can be assessed. Accordingly, - is predicted from our final CHIPR form to lie above -. Differently from - which span a low energy region of the PES primarily sampled by CC/CBS points [Figures 3(a)], the description of - and vicinities can only be accurately done at MR/CBS level. In fact, as the inset of Figure 6(b) shows, at this region of the nuclear configuration space the predicted CC diagnostics [e.g., and halfway through the MEP] far exceed the accepted limiting values: Lee and Taylor (1989), Janssen and Nielsen (1998), thus clearly entailing a multi-reference approach. This is explained by the presence of several low-lying excited electronic states in this region, as Figure S3(a) illustrates. Indeed, Figure 6(b) evinces that the CHIPR form mimics excellently well the ab initio MR/CBS data, with the predicted barrier to linearity matching exactly the one calculated at this level (Table 2). We further note that, in Figure 6(b), the CC/CBS data shown are only plotted for comparison; they were not included in the calibration data set as this high-energy valence region of the PES (with ) is sampled solely by MR/CBS calculations.
III.2 Proof of concept: long-range region & reaction dynamics calculations
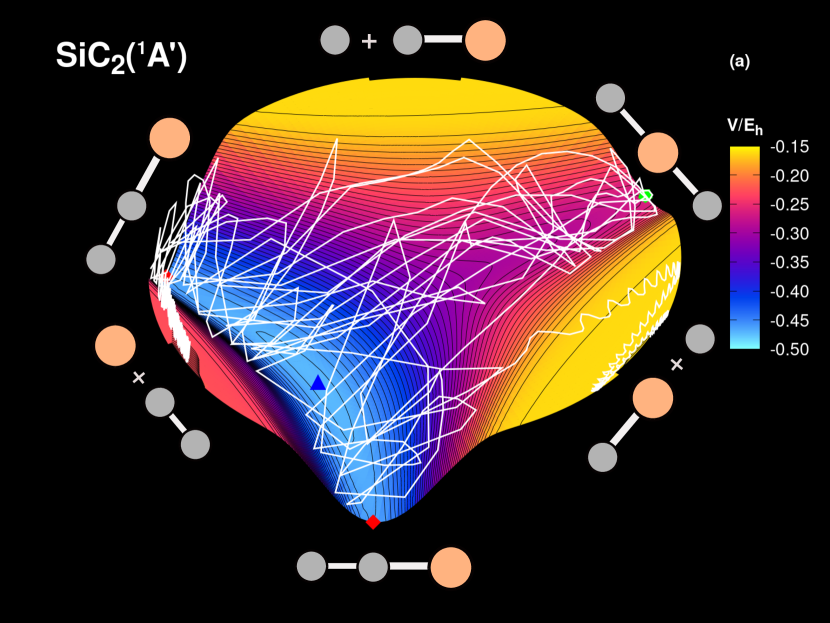
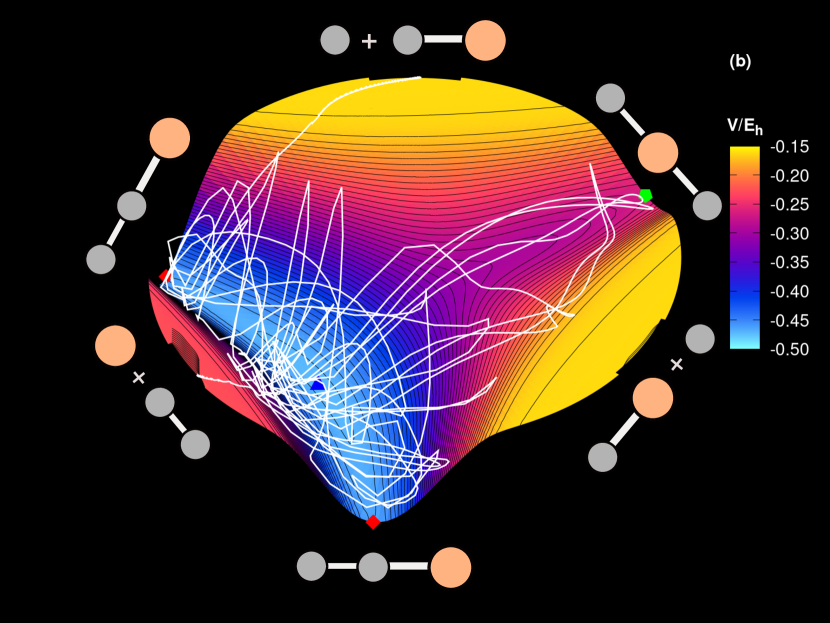
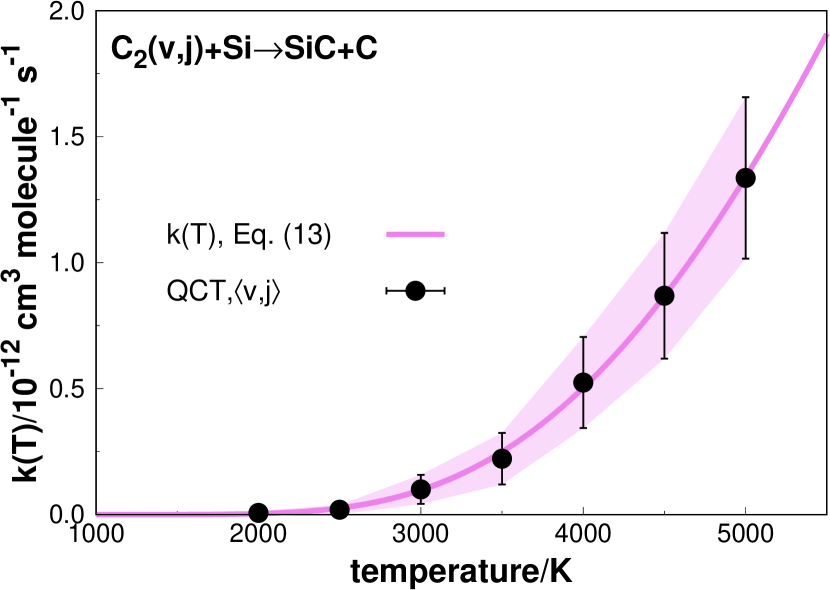
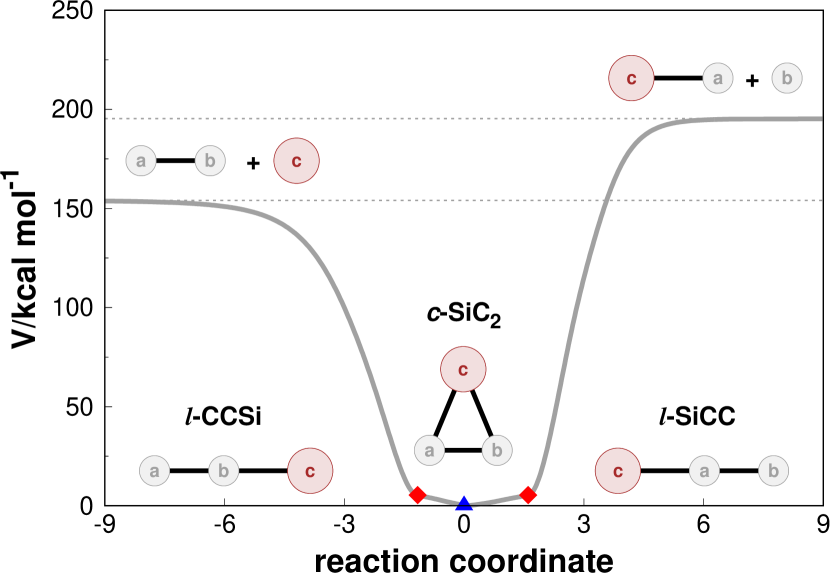
Apart from accurately modeling the valence (strongly-bound) chemical space, the contour plots shown in Figures 3-5 evidently pinpoint the reliability of the CHIPR form to describe long-range and dissociation features of the PES, in addition to naturally reflect its correct permutational symmetry. This is clearly an asset of the CHIPR Varandas (2013a, b); Rocha and Varandas (2020, 2021) formalism [namely, Eq. (8)] and is the major deliverable of the present work. Figure 7 shows the calculated MEP for the chemical conversion of C2+Si to SiC+C that proceeds via SiC2 intermediates. Accordingly, both forward and reverse collision processes evolve without activation barriers for collinear atom-diatom approaches, leading directly to the formation of -. This structure is subsequently converted to - by way of low-energy (nearly-free) C2 internal rotations [Figure 6(a)]; the stabilization energy of the - complex is predicted to be ca. and relative to the infinitely separated C2+Si and SiC+C fragments, respectively, this former being quite close to the value of reported by Nielsen et al. Nielsen et al. (1997) based on high-level focal point thermochemical analyses. Indeed, as Figure 7 shows, the reaction is highly endothermic (, including the zero-point energies of the reactants and products) which makes this process feasible only in high-temperature environments, e.g., in the inner envelopes surrounding (late-type) carbon-rich stars Massalkhi et al. (2018); McCarthy, Gottlieb, and Cernicharo (2019), thence conceivably playing therein a key role in the formation of gas-phase SiC, and consequently solid SiC dust. Initial assessments indicate that, in order to effectively initiate such a reaction, must be initially pumped Zanchet et al. (2013) to higher vibrational states (up to at least -11) or collide with a high-energy Si atom, with relative translational energies of the order of or higher; see, e.g., Figure 8. These conditions can be fulfilled within the inner layers of the circumstellar shells of evolved C-stars (e.g., IRC+10216) characterized by temperatures of 1000-3000 K or higher and where and other silicon-carbon species are known to be particularly conspicuous McCarthy, Gottlieb, and Cernicharo (2019). To further assess the reliability of such a reaction, we have run preliminary quasi-classical trajectory (QCT) calculations (Peslherbe, Wang, and Hase, 1999; Hase et al., 1996) on the CHIPR PES using a locally modified version of the VENUS96C code (Hase et al., 1996); for a thorough description of the methodology here utilized, see Ref. 71 and Table S5. At the high temperature regime considered (), the calculated thermal rate coefficients for can be accurately represented by the Arrhenius-Kooij formula (Laidler, 1984):
| (13) |
where , , and . This is plotted in Figure 9, together with the calculated QCT data which are numerically defined in Table S5. Accordingly, the theoretically-predicted rate constants for show a positive temperature dependence, increasing steeply from K. This provides compelling evidence for its relevance in the gas-phase synthesis of SiC and related solid SiC dust formation in the innermost envelopes of C-stars Cernicharo et al. (1989). Further investigations in this direction are in order and a detailed account of the overall dynamics and kinetics undoubtedly requires a careful assessment of the possible contributions of other excited-states PESs correlating to the same reactant/product channels; this is clearly beyond the scope of our present preliminary analysis and will be the focus of future studies. Also of relevance is the reverse (barrierless and exothermic) reaction (Figure 7) which, differently from , surely occurs at cold and ultracold temperatures, hence dominated by long-range forces; indeed, the expected high reactivity of with Mackay (1996) atomic C and O at low s may help explain the lack of detections in cold interstellar environments Herbst et al. (1989); Whittet, Duley, and Martin (1990); Chen et al. (2021).
IV Conclusions
We report the first global PES for ground-state based on CBS extrapolated ab initio energies and the CHIPR method for the analytical modeling. By relying on a mixed CCSD(T) and MRCI(Q) protocol, we ensure that the final potential recovers much of the spectroscopy of its cyclic global minimum, while still permitting an accurate description of isomerization and fragmentation processes, all with the correct permutational symmetry as naturally warranted by CHIPR. Bound-state calculations performed anew have shown that the present purely-ab initio CHIPR PES is capable of reproducing the experimental vibrational spectrum of cyclic with a rmsd of . Despite not outperforming the spectroscopic quality of the most accurate local PES to date Koput (2016), our proposed dual-level CCSD(T)/MRCI(Q) CBS protocol is expected to improve the spectroscopy of global ground-state PESs when compared with purely MRCI(Q)-based global forms. Further improvements can be so envisaged by either fine-tuning the theoretically-predicted potential parameters with input experimental information Varandas and Rodrigues (2002, 2006) or morphing the original global form with a spectroscopically-accurate local potential Rocha and Varandas (2018). Aside from anharmonic vibrational calculations, the global nature of our CHIPR PES is further exploited by performing preliminary quasi-classical trajectory calculations for the endothermic reaction. The calculated thermal rate coefficients within the temperature range of hint for its prominence in the gas-phase synthesis of SiC and, presumably, SiC dust formation in the inner envelopes surrounding carbon-rich stars Massalkhi et al. (2018); McCarthy, Gottlieb, and Cernicharo (2019).
Supplementary Material
See the supplementary material to assess the performance of the PES alongside ab initio grid data, the numerical coefficients of the final CHIPR analytic form as well as the calculated QCT reaction rate coefficients.
Acknowledgements.
This work has received funding from the European Union’s Horizon 2020 research and innovation program under the Marie Sklodowska-Curie grant agreement no 894321. CMRR thanks also the Academic Leiden Interdisciplinary Cluster Environment (ALICE) provided by Leiden University for the computational resources. AJCV thanks the support of China’s Shandong Province “Double-Hundred Talent Plan” (2018), Coordenação de Aperfeiçoamento de Pessoal de Nível Superior-Brasil (CAPES)-Finance Code 001, Conselho Nacional de Desenvolvimento Científico e Tecnológico (CNPq), and Foundation for Science and Technology, Portugal, in the framework of the project 55UIDB/00313/2020.Author Declarations
Conflict of Interest
The authors have no conflicts to disclose.
Data Availability Statement
The full set of ab initio grid points supporting the findings of this study is available from the corresponding author upon reasonable request. A Fortran subroutine of the final CHIPR PES that readily evaluates the potential and gradient at any arbitrary geometry is made available as supplementary material.
References
- Thaddeus, Cummins, and Linke (1984) P. Thaddeus, S. E. Cummins, and R. A. Linke, “Identification of the SiCC Radical Toward IRC+10216: The First Molecular Ring in an Astronomical Source,” ApJ 283, L45–L48 (1984).
- Nyman et al. (1993) L. A. Nyman, H. Olofsson, L. E. B. Johansson, R. S. Booth, U. Carlstrom, and R. Wolstencroft, “A Molecular Radio Line Survey of the Carbon Star IRAS 15194-5115,” A&A 269, 377–389 (1993).
- Gensheimer and Snyder (1997) P. D. Gensheimer and L. E. Snyder, “A Search for Vibrationally Excited SiC2 =1 toward IRC+10216,” ApJ 490, 819–822 (1997).
- Sarre, Hurst, and Lloyd Evans (2000) P. J. Sarre, M. E. Hurst, and T. Lloyd Evans, “SiC2 in Carbon Stars: Merrill-Sanford Absorption Bands Between 4100 and 5500Å,” MNRAS 319, 103–110 (2000).
- Morgan, Hatzidimitriou, and Cannon (2004) D. H. Morgan, D. Hatzidimitriou, and R. D. Cannon, “Merrill-Sanford Bands in Large Magellanic Cloud Carbon Stars,” MNRAS 355, 1196–1206 (2004).
- Cernicharo et al. (2010) J. Cernicharo, L. B. F. M. Waters, L. Decin, P. Encrenaz, A. G. G. M. Tielens, M. Agúndez, E. De Beck, H. S. P. Müller, J. R. Goicoechea, M. J. Barlow, A. Benz, N. Crimier, F. Daniel, A. M. Di Giorgio, M. Fich, T. Gaier, P. García-Lario, A. de Koter, T. Khouri, R. Liseau, R. Lombaert, N. Erickson, J. R. Pardo, J. C. Pearson, R. Shipman, C. Sánchez Contreras, and D. Teyssier, “A High-Resolution Line Survey of IRC+10216 with Herschel/HIFI- First Results: Detection of Warm Silicon Dicarbide (SiC2),” A&A 521, L8 (2010).
- Kokkin et al. (2011) D. L. Kokkin, S. Brünken, K. H. Young, N. A. Patel, C. A. Gottlieb, P. Thaddeus, and M. C. McCarthy, “The Rotational Spectra of 29SiC2 and 30SiC2,” ApJS 196, 17 (2011).
- Müller et al. (2012) H. S. P. Müller, J. Cernicharo, M. Agúndez, L. Decin, P. Encrenaz, J. Pearson, D. Teyssier, and L. Waters, “Spectroscopic Parameters for Silacyclopropynylidene, SiC2, from Extensive Astronomical Observations Toward CW Leo (IRC+10216) with the Herschel Satellite,” J. Mol. Spectrosc. 271, 50–55 (2012).
- Gobrecht et al. (2017) D. Gobrecht, S. Cristallo, L. Piersanti, and S. T. Bromley, “Nucleation of Small Silicon Carbide Dust Clusters in AGB Stars,” ApJ 840, 117 (2017).
- Massalkhi et al. (2018) S. Massalkhi, M. Agúndez, J. Cernicharo, L. Velilla Prieto, J. R. Goicoechea, G. Quintana-Lacaci, J. P. Fonfría, J. Alcolea, and V. Bujarrabal, “Abundance of SiC2 in Carbon Star Envelopes - Evidence that SiC2 is a Gas-Phase Precursor of SiC Dust,” A&A 611, A29 (2018).
- Cernicharo et al. (2018) J. Cernicharo, M. Guélin, M. Agúndez, J. R. Pardo, S. Massalkhi, J. P. Fonfría, L. Velilla Prieto, G. Quintana-Lacaci, N. Marcelino, C. Marka, S. Navarro, and C. Kramer, “IRC+10216 as a Spectroscopic Laboratory: Improved Rotational Constants for SiC2, Its Isotopologues, and Si2C,” A&A 618, A4 (2018).
- McCarthy, Gottlieb, and Cernicharo (2019) M. C. McCarthy, C. A. Gottlieb, and J. Cernicharo, “Building Blocks of Dust: A Coordinated Laboratory and Astronomical Study of the Archtype AGB Carbon Star IRC+10216,” J. Mol. Spectrosc. 356, 7–20 (2019).
- Agúndez et al. (2020) M. Agúndez, J. I. Martínez, P. L. de Andres, J. Cernicharo, and J. A. Martín-Gago, “Chemical Equilibrium in AGB Atmospheres: Successes, Failures, and Prospects for Small Molecules, Clusters, and Condensates,” A&A 637, A59 (2020).
- Sharma and Sharma (2020) M. K. Sharma and A. K. Sharma, “Investigation of Silicon Dicarbide (SiC2) in Circumstellar Envelopes Around Carbon-Rich AGB Stars,” Indian J. Phys. 94, 1869–1874 (2020).
- Ross et al. (1994) S. C. Ross, T. J. Butenhoff, E. A. Rohlfing, and C. M. Rohlfing, “SiC2: A Molecular Pinwheel,” J. Chem. Phys. 100, 4110–4126 (1994).
- Nielsen et al. (1997) I. M. B. Nielsen, W. D. Allen, A. G. Császár, and H. F. Schaefer, “Toward Resolution of the Silicon Dicarbide (SiC2) Saga: Ab Initio Excursions in the Web of Polytopism,” J. Chem. Phys. 107, 1195–1211 (1997).
- Michalopoulos et al. (1984) D. L. Michalopoulos, M. E. Geusic, P. R. R. Langridge-Smith, and R. E. Smalley, “Visible Spectroscopy of Jet-Cooled SiC2: Geometry and Electronic Structure,” J. Chem. Phys. 80, 3556–3560 (1984).
- Butenhoff and Rohlfing (1991) T. J. Butenhoff and E. A. Rohlfing, “Laser-Induced Fluorescence Spectroscopy of Jet-Cooled SiC2,” J. Chem. Phys. 95, 1–8 (1991).
- Kenny, Allen, and Schaefer (2003) J. P. Kenny, W. D. Allen, and H. F. Schaefer, “Complete Basis Set Limit Studies of Conventional and R12 Correlation Methods: The Silicon Dicarbide (SiC2) Barrier to Linearity,” J. Chem. Phys. 118, 7353–7365 (2003).
- Fortenberry, Lee, and Müller (2015) R. C. Fortenberry, T. J. Lee, and H. S. Müller, “Excited Vibrational Level Rotational Constants for SiC2: A Sensitive Molecular Diagnostic for Astrophysical Conditions,” Mol. Astrophys. 1, 13–19 (2015).
- Koput (2016) J. Koput, “Ab Initio Potential Energy Surface and Vibration-Rotation Energy Levels of Silicon Dicarbide, SiC2,” J. Comp. Chem. 37, 2395–2402 (2016).
- Oddershede et al. (1985) J. Oddershede, J. R. Sabin, G. H. F. Diercksen, and N. E. Grüner, “The Structure and Spectrum of SiC2,” J. Chem. Phys. 83, 1702–1708 (1985).
- Clementi, Kistenmacher, and Popkie (1973) E. Clementi, H. Kistenmacher, and H. Popkie, “Study of the Electronic Structure of Molecules. XVIII. Interaction Between a Lithium Atom and a Cyano Group as an Example of a Polytopic Bond,” J. Chem. Phys. 58, 2460–2466 (1973).
- Rocha and Varandas (2015) C. M. R. Rocha and A. J. C. Varandas, “Accurate Ab Initio-Based Double Many-Dody Expansion Potential Energy Surface for the Adiabatic Ground-State of the Radical Including Combined Jahn-Teller plus Pseudo-Jahn-Teller Interactions,” J. Chem. Phys. 143, 074302–074318 (2015).
- Rocha and Varandas (2018) C. M. R. Rocha and A. J. C. Varandas, “Energy-Switching Potential Energy Surface for Ground-State ,” Chem. Phys. Lett. 700, 36–43 (2018).
- Gottlieb, Vrtilek, and Thaddeus (1989) C. A. Gottlieb, J. M. Vrtilek, and P. Thaddeus, “Laboratory Measurement of the Rotational Spectrum of SiCC,” ApJL 343, L29 (1989).
- Shepherd and Graham (1985) R. A. Shepherd and W. R. M. Graham, “FTIR Matrix Isolation Study of Carbon-13 Substituted SiC2,” J. Chem. Phys. 82, 4788–4790 (1985).
- Presilla-Márquez, Graham, and Shepherd (1990) J. D. Presilla-Márquez, W. R. M. Graham, and R. A. Shepherd, “Fourier Transform Far Infrared Spectroscopy of the Vibration of SiC2 in Ar at 10 K,” J. Chem. Phys. 93, 5424–5428 (1990).
- Izuha, Yamamoto, and Saito (1994) M. Izuha, S. Yamamoto, and S. Saito, “Rotational Spectrum of SiC2 in the Excited State,” Spectrochim. Acta A Mol. Biomol. Spectrosc. 50, 1371–1378 (1994).
- Zhang et al. (2020) Q. Zhang, D.-P. Zhang, B.-X. Zhu, J.-W. Gu, C.-T. Yu, Z.-J. Xiao, Y. Chen, and D.-F. Zhao, “High-Resolution Spectroscopy of the 0, 2, 3 and 3 Bands in the – Transition of SiC2,” J. Mol. Spectrosc. 372, 111306 (2020).
- Green (1983) S. Green, “Theoretical Study of Silicon Dicarbide,” ApJ 266, 895–901 (1983).
- Arulmozhiraja and Kolandaivel (1995) S. Arulmozhiraja and P. Kolandaivel, “Four Energetically Low Lying States of SiC2,” J. Mol. Struct. THEOCHEM 334, 71–79 (1995).
- Zhang et al. (1998) Y. Zhang, C.-Y. Zhao, W.-H. Fang, and Z.-H. Lu, “High Accuracy Studies on the Ground State and Transition State of SiC2,” J. Mol. Struct. THEOCHEM 454, 31–40 (1998).
- Varandas (2013a) A. J. C. Varandas, “Combined-Hyperbolic-Inverse-Power-Representation of Potential Energy Surfaces: A Preliminary Assessment for H3 and HO2,” J. Chem. Phys. 138, 054120–054133 (2013a).
- Varandas (2013b) A. J. C. Varandas, “Putting Together the Pieces: A Global Description of Valence and Long-Range Forces via Combined Hyperbolic Inverse Power Representation of the Potential Energy Surface,” in Reaction Rate Constant Computations: Theories and Applications, edited by K. Han and T. Chu (The Royal Society of Chemistry, 2013) Chap. 17, pp. 408–445.
- Rocha and Varandas (2020) C. M. R. Rocha and A. J. C. Varandas, “A General Code for Fitting Global Potential Energy Surfaces via CHIPR Method: Triatomic Molecules,” Comput. Phys. Commun. 247, 106913 (2020).
- Rocha and Varandas (2021) C. M. R. Rocha and A. J. C. Varandas, “A General Code for Fitting Global Potential Energy Surfaces via CHIPR Method: Direct-Fit Diatomic and Tetratomic Molecules,” Comput. Phys. Commun. 258, 107556 (2021).
- Werner et al. (2010) H. J. Werner, P. J. Knowles, G. Knizia, F. R. Manby, M. Schütz, and et al., “MOLPRO, a package of ab initio programs, version 2010.1,” (2010), see: http://www.molpro.net, Cardiff, U.K., 2010.
- Galvão and Varandas (2009) B. R. L. Galvão and A. J. C. Varandas, “Accurate Double Many-Body Expansion Potential Energy Surface for N) from Correlation Scaled Ab Initio Energies with Extrapolation to the Complete Basis Set Limit,” J. Phys. Chem. A 113, 14424–14430 (2009).
- Knowles, Hampel, and Werner (1993) P. J. Knowles, C. Hampel, and H. Werner, “Coupled Cluster Theory for High Spin, Open Shell Reference Wave Functions,” J. Chem. Phys. 99, 5219–5227 (1993).
- Piecuch, Wloch, and Varandas (2007) P. Piecuch, M. Wloch, and A. J. C. Varandas, “Renormalized Coupled-Cluster Methods: Theoretical Foundations and Application to the Potential Function of Water,” in Topics in the Theory Of Chemical and Physical Systems, edited by S. Lahmar, J. Maruani, S. Wilson, and G. Delgado-Barrio (Springer Netherlands, Dordrecht, 2007) pp. 63–121.
- Bartlett and Musiał (2007) R. J. Bartlett and M. Musiał, “Coupled-Cluster Theory in Quantum Chemistry,” Rev. Mod. Phys. 79, 291–352 (2007).
- Szalay et al. (2012) P. G. Szalay, T. Müller, G. Gidofalvi, H. Lischka, and R. Shepard, “Multiconfiguration Self-Consistent Field and Multireference Configuration Interaction Methods and Applications,” Chem. Rev. 112, 108–181 (2012).
- Lee and Taylor (1989) T. J. Lee and P. R. Taylor, “A Diagnostic for Determining the Quality of Single-Reference Electron Correlation Methods,” Int. J. Quantum Chem. 36, 199–207 (1989).
- Janssen and Nielsen (1998) C. L. Janssen and I. Nielsen, “New Diagnostics for Coupled-Cluster and Møller-Plesset Perturbation Theory,” Chem. Phys. Lett. 290, 423–430 (1998).
- Varandas (2018) A. J. C. Varandas, “Straightening the Hierarchical Staircase for Basis Set Extrapolations: A Low-Cost Approach to High-Accuracy Computational Chemistry,” Annu. Rev. Chem. 69, 177–203 (2018).
- Varandas (2020) A. J. C. Varandas, “Extrapolation in quantum chemistry: Insights on energetics and reaction dynamics,” J. Theor. Comp. Chem. 19, 2030001 (2020).
- Dunning (1989) T. H. Dunning, “Gaussian Basis Sets for Use in Correlated Molecular Calculations. I. The Atoms Boron through Neon and Hydrogen,” J. Chem. Phys. 90, 1007–1023 (1989).
- Kendall, Dunning, and Harrison (1992) R. A. Kendall, T. H. Dunning, and R. J. Harrison, “Electron Affinities of the First-Row Atoms Revisited. Systematic Basis Sets and Wave Functions,” J. Chem. Phys. 96, 6796–6806 (1992).
- Rocha and Varandas (2019a) C. M. R. Rocha and A. J. C. Varandas, “A Global CHIPR Potential Energy Surface for Ground-State C3H and Exploratory Dynamics Studies of Reaction C2+CHC3+H,” Phys. Chem. Chem. Phys. 21, 24406–24418 (2019a).
- Pansini, Neto, and Varandas (2016) F. N. N. Pansini, A. C. Neto, and A. J. C. Varandas, “Extrapolation of Hartree-Fock and Multiconfiguration Self-Consistent-Field Energies to the Complete Basis Set Limit,” Theo. Chem. Acc. 135, 261–267 (2016).
- Varandas and Pansini (2014) A. J. C. Varandas and F. N. N. Pansini, “Narrowing the Error in Electron Correlation Calculations by Basis Set Re-hierarchization and Use of the Unified Singlet and Triplet Electron-Pair Extrapolation Scheme: Application to a Test Set of 106 Systems,” J. Chem. Phys. 141, 224113–224121 (2014).
- Pansini, Neto, and Varandas (2015) F. N. N. Pansini, A. C. Neto, and A. J. C. Varandas, “On the Performance of Various Hierarchized Bases in Extrapolating the Correlation Energy to the Complete Basis Set Limit,” Chem. Phys. Lett. 641, 90–96 (2015).
- Rocha and Varandas (2019b) C. M. R. Rocha and A. J. C. Varandas, “Accurate CHIPR Potential Energy Surface for the Lowest Triplet State of ,” J. Phys. Chem. A 123, 8154–8169 (2019b).
- Varandas (2007) A. J. C. Varandas, “Extrapolating to the One-Electron Basis-Set Limit in Electronic Structure Calculations,” J. Chem. Phys. 126, 244105–244119 (2007).
- Murrell et al. (1984) J. N. Murrell, S. Carter, S. C. Farantos, P. Huxley, and A. J. C. Varandas, Molecular Potential Energy Functions (John Wiley & Sons, Chichester, 1984).
- Herzberg (1966) G. Herzberg, Molecular Spectra and Molecular Structure III. Electronic Spectra and Electronic Structure of Polyatomic Molecules (Van Nostrand, New York, 1966).
- Kramida (2018) A. Kramida, Atomic Energy Levels and Spectra Bibliographic Database (version 2.0). [Online] Available: https://physics.nist.gov/Elevbib [October 2, 2018]. National Institute of Standards and Technology, Gaithersburg, MD (2018).
- Huber and Herzberg (1979) K. P. Huber and G. Herzberg, Molecular Spectra and Molecular Structure IV. Constants of Diatomic Molecules., Vol. IV (Van Nostrand, New York, 1979).
- Varandas (1987) A. J. C. Varandas, “A Useful Triangular Plot of Triatomic Potential Energy Surfaces,” Chem. Phys. Lett. 138, 455–461 (1987).
- Varandas (2013c) A. J. C. Varandas, “Accurate Combined-Hyperbolic-Inverse-Power-Representation of Ab Initio Potential Energy Surface for the Hydroperoxyl Radical and Dynamics Study of O+OH Reaction,” J. Chem. Phys. 138, 134117–134123 (2013c).
- Deutsch and Curtiss (1994) P. Deutsch and L. Curtiss, “A Theoretical Study of Triatomic Carbon-Silicon Mixed Clusters. Relative Energies and Binding Energies,” Chem. Phys. Lett. 226, 387–391 (1994).
- Oyedepo, Peterson, and Wilson (2011) G. A. Oyedepo, C. Peterson, and A. K. Wilson, “Accurate Predictions of the Energetics of Silicon Compounds Using the Multireference Correlation Consistent Composite Approach,” J. Chem. Phys. 135, 094103 (2011).
- Bogey et al. (1993) M. Bogey, M. Cordonnier, C. Demuynck, and J. L. Destombes, “Millimeter- and Submillimeter-Wave Spectroscopy of Nonrigid Transient Molecules: Analysis of Silane and Acetylene Plasmas,” in Structures and Conformations of Non-Rigid Molecules, edited by J. Laane, M. Dakkouri, B. van der Veken, and H. Oberhammer (Springer Netherlands, Dordrecht, 1993) pp. 303–323.
- Tennyson et al. (2004) J. Tennyson, M. A. Kostin, P. Barletta, G. J. Harris, O. L. Polyansky, J. Ramanlal, and N. F. Zobov, “DVR3D: A Program Suite for the Calculation of Rotation-Vibration Spectra of Triatomic Molecules,” Comput. Phys. Commun. 163, 85–116 (2004).
- Varandas and Rodrigues (2002) A. J. C. Varandas and S. P. J. Rodrigues, “A Realistic Double Many-Body Expansion Potential Energy Surface for SO2() from a Multiproperty Fit to Accurate Ab Initio Energies and Vibrational Levels,” Spectrochim. Acta Mol. Biomol. Spectrosc. 58, 629–647 (2002).
- Zheng et al. (2017) J. Zheng, J. L. Bao, D. G. Truhlar, and et al., “Polyrate 17-C, a computer program for the calculation of chemical reaction rates for polyatomics,” (2017), see: https://comp.chem.umn.edu/polyrate/, University of Minnesota, Minneapolis, MN, 2017.
- Hase et al. (1996) W. L. Hase, R. J. Duchovic, X. Hu, A. Komornik, K. F. Lim, D. H. Lu, G. H. Peslherbe, K. N. Swamy, S. R. V. Linde, A. J. C. Varandas, H. Wang, and R. J. Wolf, “VENUS96: A General Chemical Dynamics Computer Program,” QCPE Bull. 16, 43 (1996).
- Zanchet et al. (2013) A. Zanchet, M. Agúndez, V. J. Herrero, A. Aguado, and O. Roncero, “Sulfur Chemistry in the Interstellar Medium: The Effect of Vibrational Excitation of H2 in the Reaction S++H2SH++H,” ApJ 146, 125 (2013).
- Peslherbe, Wang, and Hase (1999) G. H. Peslherbe, H. Wang, and W. L. Hase, “Monte Carlo Sampling for Classical Trajectory Simulations,” in Adv. Chem. Phys. (Wiley-Blackwell, 1999) Chap. 6, pp. 171–201.
- Rocha and Linnartz (2021) C. M. R. Rocha and H. Linnartz, “Theoretical Studies of Carbon Fractionation in Reactions of C with C2: Dynamics, Kinetics and Isotopologue Equilibria,” A&A 647, A142 (2021).
- Laidler (1984) K. J. Laidler, “The Development of the Arrhenius Equation,” J. Chem. Educ. 61, 494–498 (1984).
- Cernicharo et al. (1989) J. Cernicharo, C. A. Gottlieb, M. Guelin, P. Thaddeus, and J. M. Vrtilek, “Astronomical and Laboratory Detection of the SiC Radical,” ApJL 341, L25 (1989).
- Mackay (1996) D. D. S. Mackay, “SiO in Dense Molecular Clouds Reconsidered,” MNRAS 278, 62–72 (1996).
- Herbst et al. (1989) E. Herbst, T. J. Millar, S. Wlodek, and D. K. Bohme, “The Chemistry of Silicon in Dense Interstellar Clouds.” A&A 222, 205–210 (1989).
- Whittet, Duley, and Martin (1990) D. C. B. Whittet, W. W. Duley, and P. G. Martin, “On the Abundance of Silicon Carbide in the Interstellar Medium.” MNRAS 244, 427 (1990).
- Chen et al. (2021) T. Chen, C. Y. Xiao, A. Li, and C. T. Zhou, “Where Have All the Interstellar Silicon Carbides Gone?” MNRAS 509, 5231–5236 (2021).
- Varandas and Rodrigues (2006) A. J. C. Varandas and S. P. J. Rodrigues, “New Double Many-Body Expansion Potential Energy Surface for Ground-State HCN from a Multiproperty Fit to Accurate Ab Initio Energies and Rovibrational Calculations,” J. Phys. Chem. A 110, 485–493 (2006).