An improved method to access initial states in relativistic heavy-ion collisions
Abstract
Observables in heavy-ion collisions are generally categorized into centralities, which reflect an average over events within a range of impact parameter including a wide variety of initial state configurations. A multiple binning method using spectator neutrons within each centrality has been previously shown to provide access to events with rare initial state conditions. This work suggests an improvement in quantifying the difference between standard centrality and spectator neutron binning towards accessing the initial state properties. A selection of events with higher initial state density at fixed participating nucleon number was observed to result in larger final state particle production and smaller elliptic flow. The relative difference between observables in centrality and spectator binning shows reduced sensitivity for the observables dominated by impact parameter fluctuations in initial state such as triangular flow. This property makes the spectator binning method a good candidate to separate geometric contributions from random fluctuations in initial state towards final state observables.
pacs:
PACS-keydescribing text of that key and PACS-keydescribing text of that key1 Introduction
In relativistic heavy-ion collisions, a large amount of energy deposited in the collision region deconfines the hadronic matter into strongly-interacting medium called Quark-Gluon Plasma (QGP) flowSTAR ; jetref . Subsequent cooling and expansion of the QGP leads to the production of particles, which carry important information about the initial state of the collision. Initial states of heavy-ion collisions are very important and poses one of the biggest challenges in understanding the properties and dynamics of the QGP medium produced in relativistic heavy-ion collisions. State-of-art Bayesian analyses are generally used to constrain the transport properties of the QGP. But, a large uncertainty in these analyses arises from the specific assumptions on the initial state prior to hydrodynamic expansion bayes1 ; bayes2 ; bayes3 . For example, depending on the choice of initial conditions made in modeling of heavy-ion collisions, the extracted values of shear viscosity to entropy density ratio at the RHIC can vary by a factor of 2 etabys1 ; etabys2 ; etabys3 ; etabys4 ; etabys5 ; etabys6 .
One of the primary variables controlling the amount of energy deposited in the collision region is impact parameter () i.e the transverse distance between the center of two colliding nuclei. Collision events are categorized into “centralities” which directly correlates to . In model calculations, the total number of participating nucleons is used for centrality definition. Whereas, number of charged particles () in a given pseudorapidity () region is used in experiments to define event centrality. In a simple Monte Carlo Glauber model simulation of heavy-ion collisions, initial state observables (e.g. transverse overlap area (), eccentricity of overlap region (), number of participating nucleons () and number of binary collisions ()) show monotonicity as a function of event centrality geoscaling ; subnclglaub . The pressure gradient in initial state converts the spatial eccentricity to final state momentum anisotropy. This final state asymmetry is quantified by a Fourier expansion of azimuthal distribution of particles. The second and third coefficients in the Fourier expansion are called elliptic () and triangular flow (), respectively EPmethod ; flowdef2 . Existing transport models and hydrodynamic simulations describe the evolution of final state observables as a function of centrality hydro1 ; hydro2 ; hydro3 ; amptexp1 ; amptexp2 . But, the current model predictions are dependent on the choice of initial state in heavy-ion collisions.
Estimates of initial state parameters and measurements of final state observables as a function of centrality only reflects the mean values over events within a centrality range. However, such averaging procedure limits detailed access to the initial state configurations contributing to the mean. The spectator nucleons (, defined as subtracted from total number of nucleons), is an event property that also has a strong correlation to the impact parameter and can be used to categorize events on a similar footing as or . Simply put, in an event is anti-correlated to the . Ref. vipulspec2 showed that carries the initial state information, which can be used to select specific collision configurations such as body-tip in collisions of deformed Uranium nuclei. A very similar “multi-differential” approach has also been recently used by the ALICE collaboration at CERN to disentangling the effects of effective energy and multiplicity towards production of strange hadrons alicemulti .
Despite the strong correlation between and , the has been shown to have a reduced correlation with the stemming from interactions and scatterings in the overlap region specanticorr . The exact magnitude of the correlation between and might vary depending on the in which is defined. The reduction in correlation between and forms a basis to use as an approximately independent and new classifier of events. The advantage of such binning procedure in accessing the wide variety of initial state for events within any given centrality has already been studied and reported in Refs vipulspec2 ; vipulspec1 . In heavy-ion experiments, it is only possible to get information on the number of spectator neutrons. Therefore, we define as the sum of neutron spectators going towards left and right direction along the collision axis. In relativistic heavy ion collider (RHIC) at BNL, two Zero-Degree-Calorimeters (ZDC) placed at 6.0 capture the spectator neutrons coming from the interaction region along the beam pipe ZDC1 ; ZDC2 . Ref ZDC1 reported the single neutron peak resolution of in peripheral collisions of Au+Au nuclei with current STAR ZDC, owing to clustering of relatively larger number of neutrons. Therefore, we limit our measurements to 0–60% centrality range in this study.
Before using this novel method to understand initial state properties of heavy-ion collisions, it is important to develop a simple method that could differentiate between the extent of information on initial state obtained from centrality classification and classification of events. In addition, model simulations provide a better understanding of the behavior of observables when plotted as a function of aforementioned event classifiers. Therefore, in this work, we used a transport model to compare observables between: (i) a centrality event classifier based on cuts (“centrality binning”) and (ii) a multiple binning procedure in which events within a given centrality are further classified into several sub-groups using as an event classifier (“L+R binning”).
2 Methodology
A Multi Phase Transport (AMPT) AMPTref model in the string melting version is used to simulate collision events for this study. The AMPT model uses the same initial conditions as HIJING hij1 . Zhang’s parton cascade zpcref follows to take into account partonic interactions which finally recombine with their parent strings that fragment into hadrons within the Lund String Fragmentation model lundref . There is a final stage hadronic afterburner before the hadrons freezeout. The AMPT model has been shown to reproduce experimentally measured observables such as collective flow and to a good approximation amptexp1 ; amptexp2 . In this work, 2 million Au+Au collision events at 200 GeV are simulated.
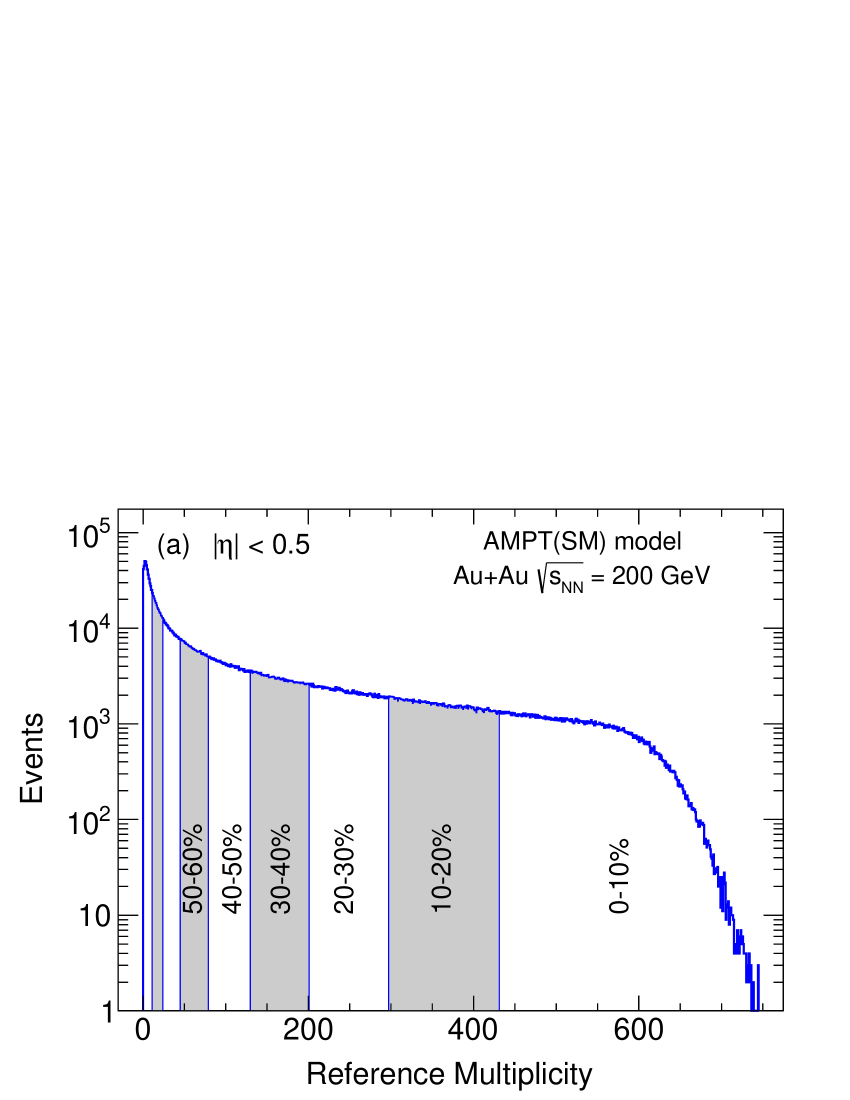
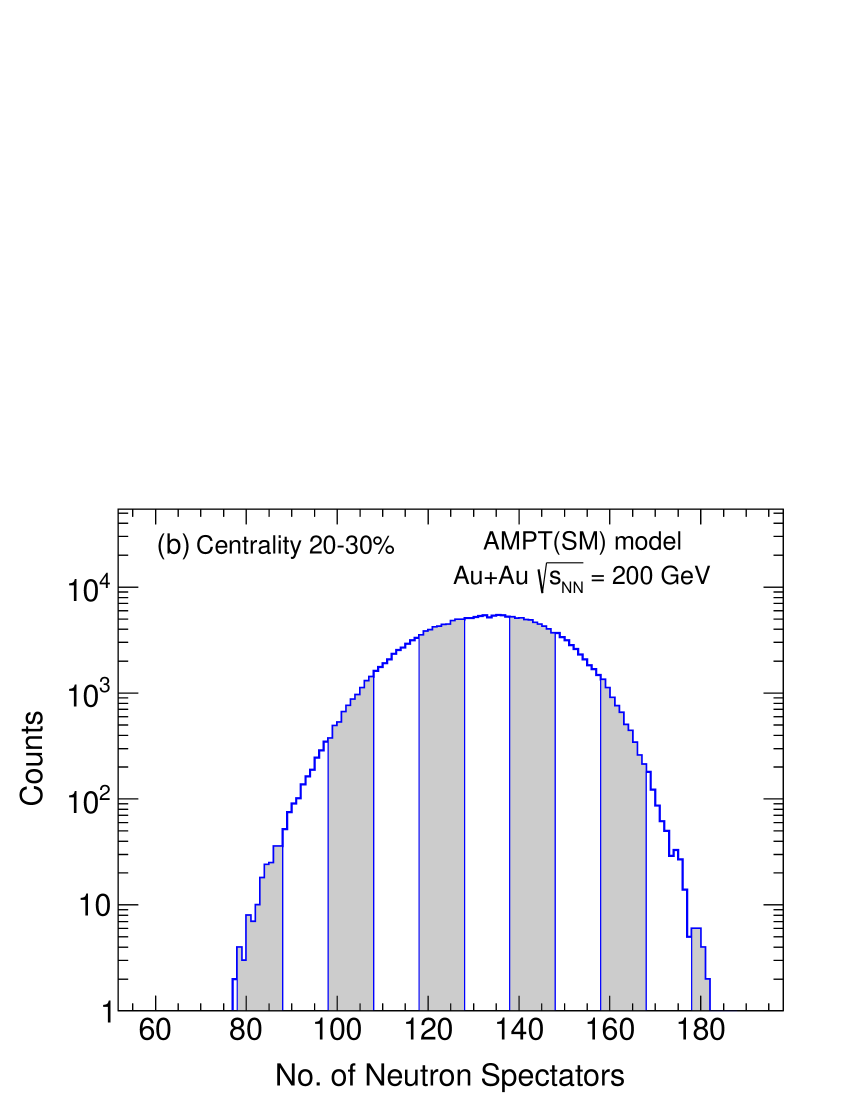

The method of multiple binning used in this study follows Ref. vipulspec1 . We provide a brief outline of this procedure here. The centrality of an event is defined based on which is calculated within 0.5. Based on percentile of distribution, events are classified into 8 centrality bins each of 10 percentile as shown in Fig. 1(a) for Au+Au collisions at 200 GeV. The distribution in each of the 8 centralities is further divided into regular intervals of as shown in Fig. 1(b) for 20–30% centrality. The distribution displays a prominent peak around 125-140 and falls off rapidly on either side. The averaging over events within a centrality range in centrality binning reflects properties of the events around the peak of total spectator neutrons distribution. We can investigate properties of the rare events with fewer or higher values of compared to the central value with the introduction of the L+R binning.
Pearson correlators are widely used to quantify the correlations between any two observables in experimental heavy-ion collisions specanticorr ; FwdBwdCorr ; VnpTCorr . To emphasize the reduction in correlations between and in comparison to and , two Pearson correlators are defined on an event by event basis, and . Fig. 1(c) shows comparison between , and as a function of centrality. The is mathematically anti-correlated to which results in a of -1, irrespective of centrality. But, owing to the fact that we use number of spectator neutrons for the correlation measure (not total number of spectators) and due to event-by-event fluctuations, the magnitude of shows small deviations from the expected value of -1. In addition, as we go from central to peripheral centralities, the absolute magnitude of is observed to decrease by about 10%, which might be due to increased fluctuation contributions to the spectator numbers with decreasing overlap area. In contrast, the absolute magnitude of is observed to decrease by about 45% going from central to peripheral events.
Because and are very weakly correlated, classifying events with on top of is expected to give us increasingly more details on event properties in relatively peripheral events. The Pearson correlator is equivalent to the “centered cosine similarity” between two random variables. So, in – parameter space, the cosine of the angle between centered (- ) and that of centered (- ) is given by . Therefore, a decreasing magnitude of denotes a larger opening angle between the – axes in – parameter space as shown in Fig. 1(c). Therefore we obtain more complimentary information about an event in the – parameter space as we go from central to peripheral collision events using multiple binning procedure. In real experiments, the exact magnitude of correlation between and might be different than those observed here, but the overall behavior is expected to remain the same. It might also be of interest to compare as a function of centrality between systems of different sizes to further understand its origin.
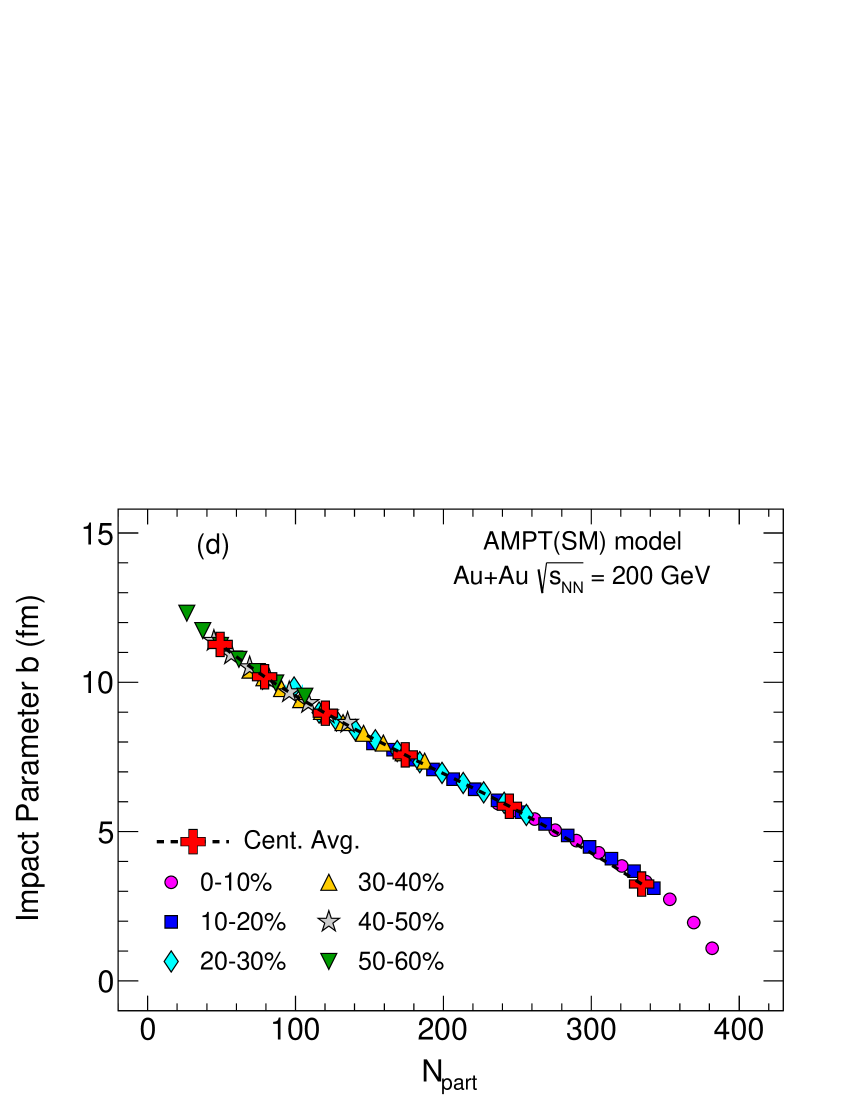
For centrality binning, observables are averaged over centrality intervals of 10% each. For L+R binning, observables are calculated by taking an average over equally spaced L+R bins within any given centrality. Fig. 1(d) shows the variation of with in which centrality and L+R bins are observed to follow the same trend. This implies that the L+R bins in any given centrality can be used to select events with similar impact parameter and as the usual centrality binning. Thus, introduction of as an additional event classifier does not intrinsically select on events with different centrality and thus does not bias our event selection. Therefore, any deviation from the centrality averaged trend, if observed in L+R binning allows access to novel initial state configurations in heavy-ion collisions.
3 Results
This work focuses on the additional insights obtained from L+R binning on top of centrality binning. The observables considered are , , , , and for , 3. The transverse overlap area is calculated as , where and are defined as and , respectively and denote the position of participating nucleons in the transverse plane. Eccentricities are calculated from the positions (, ) of participating nucleons in the transverse plane. The coordinate system is shifted to center of mass of participating nucleons. The calculation of the initial state observables closely follows Ref. glauberRef . For estimation of final state flow coefficients, Event-plane method is used EPmethod . In this method, the reaction plane angle is estimated by event plane angle for each harmonic and the azimuthal anisotropy of particles are calculated about this plane EPmethod .
Figure 2(a) shows as a function of . For centrality averaged values, the initial overlap area increases from peripheral to central collisions due to decrease in impact parameter. The correlation between and is different between L+R binning and centrality binning. In L+R binning rises faster than centrality averaged trend. The difference between trends shown by L+R and centrality binning is dependent on event centrality. Using L+R bins, it is possible to access events with a wider range of and compared to centrality averaged values in any given centrality. In addition, at a given , we could choose events with different using L+R binning, which could help in studying the impact of initial participating nucleon density on final state observables. At a fixed , the area in L+R binning for more central events is observed to be smaller than that of a comparatively peripheral centrality. Thus, multiple binning procedure allows us to establish that for a given , events in central collisions are more densely packed than relatively peripheral collisions. Therefore, the properties of events with different initial densities could be studied using multiple binning procedure.
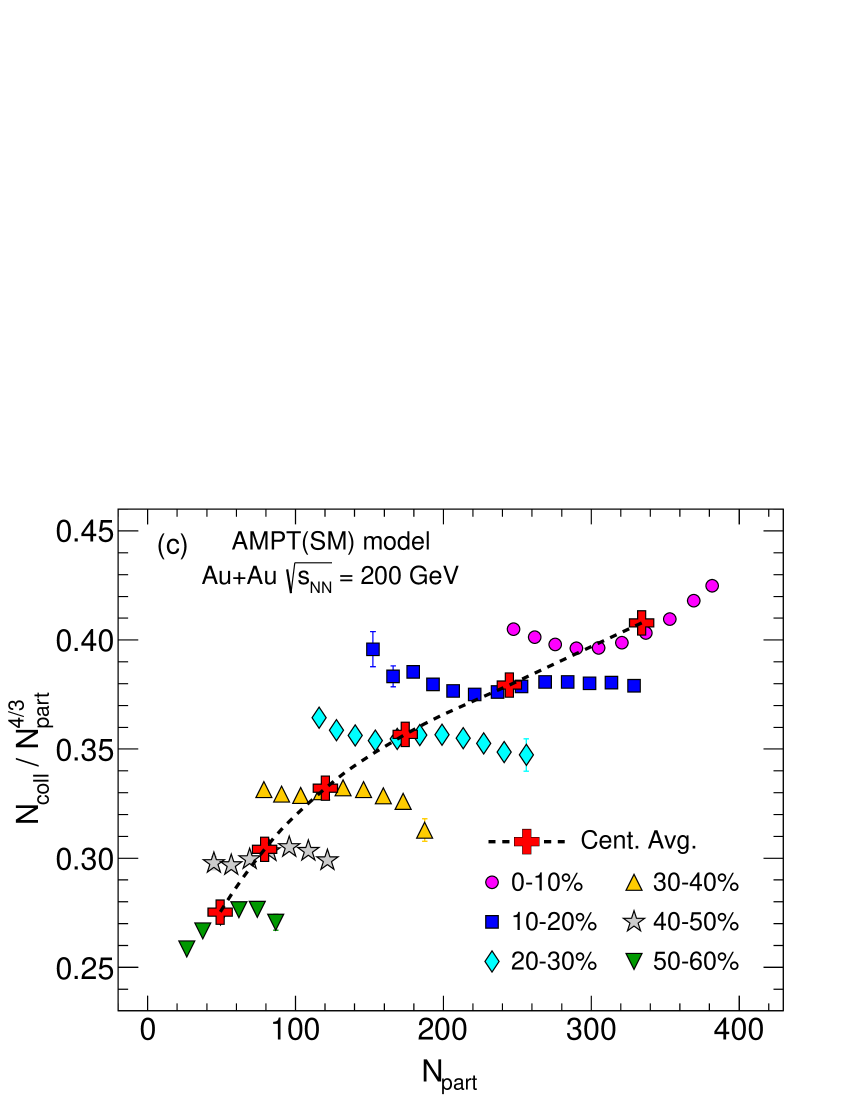
Figure 2(b) shows as a function of . represents number of binary collisions per participating nucleon. For a denser overlap area, a single is expected to encounter larger number of binary collisions, hence should have larger . This is clearly observed in Fig. 2(b). For a given , more central events in L+R binning have a larger number of binary collision per . Such rare events with same but very different interaction rate inside the collision region could help disentangle effect of initial state on measured final state observables. Such a selection of events could not be otherwise accessed using the standard centrality binning alone.
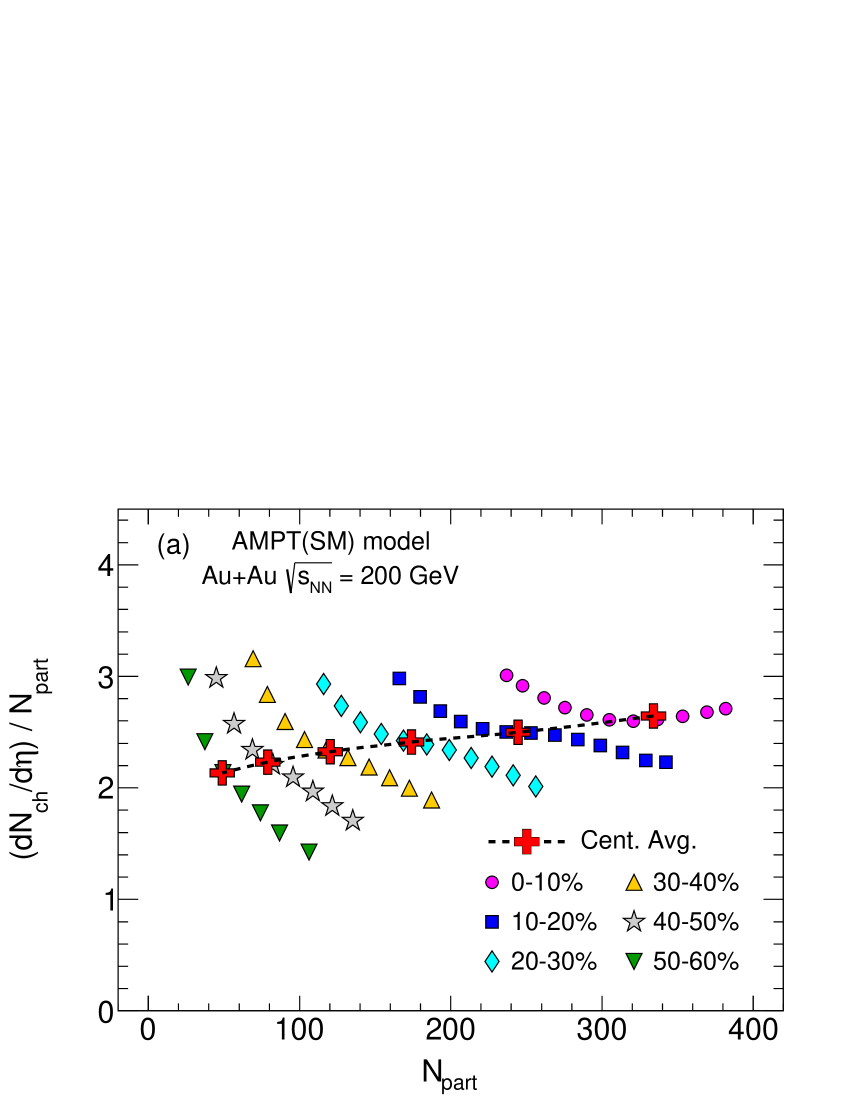
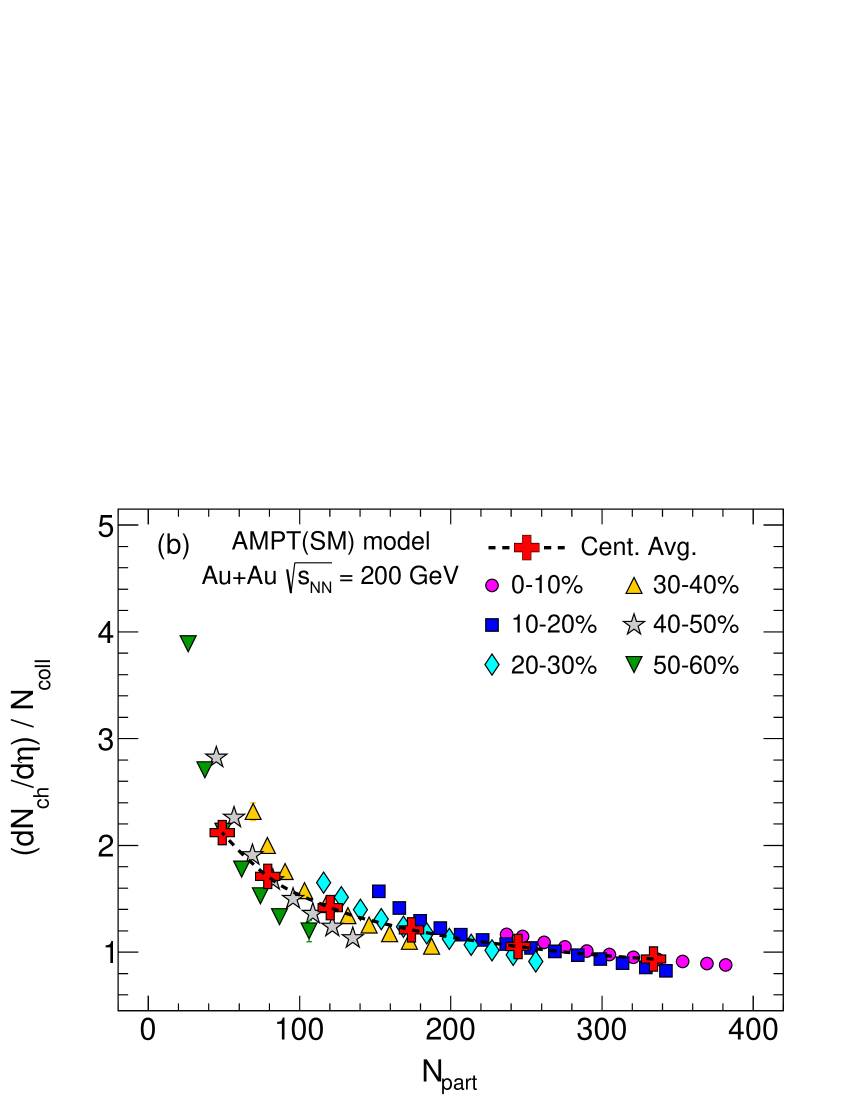
Figure 2(c) shows as a function of . The is expected to increase with . A larger number of binary collision per participant nucleon would lead to a larger value of according to a simple two-component model of particle production binarymodel . In any given centrality, we observed a wide range of nucleon densities in L+R binning from Fig. 2(a) and Fig. 2(b). Therefore, a larger is obtained for events in L+R bins belonging to more central collisions even for a fixed . In other words, for a given , it is possible to choose events with larger event activity using L+R binning. It is important to note that is more correlated to rather than in a collision event ncollindepent .111Further details on nature of / and / as a function of for different centralities are shown in Appendix A. The plots show that the difference in centrality and L+R binning for mostly arises from .
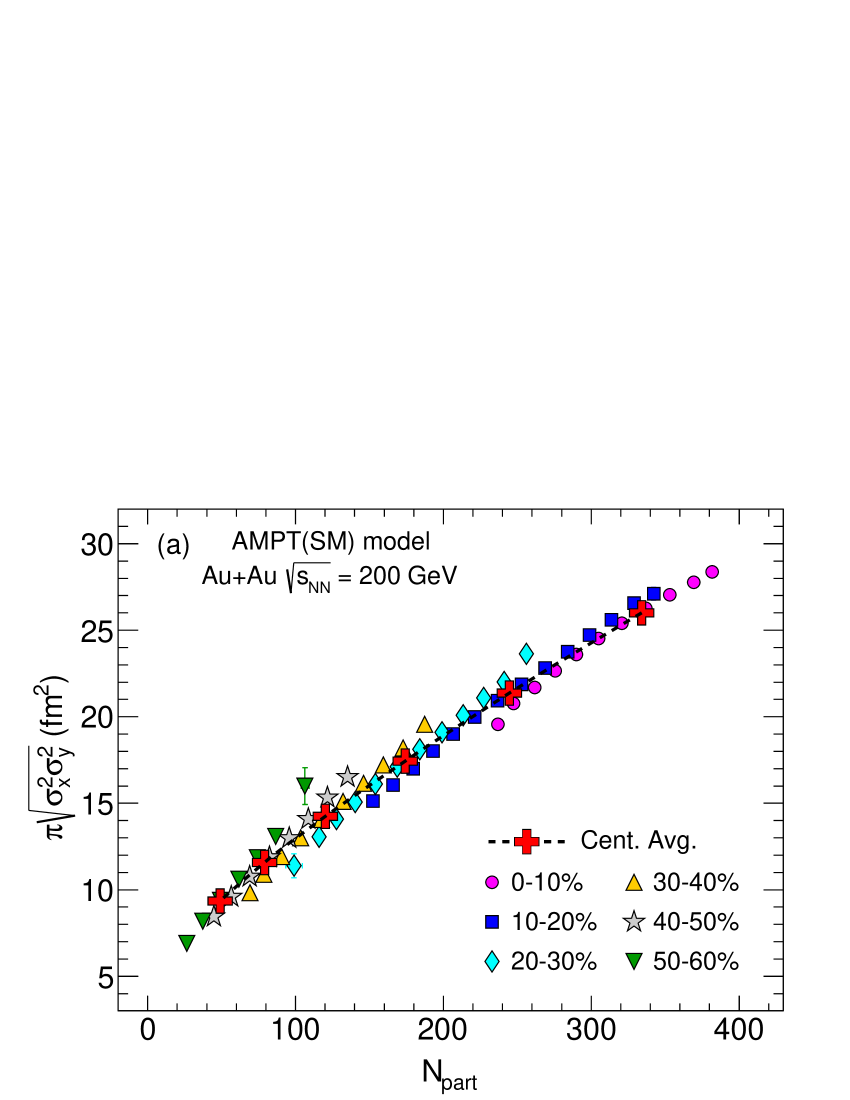
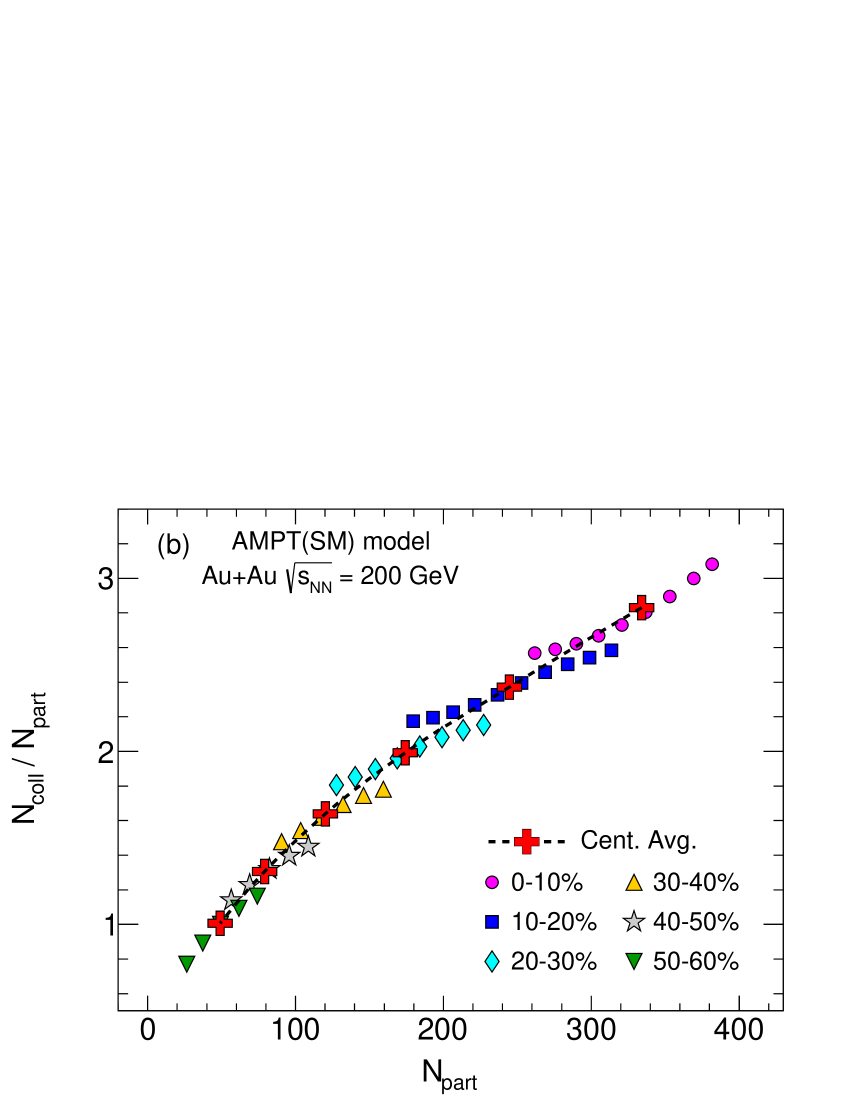
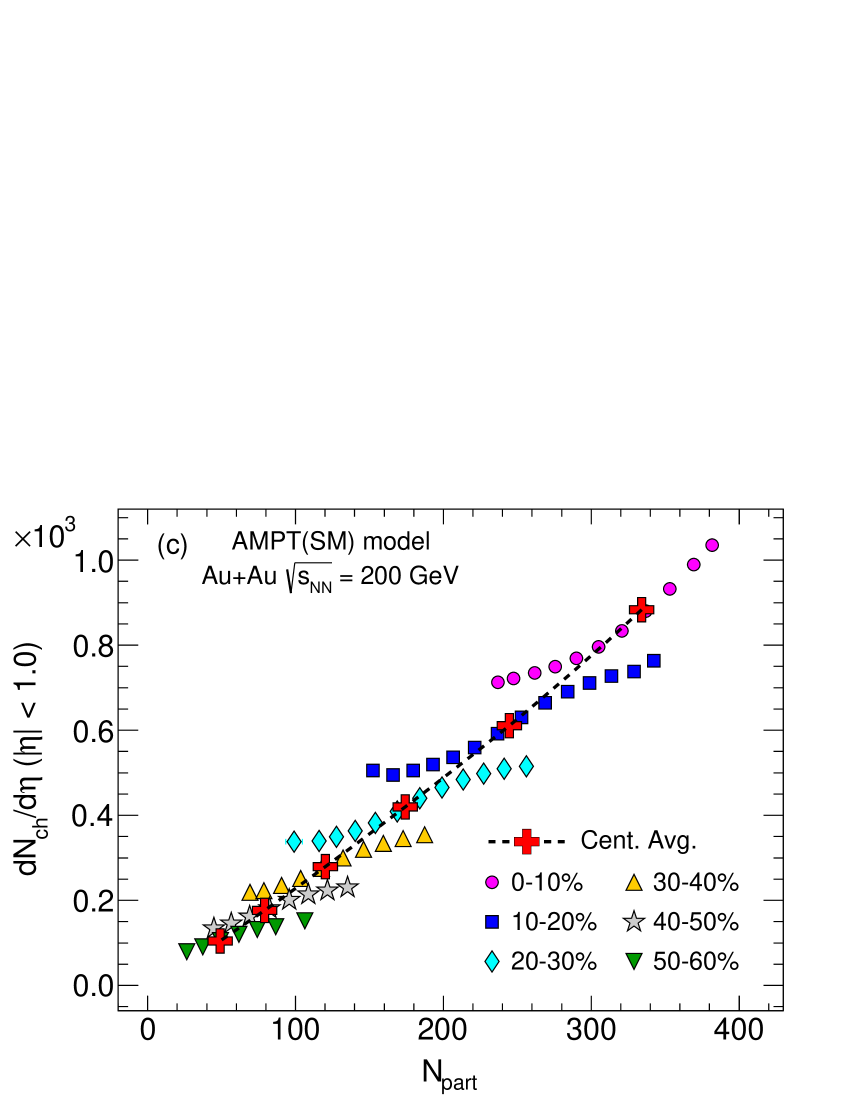
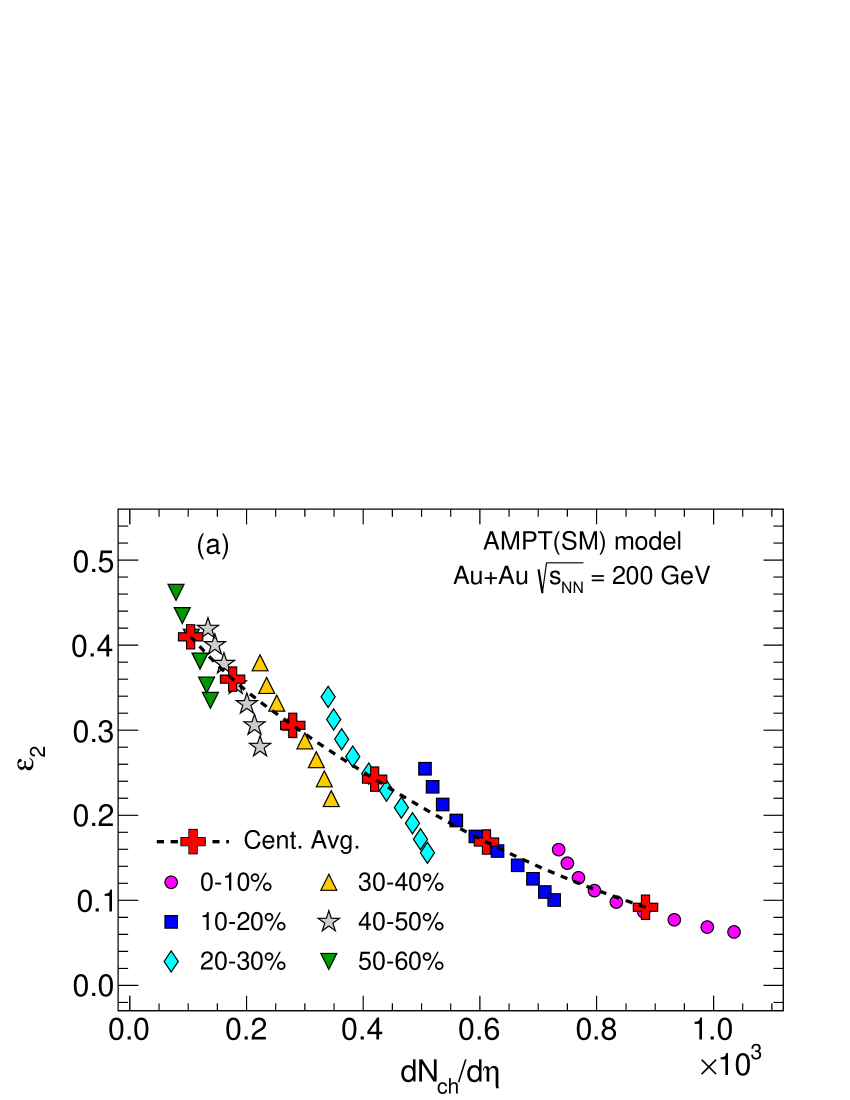
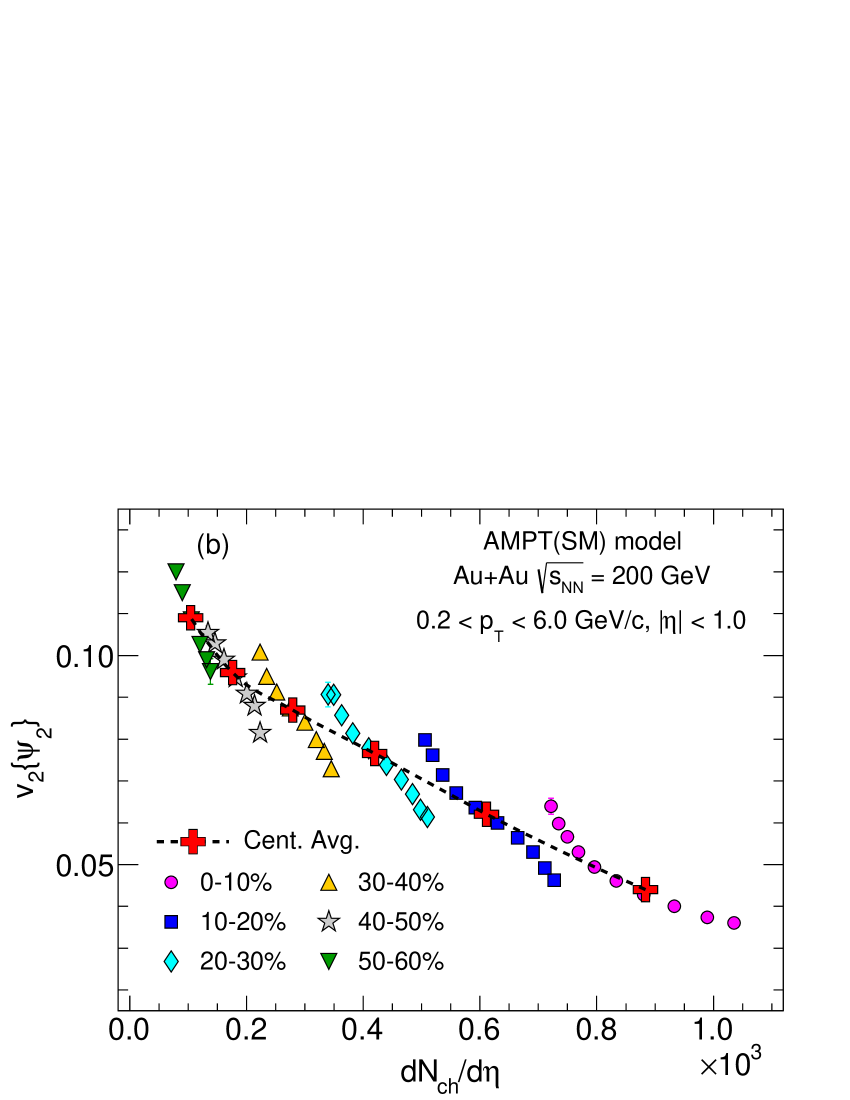
Figure 3(a,b) show and calculated using event plane method as a function of . is geometry driven and is shown to be proportional to following , where is the proportionality constant dependent particularly on equation of state and medium viscosity vnkn . Because arises as a hydrodynamic response to , the overall trend as a function of are expected to be similar. As increases from central to peripheral collisions, the magnitude of also increases. in L+R binning shows a strong deviation and decreases sharper than the centrality averaged trend. From Fig. 2(a,b), it can be observed that for a given , a more central event is more dense in L+R binning. This would lead to a more compact collision region which results in smaller as clearly observed in Fig. 3(a). A similar behavior is observed for as shown in Fig. 3(b) as expected from the linear dependence of on . In addition, L+R binning can be used to choose events with similar but different . This could be particularly helpful in disentangling the effect of initial geometry and initial state fluctuations on the observed final state . For instance, using L+R binning within a given centrality, we could choose events with smaller area but larger eccentricity (or vice-versa) for a given and then study how final state depends on these initial state parameters. Figure 3(b) also shows, L+R binning can be used to select events with same but a higher for more central events. This, in turn, implies that certain anomalous events with higher eccentricity can arise from a more central collision. Having same across events with very different also provides an important handle to separate contribution from initial state geometry and fluctuations towards final state . L+R binning could especially help in studying the contribution from geometrical effects like deformation in nuclear shape, the dependence of which is different from factors such as system size, which contributes to fluctuations in final state .
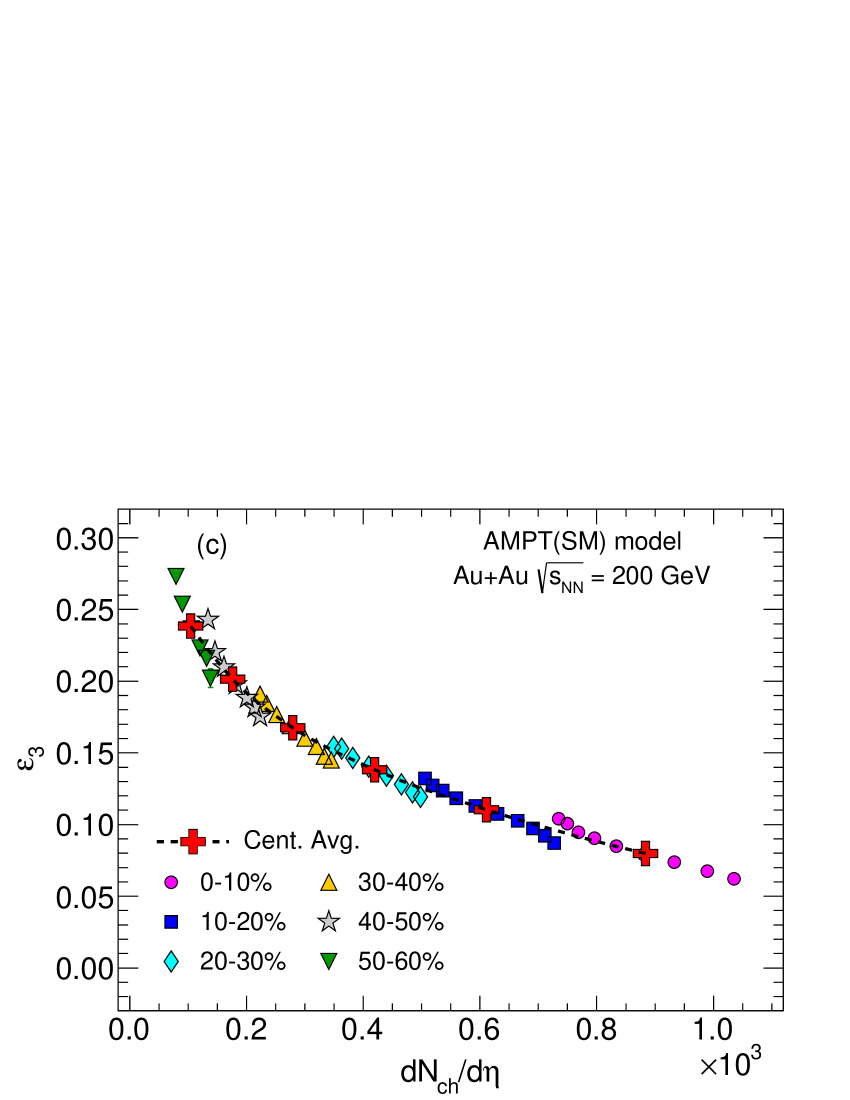
On the other hand, is known to be mostly fluctuation driven ecc3fluc . The decreases from peripheral to central events owing to decreasing fluctuations flowdef2 as observed in Fig. 3(c). The points corresponding to L+R binning for vs. is closer to the centrality averaged values than those for . The final state also displays a similar behavior as as observed in Fig. 3(d). This could also suggest that the initial state fluctuations contributing to final state is mostly driven by fluctuations in .

The novelty of this work lies in quantification of difference in correlation between observables in centrality and L+R binning to improve access to initial state configurations. We assume a linear dependence in both the binning and extract the slopes using a linear fit. The fitting is performed separately for centrality averaged values and L+R binned values in each centrality. For centrality averaged values, we have fitted using one point on either side for a given centrality class. The range of fitting in L+R binning is varied over 2, 3 and 4 L+R bins on either side of the mean value for each centrality. The convergence of the slopes thus obtained for L+R binning is chosen as the nominal value to infer properties of rare events. We have also checked the value for the slope parameter taking the first coefficient from a 2nd order polynomial fit. The slope thus obtained was observed to be consistent with those obtained from linear fit. The centrality averaged slope reflects the correlation over a range of centralities whereas the slope for L+R bins reflects the correlation within a particular centrality. So, a relative difference between these two slopes for any given centrality shows the residual correlation on top of the centrality averaged trend and encodes additional details about the events that are otherwise hidden in standard centrality binning method. We define a quantity which is the relative ratio between centrality averaged slope () and slope for the L+R binning () for each centrality, . If the final state observable is purely fluctuation driven such as impact parameter fluctuations or uncertainties in nucleon positions, the is expected to have a value of 0. The deviation from baseline of 0 denotes the extent by which a certain observable is dominated by dynamic effects other than impact parameter fluctuations or the uncertainties in nucleon positions.
The procedure to extract the slopes using linear fit is shown in Fig. 4(a) for vs . Figure 4(b) shows the extracted slopes and as a function of centrality. The extracted slopes for centrality binning are shown in red dotted lines and those for L+R binning are shown in blue stars. From central to peripheral events, the slope decreases much faster in L+R binning than the slopes from centrality binning. This difference in slopes is directly reflected in the magnitude of as shown in the bottom panel of Fig. 4(b). The slopes extracted from the two methods are observed to be closest for the most central events (0-10%). This is expected because of very similar magnitudes of and as shown in Fig. 1(c). Therefore, one can obtain very little additional information on the correlation between and in L+R binning in comparison to centrality binning. From Fig. 4(a), one can observe an almost linear dependence of with in centrality binning using AMPT model for Au+Au collisions at 200 GeV. is observed to increase from central to peripheral collisions. A deviation of from baseline of 0 can be interpreted as a deviation from linearity of in the final state to from the initial state. Therefore, towards more peripheral centralities, the particle production in L+R binning can capture contributions from factors other than those contributing to particle production in just centrality binning. As we go from central to peripheral collisions, the particle production mechanism becomes more complicated than just a linear response to initial . The multiple binning procedure can help in deciphering more details about the initial state configuration and energy deposition mechanism to understand the evolution of particle production.

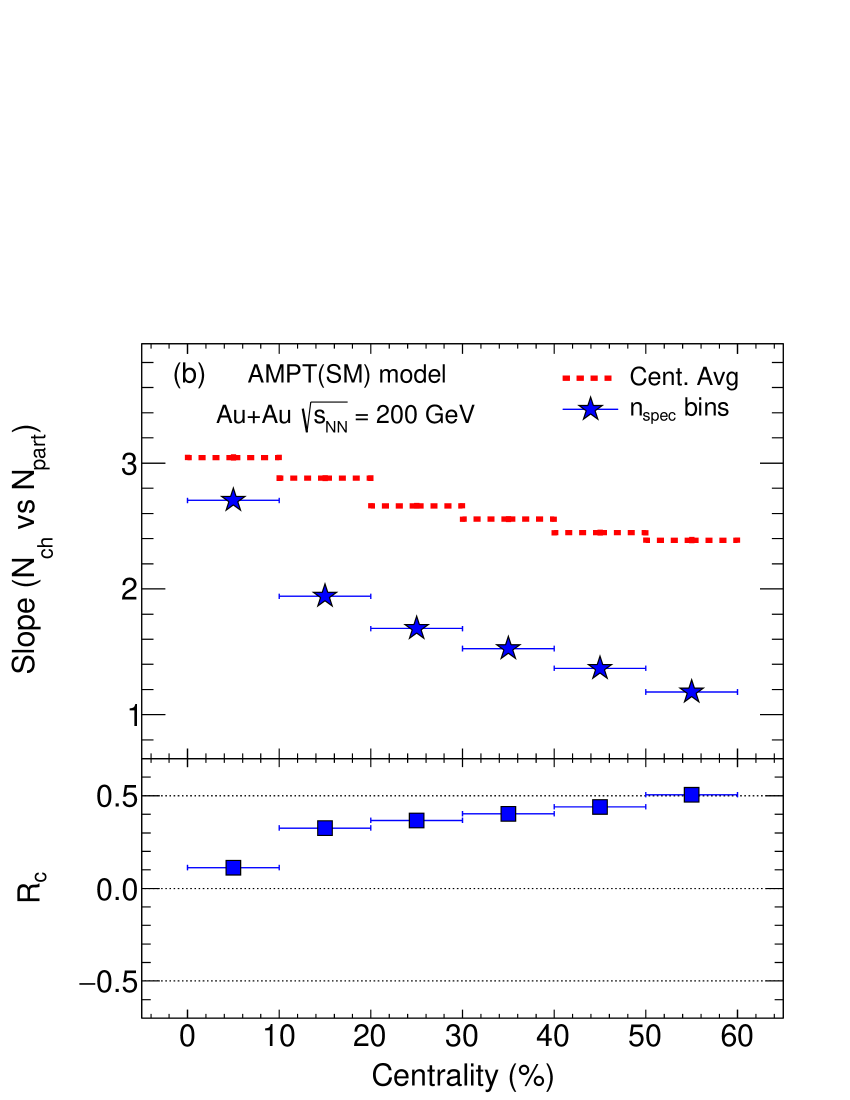
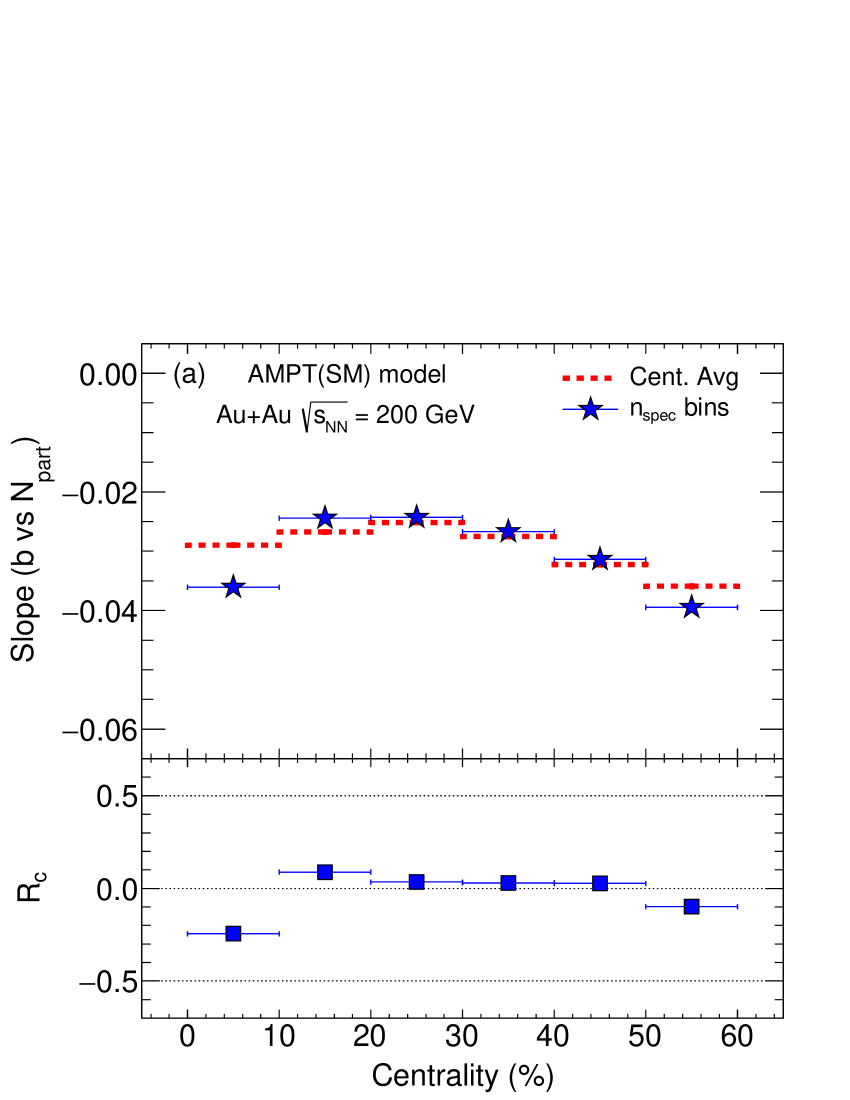
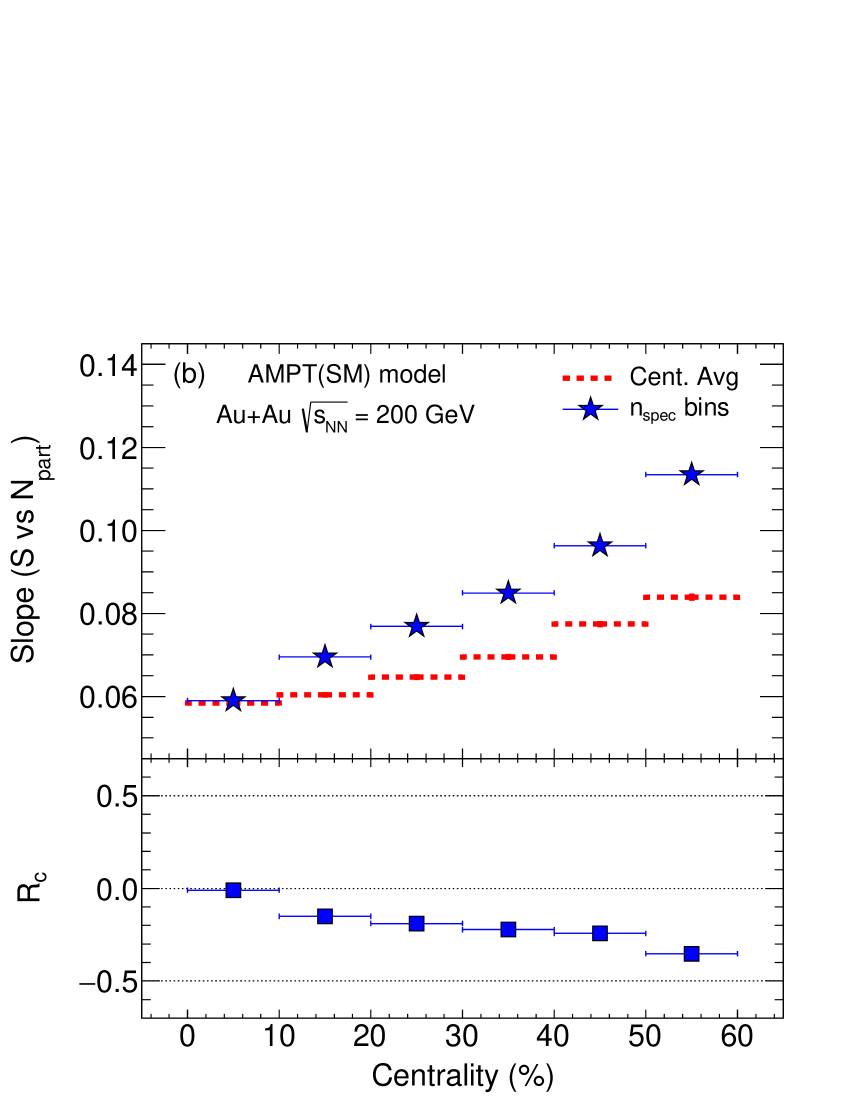
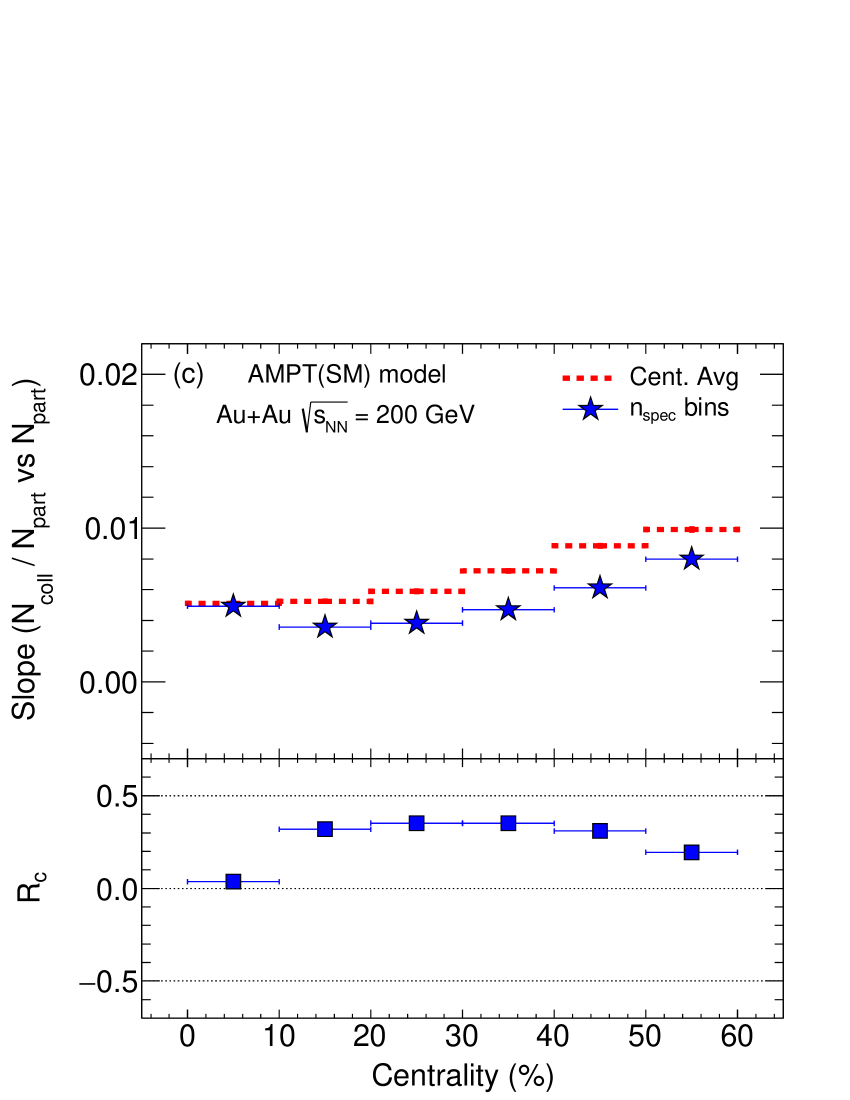
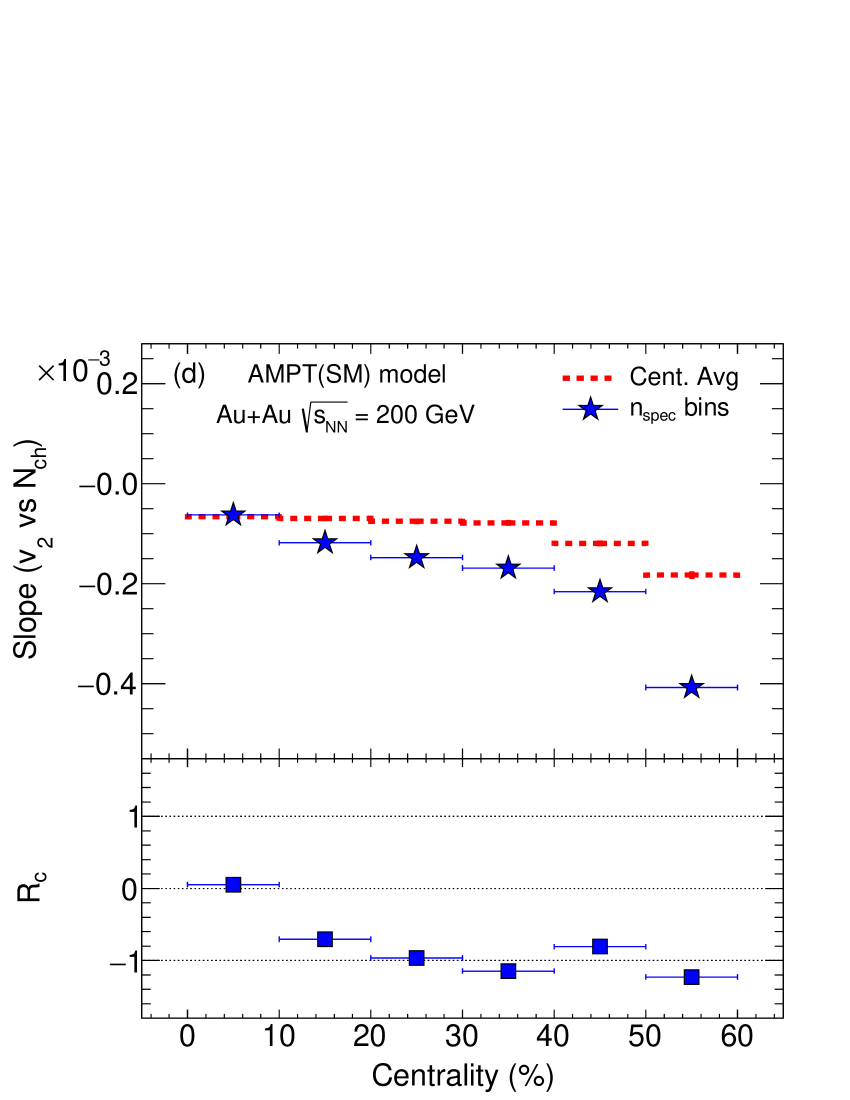
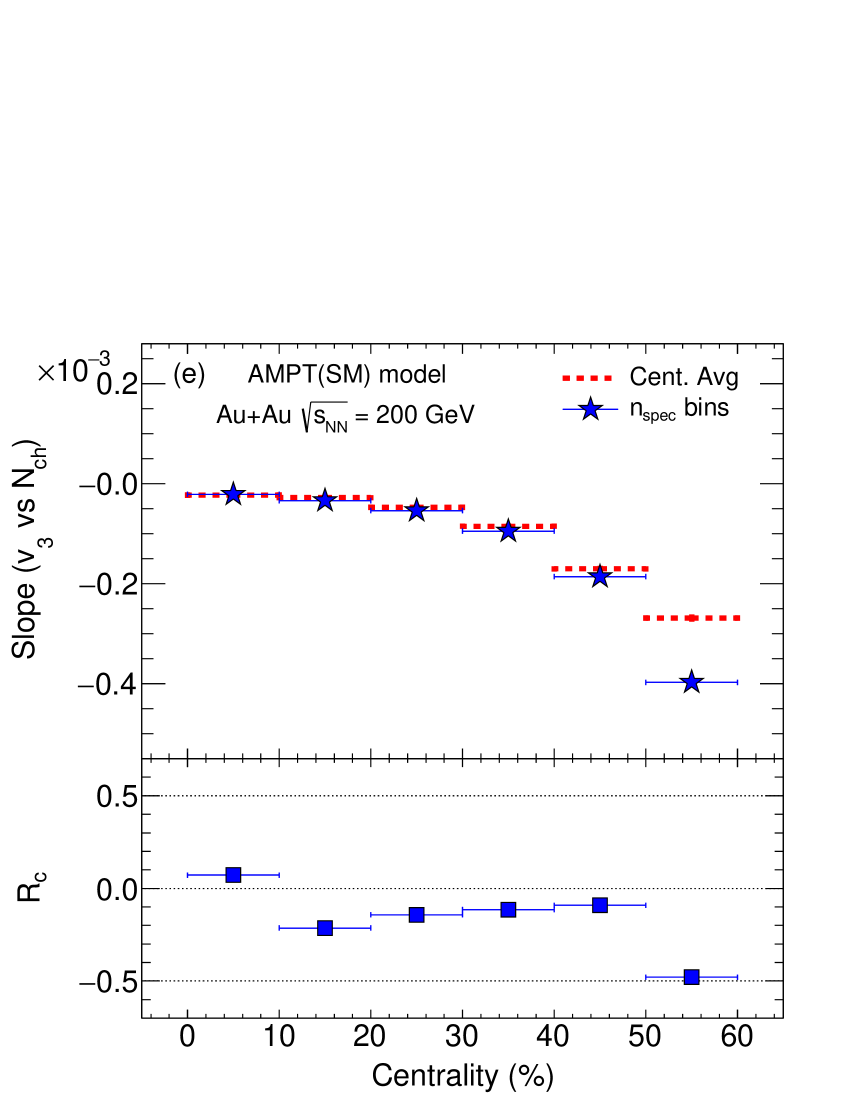
Figure 5(a) shows slopes for vs in centrality and L+R binning. The slopes for centrality averaged values and L+R binned values are very close for all centralities. This observation can be also seen in Fig. 1(c) where for a given , L+R binning and centrality binning correspond to the same . In other words, because has one to one correspondence to , the event selection between centrality and L+R binning is not biased.
Figure 5(b) shows slopes for vs in centrality and L+R binning. The slopes are positive because increasing leads to a larger . The for vs is observed to decrease from central to peripheral collisions. A steady decrease in implies a consistently increasing slope for L+R binning compared to centrality binning. This increasing difference in slopes implies a better access to events with larger with similar for more peripheral events. Therefore, using L+R binning it is possible to access events with larger or smaller density at same for 10–60% centrality. This could be leveraged to select on events with very different initial state densities at same which could shed light on particle production mechanism and contribution of rare initial states to final state observables.
Figure 5(c) shows slopes for / vs in centrality and L+R binning. The slopes are positive implying a increase in rate of binary collisions with increasing . The slope in L+R binning is consistently smaller than the centrality averaged slope and shows a maxima about mid-centrality. This shows that the rate of binary collision within each centrality have contributions other than just the . One obvious source could be the , which itself takes a range of values within each centrality and could lead to a larger for smaller and vice-versa (as also shown previously in Fig. 2(a)). The large magnitude of also implies that L+R binning gives improved access to the events in which rate of interaction is lower for more peripheral events for a fixed . In other words, it enables us to study events belonging to the same centrality, but with different rate of interactions which could result in different in the final state (also shown in Fig. 2(c)). Thus, L+R binning can be used to shed light on how initial rate of interaction (/) in different centralities impacts final state particle production mechanism.
Figure 5(d,e) show slopes for and vs and their respective . being dominated by effects from the shape of initial geometry shows a larger going from central to peripheral events. If the final state was purely driven by initial state fluctuations in participant positions, the slope of vs would have been expected to be the same in centrality and L+R binning. This in turn would have lead to a value of 0. The deviation from baseline of 0 denotes the extent by which is dominated by initial state geometry on top of the initial state fluctuations. Another interesting point to note is that in most central collisions, as the origin of is dominated by initial state fluctuations v2fluc , the parameter is close to 0 for 0–10% centrality. For , the slopes from centrality and L+R binning are very close over a wide range in centrality (0–50%). This reinforces the argument that arises mostly from initial state fluctuations and the additional information that could be obtained from L+R binning in this case is quite limited.
4 Conclusion
We showed that could be used as an additional classifier of event characteristics on top of owing to very small correlation between and . A new method was developed to quantify the difference in slope of correlations between observables in centrality and L+R binning using . A large magnitude of , upto 50% was observed for the correlation between and . This enables us to choose very different initial overlap area for the same . Such a selection over a wide range of overlap area at fixed via L+R binning also leads to widely varying initial state densities, by about 40%. The resulting variation in initial state densities and interaction rates also leads to a wide range of for a given . The increasing magnitude of for vs towards peripheral centrality might point towards the non-linear contributions in initial state configurations or in energy deposition mechanism on top of the linear contribution from in a simple two-component model. The behavior of observables which are known to have dynamical contributions from initial state on top of impact parameter fluctuations are observed to be very different between centrality averaged and L+R binned values. As a result, we observe a large magnitude of for correlation between and whereas, the for vs is very small, 10% on an average. Therefore, a separation of the contribution of initial state geometry from those arising purely from fluctuations could be obtained for using .
L+R binning provides a unique handle to differentiate between events with widely different initial state density and rate of binary collisions even at a fixed . The effect of such rare and widely varying initial state configurations within each centrality class could not be accessed by a standard centrality binning. In addition, because of the reduced sensitivity of towards initial state fluctuations, it could also potentially aide in separating the contributions of geometry and initial state fluctuations towards final state . Such discriminating power of L+R binning procedure could be leveraged in future to select on events with rare properties to disentangle the impact of several initial state parameters on final state observables. In particular, this novel binning procedure could be applied to probe properties of initial states in heavy-ion collision systems. Data from ZDC detector systems installed at RHIC and LHC could be specifically used to get event-by-event spectator neutrons for a more realistic test of this method. Further improvement in ZDC design in future experiments could help increase the single neutron peak resolution. Such improvements would also allow us to extend the centrality range in which the multiple binning procedure could be implemented. It would be of great interest to study the implication of L+R binning for smaller or deformed systems which are known to have additional contribution to final state fluctuation measure when compared to larger, spherical systems.
Acknowledgements
SB is supported by U.S. Department of Energy grant number DEFG0287ER40331.
References
- (1) D. Teaney, E. Shuryak, Phys. Rev. Lett. 86, (2001) 4783-4786.
- (2) J. Adams et. al (STAR Collaboration), Nucl. Phys. A 757, (2005) 102.
- (3) J. Bernhard et. al, Phys. Rev. C 94, (2016) 024907.
- (4) D. Everett et. al (JETSCAPE Collaboration), Phys. Rev. C 103, (2021) 054904.
- (5) G. Nijs et. al, Phys. Rev. Lett. 126, (2021) 202301.
- (6) H. J Drescher et. al, Phys. Rev. C 76, (2007) 024905.
- (7) P. Romatschke and U. Romatschke, Phys. Rev. Lett. 99, (2007) 172301.
- (8) M. Luzum and P. Romatschke, Phys. Rev. C 78, (2008) 034915 [Erratum: Phys. Rev. C 79, (2009) 039903].
- (9) V. Roy et. al, Phys. Rev. C 86, (2012) 014902.
- (10) H. Song et. al, Phys. Rev. Lett. 106, (2011) 192301 [Erratum: Phys. Rev. Lett. 109, (2012) 139904].
- (11) V. Roy et. al, J. Phys. G 40, (2013) 065103.
- (12) M. L Miller et. al, Ann. Rev. Nucl. Part. Sci. 57, (2007) 205-243.
- (13) C. Loizides, Phys. Rev. C 94, (2016) 024914.
- (14) A. M Poskanzer and S. A Voloshin, Phys. Rev. C 58, (1998) 1671.
- (15) B. Alver and G. Roland, Phys. Rev. C 81, (2010) 054905 [Erratum: Phys. Rev. C 82, (2010) 039903].
- (16) C. Gale et. al, Int. J. Mod. Phys. A 28, (2013) 1340011.
- (17) U. Heinz and R. Snellings, Ann. Rev. Nucl. Part. Sci. 63, (2013) 123.
- (18) F. G Gardim et. al, Phys. Rev. C 85, (2012) 024908.
- (19) J. Xu, C. M Ko, Phys. Rev. C 84, (2011) 044907.
- (20) J. Xu, C. M Ko, Phys. Rev. C 84, (2011) 014903.
- (21) V. Bairathi et. al, Phys. Rev. C 91, (2015) 054903.
- (22) Chiara De Martin (ALICE Collaboration), Quark Matter 2022, https://indico.cern.ch/event/895086/contributions/4736386/. Accessed 12 September 2022.
- (23) S. Sombun et. al, J. Phys. G 45, (2018) 025101.
- (24) V. Bairathi et. al, Phys. Lett. B 754, (2016) 144-150.
- (25) Yi-Fei Xu et. al, Nucl. Sci. Tech. 27, (2016) 126.
- (26) E. G Judd et. al, Nucl. Instrum. Meth. A 902, (2018) 228.
- (27) Z. W Lin et. al, Phys. Rev. C 72, (2005) 064901.
- (28) X.-N. Wang and M. Gyulassy, Phys. Rev. D 44, (1991) 3501-3516.
- (29) B. Zhang, Comput. Phys. Commun. 109, (1998) 193.
- (30) B. Andersson et. al, Z. Phys. C 20, (1983) 317.
- (31) J. Adam et. al (ALICE Collaboration), JHEP 2015, (2015) 97.
- (32) ATLAS Collaboration, arXiv:2205.00039 [nucl-ex].
- (33) C. Loizides et. al, SoftwareX 1-2, (2015) 13-18.
- (34) D. Kharzeev and M. Nardi, Phys. Lett. B 507, (2001) 121.
- (35) J. S Moreland et. al, Phys. Rev. C 92, (2015) 011901.
- (36) R. S. Bhalerao et. al, Phys. Rev. C 84, (2011) 034910.
- (37) G. Kh. Eyyubova et. al, J. Phys. G 48, (2021) 095101.
- (38) H. Petersen et. al, Phys. Rev. C 82, (2010) 041901.
Appendix A Appendix
Additional plots to study origin of from and are given below.