UV Slopes At All Redshifts Are Consistent with Stochastic Star Formation Histories
Abstract
Multiple investigations support describing galaxy growth as a stochastic process with correlations over a range of timescales governed by a parameter, , empirically and theoretically constrained to be near unity. Here, we show that the distribution of UV-slopes, , derived from an ensemble of theoretical star formation histories (SFHs) is consistent with data at all redshifts . At , the median value agrees well with the canonical for local starbursts (Meurer et al., 1999). At , JWST data span the model distribution’s 2nd to 98th percentiles. Values of should be common in early galaxies without reference to exotic stellar populations—arising solely from a null hypothesis of for the underlying diversity of galaxy growth histories. Future data should be interpreted with this fact in mind.
1 Introduction
Restframe ultraviolet light is a proxy for ongoing star formation (e.g., Calzetti et al., 1994). Observations of local starbursts suggest that vigorous star formation today leads to an unreddened UV spectral slope of (Meurer et al., 1999). At higher redshift, the distribution of may shift to more negative values, or bluer UV continua (e.g., Bouwens et al., 2014). Such trends might reveal changes in the properties of stellar populations with lookback time, with some theoretical work indicating that suggests the presence of Population III stars (Robertson et al., 2010). Such extreme negative values have now been observed at high redshifts with JWST (e.g., Nanayakkara et al., 2022).
However, is sensitive not only to the properties of the underlying stellar population, but also a galaxy’s star formation history (SFH). Physical interpretations that invoke exotic physics must therefore account for the true diversity of SFHs based on a null hypothesis derived from a realistic suite of growth trajectories.
Stochastic processes provide a useful framework for generating such trajectories (Kelson, 2014). Cooling, heating, turbulence, the formation of star clusters—and any resulting feedback—correlate changes to galaxy star formation rates (SFRs) over a broad range of timescales, allowing one to express stellar mass growth with a relatively simple parameterization of these spectrum of correlated timescales, —the Hurst parameter (e.g., Mandelbrot & van Ness, 1968). From a theoretical perspective, gravitational collapse itself drives systems to (Kelson et al., 2020), implying that recent changes to accretion rates—that serve to fuel star formation—are maximally correlated with all previous changes that have occured.
Ensembles of theoretical SFHs assuming have been shown to reproduce distributions of specific star formation rates and restframe colors (e.g., Kelson, 2014), generate the stellar mass function (Kelson et al., 2016), and match the passive galaxy fraction at appropriate masses and/or epochs (Abramson & Kelson, 2020). Here, we show that they also reproduce measurements of at .
2 Expectations for Unattenuated UV Slopes
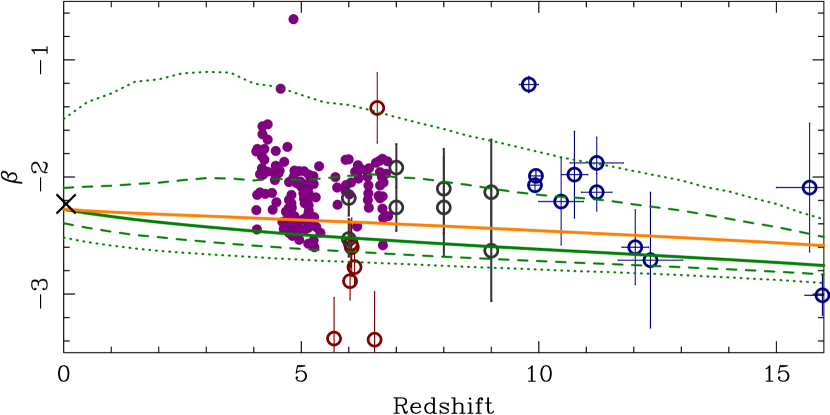
Figure 1 shows the stochastic expectation for the distribution of for galaxies at with ongoing star formation. Model SFRs were computed over a 10 Myr timeframe. Model galaxies were classified as “star forming” if they had sSFRs above a threshold placed below the median (results are insensitive to these details). We used the Flexible Stellar Population Synthesis library (Conroy & Gunn, 2010) assuming a Chabrier (2003) IMF, , no attenuation/reddening, and an onset of star formation at . We compute using the standard Calzetti et al. (1994) bandpasses. A sample of model histories defines the distribution at all redshifts.
The solid green line shows the predicted evolution of the median unattenuated UV slope, , with redshift. At , this yields , in good agreement with Meurer et al. (1999)’s observation of .111We find at when assuming dex (not shown). At higher redshift, the data span the predicted 2nd to 98th percentiles (dotted lines) with the vast majority of measurements lying inside the 10th to 90th (dashed lines).
The shift of the distribution to bluer slopes at higher redshifts in this plot exclusively reflects the changing contrast between young and (relatively) old stars. The evolution of is not as strong when using solar stellar matallicities (orange solid line in Figure 1). Due to the diversity of recent star formation activity in the SFHs, the distribution of expected values is substantially asymmetric/non-Gaussian, even absent any dust or metallicity effects. Conversely, high-redshift and dust content estimates should be performed with respect to a locus defined by these model curves, or similarly generated ones using the best available stellar metallicities.
High-redshift restframe UV continuum observations may provide insights into novel phenomena, including the first stars. However, measurements of at can so far be explained by invoking nothing beyond a broad diversity of star formation histories. Specifically, these data—and many others—are consistent with galaxies growing as stochastic processes.
With SFHs providing a prior on the underlying growth trajectories of early galaxies, values of should be common (e.g., Atek et al., 2022) irrespective of the presence of, e.g., Population III stars. Towards lower redshifts, the wider range and higher median is expected. Should star formation begin at for some subsamples of galaxies—perhaps due to differences in environmental density—more extreme negative values of are possible.
Many salient aspects of galaxy evolution can be interpreted through the lens of stochastic SFHs. Accurate analyses of high redshift data—especially claims of new physics—must account for the impact and implications of this more complete span of growth trajectories compared to typical (and typically parametric) models. Fortunately, SFHs are easy to generate, making such null hypotheses easy to test. A sample of such histories, with timesteps can be downloaded from https://code.obs.carnegiescience.edu/Stochastic (catalog https://code.obs.carnegiescience.edu/Stochastic).
References
- (1)
- Abramson & Kelson (2020) Abramson, L. E. & Kelson, D. D. 2020, RNAAS, 4, 236
- Atek et al. (2022) Atek, H., Shuntov, M., Furtak, L. J., et al. 2022, arXiv:2207.12338
- Bhatawdekar & Conselice (2021) Bhatawdekar, R. & Conselice, C. J. 2021, ApJ, 909, 144
- Bouwens et al. (2014) Bouwens, R. J., Illingworth, G. D., Oesch, P. A., et al. 2014, ApJ, 793, 115
- Calzetti et al. (1994) Calzetti, D., Kinney, A. L., & Storchi-Bergmann, T. 1994, ApJ, 429, 582,
- Chabrier (2003) Chabrier, G. 2003, PASP, 115, 763.
- Conroy & Gunn (2010) Conroy, C., & Gunn, J. E. 2010, ApJ, 712, 833,
- Jiang et al. (2020) Jiang, L., Cohen, S. H., Windhorst, R. A., et al. 2020, ApJ, 889, 90
- Kelson (2014) Kelson, D. D. 2014, arXiv:1406.5191
- Kelson et al. (2016) Kelson, D. D., Benson, A. J., & Abramson, L. E. 2016, arXiv:1610.06566
- Kelson et al. (2020) Kelson, D. D., Abramson, L. E., Benson, A. J., et al. 2020, MNRAS, 494, 2628
- Mandelbrot & van Ness (1968) Mandelbrot, B. B., & van Ness, J. W. 1968, SIAM Review, 10, 422
- Meurer et al. (1999) Meurer G. R., Heckman T. M., & Calzetti D., 1999, ApJ, 521, 64
- Nanayakkara et al. (2022) Nanayakkara, T., Glazebrook, K., Jacobs, C., et al. 2022, arXiv:2207.13860
- Robertson et al. (2010) Robertson, B. E., Ellis, R. S., Dunlop, J. S., et al. 2010, Nature, 468, 49