A slow bar in the lenticular barred galaxy NGC 4277††thanks: Based on observations made with ESO telescopes at the La Silla-Paranal Observatory under programme 094.B-0241.
Abstract
Aims. We characterised the properties of the bar hosted in lenticular galaxy NGC 4277, which is located behind the Virgo cluster.
Methods. We measured the bar length and strength from the surface photometry obtained from the broad-band imaging of the Sloan Digital Sky Survey and we derived the bar pattern speed from the stellar kinematics obtained from the integral-field spectroscopy performed with the Multi Unit Spectroscopic Explorer at the Very Large Telescope. We also estimated the co-rotation radius from the circular velocity, which we constrained by correcting the stellar streaming motions for asymmetric drift, and we finally derived the bar rotation rate.
Results. We found that NGC 4277 hosts a short ( kpc), weak (), and slow () bar and its pattern speed ( km s-1 kpc-1) is amongst the best-constrained ones ever obtained with the Tremaine-Weinberg (TW) method with relative statistical errors of .
Conclusions. NGC 4277 is the first clear-cut case of a galaxy hosting a slow stellar bar ( at more than a 1 confidence level) measured with the model-independent TW method. A possible interaction with the neighbour galaxy NGC 4273 could have triggered the formation of such a slow bar and/or the bar could be slowed down due to the dynamical friction with a significant amount of dark matter within the bar region.
Key Words.:
galaxies: evolution — galaxies: individual: NGC 4277 — galaxies: kinematics and dynamics — galaxies: photometry — galaxies: structure1 Introduction
Stellar bars are ubiquitous in nearby disc and irregular galaxies (e.g. Marinova & Jogee, 2007; Aguerri et al., 2009; Buta et al., 2015). The (triggered and spontaneous) formation, subsequent (fast and slow) evolution, and possible (abrupt and progressive) dissolution of a bar drive remarkable changes in the host galaxy on both small ( pc) and large ( kpc) spatial scales over both short ( Myr) and long ( Gyr) timescales. Indeed, the exchange of mass, energy, and angular momentum between the bar and the other components of the galaxy affects its morphology, orbital structure, mass distribution, star formation, central fuelling rate, and stellar population properties (Kormendy & Kennicutt, 2004; Athanassoula et al., 2013; Fragkoudi et al., 2016). This metamorphosis of the galaxy is tightly coupled to the changes expected in the properties of the bar. Once born, bars become longer and stronger as well as slow down on timescales, which also depend on the dynamical friction generated by the dark matter (DM) halo in the bar region (e.g. Debattista & Sellwood, 1998; Athanassoula et al., 2013; Petersen et al., 2019)
Measuring the length , strength , and pattern speed of bars is therefore vital for unveiling the structure of barred galaxies (see Athanassoula et al. 2013 and Sellwood 2014, for reviews). We note that corresponds to the radial extension of the stellar orbits that support the bar, parameterises the bar’s contribution to the galaxy’s non-axisymmetric potential, and is the bar pattern speed. A further parameter, the rotation rate, is defined as the ratio between the co-rotation radius and the bar length and it classifies bars into ‘fast and long’ () and ‘slow and short’ bars () (Athanassoula, 1992; Debattista & Sellwood, 2000). Fast and long bars can form spontaneously in unstable and nearly isolated stellar discs (Athanassoula et al., 2013), while the formation of slow and short bars can be induced by the tidal interaction with a neighbour galaxy (Martinez-Valpuesta et al., 2017). Moreover, the bar can be braked by the DM halo, and therefore could be a good proxy for the content and distribution of DM in the bar region (e.g. Debattista & Sellwood, 1998; Athanassoula et al., 2013; Petersen et al., 2019).
While and can be determined through the analysis of the surface brightness distribution (see Aguerri et al. 2009, and references therein), is a kinematic parameter which requires both photometric and kinematic data. In the last decades, several indirect methods have been proposed to recover . They are based on the identification of rings with resonances (Pérez et al., 2012), the study of the shape of dust lanes (Athanassoula, 1992), the location of shock-induced star-forming regions (Puerari & Dottori, 1997), the comparison of dynamical models of gas (Weiner et al., 2001) or N-body simulations (Rautiainen et al., 2008) with the observed distribution of gas and stars, the analysis of the phase shift between the bar density perturbation and gravitational potential (Zhang & Buta, 2007), and the assessment of the phase change of the gas flow across co-rotation (Font et al., 2011). All of these methods are model dependent and suffer some limitations. For example, the correct identification of resonances and shock-induced star-forming regions is not a straightforward task; the dust lanes across the bar are often very subtle and quite complex features, and gas dynamical models and N-body simulations lead to non-unique solutions when compared to the actual morphology of a galaxy. The only model-independent technique that can recover is the Tremaine & Weinberg (1984) method (hereafter TW method), which is based on the assumptions that the bar rotates with a well-defined pattern speed in a flat disc and that the tracer satisfies the continuity equation resulting in , where is the disc inclination and and are the mass-weighted mean line-of-sight (LOS) velocities and positions of the tracer measured along different apertures parallel to the disc major axis.
To date no ‘genuine’ slow bar ( at more than a 1 confidence level) have been measured using the TW method on stars (see Corsini 2011 and Cuomo et al. 2020, for the full list of objects), suggesting that bar formation was not tidally induced by close interactions and implying a low DM contribution in the bar region. Only a few slow bars have been found by applying the TW method to a gaseous tracer, such as the neutral (Banerjee et al., 2013; Patra & Jog, 2019) or ionised hydrogen one (Bureau et al., 1999; Chemin & Hernandez, 2009), with no guarantee that the continuity equation holds in the presence of gas phase changes and ongoing star formation. On the contrary, a large number of bars have been found to be slow through model-dependent methods. However, either we do not have a reliable estimate of the uncertainty on or the uncertainty is so large () that these bars are also consistent with being ‘fast’ (Rautiainen et al., 2008; Buta & Zhang, 2009; Font et al., 2014). Here, we report the case of NGC 4277 as the first clear-cut example of a galaxy hosting a slow stellar bar, from the direct measurement of its pattern speed.
2 NGC 4277
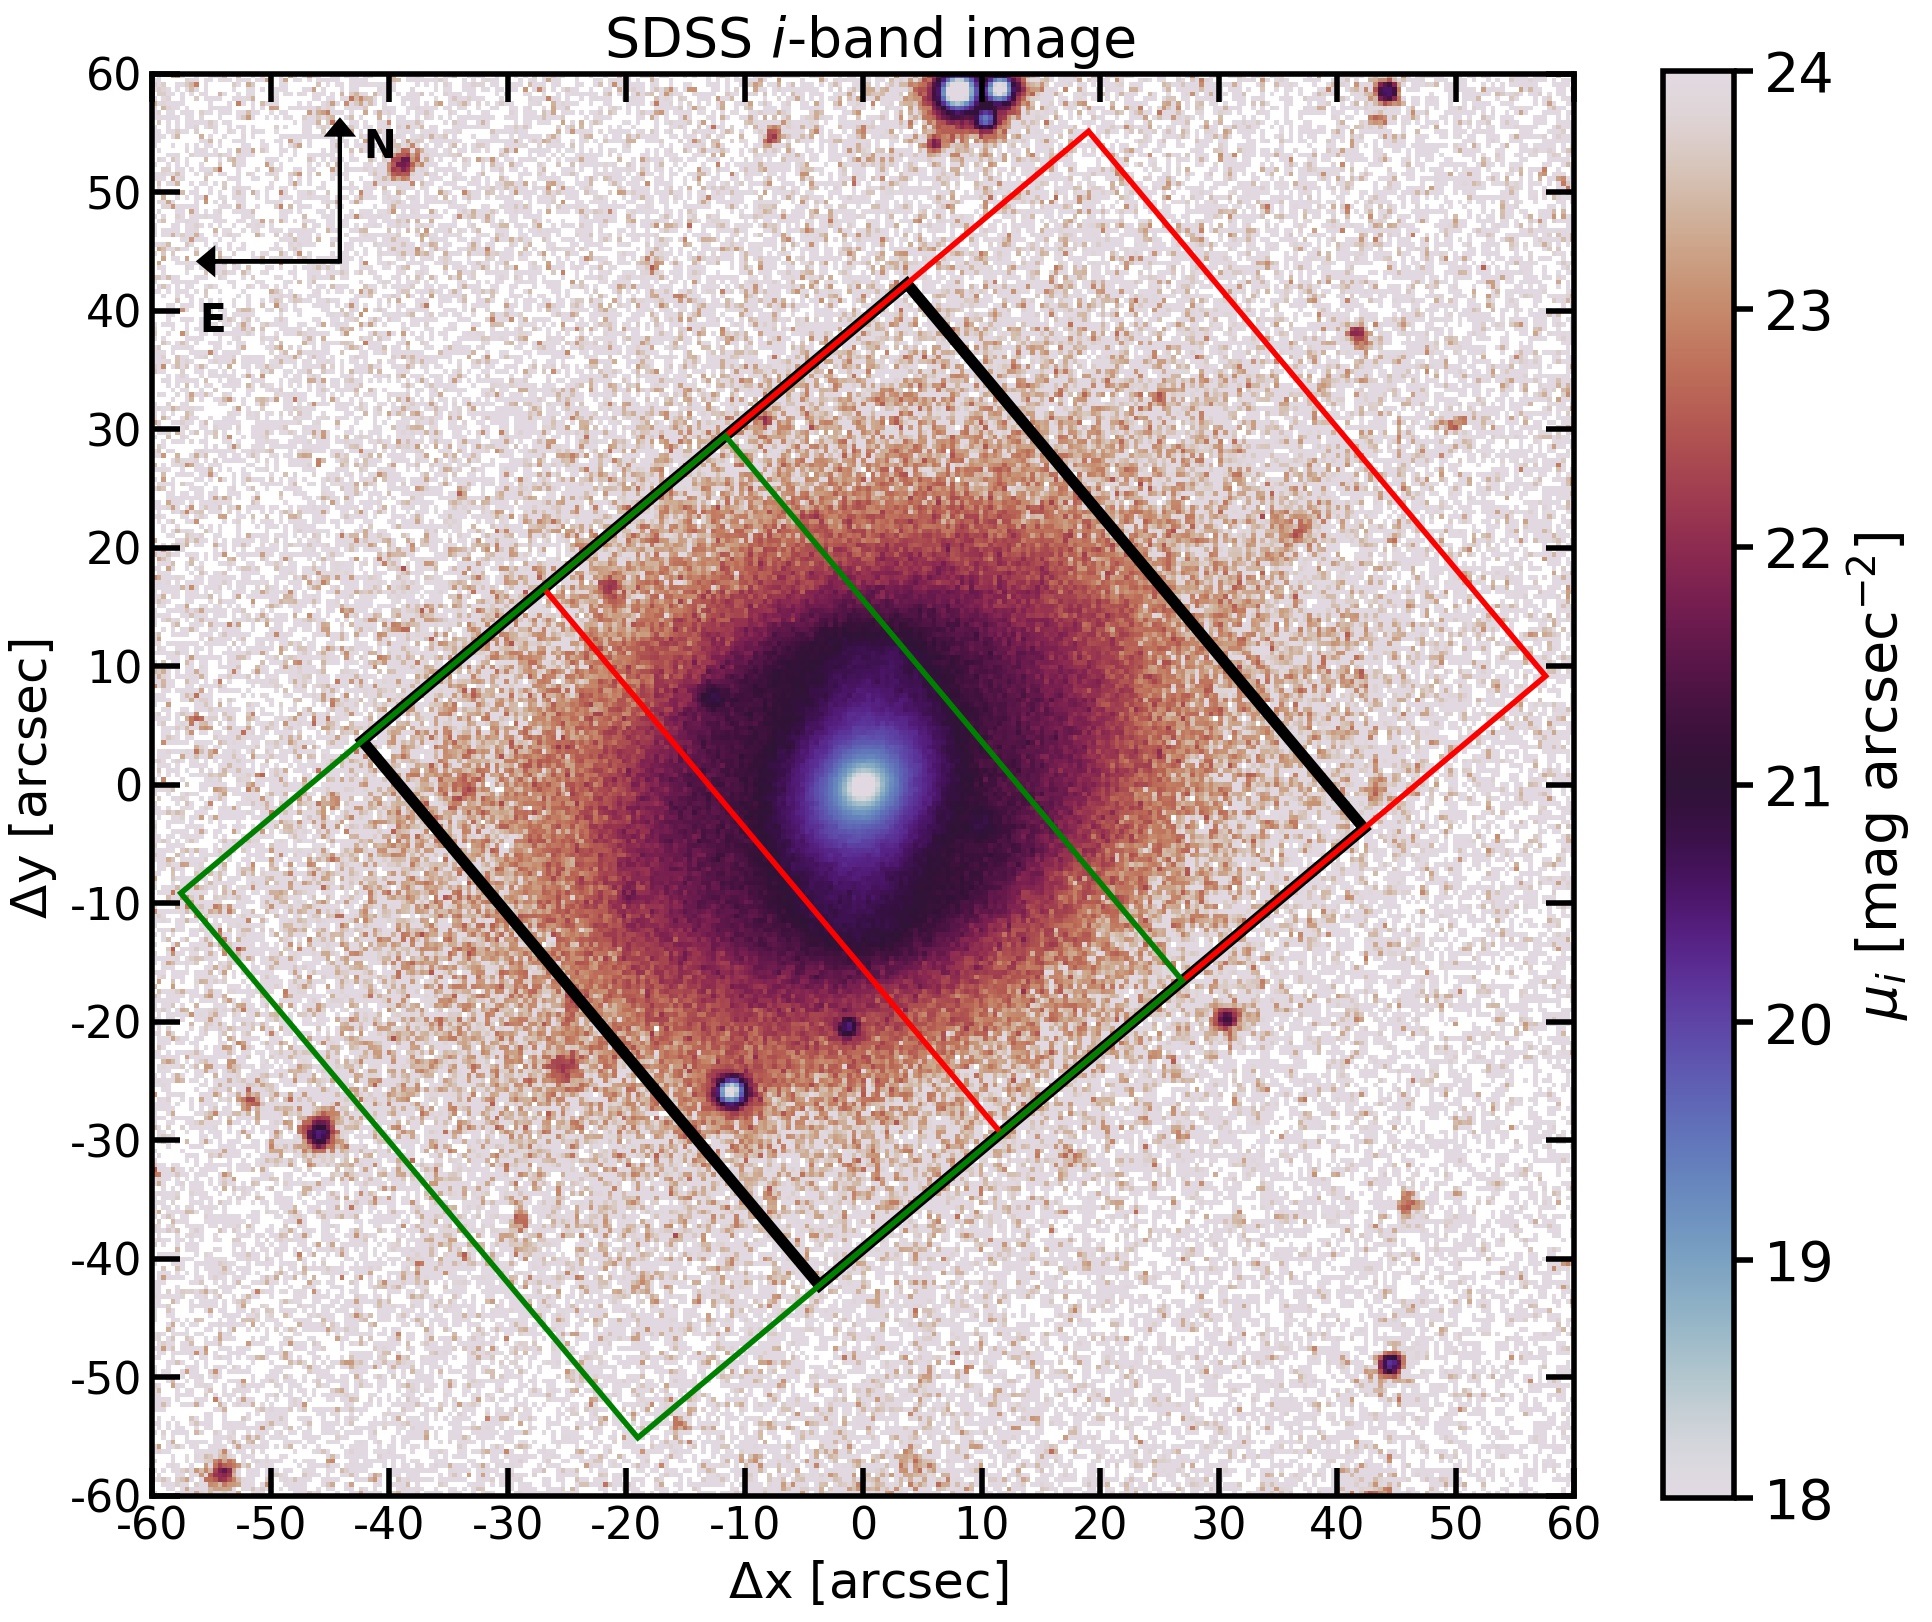
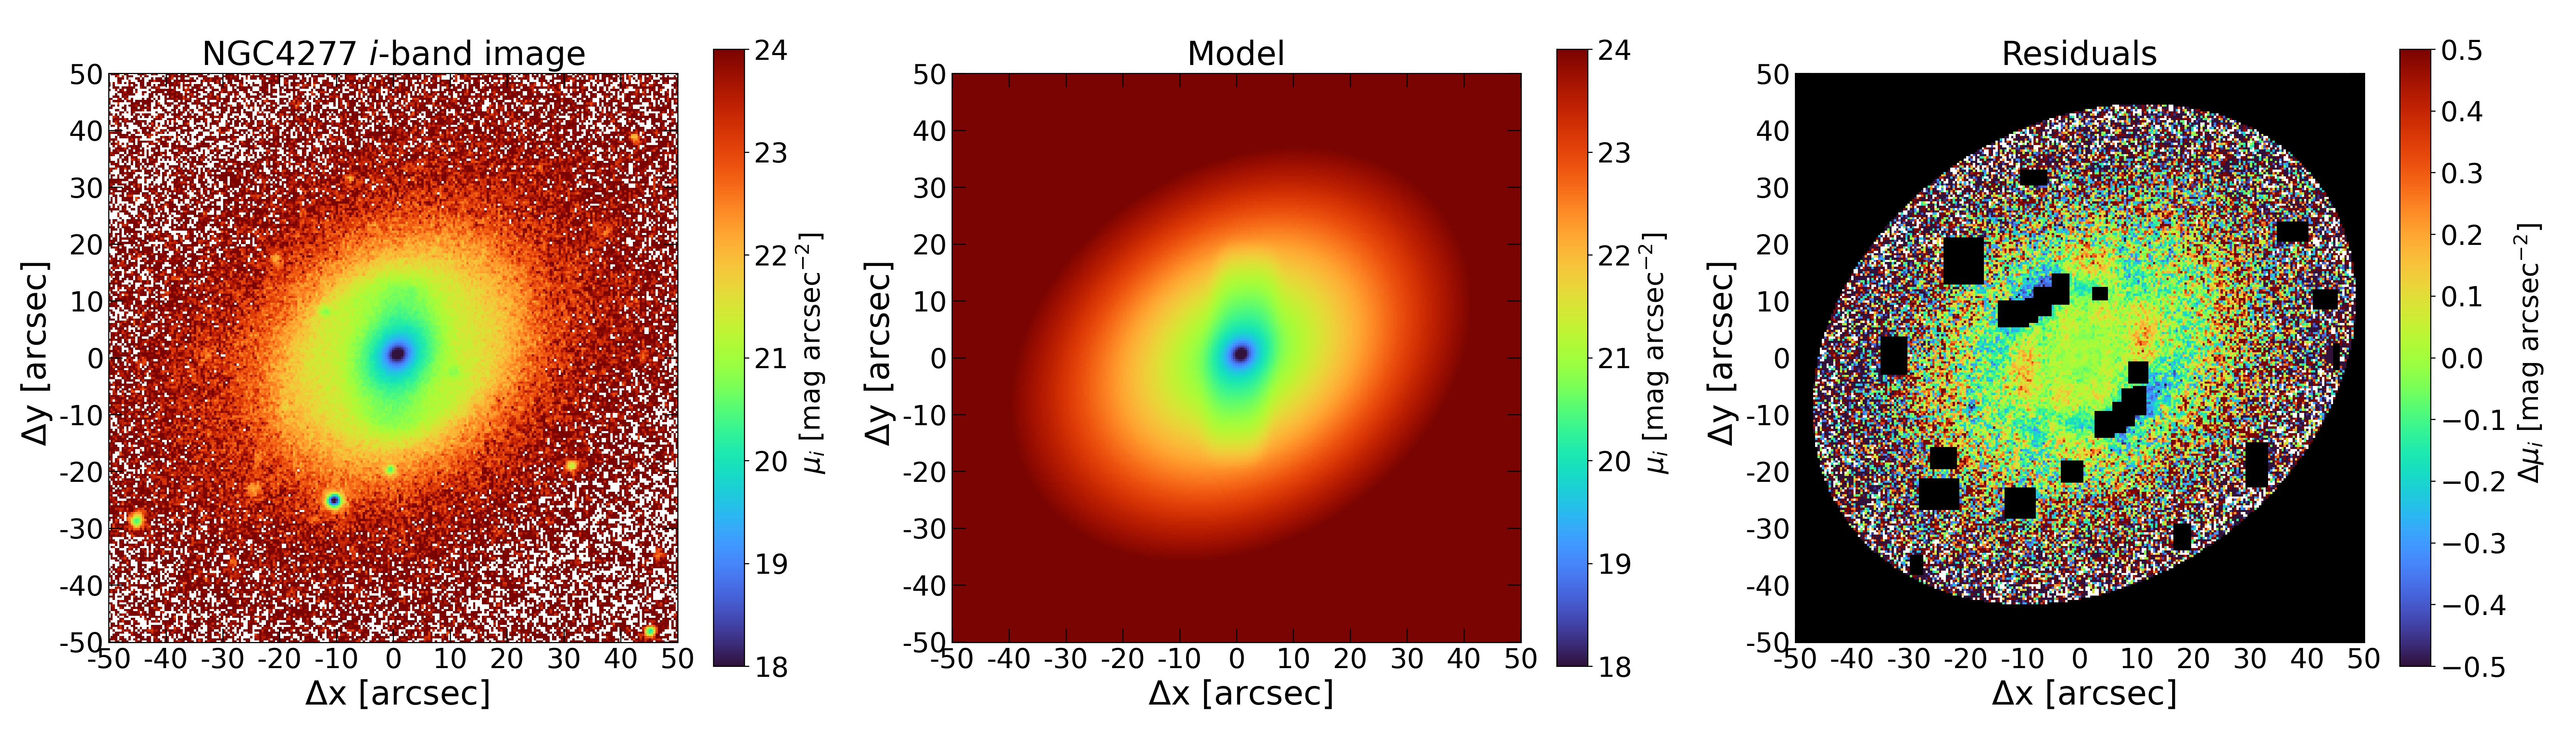
The lenticular barred galaxy NGC 4277 is an ideal target for the application of the TW method to accurately measure . It has an intermediate inclination, its bar is oriented at an intermediate angle between the major and minor axes of the disc, and it shows no evidence of spiral arms or patchy dust (Fig. 1). NGC 4277 is classified as SBa by Binggeli et al. (1985), SAB(rs)0/a by de Vaucouleurs et al. (1991, hereafter RC3), SB00 by Baillard et al. (2011), and SAB(rs)0+ by Buta et al. (2015). It has an apparent magnitude mag (RC3), which corresponds to a total absolute corrected magnitude mag, obtained adopting a distance Mpc from the systemic velocity with respect to the cosmic microwave background reference frame km s-1 (Fixsen et al., 1996) and assuming km s-1 Mpc-1. The stellar mass is M⊙ with a lower limit for the H i mass of M⊙ for the adopted distance (van Driel et al., 2016). The galaxy possibly forms an interacting pair with NGC 4273 (Kim et al., 2014). The latter lies at a projected distance of 19 and it is located at a distance Mpc. The two galaxies are both classified as possible members of the Virgo cluster (Kim et al., 2014).
3 Observations and data reduction
We carried out the spectroscopic observations of NGC 4277 in service mode on 20 March 2015 (Prog. Id. 094.B-0241(A); P.I.: E.M. Corsini) with the Multi Unit Spectroscopic Explorer (MUSE, Bacon et al., 2010) of the European Southern Observatory. We configured MUSE in wide field mode to ensure a nominal field of view (FOV) of with a spatial sampling of pixel-1 and to cover the wavelength range of 4800 – 9300 Å with a spectral sampling of 1.25 Å pixel-1 and an average nominal spectral resolution of Å. We split the observations into two observing blocks (OBs) to map the entire galaxy along its photometric major axis. We organised each OB to perform four pointings. The first pointing was centred on the nucleus, the second one on a blank sky region at a few arcmins from the galaxy, and the third and fourth ones were an eastward and westward offset along the galaxy’s major axis taken at a distance of from the galactic nucleus, respectively (Fig. 1). The mean value of the seeing during the observations was . We performed the standard data reduction with the MUSE pipeline (Weilbacher et al., 2016) under the esoreflex environment (Freudling et al., 2013) to obtain the combined datacube of NGC 4277. Finally, we subtracted the residual sky signal following Cuomo et al. (2019a). In addition to spectroscopic data, we retrieved the flux-calibrated -band image of NGC 4277 from the science archive of Sloan Digital Sky Survey (SDSS) Data Release 14 (Abolfathi et al., 2018) and subtracted the residual sky level as was done in Morelli et al. (2016).
4 Data analysis and results
4.1 Bar length and strength
We performed the isophotal analysis of the -band image of NGC 4277 using the ellipse task in iraf (Jedrzejewski, 1987). We fitted the galaxy isophotes with ellipses fixing the centre coordinates after checking they do not vary within the uncertainties. The radial profiles of the azimuthally averaged surface brightness, , position angle, PA, and ellipticity, , are shown in Fig. A1 (left panels) as a function of the semi-major axis of the ellipses, . These profiles show the typical trends observed in barred galaxies (e.g. Aguerri et al., 2000): exhibits a local maximum and the PA is nearly constant in the bar region, while and PA are both constant in the disc region. We estimated the mean geometric parameters of the disc (, ) in the radial range following the prescriptions by Cuomo et al. (2019a). We assumed that the disc is infinitesimally thin to estimate the galaxy inclination . We adopted the disc geometric parameters to deproject the galaxy image and then we fitted ellipses to the resulting isophotes. We measured the bar length as the radius where the PA changes by from the PA of the ellipse with the maximum , as in Aguerri et al. (2009).
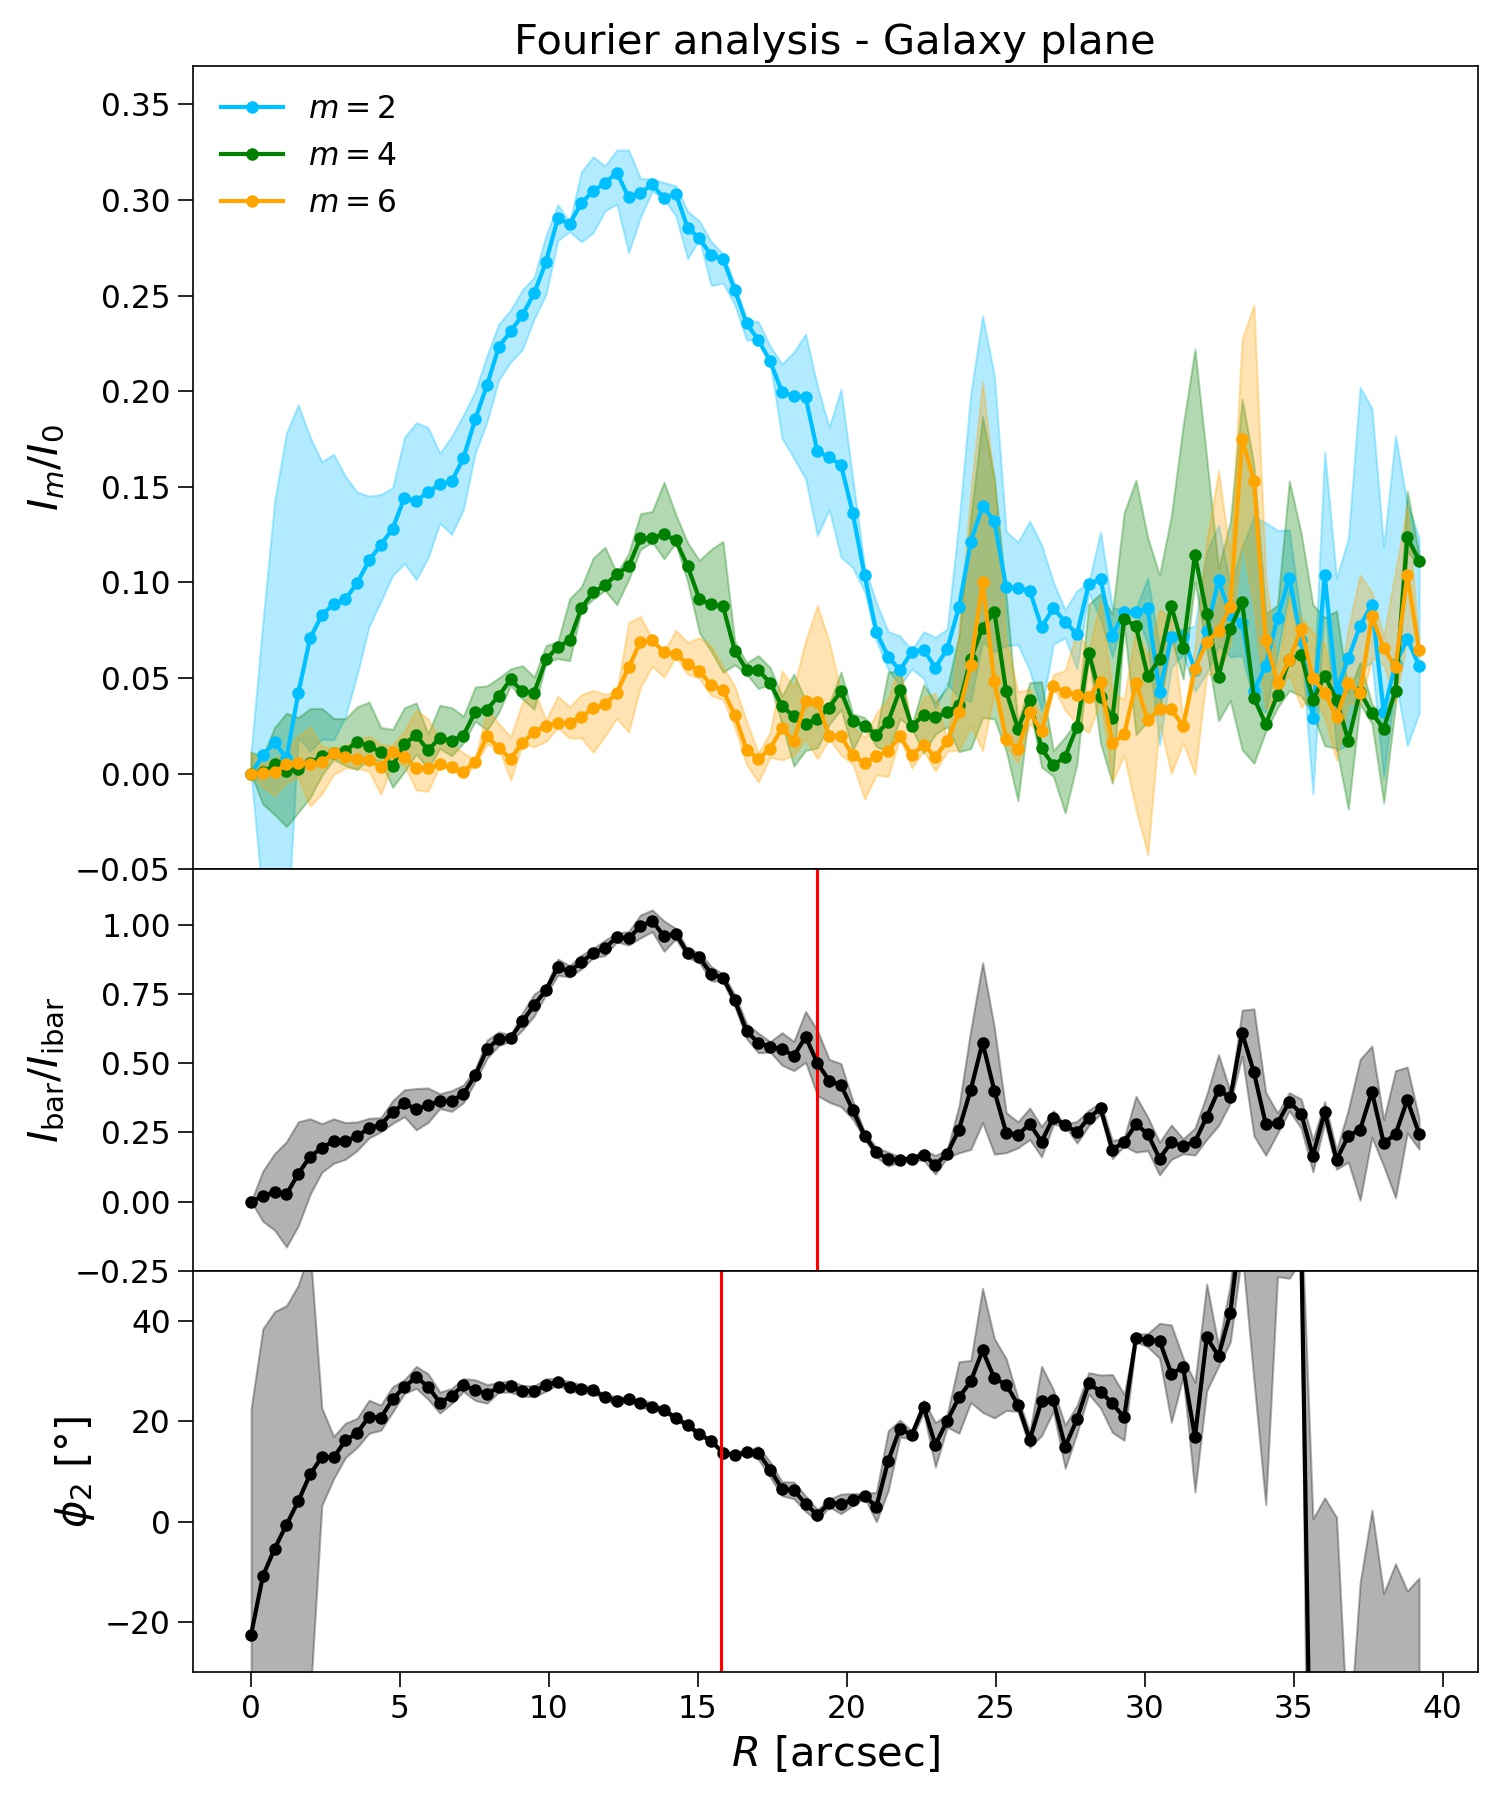
We then analysed the deprojected -band image of NGC 4277 to carry out the Fourier analysis of the azimuthal surface-brightness distribution of the galaxy. We derived the radial profiles of the amplitudes of the Fourier components and of the phase angle of the Fourier component as was done in Aguerri et al. (2000). They displayed the same behaviour as measured in other galaxies hosting an elongated bi-symmetric bar (e.g. Ohta et al., 1990): the amplitudes of the even Fourier components are larger than those of the odd ones, with the component having a prominent peak and constant phase angle in the bar region. The radial profiles of the relative amplitudes of the Fourier components are shown in Fig. A1 (right panels). We measured the bar length from the bar-interbar intensity ratio derived from the amplitudes of the Fourier components (Aguerri et al., 2000) and from the analysis of the phase angle (Debattista et al., 2002). We also estimated the bar strength from the mean value of the ratio over the bar extension as in Athanassoula & Misiriotis (2002).
We derived the structural parameters of NGC 4277 by performing a photometric decomposition of the -band image with the gasp2d algorithm (Méndez-Abreu et al., 2008, 2017). We adopted a Sérsic bulge (Sérsic, 1968), a double-exponential disc (Méndez-Abreu et al., 2017), and a Ferrers bar (Aguerri et al. 2009) to model the galaxy surface-brightness distribution. The best-fitting values of the structural parameters, including the length and axial ratio of the bar (, ), were constrained by performing a minimisation, accounting for the photon noise, read-out noise, and point spread function of the image. The best-fitting values together with their errors, which we estimated by analysing a sample of images of mock galaxies built with Monte Carlo simulations, are reported in Table LABEL:tab:gasp2d. The results of the photometric decomposition of NGC 4277 obtained with gasp2d are shown in Fig. C1.
We adopted the mean of , , , and as the length of the bar and we calculated its error as the difference with respect to highest and lowest measured value. This gives , which corresponds to kpc at the assumed distance. We compared this value with the typical bar length of SB0 galaxies measured by Aguerri et al. (2009) and we conclude that NGC 4277 hosts a short bar. We derived the bar strength from the ellipticity at measured on the deprojected galaxy image following Aguerri et al. (2009). We took the mean value of and and their semi-difference as the strength of the bar and its error, respectively. This gives , which means that the bar of NGC 4277 is weak according to the classification of Cuomo et al. (2019b).
4.2 Stellar kinematics and circular velocity
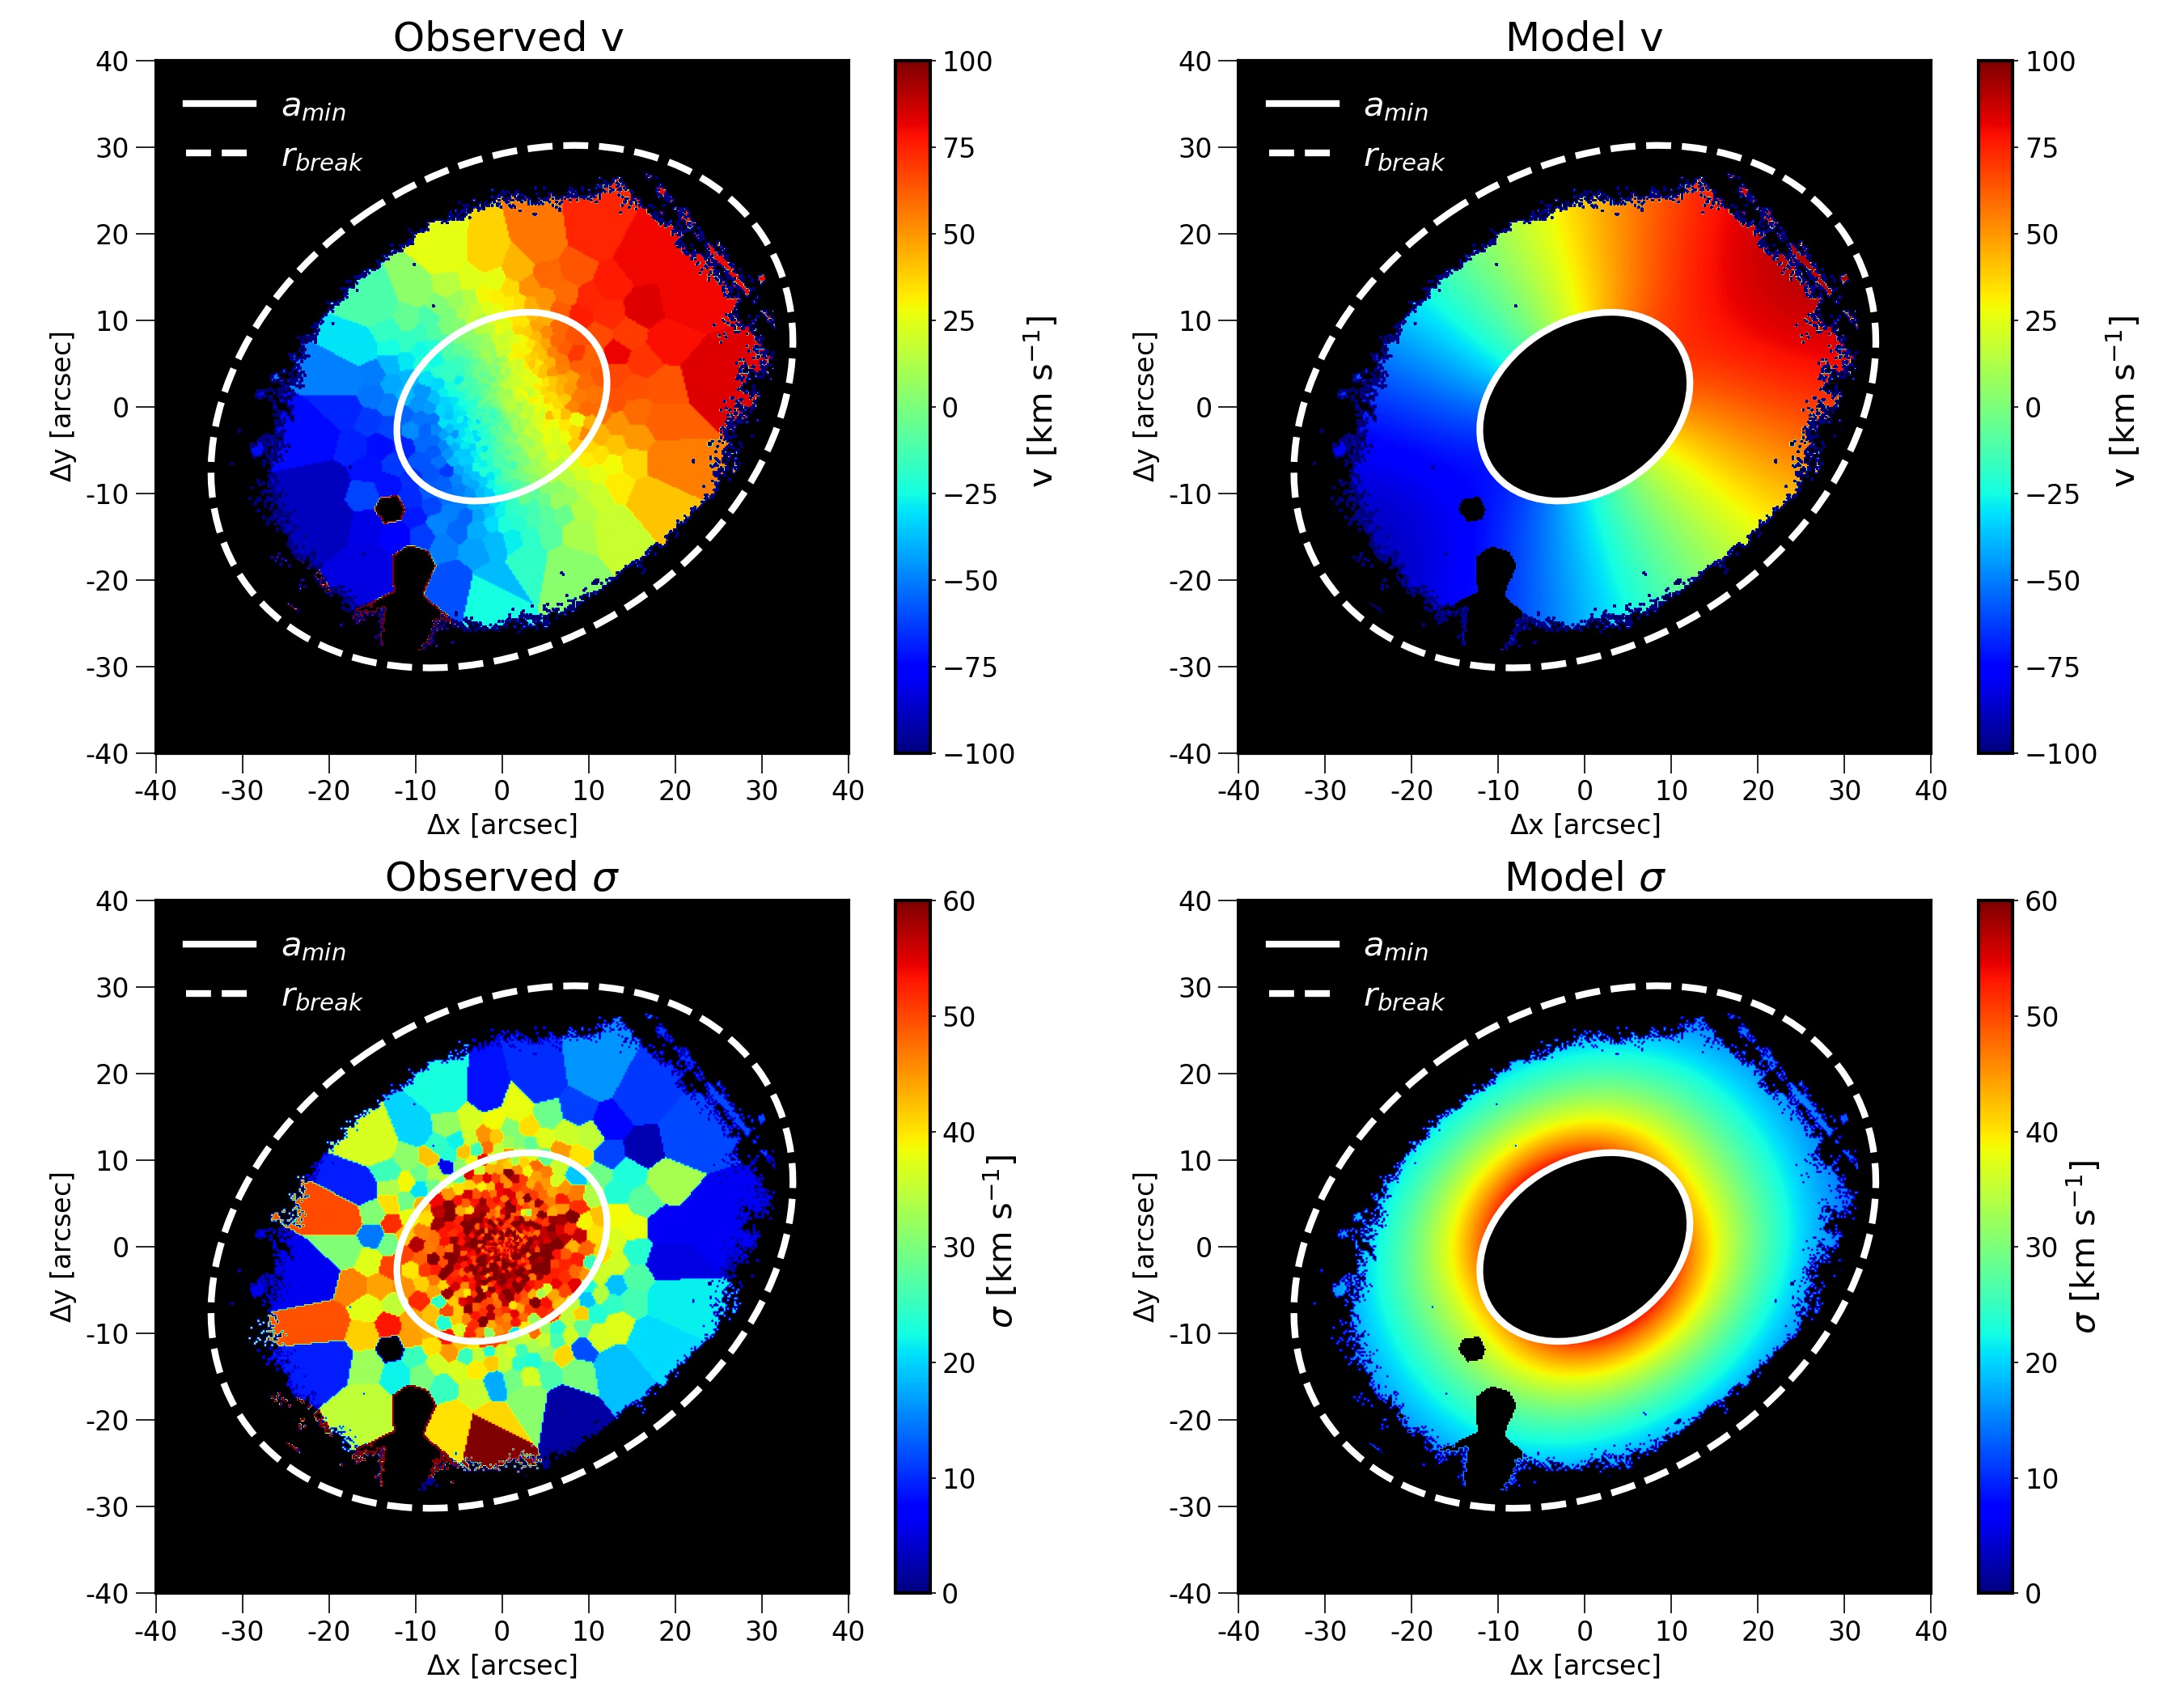
We measured the stellar and ionised-gas kinematics of NGC 4277 from the sky-cleaned MUSE datacube using the ppxf (Cappellari & Emsellem, 2004) and gandalf (Sarzi et al., 2006) algorithms. We spatially binned the datacube spaxels with the adaptive algorithm of Cappellari & Copin (2003) based on Voronoi tessellation to obtain a target per bin. We used the ELODIE library ( km s-1, Prugniel & Soubiran 2001) in the wavelength range 4800 – 5600 Å centred on the Mg i absorption-line triplet and including the [O iii] and [N i] emission-line doublets. The maps of the LOS velocity and velocity dispersion of the stellar component are shown in Fig. D1. We estimated the errors on and from formal errors of the ppxf best fit as was done in Corsini et al. (2018); they range between 1 and 18 km s-1. We calculated the residual noise as the standard deviation of the difference between the galaxy and the best-fitting stellar spectrum. Finally, we simultaneously fitted the ionised-gas emission lines with Gaussian functions. We did not detect any emission line, except for a few isolated spatial bins in the disc region. In these bins, the signal-to-residual noise of the emission lines is .
We derived the circular speed km s-1 from the stellar LOS velocity and velocity dispersion maps using the asymmetric drift equation (Binney & Tremaine, 1987) as was done in Debattista et al. (2002). We assumed the radial, azimuthal, and vertical components of the velocity dispersion having exponential radial profiles with the same scalelength, but different central values and following the epicyclic approximation. We also adopted a constant circular velocity. For our dynamical model, we selected all the spatial bins within the elliptical annulus mapping the inner disc and characterised by (corresponding to the projection of the bar length along the disc major axis), (corresponding to the disc break radius), and . We adopted the scalelength of the inner disc () from the photometric decomposition. The comparison between the observed and modelled kinematic maps to derive is shown in Fig. D1.
4.3 Bar pattern speed
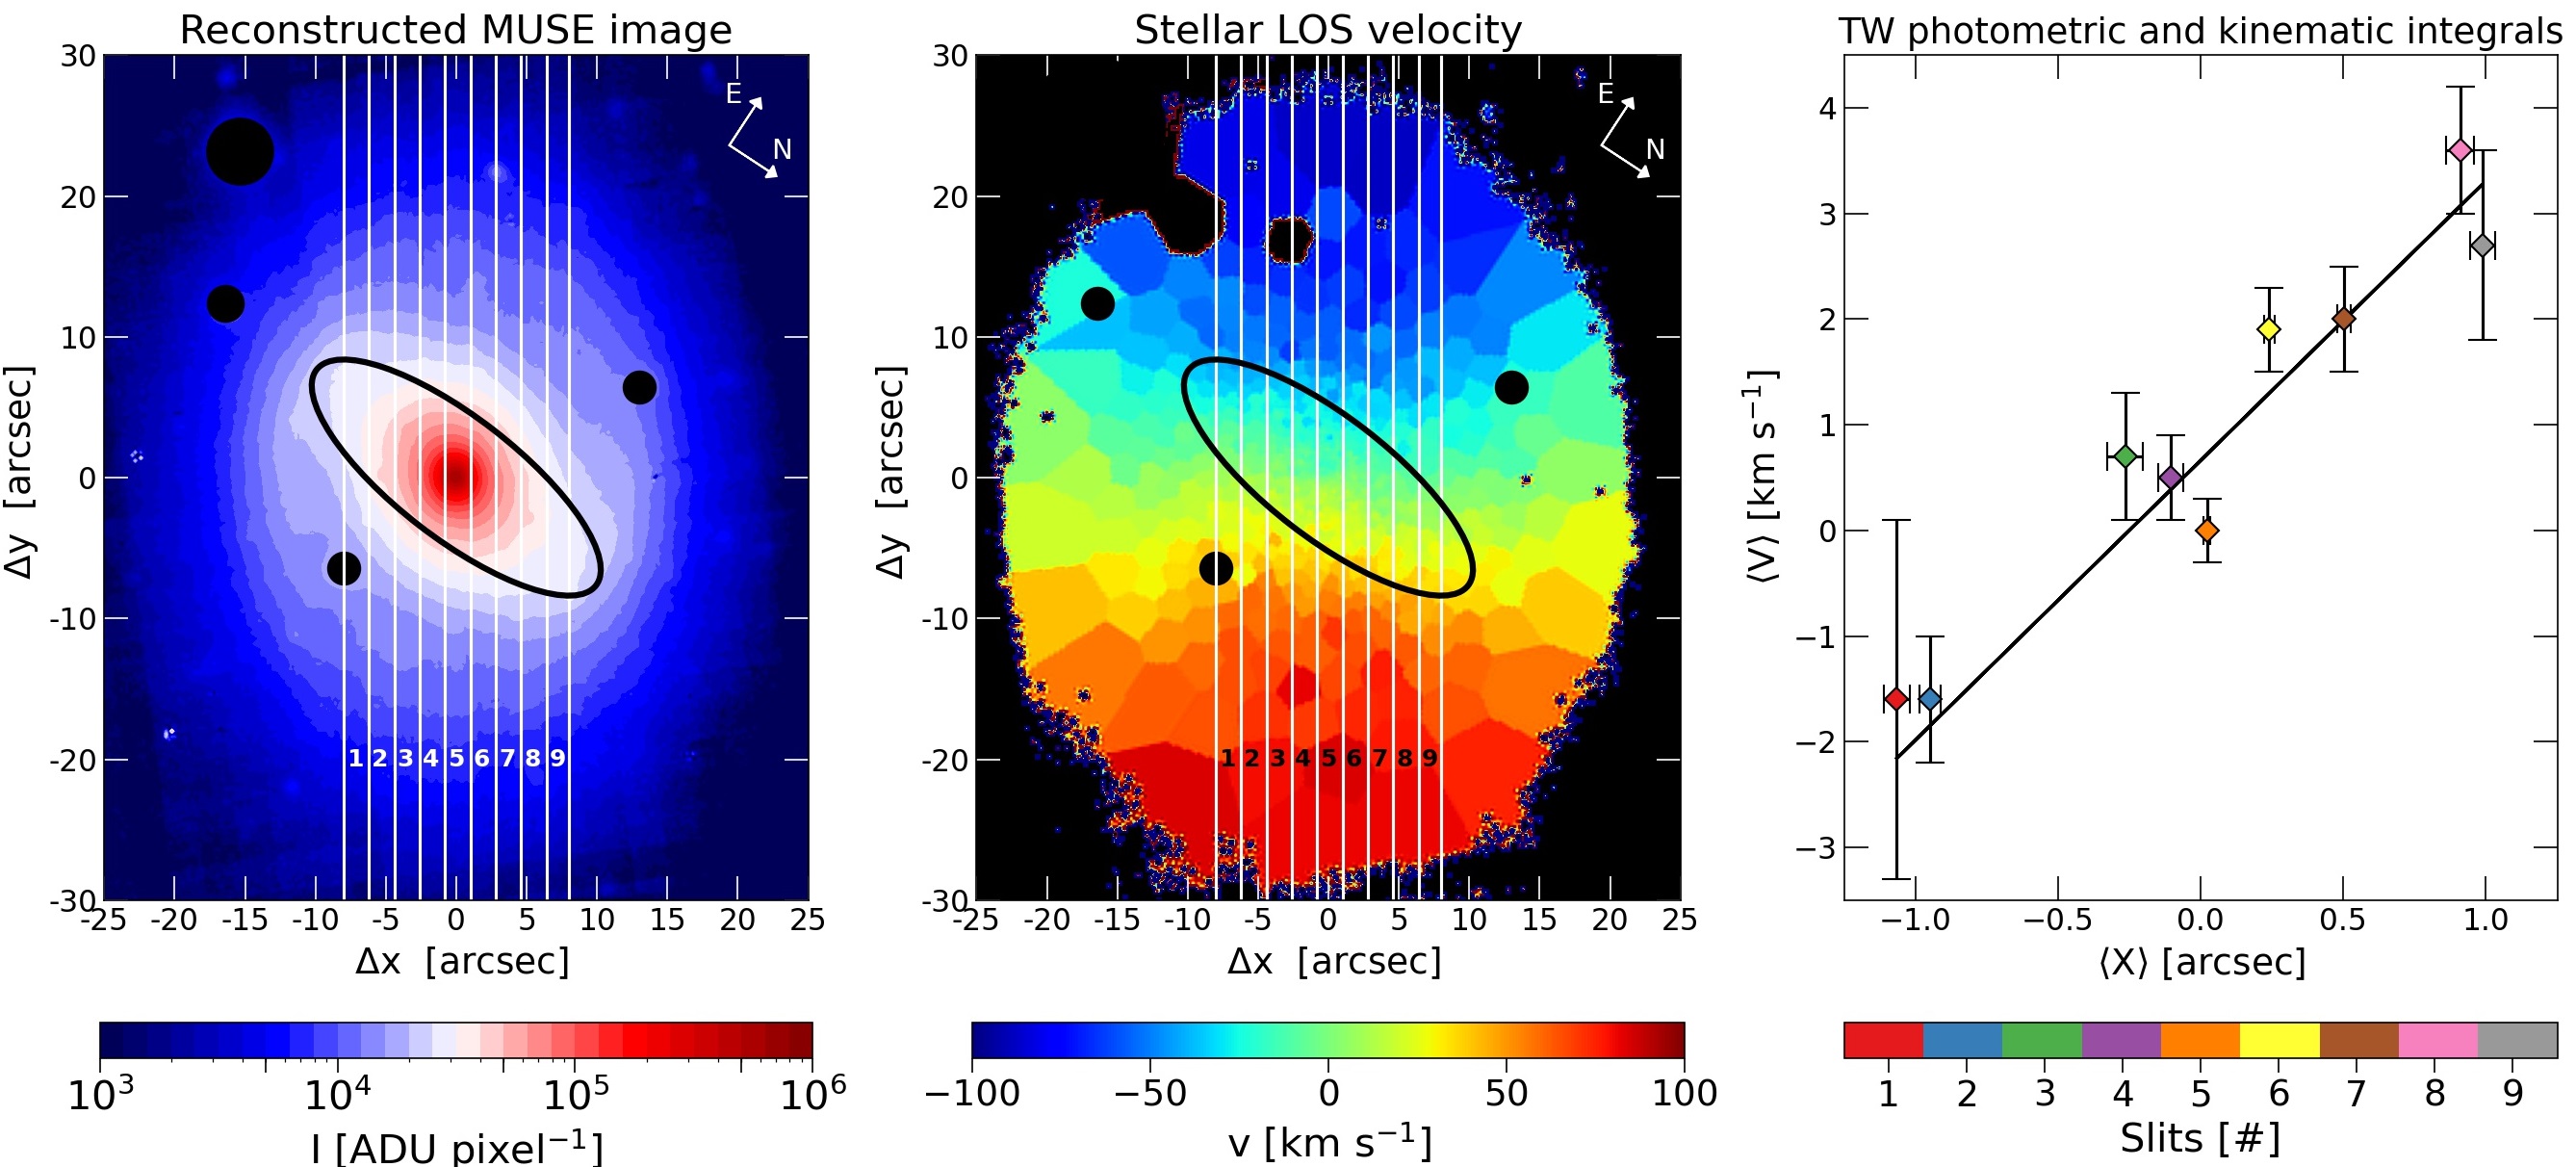
We applied the TW method to the sky-cleaned MUSE datacube of NGC 4277 to measure its bar pattern speed. We defined nine adjacent pseudo-slits crossing the bar and aligned with the disc. They have a width of nine pixels () to account for seeing smearing effects and a half length of 175 pixels () to cover the extension of the inner disc, and .
We derived the photometric integrals from the MUSE reconstructed image, which we obtained by summing the MUSE datacube along the spectral direction in the same wavelength range adopted to measure the stellar kinematics. In each pseudo-slit, we measured the luminosity-weighted position of the stars with respect to the galaxy minor axis as follows:
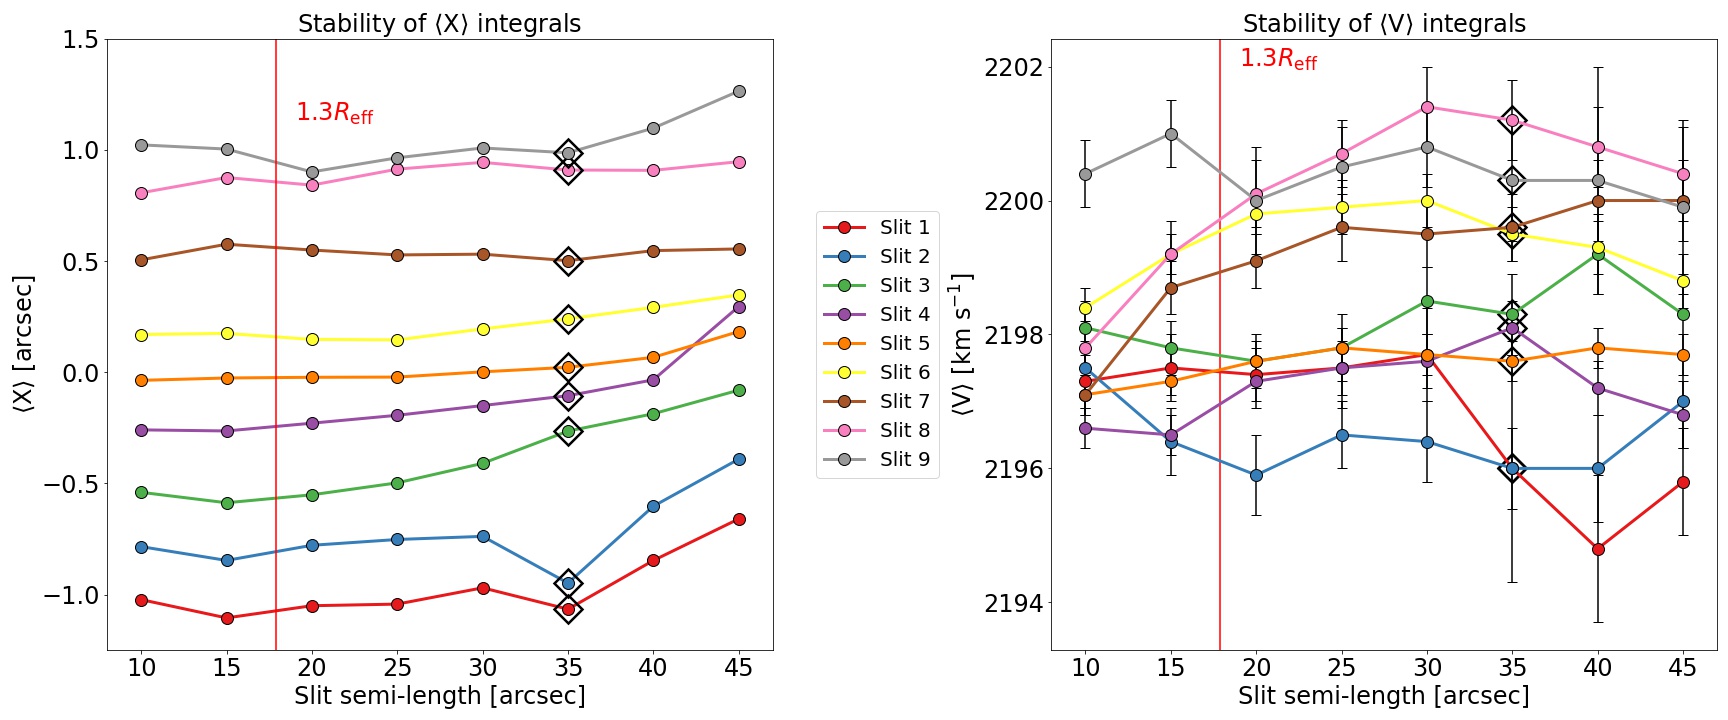
where and are the sky-plane coordinates and flux of the pixels in the pseudo-slit, respectively, and dist is the distance of the pixels to the pseudo-slit centre (Fig. 2, left panel). We adopted the -band SDSS Petrosian radius as the galaxy effective radius and we checked the convergence of the integrals by measuring their values for different pseudo-slit lengths ranging from to (Fig. E1, left panel). In this radial range, are expected to be constant (Zou et al., 2019); we adopted their root mean square as the error on .
We derived the kinematic integrals subtracted of the galaxy systemic velocity in the same wavelength range adopted for the stellar kinematics. We summed all the spaxels of each pseudo-slit to obtain a single spectrum from which we measured the luminosity-weighted stellar LOS velocity with ppxf. This is equivalent to calculating the following:
where and are the coordinate of the spaxels in the pseudo-slit and their stellar LOS velocity, respectively (Fig. 2, central panel). We adopted the rescaled formal errors by ppxf as a error on . We checked the convergence of integrals by measuring their values as a function of the pseudo-slit length as was done for the photometric integrals (Fig. E1, right panel).
Using the fitexy routine in idl, we fitted the and integrals with a straight line with a slope km s-1 arcsec-1 (Fig. 2, right panel). From the galaxy inclination, we obtained km s-1 arcsec-1, which corresponds to km s-1 kpc-1. We calculated the co-rotation radius from the bar pattern speed and circular velocity as , which corresponds to kpc with the error estimated from the propagation of uncertainty. Finally, we derived the rotation rate with the error estimated from a Monte Carlo simulation to account for the errors on , , and . We conclude that NGC 4277 hosts a slow bar and this result does not depend on the distance of the galaxy.
5 Conclusions
We measured the broad-band surface photometry and two-dimensional stellar kinematics of NGC 4277, a barred lenticular galaxy at 33.9 Mpc in the region of the Virgo cluster, to derive the pattern speed of its bar ( km s-1 kpc-1) and the ratio of the co-rotation radius to the bar length (). NGC 4277 hosts a weak () and short bar ( kpc), which falls short of the co-rotation radius ( kpc). This is a remarkable result and we carefully handled the sources of error affecting the measurements of the TW integrals by combining the deep SDSS imaging to the wide-field and fine spatially sampled MUSE spectroscopy. As a consequence, the values of and of NGC 4277 are amongst the best-constrained ones ever obtained with the TW method with relative statistical errors of . These results hold even if we adopt the galaxy inclination for a thick (with an axial ratio , Mosenkov et al. 2015) rather than infinitesimally-thin stellar disc. Indeed, the systematic difference between the inclination-dependent parameters is much smaller than their statistical errors.
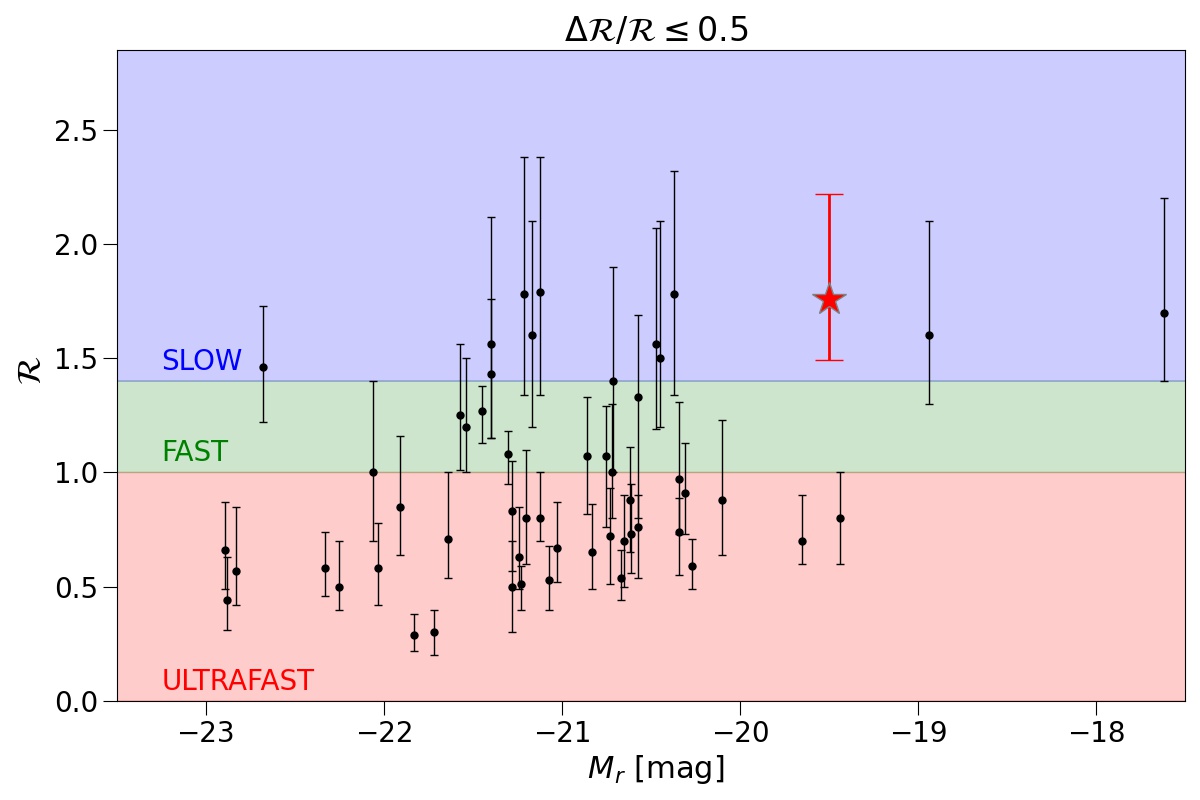
We show in Fig. 3 all the galaxies for which has been measured with the TW method and with a well-constrained rotation rate (, Cuomo et al. 2020). Most bars are consistent with being fast within errors (), including the dwarf lenticular IC 3167 ( mag and , Cuomo et al. 2022), whose lopsided bar is twice more likely to be slow (probability of ) rather than fast (). For comparison, the probability of the bar of NGC 4277 to be slow () is ten times higher than that of being fast (). On the other hand, there are many ultra-fast bars (), although this is a non-physical result for a self-consistent bar because the stellar orbits beyond are not aligned with the bar and cannot support it. Recently, Cuomo et al. (2021) reanalysed a sub-sample of ultra-fast bars and conclude that their was underestimated because of an overestimate of .
The only other galaxy nominally hosting a stellar slow bar was manga 8317-12704 () and measured by Guo et al. (2019), who applied the TW method to the stellar kinematics of a sample of barred galaxies from the MANGA survey (Bundy et al., 2015). However, they adopted a slit semi-length equal to , which does not guarantee the convergence of TW integrals when the bar length is longer than the galaxy effective radius. Garma-Oehmichen et al. (2020) show that of manga 8317-12704 was underestimated (and thus was overestimated) because . They adopted a different PA (PA) and larger semi-length for the pseudo-slits to obtain stable TW integrals from the MANGA dataset. Garma-Oehmichen et al. (2020) found a new rotation rate for the bar of manga 8317-12704 (), which is consistent with the fast regime. The slow bars of NGC 2915 (, Bureau et al. 1999), UGC 628 (, Chemin & Hernandez 2009), and DDO 168 (, Patra & Jog 2019) cannot be safely taken into account since a gaseous tracer might not satisfy the continuity equation linking the TW integrals.
We conclude that NGC 4277 is the first clear case of a galaxy hosting a slow stellar bar ( at the confidence level) measured with the TW method. By determining the DM fraction in the bar region, it will be possible to understand whether the uncommonly large of NGC 4277 was initially imprinted by a tidal interaction with NGC 4273 triggering the bar formation (Martinez-Valpuesta et al., 2017) or whether it is the end result of the bar braking due to the dynamical friction exerted by the DM halo (Weinberg, 1985; Debattista & Sellwood, 2000; Athanassoula, 2003; Algorry et al., 2017).
Acknowledgements.
We thank the anonymous referee, whose helpful comments helped us to improve this manuscript. CB acknowledges the Jeremiah Horrocks Institute for hospitality while this Letter was in progress. CB, EMC, EDB, and AP are supported by MIUR grant PRIN 2017 20173ML3WW-001 and Padua University grants DOR2019-2021. VC is supported by Fondecyt Postdoctoral programme 2022 and by ESO-Chile Joint Committee programme ORP060/19. JALA and LC are supported by the Spanish Ministerio de Ciencia e Innovación y Universidades by the grants PID2020-119342GB-I00 and PGC2018-093499-B-I00, respectively. JMA acknowledges the support of the Viera y Clavijo Senior program funded by ACIISI and ULL.References
- Abolfathi et al. (2018) Abolfathi, B., Aguado, D. S., Aguilar, G., et al. 2018, ApJS, 235, 42
- Aguerri et al. (2003) Aguerri, J. A. L., Debattista, V. P., & Corsini, E. M. 2003, MNRAS, 338, 465
- Aguerri et al. (2009) Aguerri, J. A. L., Méndez-Abreu, J., & Corsini, E. M. 2009, A&A, 495, 491
- Aguerri et al. (2000) Aguerri, J. A. L., Muñoz-Tuñón, C., Varela, A. M., & Prieto, M. 2000, A&A, 361, 841
- Algorry et al. (2017) Algorry, D. G., Navarro, J. F., Abadi, M. G., et al. 2017, MNRAS, 469, 1054
- Athanassoula (1992) Athanassoula, E. 1992, MNRAS, 259, 345
- Athanassoula (2003) Athanassoula, E. 2003, MNRAS, 341, 1179
- Athanassoula et al. (2013) Athanassoula, E., Machado, R. E. G., & Rodionov, S. A. 2013, MNRAS, 429, 1949
- Athanassoula & Misiriotis (2002) Athanassoula, E. & Misiriotis, A. 2002, MNRAS, 330, 35
- Bacon et al. (2010) Bacon, R., Accardo, M., Adjali, L., et al. 2010, in SPIE Conference Series, Vol. 7735, Ground-based and Airborne Instrumentation for Astronomy III, ed. I. S. McLean, S. K. Ramsay, & H. Takami, 773508
- Baillard et al. (2011) Baillard, A., Bertin, E., de Lapparent, V., et al. 2011, A&A, 532, A74
- Banerjee et al. (2013) Banerjee, A., Patra, N. N., Chengalur, J. N., & Begum, A. 2013, MNRAS, 434, 1257
- Binggeli et al. (1985) Binggeli, B., Sandage, A., & Tammann, G. A. 1985, AJ, 90, 1681
- Binney & Tremaine (1987) Binney, J. & Tremaine, S. 1987, Galactic Dynamics (Princeton: Princeton University Press)
- Bundy et al. (2015) Bundy, K., Bershady, M. A., Law, D. R., et al. 2015, ApJ, 798, 7
- Bureau et al. (1999) Bureau, M., Freeman, K. C., Pfitzner, D. W., & Meurer, G. R. 1999, AJ, 118, 2158
- Buta et al. (2015) Buta, R. J., Sheth, K., Athanassoula, E., et al. 2015, ApJS, 217, 32
- Buta & Zhang (2009) Buta, R. J. & Zhang, X. 2009, ApJS, 182, 559
- Caon et al. (1993) Caon, N., Capaccioli, M., & D’Onofrio, M. 1993, MNRAS, 265, 1013
- Cappellari & Copin (2003) Cappellari, M. & Copin, Y. 2003, MNRAS, 342, 345
- Cappellari & Emsellem (2004) Cappellari, M. & Emsellem, E. 2004, PASP, 116, 138
- Chemin & Hernandez (2009) Chemin, L. & Hernandez, O. 2009, A&A, 499, L25
- Chilingarian et al. (2010) Chilingarian, I. V., Melchior, A.-L., & Zolotukhin, I. Y. 2010, MNRAS, 405, 1409
- Corsini (2011) Corsini, E. M. 2011, Mem. Soc. Astron. It. Sup., 18, 23
- Corsini et al. (2018) Corsini, E. M., Morelli, L., Zarattini, S., et al. 2018, A&A, 618, A172
- Costantin et al. (2017) Costantin, L., Méndez-Abreu, J., Corsini, E. M., et al. 2017, A&A, 601, A84
- Cuomo et al. (2020) Cuomo, V., Aguerri, J. A. L., Corsini, E. M., & Debattista, V. P. 2020, A&A, 641, A111
- Cuomo et al. (2019a) Cuomo, V., Corsini, E. M., Aguerri, J. A. L., et al. 2019a, MNRAS, 488, 4972
- Cuomo et al. (2022) Cuomo, V., Corsini, E. M., Morelli, L., et al. 2022, arXiv e-prints, arXiv:2206.06548
- Cuomo et al. (2021) Cuomo, V., Lee, Y. H., Buttitta, C., et al. 2021, A&A, 649, A30
- Cuomo et al. (2019b) Cuomo, V., Lopez Aguerri, J. A., Corsini, E. M., et al. 2019b, A&A, 632, A51
- de Vaucouleurs et al. (1991) de Vaucouleurs, G., de Vaucouleurs, A., Corwin, Jr., H. G., et al. 1991, Third Reference Catalogue of Bright Galaxies (New York: Springer)
- Debattista (2003) Debattista, V. P. 2003, MNRAS, 342, 1194
- Debattista et al. (2002) Debattista, V. P., Corsini, E. M., & Aguerri, J. A. L. 2002, MNRAS, 332, 65
- Debattista & Sellwood (1998) Debattista, V. P. & Sellwood, J. A. 1998, ApJL, 493, L5
- Debattista & Sellwood (2000) Debattista, V. P. & Sellwood, J. A. 2000, ApJ, 543, 704
- Fixsen et al. (1996) Fixsen, D. J., Cheng, E. S., Gales, J. M., et al. 1996, ApJ, 473, 576
- Font et al. (2011) Font, J., Beckman, J. E., Epinat, B., et al. 2011, ApJL, 741, L14
- Font et al. (2014) Font, J., Beckman, J. E., Querejeta, M., et al. 2014, ApJS, 210, 2
- Fragkoudi et al. (2016) Fragkoudi, F., Athanassoula, E., & Bosma, A. 2016, MNRAS, 462, L41
- Freudling et al. (2013) Freudling, W., Romaniello, M., Bramich, D. M., et al. 2013, A&A, 559, A96
- Garma-Oehmichen et al. (2020) Garma-Oehmichen, L., Cano-Díaz, M., Hernández-Toledo, H., et al. 2020, MNRAS, 491, 3655
- Guo et al. (2019) Guo, R., Mao, S., Athanassoula, E., et al. 2019, MNRAS, 482, 1733
- Jedrzejewski (1987) Jedrzejewski, R. I. 1987, MNRAS, 226, 747
- Kim et al. (2014) Kim, S., Rey, S.-C., Jerjen, H., et al. 2014, ApJS, 215, 22
- Kormendy & Kennicutt (2004) Kormendy, J. & Kennicutt, Robert C., J. 2004, ARA&A, 42, 603
- Marinova & Jogee (2007) Marinova, I. & Jogee, S. 2007, ApJ, 659, 1176
- Martinez-Valpuesta et al. (2017) Martinez-Valpuesta, I., Aguerri, J. A. L., González-García, A. C., Dalla Vecchia, C., & Stringer, M. 2017, MNRAS, 464, 1502
- Méndez-Abreu et al. (2008) Méndez-Abreu, J., Aguerri, J. A. L., Corsini, E. M., & Simonneau, E. 2008, A&A, 478, 353
- Méndez-Abreu et al. (2018) Méndez-Abreu, J., Aguerri, J. A. L., Falcón-Barroso, J., et al. 2018, MNRAS, 474, 1307
- Méndez-Abreu et al. (2017) Méndez-Abreu, J., Ruiz-Lara, T., Sánchez-Menguiano, L., et al. 2017, A&A, 598, A32
- Morelli et al. (2016) Morelli, L., Parmiggiani, M., Corsini, E. M., et al. 2016, MNRAS, 463, 4396
- Mosenkov et al. (2015) Mosenkov, A. V., Sotnikova, N. Y., Reshetnikov, V. P., Bizyaev, D. V., & Kautsch, S. J. 2015, MNRAS, 451, 2376
- Ohta et al. (1990) Ohta, K., Hamabe, M., & Wakamatsu, K.-I. 1990, ApJ, 357, 71
- Patra & Jog (2019) Patra, N. N. & Jog, C. J. 2019, MNRAS, 488, 4942
- Pérez et al. (2012) Pérez, I., Aguerri, J. A. L., & Méndez-Abreu, J. 2012, A&A, 540, A103
- Petersen et al. (2019) Petersen, M. S., Weinberg, M. D., & Katz, N. 2019, MNRAS, 490, 3616
- Prugniel & Soubiran (2001) Prugniel, P. & Soubiran, C. 2001, A&A, 369, 1048
- Puerari & Dottori (1997) Puerari, I. & Dottori, H. 1997, ApJ, 476, L73
- Rautiainen et al. (2008) Rautiainen, P., Salo, H., & Laurikainen, E. 2008, MNRAS, 388, 1803
- Sarzi et al. (2006) Sarzi, M., Falcón-Barroso, J., Davies, R. L., et al. 2006, MNRAS, 366, 1151
- Schlafly & Finkbeiner (2011) Schlafly, E. F. & Finkbeiner, D. P. 2011, ApJ, 737, 103
- Sellwood (2014) Sellwood, J. A. 2014, Reviews of Modern Physics, 86, 1
- Sérsic (1968) Sérsic, J. L. 1968, Atlas de Galaxias Australes (Cordoba: Observatorio Astronomico de Cordoba)
- Tremaine & Weinberg (1984) Tremaine, S. & Weinberg, M. D. 1984, ApJL, 282, L5
- van Driel et al. (2016) van Driel, W., Butcher, Z., Schneider, S., et al. 2016, A&A, 595, A118
- Weilbacher et al. (2016) Weilbacher, P. M., Streicher, O., & Palsa, R. 2016, MUSE-DRP: MUSE Data Reduction Pipeline, Astrophysics Source Code Library, record ascl:1610.004
- Weinberg (1985) Weinberg, M. D. 1985, MNRAS, 213, 451
- Weiner et al. (2001) Weiner, B. J., Sellwood, J. A., & Williams, T. B. 2001, ApJL, 546, 931
- Zhang & Buta (2007) Zhang, X. & Buta, R. J. 2007, AJ, 133, 2584
- Zou et al. (2019) Zou, Y., Shen, J., Bureau, M., & Li, Z.-Y. 2019, ApJ, 884, 23
Appendix A Isophotal analysis

We analysed the flux-calibrated and sky-subtracted -band image of NGC 4277. The choice of -band ensured that we reached a sufficient spatial resolution () and depth ( mag arcsec-2), and minimised the dust effects with respect to the other SDSS passbands to characterise the bar component with an accurate photometric decomposition of the surface-brightness distribution.
We masked all the foreground stars, background galaxies, and spurious sources (such as residual cosmic rays and bad pixels) in the image FOV and fitted the galaxy isophotes using the ellipse task in iraf (Jedrzejewski 1987). First, we allowed the centre, ellipticity, and position angle of the fitting ellipses to vary. Then, we fitted the isophotes again but with ellipse, adopting the centre of the inner ellipses. The resulting radial profiles of the azimuthally averaged surface brightness, , position angle, PA, and ellipticity, , are shown in Fig. A1 (left panels). We did not correct the measured surface brightness for cosmological dimming (, NED), Galactic absorption ( mag, Schlafly & Finkbeiner 2011), or K correction ( mag, Chilingarian et al. 2010).
We derived the mean values of and PA of the disc in the radial range (Fig. A1, left panels), which extends outside the bar-dominated region to the farthest fitted isophote. We defined the extension of this radial range by fitting the PA measurements with a straight line and considering all the radii where the line slope was consistent with being zero within the associated root mean square error, as was done by Cuomo et al. (2019a).
We obtained the bar length from the isophotal analysis of the deprojected -band image of NGC 4277, which we built by stretching the image along the disc minor axis () by a factor where is the disc inclination. As in Aguerri et al. (2009), we defined the bar length as the radius at which we measured with respect to the PA of the ellipse with the maximum . We also calculated the bar strength following Aguerri et al. (2009):
where is the bar ellipticity measured at as obtained in Sect. 4. We estimated the error with a Monte Carlo simulation by accounting for the error on the ellipticity. We took the standard deviation of the resulting distribution as the statistical error on .
Appendix B Fourier analysis
We performed the Fourier analysis of the deprojected -band image of NGC 4277 and decomposed its azimuthal surface-brightness distribution as
where is the galactocentric radius on the galaxy plane and is the azimuthal angle measured anticlockwise from the line of nodes, while the Fourier coefficients are as follows:
We obtained the radial profiles of the amplitudes of the Fourier components as follows:
We then derived the radial profile of the intensity contrast between the bar and interbar regions and defined the bar length as the largest radius where
The radial profiles of the relative amplitudes of the Fourier components, phase angle of the Fourier component, and bar and interbar intensity are shown in Fig. A1 (right panels).
Finally, we calculated the bar strength as the mean value of the ratio over the bar extension as follows:
as was done in Athanassoula & Misiriotis (2002) and adopting from Sect. 4. We estimated the error by performing a Monte Carlo simulation and taking the errors on the Fourier components into account. We generated 100 mock profiles of the intensity ratio and we calculated the corresponding bar strength. We took the standard deviation of the resulting distribution as the statistical error on .
Appendix C Photometric decomposition
| Bulge | |
|---|---|
| 19.29 0.03 mag arcsec-2 | |
| 1.75 0.03 arcsec | |
| 2.36 0.03 | |
| 0.841 0.004 | |
| PA | 13509 005 |
| 0.11 | |
| Disc | |
| 20.14 0.01 mag arcsec-2 | |
| 11.82 0.10 arcsec | |
| 14.81 0.22 arcsec | |
| 36.16 0.57 arcsec | |
| 0.758 0.001 | |
| PA | 12337 006 |
| 0.82 | |
| Bar | |
| 21.37 0.01 mag arcsec-2 | |
| 20.70 0.07 arcsec | |
| 0.341 0.001 | |
| PAbar | 17559 004 |
| 0.07 | |
We derived the structural parameters of NGC 4277 by applying the gasp2d algorithm (Méndez-Abreu et al. 2008, 2017, 2018) to the flux-calibrated and sky-subtracted -band image of the galaxy. We modelled the galaxy surface brightness in each pixel of the image to be the sum of the light contribution of a Sérsic bulge, a double-exponential disc, and a Ferrers bar. We did not account for other luminous components, such as rings or spiral arms. We assumed that the isophotes of each component are elliptical and centred on the galaxy centre with constant values for the position angle and axial ratio. We parameterised the bulge surface brightness as
following Sérsic (1968), where are the Cartesian coordinates of the image in pixels, is the effective radius encompassing half of the bulge light, is the surface brightness at , is the shape parameter of the surface brightness profile, and is a normalisation coefficient (Caon et al. 1993). The radius is defined as follows:
where , PAbulge, and are the coordinates of the galaxy centre, bulge position angle, and bulge axial ratio, respectively. We parameterised the disc surface brightness as
following Méndez-Abreu et al. (2017), where is the central surface brightness, is the break radius at which the surface brightness profile changes slope, and and are the scalelengths of the inner and outer exponential profile, respectively. The radius is defined as follows:
where PAdisc and are the disc position angle and axial ratio, respectively. We parameterised the bar surface brightness as follows:
following Aguerri et al. (2009), where and are the bar central surface brightness and length, respectively. The radius is defined as
where PAbar and are the bar position angle and axial ratio, respectively. The best-fitting values of the structural parameters of the bulge, disc, and bar are returned by gasp2d by performing a minimisation. Figure C1 shows the -band image, gasp2d best-fitting image, and residual image of NGC 4277. We estimated the errors on the best-fitting structural parameters by analysing the images of a sample of mock galaxies generated by Méndez-Abreu et al. (2017) with Monte Carlo simulations and mimicking the instrumental setup of the available SDSS image (but see also Costantin et al. 2017).
We adopted the mean and standard deviation of the relative errors of the mock galaxies as the systematic and statistical errors of the parameters of the surface-brightness radial profiles of the bulge (, , and ), disc (, , , and ), and bar ( and ). We adopted the mean and standard deviation of the absolute errors of the mock galaxies as the systematic and statistical errors of the geometric parameters of the bulge (PAbulge and ), disc (PAdisc and ), and bar (PAbar and ). We computed the errors on the best-fitting parameters as , with the systematic errors being negligible compared to the statistical ones. The quoted uncertainties are purely formal and do not take into account the parameter degeneracy and a different parameterisation of the components. The values of the best-fitting structural parameters of NGC 4277 and corresponding errors are reported in Table LABEL:tab:gasp2d.
Appendix D Dynamical analysis
We derived the circular velocity from the stellar LOS velocity and velocity dispersion in the region of the inner disc using the asymmetric drift equation (Binney & Tremaine 1987). We selected the spatial bins within an elliptical annulus with semi-major axes and and ellipticity (Fig. D1) and followed the prescriptions of Debattista et al. (2002) and Aguerri et al. (2003) to obtain the following:
where is the galactocentric radius on the sky plane and is the anomaly angle measured anticlockwise from the line of nodes. The polar coordinates defined on the galaxy (, ) and sky plane (, ) are related to each other as follows:
We adopted and and we assumed the three components of the velocity dispersion to have exponential radial profiles with the same scalelength, but different central values:
This means that the shape of the velocity ellipsoid does not change with the galactocentric radius having constant axial ratios . Then, we parameterised the circular velocity with the following power law:
Assuming the epicyclic approximation () and a constant circular velocity (), we found km s-1. The maps of the disc stellar kinematics with the best-fitting LOS velocity and velocity dispersion are shown in Fig. D1. We need to improve the stellar dynamical modelling to constrain the DM content of NGC 4277 and get the actual radial profile of its circular velocity. Finding a rising circular velocity will translate into an even larger rotation rate, confirming the main result of this paper.
Appendix E Tremaine-Weinberg analysis
| / | |||||
| [km s-1 arcsec-1] | [km s-1 kpc-1] | ||||
| PA = 12327 () | |||||
| MC | 2.63 0.36 | 24.63.4 | 0.14 | 1.77 | 0.20 |
| rms | 2.65 0.37 | 24.73.4 | 0.14 | 1.76 | 0.21 |
| PA = 12359 () | |||||
| rms | 2.35 0.38 | 21.93.6 | 0.16 | 1.88 | 0.24 |
| PA = 12295 () | |||||
| rms | 2.81 0.38 | 26.33.5 | 0.13 | 1.67 | 0.20 |
| PA = 12177 () | |||||
| rms | 3.23 0.32 | 30.13.0 | 0.10 | 1.41 | 0.18 |
We checked the convergence of the photometric integrals as a function of the pseudo-slit semi-length from to (Fig. E1, left panel). We noticed that the photometric integrals measured for pseudo-slit semi-lengths of are systematically larger than those measured at and , which is possibly due to an imperfect subtraction of the sky background at the edges of the FOV of the MUSE datacube. Therefore, we decided to adopt a semi-length of for the pseudo-slits crossing the bar. Some of the pseudo-slits cover a few foreground stars, resulting in spurious spikes in the surface-brightness radial profile, which we manually corrected by linearly interpolating over the star light contribution. We estimated the errors on with a Monte Carlo simulation by generating 100 mock images of the galaxy. To this aim, we processed the convolved, resampled, and reconstructed MUSE image using the iraf task boxcar. Then, to each image pixel, we added, the photon noise due to the contribution of both sky background and galaxy and the read-out noise of the detector to mimic the actual image of NGC 4277. We measured the photometric integrals in the mock images and adopted the root mean square of the distribution of measured values as the error for the photometric integral in each pseudo-slit (labelled as ‘MC’ in Table 2). As a consistency check, we alternatively estimated the errors on defining, for each slit, the radial range in which the value of the photometric integral is constant and adopting the root mean square of the distribution as the error of photometric integrals (labelled as ‘rms’ in Table 2). As was done for the photometric integrals, we checked the convergence of the kinematic integrals as a function of the pseudo-slit semi-length from to (Fig. E1, right panel), and we found that the measured values are compatible within the uncertainties. As kinematic integrals, we chose the values corresponding to the semi-length of and we adopted the rescaled formal errors by ppxf as associated errors. Our adopted value of km s-1 kpc-1 is consistent with the mean value km s-1 kpc-1, which we calculated for all the semi-lengths between and and which corresponds to a slow bar as well.
Even if TW is a model-independent method to recover , there are several sources of error which contribute to the resulting accuracy in estimating (see Corsini 2011, for a discussion). In particular, the misalignment between the orientation of the pseudo-slits and disc PA translates into a large systematic error (Debattista 2003). To account for this issue, we repeated the analysis by adopting different PAs for the pseudo-slits ( and ) to account for the uncertainty on the PA of the inner disc. We obtained the new reconstructed image and defined nine pseudo-slits crossing the bar with a width and a semi-length. We manually corrected the surface-brightness radial profile of the pseudo-slit for light contribution of foreground stars, checked the stability of both photometric and kinematic integrals, and derived the bar pattern speed and rotation rate as was done before. The results for the different PAs are listed in Table 2 and are consistent with a slow bar. As a final test, we repeated the analysis, varying the PA of the pseudo-slits in steps of to look for the PA for which the bar can be classified as fast. This occurs at (Table 2), which corresponds to a misalignment between the pseudo-slits and disc major axis of times the uncertainty on the . This is not consistent with the results of the photometric analysis (Fig. A1) and photometric decomposition (Table LABEL:tab:gasp2d). All the above consistency checks support the finding of a slow bar in NGC 4277.