A lensed protocluster candidate at identified in JWST observations of the galaxy cluster SMACS0723-7327
Abstract
Context. According to the current paradigm of galaxy formation, the first galaxies have been likely formed within large dark matter haloes. The fragmentation of these massive haloes led to the formation of galaxy protoclusters, which are usually composed of one to a few bright objects, surrounded by numerous fainter (and less massive) galaxies. These early structures could have played a major role in reionising the neutral hydrogen within the first billion years of the Universe; especially, if their number density is significant.
Aims. Taking advantage of the unprecedented sensitivity reached by the James Webb Space Telescope (JWST), galaxy protoclusters can now be identified and studied in increasing numbers beyond 6. Characterising their contribution to the UV photon budget could supply new insights into the reionisation process.
Methods. We analyse the first JWST dataset behind SMACS0723-7327 to search for protoclusters at , combining the available spectroscopic and photometric data. We then compare our findings with semi-analytical models and simulations.
Results. In addition to two bright galaxies (26.5 AB in F277W), separated by 11″and spectroscopically confirmed at , we identify 6 additional galaxies with similar colors in a ″radius around these (corresponding to R kpc in the source plane). Using several methods, we estimate the mass of the dark matter halo of this protocluster, 3.31011M⊙ accounting for magnification, consistent with various predictions. The physical properties of all protocluster members are also in excellent agreement with what has been previously found at lower redshifts: star-formation main sequence and protocluster size. This detection adds to just a few protoclusters currently known in the first billion years of the universe. Such galaxy protoclusters may play an important role in cosmic reionisation.
Key Words.:
Galaxy: formation – Galaxies: distances and redshifts – Galaxies: groups: general1 Introduction
Understanding the formation and evolution of the first population of galaxies a few million years after the Big-Bang is one of the most active topics of current extragalactic astronomy. For decades, instruments have been built to push even further our observational limits. The current most distant and detailed picture of the Universe, the Cosmic Microwave Background (CMB), has been obtained by the Planck mission (Planck Collaboration et al., 2020). It shows that already 380,000 years after the Big-Bang, the matter density in the Universe was inhomogeneously distributed, suggesting that small amplitude density fluctuations were on-going in the early phase of the Universe. These fluctuations grow and eventually the denser regions collapse to form the first bound objects (Bromm & Yoshida, 2011). Moreover, the first dark matter haloes undergo a process of fragmentation, suggesting that the most massive galaxies may have formed in overdense regions - so-called protoclusters (Genel et al., 2010). Recent -body simulations and semi-analytic models demonstrate that the first protoclusters may have contributed up to 50% of the Cosmic Star Formation Rate Density at 10 (Chiang et al., 2017). Therefore, determining the number density of 6 protoclusters could supply new insights into the reionisation process.
A natural method of identifying protoclusters at 6 is to search for overdensities of photometrically selected dropout galaxies at similar high-redshifts. For example, using Hubble Frontier Fields data (Lotz et al., 2017), Zheng et al. (2014) identified a likely protocluster of several galaxies at , one of which was later targeted and found to show UV and FIR emission lines placing it at (Laporte et al., 2017). Indeed, searching for galaxies with Lyman- emission at similar redshifts is another successful route to identify early protoclusters. Since the neutral hydrogen surrounding galaxies at 6 makes the detectability of this line very low at high-redshift (De Barros et al., 2017), a Ly detection from a galaxy at 6 suggests that the galaxy sits in a large enough ionized bubble, a result of either high-ionising power of the galaxy itself or the cumulative contribution of several objects at the same redshift (Roberts-Borsani et al., 2022b). Using the Hubble Space Telescope (HST) and deep spectroscopic follow-up campaigns, several groups have identified large ionised bubbles up to 8.68 (e.g. Castellano et al. 2016, 2022, Tilvi et al. 2020, Leonova et al. 2021, Larson et al. 2022a) with the detection of Ly- in bright galaxies. However, the sensitivity of HST is not sufficient to search for much fainter objects in the local environment of these bright galaxies.

The successful launch of the JWST on December 25, 2021 from Europe’s Spaceport in French Guyana has opened a new window to study protoclusters. Its unprecedented sensitivity will allow the community to not only identify and spectroscopically confirm bright galaxies, but also fainter galaxies at similar redshifts. On July 12th 2022, the first images and spectra obtained by Webb were released, and preliminary analysis show that galaxies had already formed at 12 (e.g. Finkelstein et al. 2022, Naidu et al. 2022b, Donnan et al. 2022) reinforcing the idea that a protocluster of galaxies may already be in place at 10.
In this paper, we analyse the first dataset released by the JWST behind the lensing cluster SMACS0723-7327 to search for protoclusters at 6. In section 2, we describe our method which leads to the identification of a protocluster at using NIRSpec, NIRISS and NIRCam data. Then, we determine the physical properties of protocluster members as well as the global properties of the protocluster (Section 3). Finally, in section 4 we discuss the implication of our findings on the reionisation process.
2 Search for protocluster behind SMACS0723
The first JWST dataset included NIRCam images in F090W, F150W, F200W, F277W, F356W and F444W filters; MIRI images in F770W, F1000W, F1500W and F1800W filters ; NIRSpec spectra in F170LP and F190LP as well as NIRISS spectra obtained with F115W and F200W filters. We first look at the NIRSpec spectra whose integration time is 2.45hrs in each filter. We use the publicly available level 2 data and visually inspect 1D spectra using Jdaviz111https://doi.org/10.5281/zenodo.6824713. The spectroscopic redshift is obtained by fitting a list of nebular lines to the brightest detected lines. Two objects among the 35 observed have a similar redshift of and (herafter SMACS0723_PC_6 and SMACS0723_PC_7) and show several UV lines such as [OIII]4959, 5007 and [OII]3727, 3729 (Figure 1). Our redshift measurements are consistent with what has been previously measured by other groups (e.g. Curti et al. 2022, Carnall et al. 2022, Atek et al. 2022, Katz et al. 2022, Trussler et al. 2022).
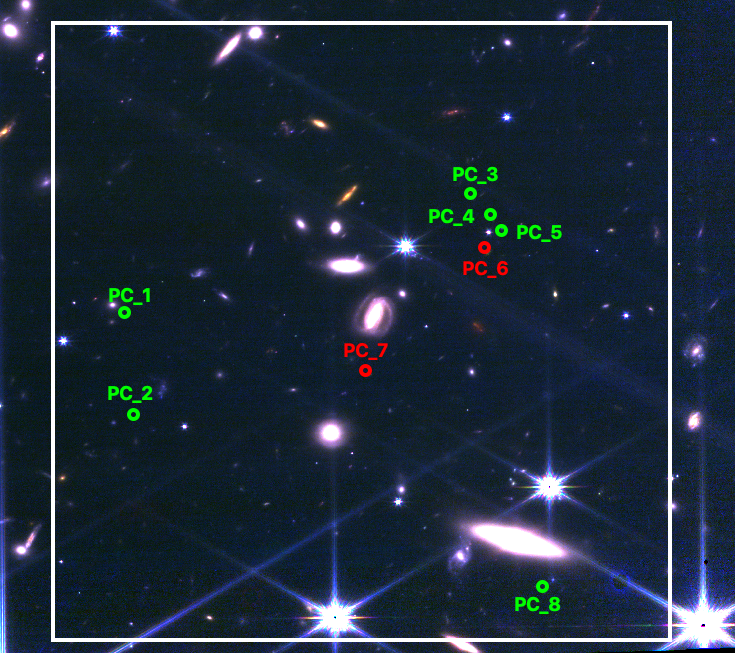
Theoretical studies demonstrate that at 7 the size of a protocluster is below 10 comoving Mpc, corresponding to 1 physical Mpc (Chiang et al., 2017) . However, the protocluster core, where the large majority of galaxies is expected, is much smaller. For example, Capak et al. (2011) identified a protocluster at 5.3, with a protocluster core size of 0.14 physical Mpc. While it appears complicated to entirely cover a protocluster at such high-redshift with the first JWST dataset, one can easily search for a protocluster core. In the following, we will search for galaxies with similar colors in a 40″40″box centered on the two galaxies identified at . Moreover, to increase the number of constraints on the SED, we combine JWST/NIRCam and MIRI data with HST/ACS and WFC3 data.

.
To define the color-color criteria needed to select galaxies at 7.66, we use BAGPIPES (Carnall et al., 2018) to simulate galaxies whose parameters range from 0.0 to 10 for the redshift, to for the stellar mass, -4.0 to -0.5 for the ionisation parameter. The dust attenuation follows Calzetti et al. (2000) and the dust reddening ranges from =0.0 to 2.0mag. IGM attenuation is included and modelled from Inoue et al. (2014). We assume 4 different Star Formation History (SFH - constant, burst, delayed and a combination of a constant with a young burst), and simulate a total of 40,000 galaxies . To account for the depth difference between JWST and HST images, we only defined criteria based on NIRCam filters. We obtain the following criteria to select objects at 7 (Figure 2):
| (1) | ||||
| (2) |
We combine these criteria with non-detection criteria () in HST/ACS filters F435W, F606W and F814W and detection criteria () in F150W, F160W and F200W. Colors are measured on psf-matched images degraded to the seeing of F200W (0.07″), whereas non-detection criteria are measured on original images. We identify 6 more objects in a 40″40″box (Figure 3). The photometry of all candidates is reported in Table 1.
The SMACS0723 ERO data set also includes NIRISS direct imaging and wide-field slitless spectroscopy (WFSS) in the F115W and F200W filters, which affords sufficient wavelength coverage to observe Ly at or e.g., H, OIII]5007 and/or H for galaxies. We reduce and analyse the data set as described by Roberts-Borsani et al. (2022a), ensuring the modelling and subtraction of neighbouring sources and optimal extraction of 1D spectra using the 2D source profile of the galaxies. One galaxy (SMACS0723_PC_8) resides outside of the NIRISS WFSS footprint, while SMACS0723_PC_2 and SMACS0723_PC_1 are too faint to be detected in the pre-imaging. We visually inspect the resulting spectra of the remaining galaxies (SMACS0723_PC_3, SMACS0723_PC_4, SMACS0723_PC_5, SMACS_PC_6 and SMACS0723_PC_7) and find no clear emission lines indicative of Ly or low- interlopers. Given the spectroscopic verification of SMACS0723_PC_6 and SMACS0723_PC_7, the lack of emission lines suggest the galaxies have not carved out sufficiently large ionised bubbles for Ly to escape, while the absence of strong lines in SMACS0723_PC_6 and SMACS0723_PC_7 is supportive of such a hypothesis rather than a low- interloper solution.
With these numbers in hand , we can estimate the overdensity parameter as defined in Morselli et al. (2014) :
| (3) |
where is the number of objects identified and the number of objects expected from the shape of the UV Luminosity Function in our search box. To obtain the latest value, one first need to estimate the surface explored by our survey by masking all bright objects (stars and obvious low- galaxies) and by correcting each pixel by the magnification by the foreground galaxy cluster SMACS0723-7327. The 8 UV LF published in (Bouwens et al., 2022) is defined between 7.5 and 8.5, we therefore estimate from the previous effective surface the volume explored within our search box. We find an overdensity parameter of . This value is comparable to what has been computed for protocluster identified at similar redshift, for example = 5.11 for LAGERzOD1 at 6.9 (Hu et al., 2021) and 4.5 for the 8 overdensity identified in the BoRG survey (Trenti et al., 2012). Naidu et al. (2022a) also reported a similar 4 times overdensity at in the CEERS data.
3 Physical properties of the protocluster
One of the key parameter one has to determine to characterise a protocluster is its total dark matter halo mass. Several methods have recently been used in the literature to probe the total halo mass of confirmed protoclusters. In the following, we will apply some of these methods to demonstrate that this structure is a convincing protocluster at .
Before estimating the total halo mass, one needs to estimate the stellar mass of each candidate protocluster member (e.g. Long et al. 2020). We use BAGPIPES (Carnall et al., 2018) and assume several SFH : constant, burst, delayed and a combination of a young burst with a constant SFH. We allow a redshift range of [0.0:10.0], a stellar mass ranging from [6.0:12.0] and a reddening range of [0.0:2.0]. The best SED-fit is defined as the fit reducing the Bayesian Information Criterion (BIC - see Laporte et al. 2021 for more details) and the results of this fitting are presented in Table 2. The photometric redshift of the 6 dropouts identified near the 2 spectroscopically confirmed galaxies is consistent with these galaxies being at 7.66 (Figure 4 - Right). We apply the same method to obtain the photometric redshift of all objects in the NIRCam field of view. The distribution in redshift of objects in our search box compared to the distribution in the entire field-of-view suggest a small excess of objects at 7, consistent with the presence of an overdensity in this region (Figure 4 - Left). As expected in a protocluster environment (e.g. Muldrew et al. 2015, Lim et al. 2021, Araya-Araya et al. 2021, Gouin et al. 2022), 2 members are more massive than the others, namely SMACS0723_PC_6 and SMACS0723_PC_7, with a stellar mass 10.
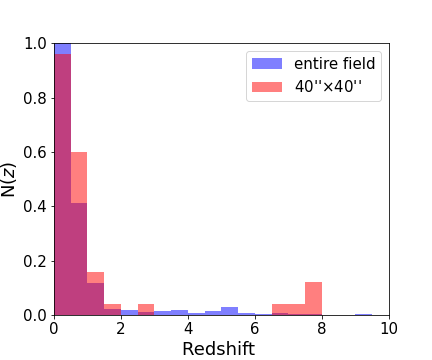
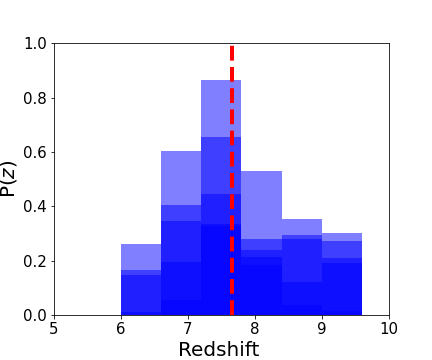
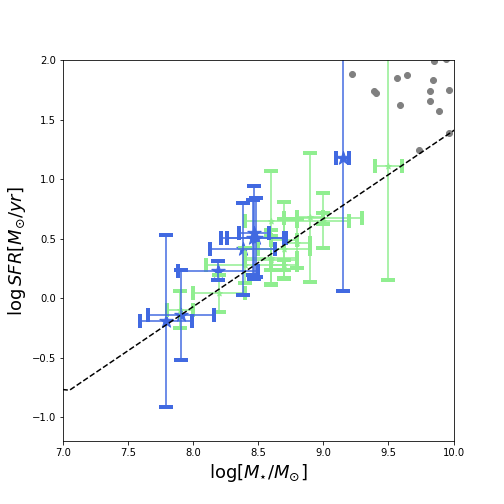
Figure 5 shows the position of the 8 galaxies in our sample on a vs SFR diagram compared with previous findings at 7 (Leethochawalit et al. 2022,Topping et al. 2022). It confirms that all these sources have properties consistent with what is expected in terms of the star-formation main sequence currently known at 7. We also expand our search over the entire NIRCam field of view to identify other 7.66 objects. 26 objects follow our selection criteria (including the 8 protocluster members candidates discussed in this letter) but no other region in the field shows an overdensity as large as in the protocluster candidate region. Moreover, no candidate has a stellar mass larger than PC_7 confirming that the two spectroscopically confirmed galaxies are the most massive galaxies in this field of view. We also note that the projected distance between the protocluster core discussed in this paper and the closest 7.66 galaxy outside of the 40 40 box is 0.38 Mpc, suggesting that some of these galaxies may also be related to the protocluster.
| ID | RA | DEC | SFR | [95% C.I] | |||
|---|---|---|---|---|---|---|---|
| [deg] | [deg] | [] | [/yr] | [mag] | |||
| PC_1 | 110.823826 | -73.437880 | 6.68 | 7.79 | 3.37 | 0.35 | 1.90 [1.49 – 2.06] |
| PC_2 | 110.820512 | -73.436305 | 7.69 | 8.19 | 1.71 | 0.11 | 1.79 [1.44 – 1.92] |
| PC_3 | 110.845907 | -73.435998 | 7.76 | 7.96 | 0.72 | 0.12 | 1.73 [1.41 – 1.83] |
| PC_4 | 110.846149 | -73.435474 | 7.20 | 8.57 | 3.25 | 0.33 | 1.70 [1.39 – 1.80] |
| PC_5 | 110.847412 | -73.435129 | 8.19 | 8.50 | 3.23 | 0.19 | 1.68 [1.54 – 1.77] |
| PC_6⋆ | 110.844634 | -73.435054 | 7.665 | 8.59 | 3.55 | 0.15 | 1.68 [1.38 – 1.78] |
| PC_7⋆ | 110.834062 | -73.434509 | 7.659 | 8.95 | 15.06 | 1.02 | 1.68 [1.41 – 1.79] |
| PC_8 | 110.835151 | -73.429499 | 7.33 | 8.26 | 2.61 | 0.54 | 1.50 [1.29 – 1.57] |
⋆ : spectroscopically confirmed at
The individual halo mass can be estimated from the stellar mass of each galaxy using the Behroozi et al. (2013) relationship. The halo masses of the 8 galaxies range from 21010 to 61011 M⊙ corrected for magnification, with a total protocluster halo mass of =3.341011M⊙ . Another method of estimating the halo mass of a protocluster is to sum all stellar masses (=1.46 M⊙) corrected for magnification and to convert it into halo mass using the baryonic-to-dark matter fraction measured by Planck Collaboration et al. (2020). Following this method, we estimate a total halo mass of 6.52M⊙. Finally, we can also determine the halo mass of the most massive galaxy in our sample from its stellar mass, which should dominate the total halo mass of the protocluster. SMACS0723_PC_7 has a stellar mass of 5.31 M⊙ corrected for magnification , which converts into a minimum halo mass of 6.861010.
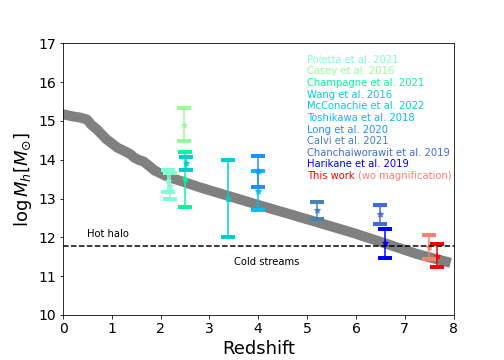
In an independent analysis, we use the observed stellar-to-halo mass ratios measured by Shuntov et al. (2022) with the COSMOS2020 catalog, which represents the most complete deep galaxy catalog to date (Weaver et al., 2022), to compute an additional measurement of the halo mass of our protocluster candidate. We fit the redshift-evolution of the Shuntov et al. (2022) stellar-to-halo mass ratio and extrapolate it out to the redshift of our cluster () using a Monte-Carlo Markov Chain (MCMC) analysis to rigorously propagate the uncertainties. The resulting halo masses of the 8 cluster member galaxies range from 21010 to 11011 M⊙, which broadly agrees with the range found using the Behroozi et al. (2013) relation above. Summing over these halo masses, we find a total halo mass of =2.071011M⊙ which is higher than our previous estimates but agrees within the uncertainties (. Note that with this conversion, the halo mass of the most massive galaxy in the protocluster is also higher than our previous estimate with a halo mass of 10.321010M⊙, though it also has much higher uncertainties. Moreover, Chiang et al. (2013) studied the evolution of a Coma-like cluster from 7 to . Assuming a smooth evolution at 7, the expected halo mass of a protocluster at is 31011M⊙. This value agrees well with the total halo mass we have estimated for our protocluster candidate.
Besides the halo mass of the protocluster and the main sequence, another relevant, physical property is its size. As seen in Figure 3, the protocluster constituent galaxies are all found to sit within a 40″ 40″box, or within a radius of from the two brighter, central protocluster galaxies. We use the analytic mass model presented in Pascale et al. (2022) to estimate the magnification of the protocluster. In Table 2 we list the magnifications of each of the 8 galaxies associated with the protocluster. The magnifications vary between 1.5 and 2, roughly, with a typical at the center of the protocluster. We do not find a strong shear at the location of the protocluster so that a circle of radius 20″encircling the observed protocluster galaxies, is delensed into, approximately, an ellipse of axis ratio 1:1.35, located a few arcseconds closer to the Bright Central Galaxy. Taking the typical magnification into account (), we estimate the size of the protocluster to be about 120 kpc in diameter. This size is consistent with what is expected from Chiang et al. (2017) simulations. It is also similar with what have been observed at in Capak et al. (2011) and at by Chanchaiworawit et al. (2019), with protocluster core size of 0.14Mpc and 0.45 Mpc.
4 Implication for Cosmic Reionisation
The transmission and escape of Lyman- and Lyman continuum photons through the intergalactic medium around a galaxy depends exponentially on the optical depth (Furlanetto et al. 2004, Miralda-Escudé et al. 2000). As such, even small amounts of neutral Hydrogen will absorb potentially ionizing photons. As a result, smaller and fainter galaxies can only very locally ionize their surroundings, if at all. This leads to a strong bias towards detecting Lyman- from brighter and more massive galaxies in the reionization era (e.g. Stark et al. 2011), since typically, only these radiate strongly enough to ionize the surrounding hydrogen and create a sufficiently large bubble to allow these photons to escape (e.g. Leonova et al. 2021, Larson et al. 2022b). Hence, smaller galaxies that sit close to these more massive and brighter galaxies, effectively sit in an ionized bubble and their UV photons can travel large distances, to help reionize the Universe (photons that would otherwise be absorbed in the local vicinity of the galaxies). Therefore, protoclusters may play a significant and important role in the reionization process.
Chiang et al. (2017) demonstrated, using body simulations and semi-analytical models that protoclusters could have contributed up to 50% of the Cosmic Star Formation Rate density at . They also show that a protocluster core at 7.66 can itself represent of the total ionising budget. Furthermore, Ma et al. (2021) analyse in their simulations a protocluster with a halo mass similar to the protocluster we report in this letter (), and conclude that the escape fraction for this type of protocluster could reach 20%, a golden number to explain the end of the reionisation process by 6.
Moreover, the latest constraints on the shape of the UV Luminosity Function at 6 show that the number density of galaxies within the first billion years of the Universe is 10-6Mpc-3 (e.g. Bouwens et al. 2022, Finkelstein et al. 2015) which is similar to the number density of rich clusters at (1015 M⊙ - e.g. Wen et al. 2010). This could suggest that the brightest 6 galaxies detected in deep HST surveys may lie in overdense regions with the vast majority of sources well below the detection limit of Hubble. If this is the case, and assuming that each 6 protocluster has an escape fraction of 20%, as suggested by simulations, it could open a new route to solve the UV photon deficit observed during the reionisation process.
Figure 6 demonstrates that SMACS0723_PC could be seen as the progenitor of a Coma-like cluster (1015M⊙), and illustrates the importance of studying galaxy protoclusters from Cosmic Dawn to Cosmic Noon, e.g. in this plane. Previous telescopes were only able to detect the brightest members of such structures. Even if recent HST studies start to see overdensities near extremely bright objects at 7 (e.g Leonova et al. 2021, Castellano et al. 2022), the density of protoclusters within the first billion years of the Universe is totally unknown. The identification of a protocluster candidate at in less than 15hrs with JWST is encouraging. Wider and deeper data are now needed to determine how many bright 7 sources lie in overdense regions, which could give new insights into the cosmic reionisation.
5 Summary
In this letter, we report the detection of a protocluster candidate at behind the lensing cluster SMACS0723-7327 observed with the James Webb Space Telescope. In addition to the spectroscopic confirmation of two sources, we identified 6 more galaxies with similar colors whose SED-fitting suggest they may lie at the same redshift, and have physical properties comparable to galaxies at the same redshift. Assuming they are all part of the same structure, we estimate an overdensity parameter =4.0, consistent with previous values found for other protoclusters at 6. Based on several method, we estimate the total dark matter halo mass of this protocluster candidate to be 3.61011M⊙. This value agrees perfectly with what is expected for progenitors of a Coma-like cluster. Furthermore, the star-formation main sequence at and the estimated size are in line with expectations.
Simulations predict that protoclusters may have played an important role in the cosmic reionisation, with up to a 50% contribution to the Cosmic Star Formation Rate density. They also suggest that protocluster with the dark matter halo mass of SMACS0723_PC could have an escape fraction as high as 20%. The main unknown parameter is their number density. However, the number density of bright galaxies at 6 is of the same order of magnitude as the number density of rich clusters at 0, suggesting that they may be linked. If this is confirmed with the detection of protocluster candidates around many bright galaxies at 6 with the JWST , and given the efficiency at which these early structures ionise the neutral hydrogen, it could give new insight into the reionisation process.
Acknowledgements.
We thank Francesco D’Eugenio for providing NIRSpec spectra and Richard Ellis for interesting comments on our manuscript. NL acknowledges support from the Kavli foundation. AZ and LF acknowledge support by Grant No. 2020750 from the United States-Israel Binational Science Foundation (BSF) and Grant No. 2109066 from the United States National Science Foundation (NSF), and by the Ministry of Science & Technology, Israel. CW acknowledges support from the Science and Technology Facilities Council (STFC) for a Ph.D. studentship. NL and HD acknowledge the Astr’Auvergne astronomy festival (and InfiniSciences and Astro-Jeunes volunteers) as it all started there. This work is based in part on observations made with the NASA/ESA/CSA James Webb Space Telescope. The data were obtained from the Mikulski Archive for Space Telescopes at the Space Telescope Science Institute, which is operated by the Association of Universities for Research in Astronomy, Inc., under NASA contract NAS 5-03127 for JWST. The authors acknowledge the ERO team (program #2736) for developing their observing program with a zero-exclusive-access period.References
- Araya-Araya et al. (2021) Araya-Araya, P., Vicentin, M. C., Sodré, Laerte, J., Overzier, R. A., & Cuevas, H. 2021, MNRAS, 504, 5054
- Atek et al. (2022) Atek, H., Shuntov, M., Furtak, L. J., et al. 2022, arXiv e-prints, arXiv:2207.12338
- Behroozi et al. (2013) Behroozi, P. S., Wechsler, R. H., & Conroy, C. 2013, ApJ, 770, 57
- Bouwens et al. (2022) Bouwens, R. J., Illingworth, G. D., Ellis, R. S., Oesch, P. A., & Stefanon, M. 2022, arXiv e-prints, arXiv:2205.11526
- Bromm & Yoshida (2011) Bromm, V. & Yoshida, N. 2011, ARA&A, 49, 373
- Calvi et al. (2021) Calvi, R., Dannerbauer, H., Arrabal Haro, P., et al. 2021, MNRAS, 502, 4558
- Calzetti et al. (2000) Calzetti, D., Armus, L., Bohlin, R. C., et al. 2000, ApJ, 533, 682
- Capak et al. (2011) Capak, P. L., Riechers, D., Scoville, N. Z., et al. 2011, Nature, 470, 233
- Carnall et al. (2022) Carnall, A. C., Begley, R., McLeod, D. J., et al. 2022, arXiv e-prints, arXiv:2207.08778
- Carnall et al. (2018) Carnall, A. C., McLure, R. J., Dunlop, J. S., & Davé, R. 2018, MNRAS, 480, 4379
- Casey (2016) Casey, C. M. 2016, ApJ, 824, 36
- Castellano et al. (2016) Castellano, M., Dayal, P., Pentericci, L., et al. 2016, ApJ, 818, L3
- Castellano et al. (2022) Castellano, M., Pentericci, L., Cupani, G., et al. 2022, A&A, 662, A115
- Champagne et al. (2021) Champagne, J. B., Casey, C. M., Zavala, J. A., et al. 2021, ApJ, 913, 110
- Chanchaiworawit et al. (2019) Chanchaiworawit, K., Guzmán, R., Salvador-Solé, E., et al. 2019, ApJ, 877, 51
- Chiang et al. (2013) Chiang, Y.-K., Overzier, R., & Gebhardt, K. 2013, ApJ, 779, 127
- Chiang et al. (2017) Chiang, Y.-K., Overzier, R. A., Gebhardt, K., & Henriques, B. 2017, ApJ, 844, L23
- Curti et al. (2022) Curti, M., D’Eugenio, F., Carniani, S., et al. 2022, arXiv e-prints, arXiv:2207.12375
- De Barros et al. (2017) De Barros, S., Pentericci, L., Vanzella, E., et al. 2017, A&A, 608, A123
- Dekel & Birnboim (2006) Dekel, A. & Birnboim, Y. 2006, MNRAS, 368, 2
- Donnan et al. (2022) Donnan, C. T., McLeod, D. J., Dunlop, J. S., et al. 2022, arXiv e-prints, arXiv:2207.12356
- Finkelstein et al. (2022) Finkelstein, S. L., Bagley, M. B., Arrabal Haro, P., et al. 2022, arXiv e-prints, arXiv:2207.12474
- Finkelstein et al. (2015) Finkelstein, S. L., Ryan, Russell E., J., Papovich, C., et al. 2015, ApJ, 810, 71
- Furlanetto et al. (2004) Furlanetto, S. R., Zaldarriaga, M., & Hernquist, L. 2004, ApJ, 613, 1
- Genel et al. (2010) Genel, S., Bouché, N., Naab, T., Sternberg, A., & Genzel, R. 2010, ApJ, 719, 229
- Gouin et al. (2022) Gouin, C., Aghanim, N., Dole, H., Polletta, M., & Park, C. 2022, A&A, 664, A155
- Harikane et al. (2019) Harikane, Y., Ouchi, M., Ono, Y., et al. 2019, ApJ, 883, 142
- Hu et al. (2021) Hu, W., Wang, J., Infante, L., et al. 2021, Nature Astronomy, 5, 423
- Inoue et al. (2014) Inoue, A. K., Shimizu, I., Iwata, I., & Tanaka, M. 2014, MNRAS, 442, 1805
- Katz et al. (2022) Katz, H., Saxena, A., Cameron, A. J., et al. 2022, arXiv e-prints, arXiv:2207.13693
- Laporte et al. (2017) Laporte, N., Ellis, R. S., Boone, F., et al. 2017, ApJ, 837, L21
- Laporte et al. (2021) Laporte, N., Meyer, R. A., Ellis, R. S., et al. 2021, MNRAS, 505, 3336
- Larson et al. (2022a) Larson, R. L., Finkelstein, S. L., Hutchison, T. A., et al. 2022a, ApJ, 930, 104
- Larson et al. (2022b) Larson, R. L., Finkelstein, S. L., Hutchison, T. A., et al. 2022b, ApJ, 930, 104
- Leethochawalit et al. (2022) Leethochawalit, N., Trenti, M., Santini, P., et al. 2022, arXiv e-prints, arXiv:2207.11135
- Leonova et al. (2021) Leonova, E., Oesch, P. A., Qin, Y., et al. 2021, arXiv e-prints, arXiv:2112.07675
- Lim et al. (2021) Lim, S., Scott, D., Babul, A., et al. 2021, MNRAS, 501, 1803
- Long et al. (2020) Long, A. S., Cooray, A., Ma, J., et al. 2020, ApJ, 898, 133
- Lotz et al. (2017) Lotz, J. M., Koekemoer, A., Coe, D., et al. 2017, ApJ, 837, 97
- Ma et al. (2021) Ma, X., Quataert, E., Wetzel, A., Faucher-Giguère, C.-A., & Boylan-Kolchin, M. 2021, MNRAS, 504, 4062
- McConachie et al. (2022) McConachie, I., Wilson, G., Forrest, B., et al. 2022, ApJ, 926, 37
- Miralda-Escudé et al. (2000) Miralda-Escudé, J., Haehnelt, M., & Rees, M. J. 2000, ApJ, 530, 1
- Morselli et al. (2014) Morselli, L., Mignoli, M., Gilli, R., et al. 2014, A&A, 568, A1
- Muldrew et al. (2015) Muldrew, S. I., Hatch, N. A., & Cooke, E. A. 2015, MNRAS, 452, 2528
- Naidu et al. (2022a) Naidu, R. P., Oesch, P. A., Setton, D. J., et al. 2022a, arXiv e-prints, arXiv:2208.02794
- Naidu et al. (2022b) Naidu, R. P., Oesch, P. A., van Dokkum, P., et al. 2022b, arXiv e-prints, arXiv:2207.09434
- Oke & Gunn (1983) Oke, J. B. & Gunn, J. E. 1983, ApJ, 266, 713
- Pascale et al. (2022) Pascale, M., Frye, B. L., Diego, J., et al. 2022, arXiv e-prints, arXiv:2207.07102
- Planck Collaboration et al. (2020) Planck Collaboration, Aghanim, N., Akrami, Y., et al. 2020, A&A, 641, A6
- Polletta et al. (2021) Polletta, M., Soucail, G., Dole, H., et al. 2021, A&A, 654, A121
- Roberts-Borsani et al. (2022a) Roberts-Borsani, G., Morishita, T., Treu, T., et al. 2022a, arXiv e-prints, arXiv:2207.11387
- Roberts-Borsani et al. (2022b) Roberts-Borsani, G., Treu, T., Mason, C., et al. 2022b, arXiv e-prints, arXiv:2207.01629
- Shuntov et al. (2022) Shuntov, M., McCracken, H. J., Gavazzi, R., et al. 2022, arXiv e-prints, arXiv:2203.10895
- Stark et al. (2011) Stark, D. P., Ellis, R. S., & Ouchi, M. 2011, ApJ, 728, L2
- Tilvi et al. (2020) Tilvi, V., Malhotra, S., Rhoads, J. E., et al. 2020, ApJ, 891, L10
- Topping et al. (2022) Topping, M. W., Stark, D. P., Endsley, R., et al. 2022, arXiv e-prints, arXiv:2203.07392
- Toshikawa et al. (2018) Toshikawa, J., Uchiyama, H., Kashikawa, N., et al. 2018, PASJ, 70, S12
- Trenti et al. (2012) Trenti, M., Bradley, L. D., Stiavelli, M., et al. 2012, ApJ, 746, 55
- Trussler et al. (2022) Trussler, J. A. A., Adams, N. J., Conselice, C. J., et al. 2022, arXiv e-prints, arXiv:2207.14265
- Wang et al. (2016) Wang, T., Elbaz, D., Daddi, E., et al. 2016, ApJ, 828, 56
- Weaver et al. (2022) Weaver, J. R., Kauffmann, O. B., Ilbert, O., et al. 2022, ApJS, 258, 11
- Wen et al. (2010) Wen, Z. L., Han, J. L., & Liu, F. S. 2010, MNRAS, 407, 533
- Zheng et al. (2014) Zheng, W., Shu, X., Moustakas, J., et al. 2014, ApJ, 795, 93
| ID | F435W | F606W | F814W | F090W | F105W | F125W | F140W | F150W | F160W | F200W | F277W | F356W | F444W |
|---|---|---|---|---|---|---|---|---|---|---|---|---|---|
| ACS/HST | ACS/HST | ACS/HST | NIRCam/JWST | WFC3/HST | WFC3/HST | WFC3/HST | NIRCam/JWST | WFC3/HST | NIRCam/JWST | NIRCam/JWST | NIRCam/JWST | NIRCam/JWST | |
| PC_1 | ¿ 27.22 | ¿ 27.84 | ¿ 26.80 | 29.22 0.47 | ¿ 27.63 | ¿ 27.49 | ¿ 27.77 | 27.71 0.13 | ¿ 27.40 | 27.67 0.11 | 27.80 0.24 | 28.19 0.33 | 28.37 0.56 |
| PC_2 | ¿ 27.72 | ¿ 28.47 | ¿ 27.55 | ¿ 29.93 | ¿ 27.51 | ¿ 28.06 | ¿ 27.10 | 28.47 0.15 | ¿ 28.00 | 28.76 0.18 | 29.19 0.48 | 28.71 0.31 | 29.33 0.72 |
| PC_3 | ¿ 27.67 | ¿ 28.21 | ¿ 27.68 | ¿ 29.69 | ¿ 27.38 | 27.78 0.54 | 27.00 0.25 | 27.38 0.07 | 26.85 0.25 | 27.19 0.05 | 27.25 0.14 | 27.16 0.12 | 27.48 0.23 |
| PC_4 | ¿ 27.59 | ¿ 27.99 | ¿ 27.47 | ¿ 29.65 | 27.56 0.51 | ¿ 26.77 | 26.94 0.28 | 27.19 0.06 | 27.08 0.31 | 27.05 0.05 | 27.30 0.18 | 27.28 0.14 | 27.28 0.18 |
| PC_5 | ¿ 27.76 | ¿ 28.31 | ¿ 27.63 | 28.21 0.13 | 27.34 0.37 | ¿ 25.89 | 26.70 0.20 | 26.57 0.03 | 26.53 0.18 | 26.58 0.03 | 26.68 0.08 | 26.75 0.07 | 26.79 0.11 |
| PC_6 | ¿ 27.66 | ¿ 28.23 | ¿ 27.72 | ¿ 29.73 | 27.46 0.43 | 26.20 0.43 | 26.26 0.14 | 26.02 0.02 | 26.04 0.12 | 25.88 0.02 | 25.74 0.04 | 25.49 0.03 | 24.60 0.02 |
| PC_7 | ¿ 27.76 | ¿ 28.07 | ¿ 27.69 | ¿ 29.83 | 26.95 0.33 | 27.06 0.24 | 26.54 0.35 | 26.82 0.04 | 26.78 0.20 | 26.92 0.04 | 26.87 0.07 | 26.85 0.07 | 26.09 0.05 |
| PC_8 | ¿ 27.70 | ¿ 28.22 | ¿ 27.65 | ¿ 28.23 | OOF | OOF | OOF | 27.62 0.19 | OOF | 27.60 0.14 | 27.23 1.10 | 27.37 0.33 | ¿27.19 |