Further author information: (Send correspondence to G.G.)
G.G.: E-mail: Giovanna.Giardino@esa.int, Telephone: +31 71 565 4625
Optical throughput and sensitivity of JWST NIRSpec
Abstract
To achieve its ambitious scientific goals, the Near-Infrared Spectrograph, NIRSpec, on board the Webb Space Telescope, needs to meet very demanding throughput requirements, here quantified in terms of photon-conversion efficiency (PCE). During the calibration activities performed for the instrument commissioning, we have obtained the first in-flight measurements of its PCE and also updated the modeling of the light losses occurring in the NIRSpec slit devices.
The measured PCE of NIRSpec fixed-slit and multi-object spectroscopy modes overall meets or exceeds the pre-launch model predictions. The results are more contrasted for the integral-field spectroscopy mode, where the differences with the model can reach 20%, above 4 m, and exceed 30%, below 2 m. Additionally, thanks to the high quality of the JWST point-spread function, our slit-losses, at the shorter wavelength, are significantly decreased with respect to the pre-flight modeling.
These results, combined with the confirmed low noise performance of the detectors, make of NIRSpec an exceptionally sensitive spectrograph.
keywords:
JWST, NIRSpec, near-infrared spectrograph1 INTRODUCTION
The Near-Infrared Spectrograph (NIRSpec) is one the four focal plane instruments on the Webb Space Telescope; its main scientific goal is to enable multi-object spectroscopy of faint high redshift galaxies and thus advance our understanding of the early stage of galaxy formation at the dawn of our universe. Nevertheless its innovative design allows sensitive observations of a wide range of targets to be performed, including detailed spectroscopic studies of the atmospheres of exoplanets, to choose an example at the opposite end of the Universe distance scale[1].
To support these studies, NIRSpec is capable of carrying out low, medium and high resolution spectroscopy, both in single- object mode employing any one of five fixed slits (FS), or a 3.13.2 arcsec2 integral field unit (IFU) for Integral Field Spectroscopy observations (IFS), or in multi-object (MOS) mode employing a novel programmable micro-shutter array (MSA) covering a 3.63.4 arcmin2 field of view[1]. NIRSpec is equipped with a double pass-prism for low-resolution spectroscopy over the entire wavelength-range, 0.6 5.3 m, and two sets of three diffraction gratings providing spectral resolutions of and , respectively. The two sets of gratings are formally specified to cover the 1.0-5.0 m wavelength region in each of three overlapping bands: 1.0-1.8 m (Band I), 1.7-3.0 m (Band II) and 2.9-5.0 m (Band III). The nominal instrument configurations, and corresponding combination of dispersive elements and filters, are listed in Table 1. The shorter wavelength F070LP long-pass filter listed is included to enable observations below 1 m with the G140M and G140H gratings, which are free of contaminating second-order light only up to a wavelength of 1.27 m.
| Band | Disperser element | Resolution | Filter | Spectral range / m |
|---|---|---|---|---|
| 0 | G140M, G140H | 1000, 2700 | F070LP | 0.7–1.2 |
| I | G140M, G140H | 1000, 2700 | F100LP | 1.0–1.8 |
| II | G235M, G235H | 1000, 2700 | F170LP | 1.7–3.1 |
| III | G395M, G395H | 1000, 2700 | F290LP | 2.9–5.2 |
| n/a | PRISM | 100 | CLEAR | 0.6–5.3 |
1.1 Photon-conversion efficiency
A key performance parameter in every optical instrument, either a telescope or microscope, is its efficiency: how many photons will make it through the optical chain the instrument is comprised of. Barring systematics, the throughput and the noise performance of the detectors are the parameters driving the photometric sensitivity of an instrument.
NIRSpec is a complex instrument that supports many different modes of observations. Its optical train is reflective throughout, save for the order-separation filters and the low resolution dispersive prism. The three primary optical modules of NIRSpec are each implemented in the form of three-mirror anastigmats employing high-order aspherical surfaces[2]. Counting the five plane fold mirrors and the disperser, the light entering NIRSpec undergoes a total of 15 reflections (in the FS/MOS mode) before reaching the detector array. Coupled with the telescope element of JWST, the total number of reflections a photon goes thorough in its path from the primary mirror to the detectors at the NIRSpec focal plane is 19! The IFU mode adds a further 8 gold-coated reflections to the light path. Ultimately, though, we do not count photons but the electrons generated in the semi-conductor substrate of the detectors, with their own performance in terms of quantum efficiency (QE). For this reason, we describe the throughput of our instrument in terms of Photon Conversion Efficiency, PCE.
To achieve its ambitious science goals, NIRSpec was designed with demanding requirements in terms of optical efficiency across its entire wavelength range - and therefore particular attention was placed in the design and manufacturing of its reflective elements, making sure that all the optical surfaces received the highest quality optical coatings and were kept extremely clean during instrument assembly. With the aim of achieving high optical throughput at the blue end, all mirrors are coated with protected silver. Additionally, the two Teledyne H2RG focal plane detectors have excellent QE, overall exceeding 70% , as illustrated by Rauscher et al. [3].
Preliminary measurements of the NIRSpec PCE were obtained during the NIRSpec ground-testing campaign that took place in 2013. The measurements, though, were affected by significant uncertainties (due to limitations of the ground-testing equipment), and, in addition, in 2015 the detector arrays were replaced with new devices. Therefore, before flight, the PCE performance of NIRSpec was based on a radiometric model of the instrument obtained by combining the measured absolute QE of the replaced arrays with individual-component measurements made on each optical element or appropriate witness samples, together with the nominal reflectivity of the telescope optics[4]. The PCE values predicted before flight were very high, reaching in excess of 50% in prism configuration, and at peak blaze in all six gratings - see Jakobsen et al.[1].
The moment of truth finally came during the commissioning of the instrument, with the first observations of a spectro-photometric standard star.
2 OBSERVATIONS AND PROCESSING
JWST was launched on the 25th of December of 2021. After deployment and reaching the target halo-orbit around the Sun-Earth L2 point, the telescope and instrumentation underwent a six months period of commissioning activities to prepare the observatory for its scientific observations. During this phase, NIRSpec commissioning team commanded NIRSpec to perform internal calibration exposures and on-sky observations, acquiring the data necessary to assess the instrument’s in-flight performance and generate calibration reference data[5].
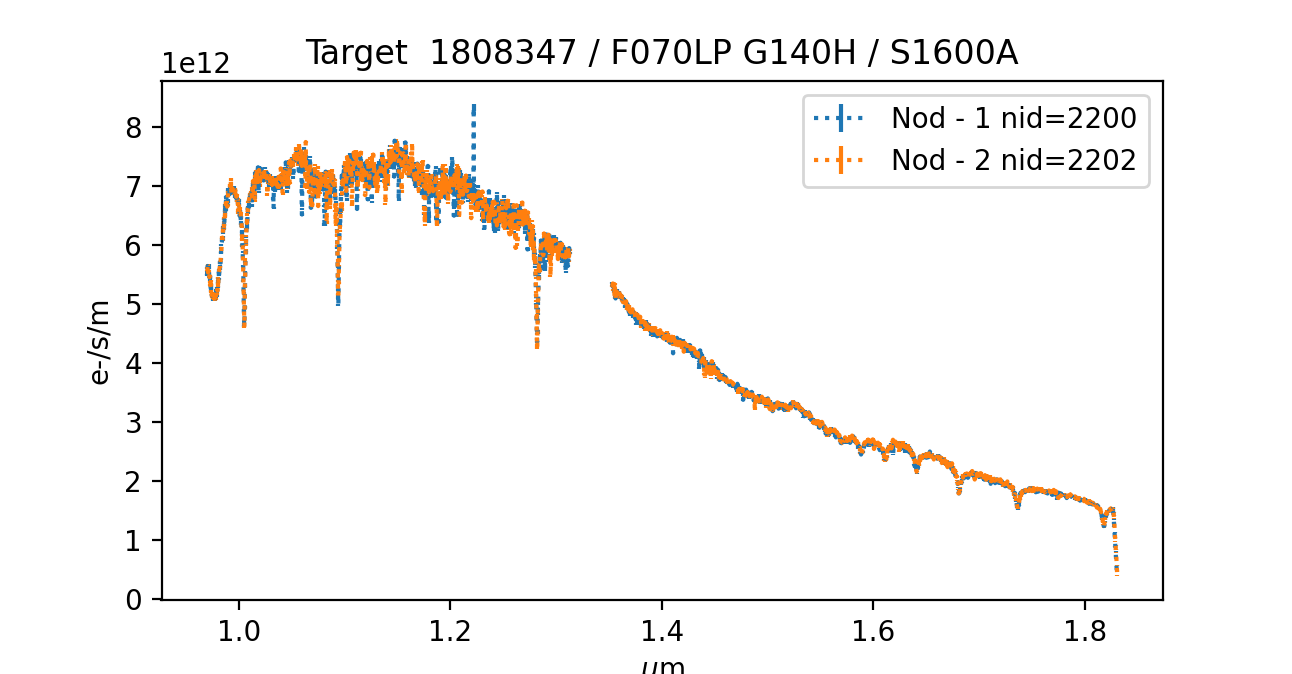
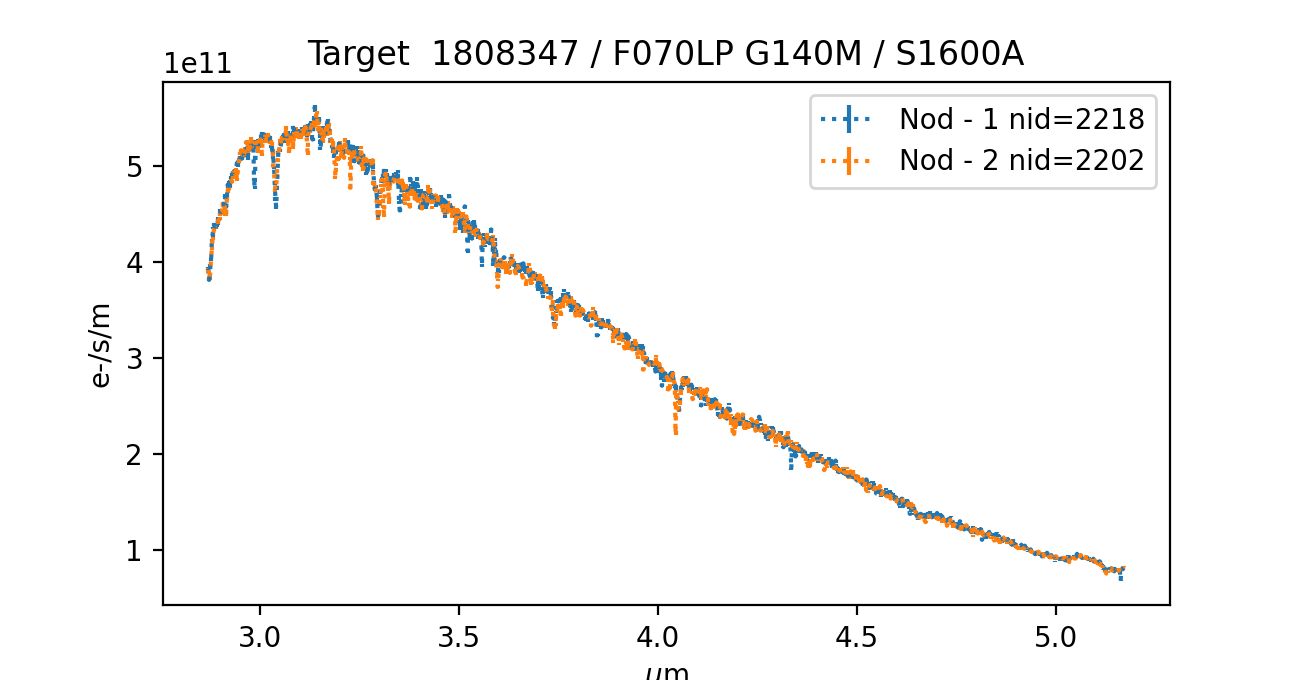
For the absolute spectro-photometric calibration of the instrument, we observed the standard stars 1808347 (TYC 4433-1800-1), an A3 star selected from STScI Calibration database CALSPEC, as well as two other reference stars during one of the first instrument check-out exposures on sky: wd1057+719 (a white dwarf) and p177d (G0), using all the dispersers, for a total of 9 filter-disperser combinations111Proposal ID (PID) 1128. To asses the PCE for the MOS and FS mode, the star was observed through the square 1.6 arcsec-wide slit (S1600A1), which has minimal geometrical loss, with typical values of 3–9% (see Sect. 3.1). To enable the subtraction of the background emission a two-point 1-arcsec dither in the spatial direction was executed within the slit, in each configuration, while, in the case of the IFS mode, a 4-point nod was executed across the IFU aperture field-of-view.
The exposures were processed with our NIRSpec ramp-to-slope pipeline that performs the following basic data reduction steps: bias subtraction, reference pixel subtraction, linearity correction, dark subtraction and finally count-rate estimation, including jump detection and cosmic-ray rejection – see Birkmann et al.[6] for more details on this last step. From the count-rate images the wavelength calibrated spectra were obtained using the Stage 2 of the NIRSpec pipeline to perform the following operations for the FS: subtract background (combining the exposures from the two-nods); extract sub-image containing the spectral trace and assign wavelength and spatial coordinates to each pixel therein; generate a rectified spectrum re-sampled on regular 2D-grid; compute the 1D-spectrum obtained by spatial integration. Figure 1 shows the spectra for configurations F070LP-G140H and F290-G395M, as examples. For the IFS exposures, after background subtractions and rectification of the 30 IFU traces, Stage 2 of NIRSpec pipeline builds the three-dimensional data cube from where the 1D-spectrum is obtained by spatial integration of a circular area.
The PCE of the instrument through the given aperture is given simply by dividing the observed number of electron rate per wavelength element by the value of photons flux collected by the primary mirror (per wavelength element).
|
3 RESULTS
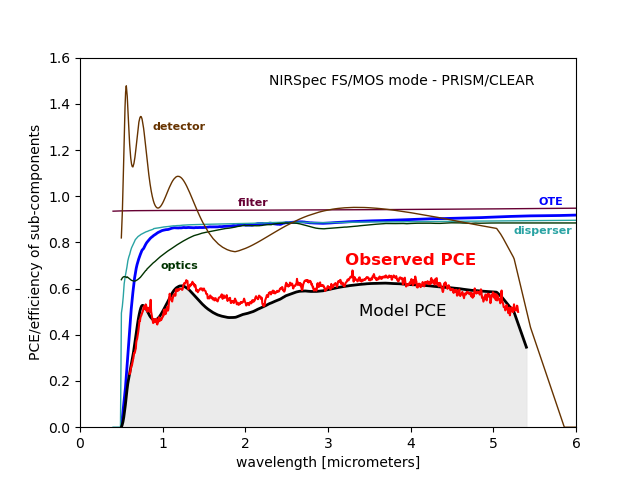
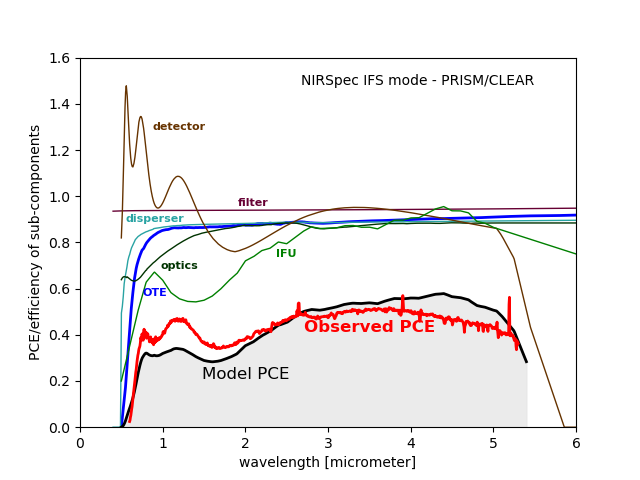
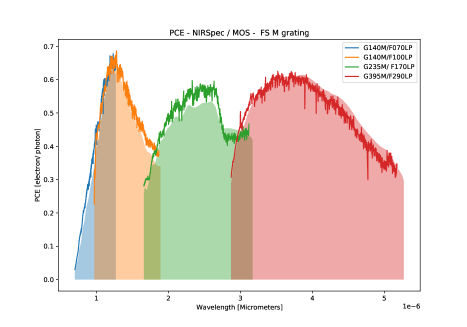
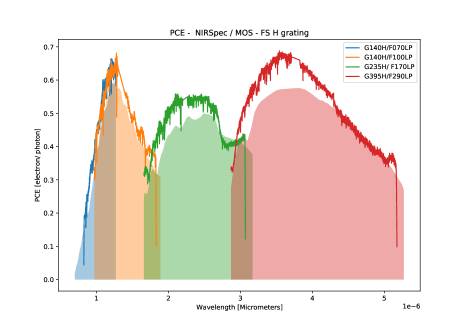
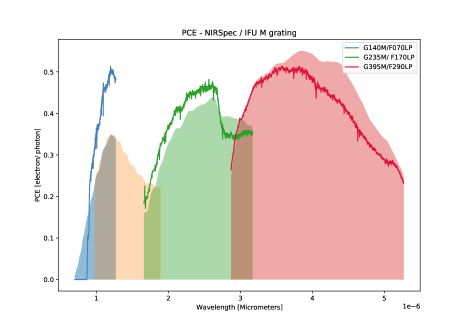
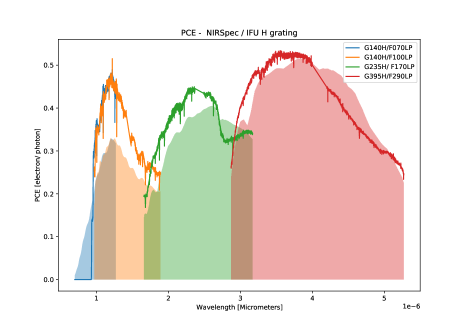
The PCE for the MSA/FS mode and the IFS mode are shown in Fig. 2 for the low-resolution configuration, together with predictions from the model of the instrument response that we developed and used throughout to estimate the sensitivity of NIRSpec before flight. In the figure, the throughput response of the different components entering the model are also shown. The model does not include the light losses due to the finite size of the aperture, which however do affect the data presented here - in the case of the square-aperture these are expected to be relatively small. The PCE values, in MSA/FS mode, for the medium and high resolution configurations are shown in Fig. 3 - also compared to the model. For the IFU, the PCE values for the grating configurations available are shown in Fig. 4.
|
|
Although not presented here, we note that for the configurations for which observations of more than one standard star was available we obtained results completely consistent with each other.
In general the efficiency of NIRSpec meets or exceeds the predictions of our pre-flight model. Significantly higher than predicted performances are achieved in particular for the high-resolution configurations, for the MOS/FS mode, and for all configurations below m, for the IFS mode. We notice a dip in efficiency with regard to predictions above m – in particular for the IFS mode, where we see 10–20% less throughput than predicted. In the case of the FS/MOS, this difference is (at least partly) explained by the effect of the slit losses and the fact that they become more significant at these wavelength, due to the geometrical truncation of the larger point-spread function (PSF) - see next section. In the case of IFS mode, the differences between data and predictions are likely due, partly, to diffraction losses at the level of the IFU 100 mas-slice, which affect the observations (prevalently in the red) but are not included in the model and, partly, to slight inaccurate assumptions in the gold-reflectivity as a function of wavelength, at cryogenic temperatures (recall that the IFU adds 8 gold-coated reflections to the light-path).
|
3.1 Path-losses
Ultimately, in the case of NIRSpec, the total amount of light registered when observing an object is also affected by the light losses occurring in the slit device employed. These depend on a variety of factors: the nature and shape of the target, the slit employed, the positioning of the object within the aperture, and the optical quality of the image formed within the slit. For simplicity we will limit our discussion here to the case of a centered point source. In this case, when employing the relatively wide square aperture (S1600A1), the losses are small, but for the narrower slits and the micro-shutters these are substantial. In the IFS mode, where the flux of the scientific target in the image plane can be recovered by summing over multiple slices, the path losses are limited to their diffraction component and can be in excess of 10% at the longest wavelengths.
Before flight, we computed the expected path losses for a point source, in the various apertures, using a Fourier-optics approach based on the available measured wavefront error maps of all surfaces in the light path[1], including predictions for the telescope. Indeed, because the major source of losses is due to the truncation of the PSF in the silt plane by the geometry of the aperture, the quality of the image is of fundamental importance.
|
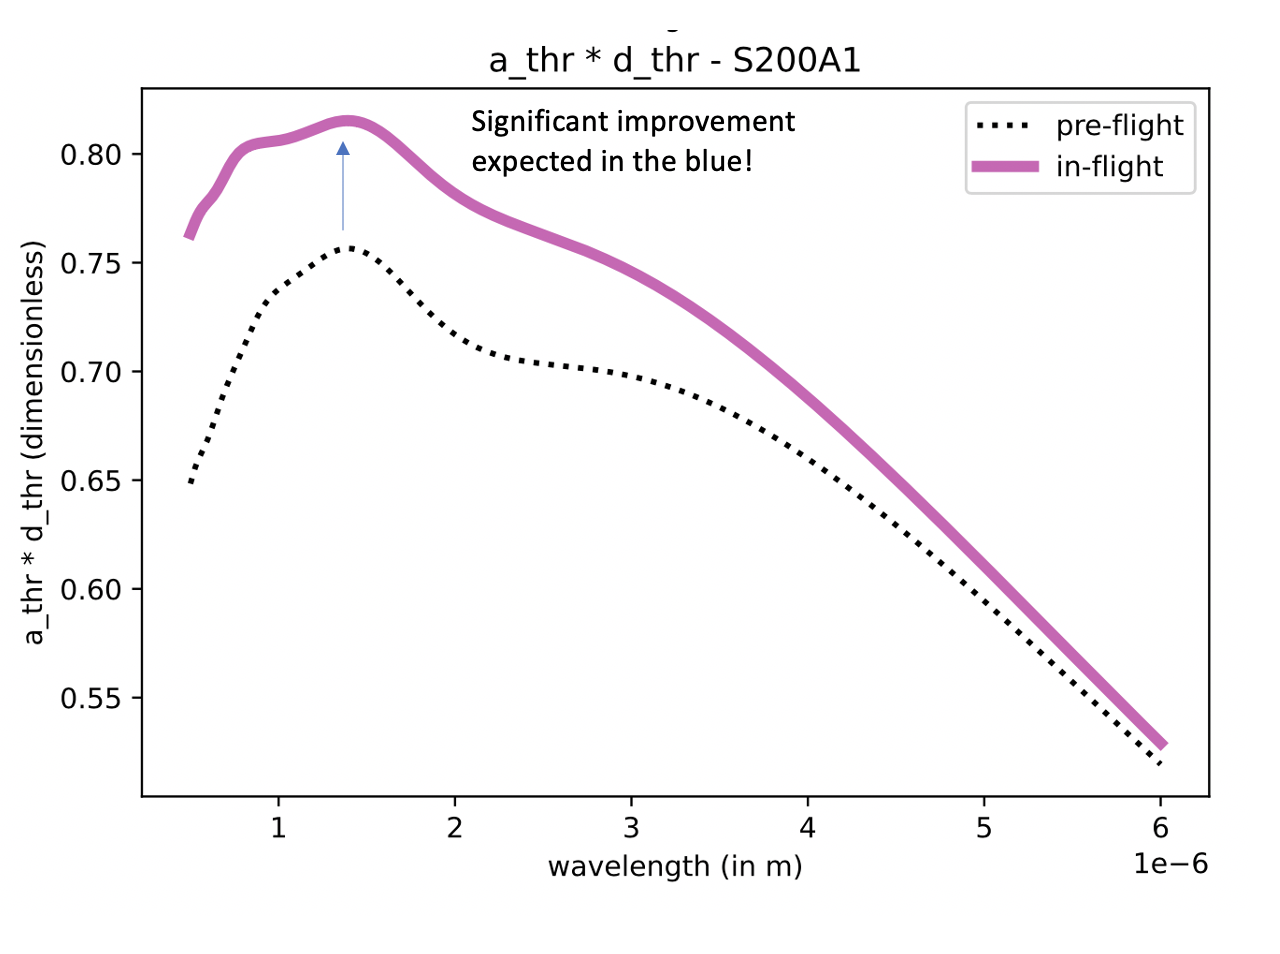
Fig. 5 shows the predicted transmission coefficient as a function of wavelength for slit S200A1/A2, for the pre-flight computation and the updated values using a representative map of the wavefront error obtained during commissioning – see [7]. Since the PSF achieved in flight is of such a high quality, in particular with a higher Strehl ratio, the transmission from our narrowest slit is predicted to improve significantly up to m, where the truncation of the PSF core starts to be the dominant factor in the loss of flux.
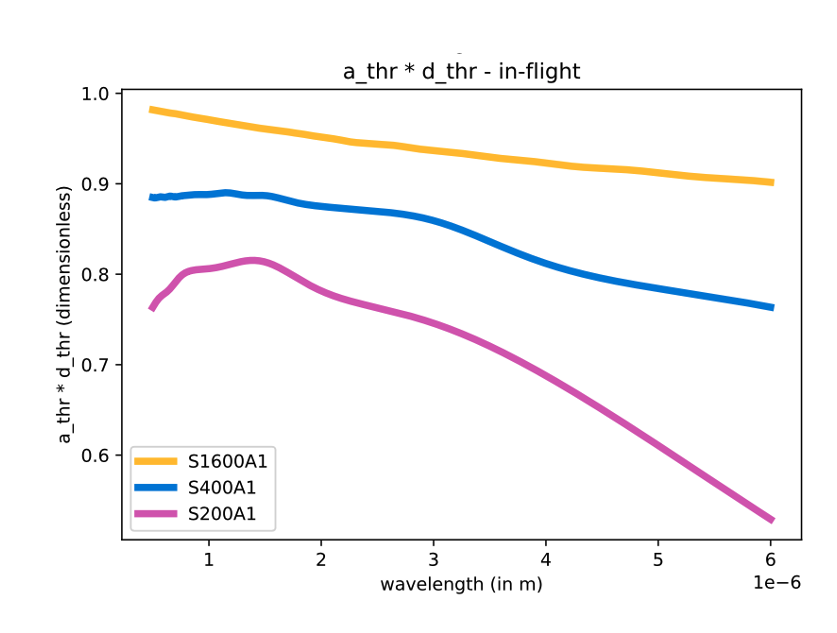
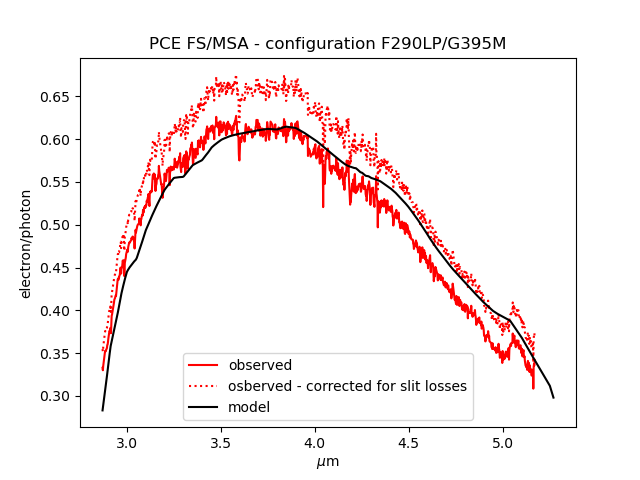
The computed transmission coefficients for all the fixed slits as a function of wavelength based on the in-flight PSF are also shown in Fig. 5 - right panel; the transmission coefficients shown here include both the geometrical losses due to the finite size of the aperture, the dominant term, and the diffraction losses in the collimator pupil, contributing by a few percent[1]. While the relative improvement of the transmission, with respect to the pre-flight prediction, is most noticeable in the blue, the absolute level of losses are higher on the red-side of NIRSpec wavelength range where the PSF full-width half-maximum is larger: indeed, this is partly the reason for an apparent drop in performance in the red when comparing the observed PCE with the model predictions (which does not include path losses), for the FS/MOS mode. Using the transmission coefficients for slit S1600A1, to correct for this effect for the case of the F290LP filter, both M and H gratings, brings the PCE values right in line with the predictions also for these configurations, as shown in Fig. 6.
We have currently not yet updated our estimates of path losses in the case of the IFS mode.

|
4 DISCUSSION AND CONCLUSION
For many years during the development of NIRSpec, we had to rely on a model of the instrument PCE, anchored to measurements obtained during the instrument level testing that took place in 2013 - when the instrument was not yet in its final flight configurations. For the MOS/FS mode, the anticipated PCE, excluding slit losses, was very high, reaching in excess of 50% for the prism, and at peak blaze in all six gratings [1]. For the IFS the PCE performance was predicted to be approximately 50% to 10% lower, going from the blue- to the red-end of NIRSpec operating wavelength range[8], since the IFS introduces eight further reflections.
The observations performed during commissioning demonstrates that NIRSpec is equipped with extraordinarily efficient optics and detectors. In the MOS/FS mode, the observed PCE overall meets or exceeds the predictions; for the IFS mode, the performance in the blue are significantly higher than anticipated (30% below 2 m) and lower than expected above 4 m (up to 20%). In this case, the reasons for the discrepancy between the model and the measurements could be a combination of unaccounted for diffraction losses at the level of the IFU 100 mas-slices and inaccurate assumptions in terms of the gold-reflectivity as a function of wavelength, at cryogenic temperatures.
Beside the optical efficiency, the other fundamental parameter driving the photometric sensitivity of an instrument such as NIRSpec is the noise performance of the detector. NIRSpec is equipped with extremely low-noise Teledyne H2RG arrays and, as illustrated by S. Birkmann et al.[6] at this conference, the behaviour of the two sensors is excellent, with noise figures that meet the anticipated in-flight performances. Hence, NIRSpec achieves the sensitivity projected before launch by Ferruit et al. [9], for the FS and MOS mode, and Böker et al. [8], for the IFS mode.
JWST/NIRSpec is confirmed to be the most sensitive near-IR spectrograph currently available for astronomical studies ready to deliver exciting new observations.
References
- [1] Jakobsen, P., Ferruit, P., Alves de Oliveira, C., et al., “The Near-Infrared Spectrograph (NIRSpec) on the James Webb Space Telescope. I. Overview of the instrument and its capabilities,” A&A 661, A80 (May 2022).
- [2] Geyl, R., Ruch, E., Vayssade, H., Leplan, H., and Rodolfo, J., “NIRSpec optics development: the final report,” Society of Photo-Optical Instrumentation Engineers (SPIE) Conference Series 8146, 130 (2011).
- [3] Rauscher, B. J., Boehm, N., Cagiano, S., et al., “New and Better Detectors for the JWST Near-Infrared Spectrograph,” PASP 126, 739 (Aug. 2014).
- [4] Lightsey, P. A., “Stray light field dependence for the James Webb Space Telescope,” Society of Photo-Optical Instrumentation Engineers (SPIE) Conference Series 9904, 81, SPIE (2016).
- [5] Böker, T., Abul-Huda, Y., Altenburg, M., et al., “Status of the JWST/NIRSpec Commissioning Campaign,” Society of Photo-Optical Instrumentation Engineers (SPIE) Conference Series This conference, SPIE (July 2022).
- [6] Birkmann, S., Giardino, G., Sirianni, M., et al., “The In-Flight Noise Performance of the JWST/NIRSpec Detector System,” Society of Photo-Optical Instrumentation Engineers (SPIE) Conference Series This conference, SPIE (July 2022).
- [7] Scott Knight, J., Lightsey, P.A., “Webb Telescope Imaging Performance,” Society of Photo-Optical Instrumentation Engineers (SPIE) Conference Series This conference, SPIE (July 2022).
- [8] Böker, T., Arribas, S., Lützgendorf, N., et al., “The Near-Infrared Spectrograph (NIRSpec) on the James Webb Space Telescope. III. Integral-field spectroscopy,” A&A 661, A82 (May 2022).
- [9] Ferruit, P., Jakobsen, P., Giardino, G., et al., “The Near-Infrared Spectrograph (NIRSpec) on the James Webb Space Telescope. II. Multi-object spectroscopy (MOS),” A&A 661, A81 (May 2022).