yyyy/mm/dd \Acceptedyyyy/mm/dd
galaxies: clusters: individual (CIZA J1358.9-4750) - radio continuum: galaxies - X-rays: galaxies: clusters
Diffuse radio source candidate in CIZA J1358.9-4750
Abstract
We report on results of our upgraded Giant Metrewave Radio Telescope (uGMRT) observations for an early-stage merging galaxy cluster, CIZA J1358.9-4750 (CIZA1359), in Band-3 (300–500 MHz). We achieved the image dynamic range of using the direction dependent calibration and found a candidate of diffuse radio emission at 4 significance. The flux density of the candidate at 400 MHz, mJy, is significantly positive compared to noise, where its radio power, W Hz-1, is consistent with those of typical diffuse radio sources of galaxy clusters. The candidate is associated with a part of the X-ray shock front at which the Mach number reaches its maximum value of . The spectral index () of the candidate, , is in agreement with an expected value derived from the standard diffusive shock acceleration (DSA) model. But such a low Mach number with a short acceleration time would require seed cosmic-rays supplied from active galactic nucleus (AGN) activities of member galaxies, as suggested in some other clusters. Indeed, we found seven AGN candidates inside the diffuse source candidate. Assuming the energy equipartition between magnetic fields and cosmic-rays, the magnetic field strength of the candidate was estimated to be G. We also find head-tail galaxies and radio phoenixes or fossils near the CIZA1359.
1 Introduction
The largest self-gravitating systems in the universe, galaxy clusters, are several Mpc in size and M⊙ in mass and are known to contain hot ( K) intracluster medium (ICM). This thermal energy is thought to be converted from huge gravitational energy of the large-scale structure through the bottom-up structure formation. Pairs of two sub-clusters in close location are thought to be colliding each other (e.g., [Markevitch & Vikhlinin (2007)] for a review), called merging clusters, and they are the sites of this energy conversion. A major energy-conversion mechanism is believed to be a shock wave formed during the merger. However, detailed physical mechanisms of shock wave such as particle acceleration, magnetic-field amplification, and turbulence generation are longstanding questions in astrophysics.
Shock wave in the ICM is often identified from X-ray observations of ICM’s density and/or temperature jumps. The shock is also found from radio observations of synchrotron radiation, called radio relics, emitted from the shock-accelerated cosmic-ray electrons (e.g., [Feretti et al. (2012), Akahori et al. (2018a), van Weeren et al. (2019)] for reviews). The Fermi 1st order acceleration, namely the diffusive shock acceleration (DSA, [Blandford & Eichler (1987)]), is thought to be one of the plausible theories for the particle acceleration. Meanwhile, there are other classes of diffuse radio emission in galaxy clusters, radio halos, mini-halos, and radio bridges. Some of them are thought to be formed by turbulence based on the Fermi 2nd order acceleration (Brunetti et al., 2001; Fujita et al., 2003). Radio bridge is a relatively new class of diffuse radio emission, which was found at the linked region of early-stage merging clusters (Govoni et al., 2019; Brunetti & Vazza, 2020; Botteon et al., 2020). Since turbulence acceleration suffers from the acceleration efficiency, seed cosmic-rays supplied from AGN jets of member galaxies were proposed for the radio bridges (Brunetti & Vazza, 2020).
Another important factor for thermal evolution of the ICM is AGN jets launched from the supermassive black holes of member galaxies. In the last decades, AGN jet is thought to be a promising source to solve the so-called cooling flow problem (Fabian (1994) for a review), while the co-existence of cooling gas and AGN jets in Phoenix galaxy cluster (Kitayama et al., 2020; Akahori et al., 2020) raise a new question on AGN feedback. A bent AGN jet in Abell 3376 indicated a tight connection between the jet and the coherent magnetic field at the cold front of the cluster (Chibueze et al., 2021). The spectral index distribution exhibits a plateau near the bending point, suggesting re-acceleration of cosmic rays likely by magnetic reconnection. Recently, AGN jet is more recognized as a source of cosmic rays in the ICM. AGN jets connecting to radio relics are found in, for example, Abell 3411 (van Weeren et al., 2017) and Abell 3376 (Chibueze et al., 2022). In Abell 3411, the spectral index changes continuously along the radio structure, indicating spectral aging caused by cosmic-ray electron cooling. Therefore, a detailed study of radio sources in galaxy clusters can provide a new knowledge, such as particle acceleration, in addition to understanding the evolution of the sources themselves.
CIZA J1358.9-4750 (CIZA1359) is thought to be one of the only several known early-stage merging galaxy clusters. This object is a Clusters in the Zone of Avoidance (CIZA) survey target, thus CIZA1359 is found relatively close to the Galactic Plane (Kocevski et al., 2007). These basic information are summarized in table 2.1. Kato et al. (2015) performed a detailed analysis of the Suzaku X-ray observation and found a discontinuous high-temperature region in the linked region between the two X-ray peaks of subclusters. They suggested that the high-temperature region was formed by the merger shock wave passing along the merger axis. Omiya et al. (2022) further studied X-ray properties of CIZA1359 and found another shock front at the northern edge of the hot region. These studies also suggest that the merger axis is off the plane of the sky.
CIZA1359 is relatively nearby at redshift , which is convenient for studying its detail, and is expected to be investigated in more detail. In this paper, we report on the results of the upgraded Giant Metrewave Radio Telescope (uGMRT) observation of CIZA1359, with the aim of detecting any diffuse emission of CIZA1359. In Section 2 we describes the details of the uGMRT observations and the data reduction, and in Section 3 we present some obtained radio image and spectral index map. In Section 4, we discuss on relic candidate of CIZA1359. We have used cosmological parameters , and in this work.
2 Observation and Data reduction
2.1 The Observation
We conducted uGMRT Band 3 (300 – 500 MHz) observations of CIZA1359 (the project code 39_045). Both narrow- and wide-band modes were adopted. The center frequency and the bandwidth of the narrow-band mode are 317 MHz and 33 MHz, respectively, and those of the wide-band mode are 400 MHz and 200 MHz, respectively. The field of view and the angular resolution are 75 arcmin and 8.3 arcsec, respectively, both in diameter at 400 MHz.
The observations were carried out in Cycle 39 and were split into two separate observations on 13–14 January 2021 (day 1) and 24–25 February 2021 (day 2) in International Atomic Time (TAI). The observing time was 5 hours and 15 minutes on day 1, and 4 hours and 16 minutes on day 2. In each day, we observed a flux density, bandpass, and polarization calibrator, 3C286, for 10 minutes at the beginning and the end of the observation, and observed a phase calibrator, 1349-393, for 5 minutes every 25 minutes. Thus, the target (CIZA1359) on-source time was 337 minutes in total, 196 minutes on day 1 and 141 minutes on day 2. According to the observation log, two 45 meter-diameter antennas, C03 and C11, were not used on day 2. Therefore, only day 1 data were used in this study, as day 2 data tend to be a little noisy.
2.2 The Data Reduction
The radio maps in this paper. Label Frequency BW R.M.S. Beam size Beam PA Figure Unit MHz MHz mJy beam-1 asec asec degree Narrow-band 317 33 21.0 6.9 -0.1 - Wide-band 400 200 14.8 5.2 -6.2 Figure 1 Sub-band 01 317 33 22.8 5.7 1.6 Figure 7 Sub-band 02 350 33 15.1 5.0 -0.5 Figure 7 Sub-band 03 385 33 17.8 5.6 -0.3 Figure 7 Sub-band 04 417 33 16.2 5.4 1.6 Figure 7 Sub-band 05 450 33 14.7 4.9 -1.1 Figure 7 Sub-band 06 481 33 12.7 4.6 -1.4 Figure 7 Smoothed Wide-band 400 200 25 25 0.0 Figure 1, 3, 7, 2
The data were analysed using the SPAM (Source Peeling and Atmospheric Modeling; Intema (2014)) which is based on the AIPS (Astronomical Image Processing System), produced and maintained by NRAO. The SPAM employed the AIPS 31DEC13 and was controlled by python 2.7. There is a bright compact source of about mJy in the field of view, and the beam pattern of this bright source is clearly visible in the dirty image, showing that this source contaminates the image by causing strong sidelobes. Therefore, we applied the SPAM’s Direction-Dependent Calibration (DDC; Intema et al. (2017)) to improve the dynamic range of the final image. Self-calibration is also applied to the Direction-Independent Calibration (DIC) before the DDC. The CLEAN algorithm is used for imaging in the SPAM.
In the analysis of the narrow-band data, we aim to create a catalog of sources for use in the DDC for the wide-band data. To select peeling sources, a list of radio sources in the field-of-view was compiled using a source catalog from the TIFR GMRT Sky Survey (TGSS) in this analysis. Imaging in the SPAM was performed with the Briggs robustness parameter of -1.0. The Python Blob Detector and Source Finder (PyBDSF; Mohan & Rafferty (2015)) was used to catalog the compact sources in the field-of-view.
In the analysis of the wide-band data, the data were split into six subbands and the DDC was applied to each subband data using the source catalog obtained from the analysis of the narrow-band data. The final output from the SPAM was the outlier-removed uv data. After that, a full-band radio image was derived by combining the uv data of subbands using WSClean (w-stacking clean; Offringa et al. (2014)). In the imaging with WSClean, we first employ uniform weighting of the robustness to identify compact sources from the data. The modeling and subtraction of the compact sources can reduce sidelobes of them, particularly from bright ones. Next, a multi-scale CLEAN (Cornwell, 2008) was performed with the robustness closer to natural weighting to derive the diffuse emission from the data.
The primary beam effect was corrected by using the AIPS task pbcor. The function used to the applied primary beam model is , where is distance parameter (see AIPS Cookbook for details). AIPS was also used to edit the data at each frequency to the same pixel size and spatial resolution, if necessary.
When calculating the flux density , we adopted an empirical 10% error () of the absolute flux density (see also Section 3.1 according to the DDC flux decay). For a diffuse source, the flux density error, , was given by , where is the rms noise in an image, and is the number of beams in the diffuse source (e.g., Kale et al. (2022)).
2.3 Other Data
In this study, X-ray data from Suzaku are used to confirm the spatial correlation with the ICM (Kato et al., 2015). In addition, the ICM temperature inferred from the XMM-Newton data was used as an indicator of the shock region (Omiya et al., 2022). The MeerKAT Galaxy Cluster Legacy Survey Data Release 1 (MGCLS DR1; Knowles et al. (2022)) were also combined to determine the spectral index. The used MGCLS data were Enhanced imaging products, which was corrected the primary beam effect.
3 Results
3.1 Total Intensity Maps
Imaging parameters performed to focus on the diffuse emission. Weighting R.M.S. Beam size Beam PA Taper Figure Unit mJyb̃eam-1 asec asec degree arcsec uniform 22.5 - briggs -1 24.7 22.5 - briggs 0 29.6 22.5 Figure 2 (a) briggs 1 24.7 22.5 -
We derived the total intensity map of the narrow-band data at 317 MHz. The DDC was applied to the imaging and the robustness parameter of was set. The rms noise level of the map is mJy beam-1 with the DDC (table 2.2), while that is mJy beam-1 with the IDC. Therefore, the DDC improved the sensitivity and dynamic range by more than one order of magnitude. We found and cataloged 423 radio sources by the PyBDSF. The brightest source is PMN J1401-4733 at the north-east of the field of view, with the total flux density of mJy and a peak intensity of mJy beam-1. Thus, the achieved image dynamic range is 17,195.
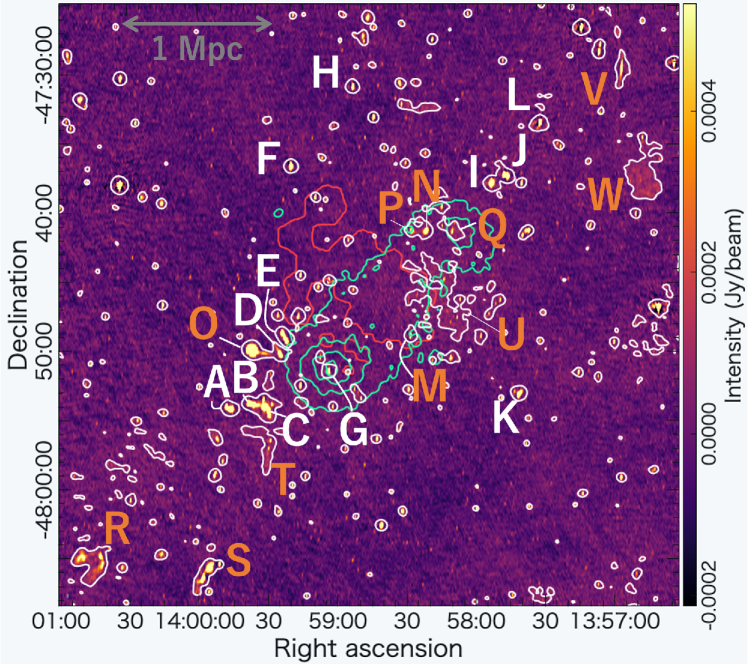
Next, we derived the total intensity map of the wide-band data at 400 MHz. We used the above source catalog as a prier sky model for the DDC, then obtained the rms noise level of the map, mJy beam-1 (table 2.2), or the achieved image dynamic range of 38,108 for the robustness parameter of . The wide-band image of CIZA1359 is shown in figure 1. The background colour is the radio intensity distribution, where the white contour indicates the mJy beam-1 level (4 ) for the uGMRT smoothed at . The alphabetic labels indicate 23 distinguished sources. The white labels from A to L are known sources, while the orange labels from M to W are newly-detected111After we submitted this paper, Kale et al. (2022) reported Sources from M to Q. extended sources.
One of the known issues on the DDC analysis is that a lot of DDC solutions result in global decay of the fluxes across the field (e.g., Patil et al. (2016)). To assess this decay, we checked the visibility amplitude with respect to the DDC and DIC results. The maximum angular scale of source U, which is the largest feature among the structures detected in this paper, is 6 arcminutes, which is about 0.6 kilo wavelength at 300 MHz. The medians of the visibility amplitude over a range of 0.6 kilo wavelength are 1.168 Jy for the DDC and 1.247 Jy for the DIC, respectively. Therefore, we measured an offset of about 0.94 in the amplitude ratio around the angular scale of source U. The error can be compared to an empirical 10 % error of the absolute flux we display in this paper. The Flux accuracy checks are summarized in Appendix A.
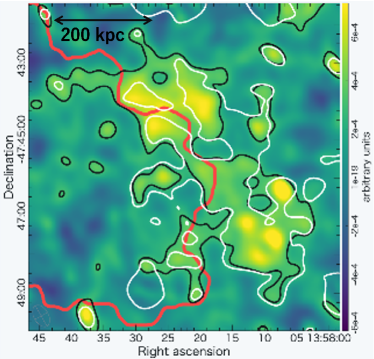
To facilitate our discussion, a compact-source-subtracted image for Source U was derived. The compact sources were subtracted from the image by fitting with a point-source model with a Gaussian function using PyBDSF. We explored the robustness closer to natural weighting to image the diffuse emission. Table 3.1 summarize the noise level and resolution from the CLEAN with different weightings; we employed the robustness of . The results are shown in figure 2 (a). The hot ICM region is shown as red contours, which would indicate the approximate location of the merger shock front. The white contours are the same as that in figure 1. The black contours corresponds to 3 in the compact-source-subtracted image which is also shown in the background color.
3.2 Spectral Index Map
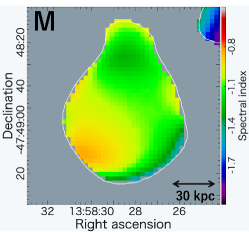
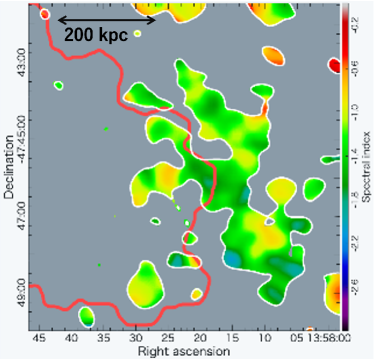
We convolved all images to a 25-arcsec square beam using the AIPS task convl, where the pixel size and the number of pixels were fixed using the AIPS task hgeom. We then adopted the least-square fit to derive the best-fit spectral index assuming a power-law and calculated the index pixel by pixel. We performed the fitting in a linear space to account for the negative flux value caused by the noise. To derive the spectral index, we added the MGCLS DR1 data (see Section 2.3) to our uGMRT data. Details on the calculation of the spectral index are summarized in Appendix B. Figure 2 (b) and figure 3 show the spectral index maps of newly detected extended sources in CIZA1359. The background colour indicates the spectral index, , such that , and the white contour is the same as that in figure 1.
We also attempted to calculate in-band spectral indices for bright compact sources using subband images, for each GMRT and MeerKAT data. We obtained approximately the same index no matter which data is used for fitting for the sources such as Source A. On the other hand, because faint sources including many diffuse-emission features have a low SN in each pixel, the subband spectral fitting results in the spectral index close to the slope of the noise floor. Therefore, for the faint sources we used the combined data in each band, where the center frequencies are 400 MHz and 1280 MHz, to derive the spectral index, .
In addition to the spectral index of each pixel, we derived the mean spectral index using the total flux densities shown in columns 4 and 5 of table 3.3. The total flux density was estimated by assuming the size of each source. The resultant mean spectral index is listed in column 6 of table 3.3. Here, the spectral index error was derived from the error propagation equation ().
3.3 Source Catalog
Radio source catalog of the CIZA1359 field. Columns are: (1) Source name. (2) Average intensity in mJy beam-1, which adopts the white contours of figure 1 as the size of the source. The error can be used mJy beam-1. (3) Peak intensity in mJy beam-1, size of the source is the same as column 2. The error is used a rms noise around the source in the point source subtracted image. (4) Integrated flux which is not subtracting point sources in mJy at 400 MHz, size of the source is the same as column 2. (5) Same as column 4 but frequency is 1280 MHz. (6) Spectral index, which is calculated using the fluxes in columns 4 and 5. (7) Corresponding galaxies nearby in sky-plane. Label Mean intensity Peak Flux Flux Identification 400 MHz∗1 400 MHz∗1 400 MHz∗1 1280 MHz∗2 (1) (2) (3) (4) (5) (6) (7) A 4.74 - B 4.86 2MASX J13593870-4753472 C 3.72 2MASX J13593065-4754053 D 2.47 2MASX J13592419-4750253 E 3.26 2MASX J13592518-4749333 F 2.56 - G 1.18 2MASX J13590381-4751311 H 2.48 - I 2.91 2MASX J13575383-4737543 J 5.79 - K 3.12 - L 5.47 - M 2.20 - N 1.81 1RXS J135821.7-474126 O 4.70 - P 1.30 - Q 0.72 2MASX J13581085-4741243 R 1.39 2MASX J14004272-4804474 S 2.41 - T 0.65 2MASX J13592976-4757043 U 0.54 2MASX J13580947-4745213 2MASX J13581294-4748183 6dFGS gJ135839.1-474723 V 1.57 2MASX J13565832-4729231 W 0.74 - {tabnote} : This work; : MGCLS (Knowles et al., 2022)
We found 23 distinguished radio features in the image. We labeled them from Sources A to W (figure 1). The parameters for each source are summarised in table 3.3.
Sources from A to L were reported in the previous ATCA observation (Akahori et al., 2018b), where several sources are closely concentrated on the south-western rim of the southern subcluster of CIZA1359. The spectral indices are comparable to those estimated with ATCA and those of typical AGN. We found that some of the sources were clearly larger in spatial scale than the synthesized beam and were resolved into multiple components. Source G is located near the center of the south subcluster and has an apparent size of about (=38 kpc x 33 kpc) at the 3 signal to noise level. It is one order of magnitude smaller than the typical size of mini-halos ( kpc), so that it is more likely to be an AGN radio lobe. Source G is cataloged in SIMBAD as a galaxy 2MASX J13590381-4751311. It has the redshift of z=0.074, which is the consistent with the redshift of CIZA1359.
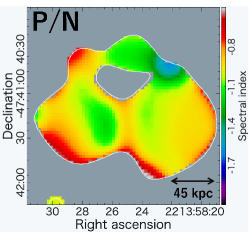
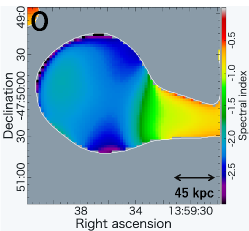
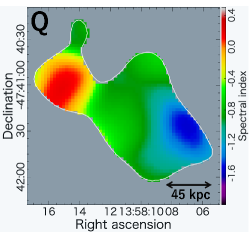
Sources from M to Q were reported in the previous GMRT observation (Kale et al., 2022). Similarly to Source G, Source Q is more likely to be an AGN, although it is located near the center of the north subcluster with a size of (=90 kpc 45 kpc). Source Q is cataloged in SIMBAD as a galaxy 2MASX J13581085-4741243. Its redshift, z=0.074, is consistent with the redshift of CIZA1359. Source O, which is unresolved in TGSS and SUMSS images, consists of a round structure and a narrow east-west linear structure. A high-resolution image such as MGCLS at 1.28 GHz shows a head-tail galaxy-like structure, while there is no corresponding source in the ATCA image at 2.1 GHz (Akahori et al., 2018b). Indeed, a steep spectral index of and the 400 MHz total flux density, mJy, predicts the 2 GHz flux density of 1.9 mJy (with a size of ), which is almost the same as the sensitivity limit of the ATCA observation. Source O can be classified into an Ultra-Steep Spectrum (USS) source found in galaxy clusters (Mandal et al., 2019), so that Source O may be a fossil plasma source. We could not find any corresponding source to Source O in SIMBAD.
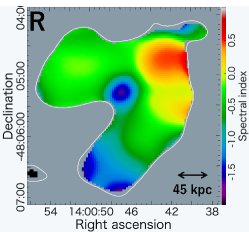
Source R is about 2 Mpc away from the southern subcluster center to the south-east and is cataloged in SIMBAD as a galaxy 2MASX J14004272-4804474. We found that it has a radio structure like a head-tail galaxy. There is also a spectral index gradient, with aging from the head to the tail. It has the redshift of z=0.075, which is comparable to that of CIZA1359.
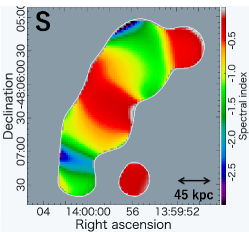
Source S has a FRII-like radio structure about 1.5 Mpc away from the southern subcluster center. SIMBAD cataloged a galaxy at z=0.054 as 2MASX J13595922-4805486 in the neighbourhood. However, 2MASX J13595922-4805486 may be associated with a faint radio structure seen at 11 arcsec away to the northeast from Source S.
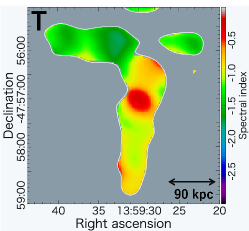
Source T is located at the southeast of the CIZA1359 and has a head-tail galaxy-like radio structure. It has an elongated structure to the south and a faint structure to the east. There is no associated source within 30 arcsec in SIMBAD. At the peak flux position of the south component of Source T, there is a galaxy 2MASX J13592976-4757043 in SIMBAD. The redshift of 2MASX J13592976-4757043 is z=0.081, which is located at far side of CIZA1359.
Source U is a candidate of diffuse cluster emission. It is located at the south of the northern subcluster and in between the two subclusters. Four galaxies were found by SIMBAD within a 4 arcmin radius centred on source U; 2MASX J13580947-4745213 is located at the north-west of Source U with the redshift, z=0.078, 2MASX J13581294-4748183 is located at the south of Source U with the redshift, z=0.069, 6dFGS gJ135839.1-474723 is located at the east of Source U with the redshift, z=0.067, and LEDA 184317 is located at the north-east of Source U with an unknown redshift. Source U is the largest diffuse source in the uGMRT image (see figure 1). The signal to noise ratio of Source U is around 4 , where mJy beam-1. With , the point source subtracted flux density is mJy, which significantly deviates from the null. We explore Source U in detail in Section 4.
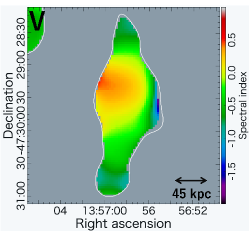
Source V is cataloged in SIMBAD as a galaxy 2MASX J13565832-4729231, with the redshift, z=0.078, similar to that of CIZA1359. It has an elongated structure extending toward north-south. The extended structure appears to be connected to Source W; Source V is like a bipolar radio jets.
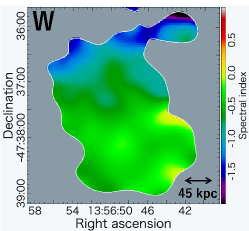
Source W is quadrangle in shape and is the second largest radio structure in the image. No corresponding sources were found in SIMBAD in the vicinity of this Source. The Sources V and W are similar to the structure known as the radio phoenix.
4 Discussion
We explore Source U in detail in the next section 4.1, followed by the discussion of its origin (likely a radio relic) supposing its detection in section 4.2.
4.1 Source U: Diffuse Radio Structure Candidate
4.1.1 Location
First, we focus on the spatial location of Source U. As described in Introduction, the recent X-ray observation found a pair of shock fronts in the linked region (Omiya et al., 2022); the north shock at the northern edge of the hot region, and the south shock at the southern edge of the hot region, where the hot region is shown as the red solid-line in figure 2 (a). The pair shocks seem to be emerged from the interface of the subclusters and be propagating toward each subcluster core.
Such a merger shock has been considered as a site of cluster diffuse radio emission, based on an expectation that the shock accelerates cosmic-ray electrons emitting synchrotron radiation. Actually, the location of Source U is broadly consistent with that of the western part of the north shock indicated by the red contours in figure 2 (a). In fact, the shape of Source U and the shock plane do not exactly coincide with each other. If Source U was excited by a shock wave, it flows down and ages at the downstream-side of the shock front. But it is located at the slightly upstream side. This would be interpreted due to the misalignment of the merger axis with the sky plane, i.e., a projection effect of the viewing angle.
4.1.2 Structure
The shock-associated diffuse radio emission is often seen in the late-stage merging clusters and they are called “radio relics”. Although CIZA1359 is known as the early-stage merging cluster, Source U extends about (), which is comparable in size to radio relics (Feretti et al., 2012).
In the above shock scenario, one may also expect radio emission from the south shock, although our observation did not find any candidate. Interestingly, Omiya et al. (2022) estimated the Mach number of the shocks and found that the north shock has a higher Mach number , while the other part have a lower value of . Therefore, Source U is consistent with the theoretical expectation that a shock wave with a higher Mach number forms a brighter radio emission so that it accelerates cosmic-rays more efficiently. But DSA does not work well at such low Mach number. We discuss the need for re-acceleration in section 4.2.
4.1.3 Radio Power
The radio power of diffuse radio emission in galaxy clusters has been studied in the literature and thus the radio power is also useful to examine whether Source U is a real emission or not. We calculate the monochromatic radio power using the following equation,
| (1) |
where m is the luminosity distance (Wright, 2006), is the radio intensity, and is the area of diffuse emission.
We integrate , which is the point source subtracted intensity, within the area of the white contours in figure 2 (a). To compare the monochromatic radio power in this work with those of 1.4 GHz in the literature, it was converted to the flux at 1.4 GHz from flux at 400 MHz using the spectral index of . The derived radio power is W Hz-1. This is consistent with the known radio relics, halos, shown in figure 4. Therefore, there is no immediate problem in considering Source U as a diffuse radio source of a galaxy cluster.
Note that if we adopt the formula of equation (2) in Akahori et al. (2018b) to derive the upper limit of the radio power, we obtain the value broadly consistent with that derived in their work. The reason for the non-detection in ATCA can be due to the steep spectrum of Source U.
4.1.4 Magnetic Field
Finally, although there are uncertainties caused by theoretical assumptions, it is possible to derive magnetic-field strength, and to discuss a reality of the candidate from comparison with previous estimations. Assuming the energy equipartition between magnetic fields and cosmic-rays, the magnetic field strength can be estimated from synchrotron radiation as follows (Beck & Krause, 2005),
| (2) |
where denotes the spectral index of synchrotron radiation, is the number densities ratio of cosmic-ray nuclei to that of the electrons, is the path length of the synchrotron emitting media, is the intensities at frequency , and is the proton rest energy. The coefficients are, , , , and . We adopted our best-fit value of and MHz, and we assumed the typical values of and (Kierdorf et al., 2017). We then obtained the field strength of 2.1 G from the intensity of Source U, mJy beam-1. Such G magnetic field is commonly found in galaxy clusters (e.g., Kierdorf et al. (2017)). We note that this strength is insensitive to the parameters of equation (2). 1 G-order field strength is derived even when the parameters are changed. However figure 2 suggests that a patchy structure exists within Source U. The structure can cause error in the estimation of the average strength in equation (2).
We can check the field strength from an empirical radial dependence of magnetic field. Using the following equation (Bonafede et al., 2010),
| (3) |
the field strength is estimated to be G at a relic position, (225 kpc) away from the cluster centre in the north, assuming the central magnetic strength, , radial power-law slope, (Bonafede et al., 2010). Also we adopt the central gas density, , the core radius, , and the -model parameter, from (Omiya et al., 2022). Note that and are from the Coma cluster and be expected to vary with cluster. Indeed, in Abell 2382, and are obtained (Guidetti et al., 2008), and in Abell 2255, and are obtained (Govoni et al., 2006). Since these value of CIZA1359 is unknown, we adopted those of the Coma cluster as representative values.
These magnetic field strengths of CIZA1359 estimated by these two independent methods are in good agreement, although they are large theoretical assumptions. This means that the magnetic field strength of CIZA1359 is consistent with other galaxy clusters.
4.2 Origin of Source U
Our assessment of Source U based on its location, structure, spectrum, power, and magnetic field do not suggest that Source U is a noise. In this subsection, we discuss the origin of Source U, supposing that Source U is real.
4.2.1 Comparison with other early-stage merging clusters
To understand the origin of Source U, it is useful to compare it with diffuse radio sources in early-stage merging clusters. This is because the cluster’s physical properties that would be related to the origin are very different between early- and late-stage merging clusters. Here, since it is rather difficult to identify early-stage merging clusters, and there is no catalog of early-stage merging clusters yet, we look for them using the following two methods. The first is to find radio-associated cluster pairs, and the second is to make a list of well-known early-stage merging clusters.
Radio-associated cluster pairs were searched by catalog matching. We (1) checked the coordinates of the radio-associated clusters listed in tables 1 and 3 of Feretti et al. (2012) using SIMBAD, and (2) cataloged if they are within the Plank’s beam FWHM (7.18 arcmin) from the coordinates listed in table 1 of Planck Collaboration et al. (2013) using TOPCAT (Taylor, 2005). As a result, we found 7 radio-associated cluster pairs (table 4.2.1). It should be noted that this catalog may contain not only early-stage merging clusters but also late-stage merging clusters which have close separations of subclusters. Even more, some may be random pairs which are only close in projection on the plane of the sky and have significantly different redshift, although such a case is rare because galaxy clusters sparsely exist in the Universe.
Radio parameters of the cluster pairs. Columns are: (1) Name of radio associated cluster. (2) Right-ascension of the cluster. (3) Declination of the cluster. (4) Structure with radio information in column 5 and 6. (5) Logarithm of radio power at 1.4 GHz from Feretti et al. (2012). (6) X-ray luminosity in the 0.1–2.4 keV band in units from Feretti et al. (2012). (7) Names of cluster that pair with the one in column 1. (8) Expected merging phase that the ”early” and ”complex” mean the early stage which have not completed a core-crossing and the multiple merger, respectively. Name R.A. Dec Structure Log (1.4) pair merger phase deg deg W/Hz erg/sec (1) (2) (3) (4) (5) (6) (7) (8) A209 22.990 -13.576 halo 24.31 6.17 A222 - A399 44.485 13.016 halo 23.30 3.80 A401 early(a) A401 44.737 13.582 halo 23.34 6.52 A399 early(a) A2061 230.336 30.671 relic 23.65 3.95 A2067 - A2063 230.758 8.639 relic 23.26 0.98 MKW3s - A2256 255.931 78.718 halo 23.91 3.75 A2271 complex(b) A2256 255.931 78.718 relic 24.56 3.75 A2271 complex(b) A3562 203.383 -31.673 halo 23.04 1.57 A3558 complex(c) {tabnote} (a)Govoni et al. (2019); (b)Breuer et al. (2020); (c)Haines et al. (2018);
Some clusters including new discoveries are well-known as early-stage merging clusters (e.g., 1E 2216.0-0401 and 1E 2215.7-0404; Gu et al. (2019)). Table 4.2.1 summarizes the information of the clusters that are believed to be early-stage merging clusters. 1E2216.0-0401 indicates a temperature jump of the ICM between the cluster pair (Gu et al., 2019). They suggested that the system is an early-stage merging cluster. They also reported diffuse radio sources between the cluster pairs. They concluded that they are bright AGNs affected in part by the merger shock. Abell 141 (Duchesne et al., 2021) also has a temperature jump and was reported to be an early-stage merging cluster. Radio structures were also found between the subclusters, but it is not possible to isolate whether they are radio bridge, relic, or halo due to lack of spatial resolution. Abell 1775 has a similar X-ray morphology like early-stage merging clusters (Botteon et al., 2021). Sloshing or slingshot effects have been reported. Diffuse radio sources were detected and reported that their structures seem to be slingshot radio halos associated with the X-ray structure. Abell 115 clearly shows two subclusters in its X-ray morphology (Lee et al., 2020). No radio structure was detected between them, while a radio relic is present and implies rather a late-type merging cluster. A3391-A3395 (Brüggen et al., 2021) and A98 have radio structure that seem to associate with the head-tail galaxy (Paterno-Mahler et al., 2014).
List of well-known early-stage merging clusters. Columns (1) to (6) are the same as in table 4.2.1. Column (7) is cluster pair number. Name R.A. Dec Radio source Log (1.4) Pair deg deg W/Hz erg/sec (1) (2) (3) (4) (5) (6) (7) A98 11.608 20.490 galaxy - - 1 \hdashlineA115 13.998 26.321 relic 25.18 8.9 2 \hdashlineA141 16.376 -24.655 unknown 24.16 12.6(d) 3 \hdashlineA399 44.485 13.016 halo 23.36 3.8 4 A399/401 d 44.737 13.582 relic 23.39 5.2(e) A399/401 f 44.737 13.582 relic 23.36 5.2(e) A401 44.737 13.582 halo 23.38 6.5 \hdashlineA1758 203.134 50.510 relic 23.57 9.4(f) 5 A1758N 203.134 50.510 halo 24.79 7.1 A1758S 203.134 50.510 halo 23.89 7.1 \hdashlineA1775 205.482 26.365 halo - 1.5(f) 6 \hdashlineA3391 96.564 -53.681 galaxy - 1.3(g) 7 A3395 96.880 -54.399 galaxy - 1.3(g) \hdashline1E 2215.7-0404 334.585 -3.828 galaxy - 0.8(h) 8 1E 2216.0-0401 334.673 -3.766 galaxy - 0.8(h) \hdashlineCIZA1359 209.667 -47.767 relic 24.38 3.1(i) 9 {tabnote} (d)Ebeling et al. (1996); (e)Average value of A399 and A401; (f)Ebeling et al. (1998); (g)Vikhlinin et al. (2009); (h)Gioia et al. (1990); (i)Kato et al. (2015);
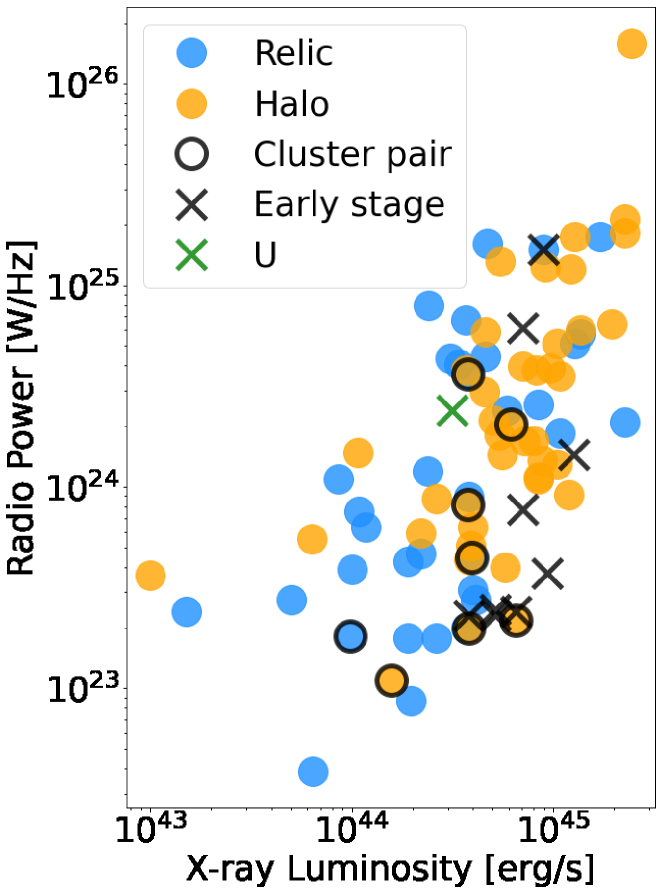
Figure 4 plots the radio-associated cluster pairs (table 4.2.1) and the early-stage merging clusters (table 4.2.1) as black circles and black crosses, respectively. We see that the distributions of them are very scattered in the relation between radio power and X-ray luminosity. CIZA1359, the green cross, appears to be inside the dispersed distribution, supporting that there is no contradiction in considering CIZA1359 to be a member of these families.
4.2.2 Is Source U a radio relic?
We next discuss which Source U can be classified into. As broadly described in Introduction, there are some known classifications of diffuse radio emission of galaxy clusters (see e.g.,Feretti et al. (2012); van Weeren et al. (2019) for reviews). We look into acceleration mechanism of cosmic-ray electrons which produce the observed radio emission of Source U. Discussion about the acceleration mechanism is helpful for the source classification.
As discussed above, Source U seems to be associated with the northern shock with the Mach number of 1.7. Based on the standard DSA and test-particle regime, the energy spectrum of the relativistic electrons, , of , depends on the shock compression, , as . We obtain () for the Mach number 1.7 and give . If magnetic field is roughly constant over the radio source, such a power-law electron distribution will lead synchrotron emission with a spectral index for . The observed spectral index and its error is consistent within error with the estimated spectral index. This could be the case that the DSA is working for the particle acceleration at cluster shocks.
It is, on the other hand, already known that the acceleration efficiency at a weak shock is way too low to reproduce the observed radio luminosity (e.g., Kang et al. (2012); Pinzke et al. (2013); Vink & Yamazaki (2014)). To explain this issue, several possibilities are proposed which include 1.) re-acceleration of pre-accelerated electrons (e.g., Markevitch et al. (2005); Kang et al. (2012); van Weeren et al. (2016)), 2.) shock drift accelerations (e.g., Matsukiyo et al. (2011); Guo et al. (2014, 2014)), 3.) other mechanisms, for instance turbulence accelerations (e.g., Fujita et al. (2015, 2016); Kang et al. (2017)) and of course all observational systematic on both X-ray and radio side (e.g., Akamatsu et al. (2017); Stroe et al. (2017); Hoang et al. (2018)).
Indeed, there are seven compact sources in the region of Source U, with spectral indices of to which are comparable to the typical value of radio jets (Sabater et al., 2019). Moreover, Source U is well aligned with the temperature jump (figure 2). Therefore, a possible origin of Source U would be the result of merger shock re-acceleration of pre-seeded cosmic-ray electrons by AGN. Note that the spectral index map (figure 2 (b)) shows patchy distribution and less clear global gradient due to the aging with respect to the shock propagation direction, implying multiple seeding from these AGN.
Moreover, our no detection of diffuse radio emission associated with the southern shock with the Mach number of may indicate that there is a threshold of efficient (re-)acceleration at the shock age of Myr (Kato et al., 2016). It is thus important to examine whether theoretical models of particle acceleration can explain this marginal detection and non detection simultaneously. There are also compact radio sources in the other shock regions, and for example, the spectral indices range from to for six compact sources at the eastern part of the south shock. Thus, there is also a possibility of seeding cosmic-ray electrons from AGN. It is necessary to clarify whether they are member galaxies associated with CIZA1359. Those are future works of this paper.
Finally, we discuss that which of the traditional classifications for cluster diffuse emission this fits into. Source U indicates that (I) it is found in between two subclusters of an early-stage merging cluster, (II) it has a structure along the shock, (III) it possesses a relatively flat spectral index of , and (IV) multiple non-bright radio point sources are located within the diffuse radio emission and there are no bright AGN. These facts implies that Source U is a radio relic. Feature (I) is also seen in the radio bridges of early-stage merging galaxy clusters, such as Abell 399 and 401 (Govoni et al., 2019) and Abell 1758 (Botteon et al., 2020). However, these clusters also have radio halos and relics (Botteon et al., 2018), while CIZA1359 has no any other diffuse sources. Radio relics tend to be brighter than radio bridges, so that we expect which applies to CIZA1359 as well. As no other diffuse emission has been detected in CIZA1359, it is more reasonable to consider Source U as a relic than a bridge.
Govoni et al. (2019) found the formation scenario of the radio bridges between Abell 399 and 401. That is, contact of two clusters generates a shock and turbulence is excited at the post-shock region. Seed cosmic-ray electrons are re-accelerated through turbulence by the Fermi 2nd order acceleration mechanism. Such turbulence-(re)acceleration could be realized in CIZA1359 as well, though the short age of Myr prefers the direct shock acceleration by the Fermi 1st order acceleration mechanism. In other words, the radio relic candidate of CIZA1359 is a precursor of radio bridge. Even in the case, the low Mach number such as would require seeding of cosmic-rays to achieve efficient acceleration and radio emission (e.g., Gu et al. (2019)).
5 Summary
We reported the results on a SPAM-based analysis of uGMRT observations at 300–500 MHz for the early-stage merging galaxy cluster, CIZA J1358.9-4750 (CIZA1359). We found many radio sources such as a head-tail galaxies, FRII types radio lobes, AGNs, and so-called radio phoenixes or fossils. We found a diffuse radio source candidate named Source U with the flux density of mJy roughly along a part of the shock front found in the previous X-ray observations.
We discussed whether Source U is real or noise from several aspects of its properties. First, the location of Source U is consistent with that of the shock front. Such an association is often seen in radio relics. Second, the size is comparable to known radio relics. Interestingly, the structure of Source U coincides with the shock structure where the Mach number of the shock wave reaches its maximum value of . Third, the relation between the radio power and the X-ray luminosity is in good agreement with that of other radio relics. And finally, the energy-equipartition magnetic-field strength, 2.1 G, is a typical value seen in galaxy clusters and relics. The above facts favor that Source U is a real radio relic.
If Source U is a real diffuse radio source, this study confirmed that even a very weak () shock can accelerate cosmic-rays and emit observable radio emission. Moreover, we did not find any radio candidate at the shock with , suggesting the existence of an acceleration-efficiency threshold around the Mach number. We suspect that seed cosmic rays were supplied by some of compact radio sources (AGN) associated with Source U and the re-acceleration was taken place at the shock.
It is important to identify the redshifts of the radio sources in order to elucidate the origin of the relic candidates. The identification is also necessary to examine whether head-tail galaxies seen in this observation interact with CIZA1359 or not. In addition, the relic candidate has a relatively steep spectrum. Therefore, future observations at lower frequencies such as 144 MHz would be promising to detect the candidate. Finally, ultimate sensitive observations with the Square Kilometre Array (SKA) will enable us to understand the details of radio sources as well as its polarization.
This work was supported in part by JSPS KAKENHI Grant Numbers, 17H01110(TA), and 21H01135(TA). AIPS is produced and maintained by the National Radio Astronomy Observatory, a facility of the National Science Foundation operated under cooperative agreement by Associated Universities, Inc. Data analysis was carried out on the Multi-wavelength Data Analysis System operated by the Astronomy Data Center (ADC), National Astronomical Observatory of Japan. RJvW acknowledges support from the ERC Starting Grant ClusterWeb 804208.
A. Flux accuracy
We confirmed the amplitude of visibility with respect to the DDC and DIC results as described in section 3.1. Figure 5 shows the amplitude of visibility at each baseline length.
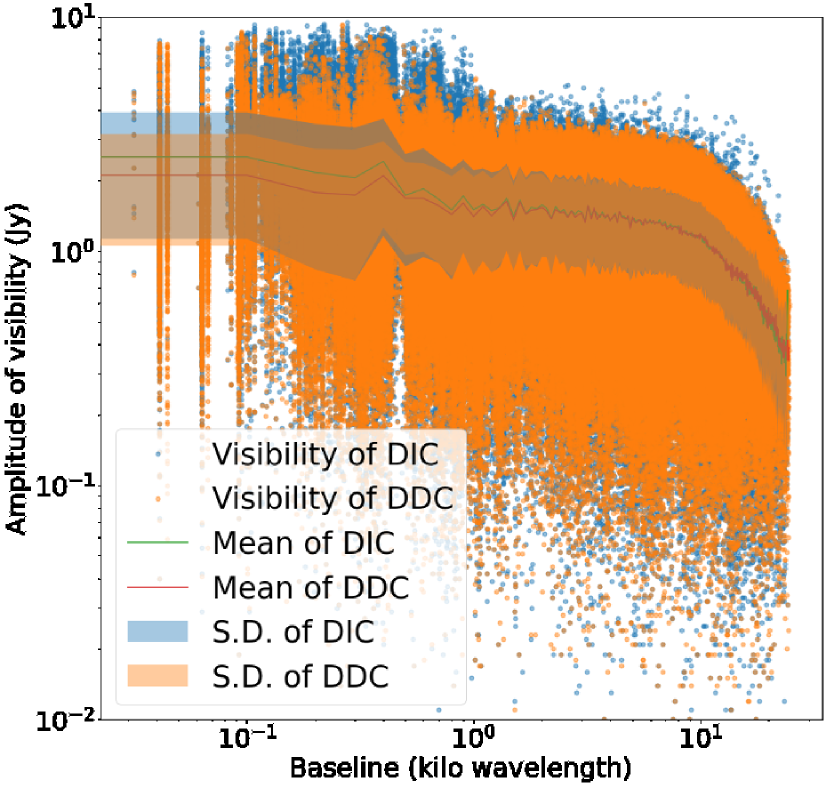
The DDC calibration employs data over 1k. The amplitudes of DDC and DIC are different in each region of the figure 5. At scales below the most diffuse component (Source U), DDC has an amplitude that is about 6 % lower than DIC.
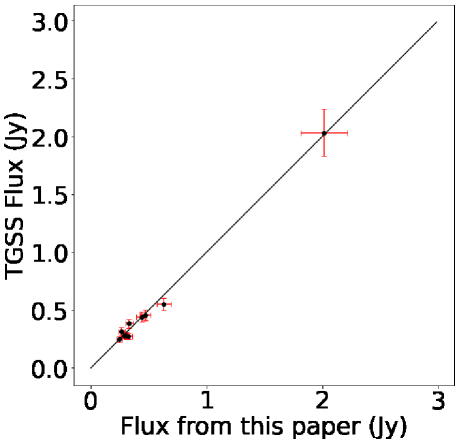
We further compared our results to the flux of the TIFR GMRT Sky Survey (TGSS;Intema et al. (2017)) to test the validity of the 10% error in absolute flux. First, we convolved TGSS and our results to the same resolution (65 asec). Second, we performed Gaussian fitting on each component with SN using pybdsf. Finally, we matched for each component by position using TOPCAT (Taylor, 2005). The separation used for the matching was the same value as the resolution, and since TGSS is a 150 MHz band, it was re-scaled using . The resulting flux relationship is shown in the figure 6. These results mean that the error in flux of this paper is usually well within 10%. The minimum flux in the figure 6 depends on the noise level of the TGSS.

B. Spectral index
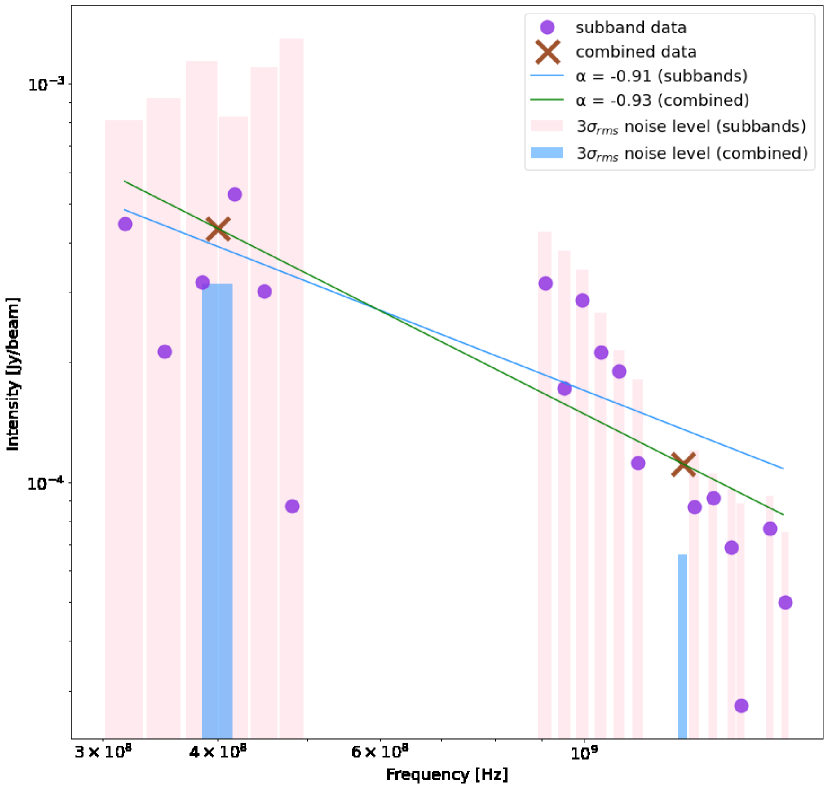
An example of a spectral fit is shown in figure 7. We examine in this section whether the spectral index of Source U is due to noise behavior.
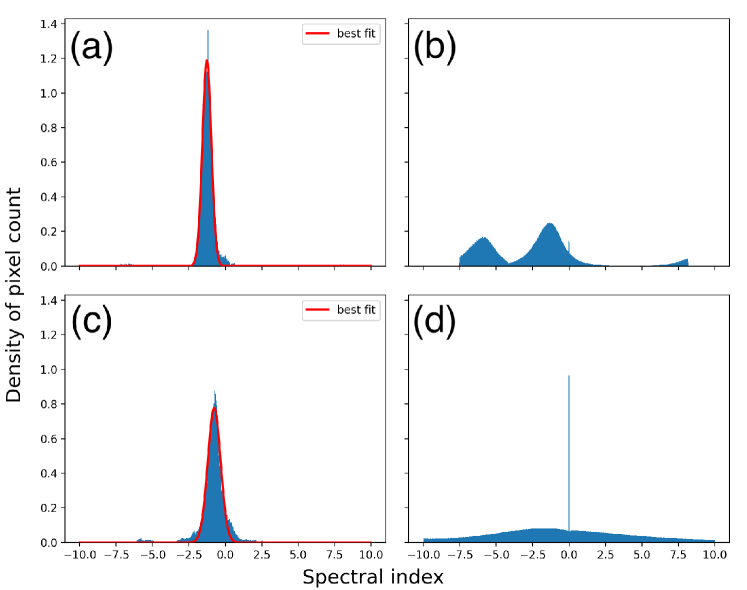
Figure 8(a) show the histogram of the spectral indices for the pixels within the Source U. We obtained the average spectral index of , the error means the standard deviation of the histogram. However, we need a careful assessment of the spectral index for marginal sources like Source U, because of the significant contribution of noise for the spectrum index fitting.
We have checked the spectral indices of all pixels in the image and found that they distributes with three peaks at 0, and as shown in figure 8(b). The 0-centered peak is thought to be derived from spectral fitting by bad pixels, which the initial value of 0 remains as it is because the fitting does not converge; indeed the 0-centered peak disappears in the histograms of the pixels brighter than mJy beam-1, i.e. the pixels possessing high signal-to-noise ratio (SN ), which has peak at (figure 8(c)). The other, - and -centered peaks are thought to be derived from spectral fitting between noise floors in the data of uGMRT and MeerKAT222The image rms noise of uGMRT is larger than that of MeerKAT. When given error values of uGMRT and MeerKAT with the same sign, they make an artificial negative spectral index up. In our data, this artificial index is . The -centered peak is consistent with the values estimated from the noise distribution such as shown in figure 7. The -centered peak occurs frequently when fitting negative and positive noise (see figure 9 (b)). Indeed, the index histogram calculated from only uGMRT data (figure 8(d)) does not show the - and -centered peaks which has no clear peak other than 0-centered.
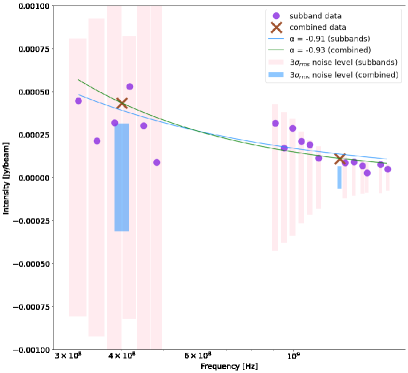
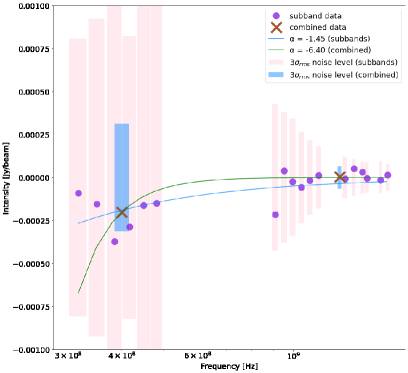
We also show the spectra in linear space in figure 9. The left panel (a) of the figure 9 shows the spectrum of the same pixel as in figure 7, and the right panel (b) of the figure 9 shows the spectrum of the noise pixel at the outer edge of the field of view. The figure 9 (a) tends to have predominantly positive data compared to noise pixel (figure 9 (b)), which suggests that Source U is different from the noise trend. Also, the green line in figure 9 (b) shows that the spectral index is very steep because of the fitting with negative 400 MHz data and positive 1280 MHz data.
The above results support that it is more favor to consider that Source U as a real radio source. The value, , is consistent with the spectral index of Source U inferred from the flux density.
References
- Akahori et al. (2018a) Akahori, T., Nakanishi, H., Sofue, Y., et al. 2018, PASJ, 70, R2. doi:10.1093/pasj/psx123
- Akahori et al. (2018b) Akahori, T., Kato, Y., Nakazawa, K., et al. 2018, PASJ, 70, 53. doi:10.1093/pasj/psy042
- Akahori et al. (2020) Akahori, T., Kitayama, T., Ueda, S., et al. 2020, PASJ, 72, 62. doi:10.1093/pasj/psaa039
- Akamatsu et al. (2017) Akamatsu, H., Mizuno, M., Ota, N., et al. 2017, A&A, 600, A100. doi:10.1051/0004-6361/201628400
- Beck & Krause (2005) Beck, R. & Krause, M. 2005, Astronomische Nachrichten, 326, 414. doi:10.1002/asna.200510366
- Blandford & Eichler (1987) Blandford, R. & Eichler, D. 1987, Phys. Rep., 154, 1. doi:10.1016/0370-1573(87)90134-7
- Bock, Large, & Sadler (1999) Bock, D., Large, M. I., & Sadler, E. M. 1999, AJ, 117, 1578
- Bonafede et al. (2010) Bonafede, A., Feretti, L., Murgia, M., et al. 2010, A&A, 513, A30. doi:10.1051/0004-6361/200913696
- Botteon et al. (2018) Botteon, A., Shimwell, T. W., Bonafede, A., et al. 2018, MNRAS, 478, 885. doi:10.1093/mnras/sty1102
- Botteon et al. (2020) Botteon, A., van Weeren, R. J., Brunetti, G., et al. 2020, MNRAS, 499, L11. doi:10.1093/mnrasl/slaa142
- Botteon et al. (2021) Botteon, A., Giacintucci, S., Gastaldello, F., et al. 2021, A&A, 649, A37. doi:10.1051/0004-6361/202040083
- Breuer et al. (2020) Breuer, J. P., Werner, N., Mernier, F., et al. 2020, MNRAS, 495, 5014. doi:10.1093/mnras/staa1492
- Brunetti & Vazza (2020) Brunetti, G. & Vazza, F. 2020, Phys. Rev. Lett., 124, 051101. doi:10.1103/PhysRevLett.124.051101
- Brunetti et al. (2001) Brunetti, G., Setti, G., Feretti, L., et al. 2001, MNRAS, 320, 365. doi:10.1046/j.1365-8711.2001.03978.x
- Brüggen et al. (2021) Brüggen, M., Reiprich, T. H., Bulbul, E., et al. 2021, A&A, 647, A3. doi:10.1051/0004-6361/202039533
- Chibueze et al. (2021) Chibueze, J. O., Sakemi, H., Ohmura, T., et al. 2021, Nature, 593, 47. doi:10.1038/s41586-021-03434-1
- Chibueze et al. (2022) Chibueze, J. O., Akamatsu, H., Parekh, V., et al. 2022, PASJ. doi:10.1093/pasj/psac009
- Cornwell (2008) Cornwell, T. J. 2008, IEEE Journal of Selected Topics in Signal Processing, 2, 793. doi:10.1109/JSTSP.2008.2006388
- Duchesne et al. (2021) Duchesne, S. W., Johnston-Hollitt, M., & Wilber, A. G. 2021, PASA, 38, e031. doi:10.1017/pasa.2021.24
- Ebeling et al. (1996) Ebeling, H., Voges, W., Bohringer, H., et al. 1996, MNRAS, 281, 799. doi:10.1093/mnras/281.3.799
- Ebeling et al. (1998) Ebeling, H., Edge, A. C., Bohringer, H., et al. 1998, MNRAS, 301, 881. doi:10.1046/j.1365-8711.1998.01949.x
- Fabian (1994) Fabian, A. C. 1994, ARA&A, 32, 277. doi:10.1146/annurev.aa.32.090194.001425
- Feretti et al. (2012) Feretti, L., Giovannini, G., Govoni, F., et al. 2012, A&A Rev., 20, 54. doi:10.1007/s00159-012-0054-z
- Fujita et al. (2003) Fujita, Y., Takizawa, M., & Sarazin, C. L. 2003, ApJ, 584, 190. doi:10.1086/345599
- Fujita et al. (2015) Fujita, Y., Takizawa, M., Yamazaki, R., et al. 2015, ApJ, 815, 116. doi:10.1088/0004-637X/815/2/116
- Fujita et al. (2016) Fujita, Y., Akamatsu, H., & Kimura, S. S. 2016, PASJ, 68, 34. doi:10.1093/pasj/psw022
- Gioia et al. (1990) Gioia, I. M., Maccacaro, T., Schild, R. E., et al. 1990, ApJS, 72, 567. doi:10.1086/191426
- Govoni et al. (2006) Govoni, F., Murgia, M., Feretti, L., et al. 2006, A&A, 460, 425. doi:10.1051/0004-6361:20065964
- Govoni et al. (2009) Govoni, F., Murgia, M., Markevitch, M., et al. 2009, A&A, 499, 371. doi:10.1051/0004-6361/200811180
- Govoni et al. (2019) Govoni, F., Orrù, E., Bonafede, A., et al. 2019, Science, 364, 981. doi:10.1126/science.aat7500
- Gu et al. (2019) Gu, L., Akamatsu, H., Shimwell, T. W., et al. 2019, Nature Astronomy, 3, 838. doi:10.1038/s41550-019-0798-8
- Guidetti et al. (2008) Guidetti, D., Murgia, M., Govoni, F., et al. 2008, A&A, 483, 699. doi:10.1051/0004-6361:20078576
- Guo et al. (2014) Guo, X., Sironi, L., & Narayan, R. 2014, ApJ, 794, 153. doi:10.1088/0004-637X/794/2/153
- Guo et al. (2014) Guo, X., Sironi, L., & Narayan, R. 2014, ApJ, 797, 47. doi:10.1088/0004-637X/797/1/47
- Ha et al. (2018) Ha, J.-H., Ryu, D., & Kang, H. 2018, ApJ, 857, 26. doi:10.3847/1538-4357/aab4a2
- Haines et al. (2018) Haines, C. P., Busarello, G., Merluzzi, P., et al. 2018, MNRAS, 481, 1055. doi:10.1093/mnras/sty2338
- Hoang et al. (2018) Hoang, D. N., Shimwell, T. W., van Weeren, R. J., et al. 2018, MNRAS, 478, 2218. doi:10.1093/mnras/sty1123
- Hurley-Walker et al. (2017) Hurley-Walker, N., et al. 2017, MNRAS, 464, 1146
- Intema et al. (2017) Intema, H. T., Jagannathan, P., Mooley, K. P., et al. 2017, A&A, 598, A78. doi:10.1051/0004-6361/201628536
- Intema (2014) Intema, H. T. 2014, Astronomical Society of India Conference Series, 13, 469
- Kale et al. (2022) Kale, R., Parekh, V., Rahaman, M., et al. 2022, MNRAS. doi:10.1093/mnras/stac1649
- Kang & Ryu (2011) Kang, H. & Ryu, D. 2011, ApJ, 734, 18. doi:10.1088/0004-637X/734/1/18
- Kang et al. (2012) Kang, H., Ryu, D., & Jones, T. W. 2012, ApJ, 756, 97. doi:10.1088/0004-637X/756/1/97
- Kang et al. (2017) Kang, H., Ryu, D., & Jones, T. W. 2017, ApJ, 840, 42. doi:10.3847/1538-4357/aa6d0d
- Kato et al. (2015) Kato, Y., Nakazawa, K., Gu, L., et al. 2015, PASJ, 67, 71. doi:10.1093/pasj/psv029
- Kato et al. (2016) Kato, Y., Nakazawa, K., Akahori, T., et al. 2016, AAS/High Energy Astrophysics Division #15
- Kierdorf et al. (2017) Kierdorf, M., Beck, R., Hoeft, M., et al. 2017, A&A, 600, A18. doi:10.1051/0004-6361/201629570
- Kitayama et al. (2020) Kitayama, T., Ueda, S., Akahori, T., et al. 2020, PASJ, 72, 33. doi:10.1093/pasj/psaa009
- Knowles et al. (2022) Knowles, K., Cotton, W. D., Rudnick, L., et al. 2022, A&A, 657, A56. doi:10.1051/0004-6361/202141488
- Kocevski et al. (2007) Kocevski, D. D., Ebeling, H., Mullis, C. R., et al. 2007, ApJ, 662, 224. doi:10.1086/513303
- Kocevski et al. (2007) Kocevski, D. D., Ebeling, H., Mullis, C. R., et al. 2007, ApJ, 662, 224. doi:10.1086/513303
- Lee et al. (2020) Lee, W., Jee, M. J., Kang, H., et al. 2020, ApJ, 894, 60. doi:10.3847/1538-4357/ab855f
- Mandal et al. (2019) Mandal, S., Intema, H. T., Shimwell, T. W., et al. 2019, A&A, 622, A22. doi:10.1051/0004-6361/201833992
- Markevitch & Vikhlinin (2007) Markevitch, M., & Vikhlinin, A. 2007, Physical Review, 443, 1. doi:10.1016/j.physrep.2007.01.001
- Markevitch et al. (2005) Markevitch, M., Govoni, F., Brunetti, G., et al. 2005, ApJ, 627, 733. doi:10.1086/430695
- Matsukiyo et al. (2011) Matsukiyo, S., Ohira, Y., Yamazaki, R., et al. 2011, ApJ, 742, 47. doi:10.1088/0004-637X/742/1/47
- Mohan & Rafferty (2015) Mohan, N. & Rafferty, D. 2015, Astrophysics Source Code Library. ascl:1502.007
- Offringa et al. (2014) Offringa, A. R., McKinley, B., Hurley-Walker, N., et al. 2014, MNRAS, 444, 606. doi:10.1093/mnras/stu1368
- Omiya et al. (2022) Omiya, Y., Nakazawa, K., Matsushita, K., et al. 2022, arXiv:2210.02145
- Paterno-Mahler et al. (2014) Paterno-Mahler, R., Randall, S. W., Bulbul, E., et al. 2014, ApJ, 791, 104. doi:10.1088/0004-637X/791/2/104
- Patil et al. (2016) Patil, A. H., Yatawatta, S., Zaroubi, S., et al. 2016, MNRAS, 463, 4317. doi:10.1093/mnras/stw2277
- Pinzke et al. (2013) Pinzke, A., Oh, S. P., & Pfrommer, C. 2013, MNRAS, 435, 1061. doi:10.1093/mnras/stt1308
- Planck Collaboration et al. (2013) Planck Collaboration, Ade, P. A. R., Aghanim, N., et al. 2013, A&A, 550, A134. doi:10.1051/0004-6361/201220194
- Rich et al. (2008) Rich, J. W., de Blok, W. J. G., Cornwell, T. J., et al. 2008, AJ, 136, 2897. doi:10.1088/0004-6256/136/6/2897
- Sabater et al. (2019) Sabater, J., Best, P. N., Hardcastle, M. J., et al. 2019, A&A, 622, A17. doi:10.1051/0004-6361/201833883
- Stroe et al. (2017) Stroe, A., Sobral, D., Paulino-Afonso, A., et al. 2017, MNRAS, 465, 2916. doi:10.1093/mnras/stw2939
- Taylor (2005) Taylor, M. B. 2005, Astronomical Data Analysis Software and Systems XIV, 347, 29
- Vikhlinin et al. (2009) Vikhlinin, A., Burenin, R. A., Ebeling, H., et al. 2009, ApJ, 692, 1033. doi:10.1088/0004-637X/692/2/1033
- Vink & Yamazaki (2014) Vink, J. & Yamazaki, R. 2014, ApJ, 780, 125. doi:10.1088/0004-637X/780/2/125
- Wright (2006) Wright, E. L. 2006, PASP, 118, 1711. doi:10.1086/510102
- van Weeren et al. (2016) van Weeren, R. J., Brunetti, G., Brüggen, M., et al. 2016, ApJ, 818, 204. doi:10.3847/0004-637X/818/2/204
- van Weeren et al. (2017) van Weeren, R. J., Andrade-Santos, F., Dawson, W. A., et al. 2017, Nature Astronomy, 1, 0005. doi:10.1038/s41550-016-0005
- van Weeren et al. (2019) van Weeren, R. J., de Gasperin, F., Akamatsu, H., et al. 2019, Space Sci. Rev., 215, 16. doi:10.1007/s11214-019-0584-z