FLASH Pilot Survey: Detections of associated 21 cm H i absorption in GAMA galaxies at 0.42 1.00
Abstract
We present the results of a search for associated 21 cm H i absorption at redshift in radio-loud galaxies from three Galaxy And Mass Assembly (GAMA) survey fields. These observations were carried out as part of a pilot survey for the ASKAP First Large Absorption Survey in H i (FLASH). From a sample of 326 radio sources with 855.5 MHz peak flux density above 10 mJy we detected two associated H i absorption systems, in SDSS J090331+010847 at and SDSS J113622+004852 at . Both galaxies are massive (stellar mass M⊙) and have optical spectra characteristic of luminous red galaxies, though SED fitting implies that SDSS J113622+004852 contains a dust-obscured starburst with SFR M⊙ yr-1. The H i absorption lines have a high optical depth, with of for SDSS J090331+010847 (the highest value for any associated system found to date) and for SDSS J113622+004852. In the redshift range probed by our ASKAP observations, the detection rate for associated H i absorption lines (with and at least 3 significance) is percent. Although the current sample is small, this rate is consistent with a trend seen in other studies for a lower detection rate of associated 21 cm H i absorption systems at higher redshift. We also searched for OH absorption lines at , but no detection was made in the 145 radio sources searched.
keywords:
galaxies: active – galaxies: ISM – radio lines: ISM – galaxies: nuclei – methods: observational1 Introduction
Hydrogen is the most common element in the Universe and neutral hydrogen provides the main fuel for star formation in galaxies, which is known to evolve across cosmic time (e.g. Hopkins & Beacom 2006; Driver et al. 2018). In the central parts of galaxies, infalling gas can fuel Active Galactic Nuclei (AGN) (e.g. Dressel et al. 1983; Taylor et al. 1999; Araya et al. 2010; Maccagni et al. 2014) and transfer the energy released by AGN to the surrounding interstellar medium (ISM) in host galaxies, a process known as feedback (e.g. Morganti et al. 2003, 2005, 2013; Kanekar & Chengalur 2008; Rodriguez et al. 2009; Teng et al. 2013) which can strongly influence the subsequent evolution of the galaxy. The distribution, mass and kinematics of neutral hydrogen in galaxies can therefore advance our understanding of their assembly and evolution.
In its neutral atomic state, hydrogen can be traced in the radio band (either in emission or in absorption) through a hyperfine transition at a rest-frame frequency of 1420.4 MHz. 21 cm line emission can provide information, e.g. H i mass, morphology, and dynamics, for galaxies, but its faintness, e.g. compared to CO emission, makes the relevant studies difficult beyond the local Universe () (e.g. Lang et al., 2003; Chung et al., 2009; Lee-Waddell et al., 2012; van Driel et al., 2016; Winkel et al., 2016; Yoon et al., 2017; Catinella et al., 2018; Koribalski et al., 2020).
In contrast to H i emission, the detection sensitivity for H i absorption is independent of redshift and depends only on the brightness of the background radio source used as a probe (Morganti & Oosterloo, 2018). The disadvantage, however, is that only the neutral hydrogen along our sight to the radio continuum source can be traced. H i absorption searches can detect both intervening lines (which trace neutral gas in and around the general population of distant galaxies) and associated lines (which allow us to trace the kinematics of neutral gas within radio-loud AGN).
Associated H i absorption searches have already been carried out for diverse samples of objects, including compact radio sources (i.e. compact steep-spectrum (CSS) sources and gigahertz-peaked spectrum (GPS) sources), extended sources (Fanaroff-Riley class I (FR I) and class II (FR II) radio galaxies), Seyferts and dust obscured quasars (Baan & Haschick 1981; Mirabel & Sanders 1989; van Gorkom et al. 1989; Vermeulen et al. 2003; Curran et al. 2013a; Gupta et al. 2006; Struve & Conway 2010; Allison et al. 2012b, 2014, 2016; Maccagni et al. 2017; Allison et al. 2020; Koribalski 2012; Geréb et al. 2015; Aditya & Kanekar 2018b; Glowacki et al. 2017, 2019; Dutta et al. 2019; Murthy et al. 2021, 2022). A useful review of the results is given by Morganti & Oosterloo (2018).
Most of the associated H i absorption detections made so far are at redshift , and some detailed results have been achieved from very long baseline interferometry (VLBI) observations, such as the finding of circumnuclear disks (e.g. Taylor 1996; van Langevelde et al. 2000; Struve & Conway 2010), the identification of AGN accretion (e.g. Maccagni et al. 2014; Taylor et al. 1999; Araya et al. 2010), and characterising the jet-gas interactions (e.g. Morganti et al. 2003; Kanekar & Chengalur 2008; Rodriguez et al. 2009; Mahony et al. 2013; Schulz et al. 2021). The gas structures that can absorb background radio continuum are diverse, and in addition to circumnuclear disks, outflowing and infalling gas, the associated H i absorption may also arise from the galactic disk (e.g. Morganti et al. 2002) or from high speed clouds that move across our sight to radio continuum background (e.g. Conway 1999). These H i absorption detections have advanced our understanding of star formation, AGN structures and co-evolution between SMBH and host galaxy.
Associated H i absorption studies at higher redshift () have so far yielded only a few detections despite significant effort (e.g. Curran et al. 2008, 2013b; Curran et al. 2016; Aditya & Kanekar 2018b; Grasha et al. 2019 and references therein). To date, only 12 associated H i absorption systems have been detected at Uson et al. 1991; Moore et al. 1999; Ishwara-Chandra et al. 2003; Curran et al. 2013b; Aditya et al. 2017; Aditya & Kanekar 2018a; Chowdhury et al. 2020; Dutta et al. 2020; Aditya et al. 2021; Gupta et al. 2021), and the detection rate here is much lower than in the local Universe. Curran et al. (2008) pointed out that the sources selected at high redshift generally have high ultraviolet (UV) luminosity ( > W Hz-1) which can, in principle, ionise all the hydrogen gas in host galaxies and hence results in the low detection rate for associated absorption at high redshift (e.g. Curran et al. 2008; Curran & Whiting 2012). Some intervening H i absorption systems have also been detected at (e.g. Moore et al. 1999; Srianand et al. 2008; Kanekar et al. 2009; Gupta et al. 2012), but most studies of neutral hydrogen in the distant universe have used Ly absorption from optical observations (e.g. Noterdaeme et al. 2012; Lee et al. 2013; Crighton et al. 2015).
The First Large Absorption Survey in HI (FLASH; Allison et al., 2022) is a wide-field survey for H i absorption that will cover the entire southern sky in the redshift range , enabled by the Australian SKA Pathfinder (ASKAP) advantages of wide field of view and 288 MHz instantaneous bandwidth. Before the full operation of the 36-antenna ASKAP, early FLASH results using a sub-array of ASKAP dishes have demonstrated the capability of this telescope for H i absorption studies (Allison et al. 2015, 2017; Moss et al. 2017; Allison et al. 2020; Sadler et al. 2020; Mahony et al. 2021). In this paper, we present the results of a search for associated H i absorption at in the three equatorial GAMA fields (GAMA 09, GAMA 12, and GAMA 15), using data from the pilot FLASH survey. Throughout the paper, we adopt a CDM cosmology with , =0.3, and =0.7.
2 The GAMA survey fields
2.1 The GAMA survey
The three equatorial fields (G09, G12 and G15) from the GAMA Galaxy Survey (Driver et al., 2011; Liske et al., 2015) were chosen for the FLASH pilot study because they overlap with the Sloan Digital Sky Survey (SDSS111https://www.sdss.org) but also provide deeper spectroscopic redshift coverage and additional multi-wavelength data.
| Field | RA[deg] | Dec[deg] | RA[hms] | Dec[dms] | Area |
|---|---|---|---|---|---|
| (J2000) | (J2000) | deg2 | |||
| Optical GAMA spectroscopic fields | |||||
| G09 | 129.0 to 141.0 | to | 08 36 00.0 to 09 24 00.0 | 00 00 to 00 00 | 60 |
| G12 | 174.0 to 186.0 | to | 11 36 00.0 to 12 24 00.0 | 00 00 to 00 00 | 60 |
| G15 | 211.5 to 223.5 | to | 14 06 00.0 to 14 54 00.0 | 00 00 to 00 00 | 60 |
| ASKAP FLASH pilot fields | |||||
| G09A | 128.7 to 135.1 | to | 08 34 47.6 to 09 00 23.6 | 42 00 to 42 00 | 40 |
| G09B | 134.9 to 141.3 | to | 08 59 54.1 to 09 25 13.2 | 42 00 to 42 00 | 40 |
| G12A | 173.7 to 180.1 | to | 11 34 47.1 to 12 00 23.2 | 42 00 to 42 00 | 40 |
| G12B | 179.9 to 186.3 | to | 11 59 36.8 to 12 25 12.8 | 42 00 to 42 00 | 40 |
| G15A | 210.9 to 217.3 | to | 14 03 45.1 to 14 29 21.1 | 42 00 to 42 00 | 40 |
| G15B | 217.1 to 223.5 | to | 14 28 24.0 to 14 54 00.0 | 42 00 to 42 00 | 40 |
The GAMA spectroscopic survey was carried out in two phases (GAMA I, II) over the period 2008–2014, with targeted objects selected from various catalogues including SDSS DR 6, 7, 8 and the UKIRT Infrared Deep Sky Survey (UKIDSS) (Liske et al., 2015). The first phase (GAMA I) surveyed objects in the G09, G12 and G15 fields down to magnitude limits of mag in G09 and G15, and mag in G12. The second phase (GAMA II) increased the original areas of G09, G12 and G15 to cover a total area of 180 deg2 as listed in Table 1, and included all galaxies down to a magnitude limits of . Two southern fields, G02 and G23, were added in GAMA II.
The GAMA spectra cover a wavelength range of Å with a resolution of 4.6 Å. Redshifts were measured by the GAMA team using the codes (Driver et al., 2011) and (Baldry et al., 2014), and a value was assigned to quantify the reliability of each redshift. For our purposes, a value of means that the redshift is reliable and can be used in scientific analyses, while means that the redshift may be unreliable.
2.2 Radio continuum studies in the GAMA fields
There have been at least two previous studies of radio continuum sources in the GAMA equatorial fields. Prescott et al. (2016) carried out a deep radio survey at 325 MHz with the Giant Metrewave Radio Telescope (GMRT), covering 138 deg2 of sky in the G09, G12 and G15 GAMA fields. They matched their radio data with optical imaging and redshifts from the GAMA survey, and compiled a catalogue of 499 GAMA/GMRT matches out to redshift in the GAMA fields.
Secondly, Ching et al. (2017) published the Large Area Radio Galaxy Evolution Spectroscopic Survey (LARGESS), which covered deg2 of the sky and provided a spectroscopic and photometric catalogue of radio-source hosts. The catalogue was based on cross-matching SDSS and FIRST data and included both galaxies and QSOs out to redshift and in some cases beyond. The full LARGESS catalogue contains spectroscopic data for 12,329 radio sources and includes SDSS IDs, coordinates, optical magnitudes, 1.4 GHz radio flux density, redshift, and spectral-line measurements. All three GAMA equatorial fields (G09, G12, and G15) were included, and Ching et al. (2017) obtained additional optical spectra for radio-source hosts that were either stellar in optical images (candidate QSOs) or galaxies fainter than the GAMA magnitude limit. The LARGESS catalogue includes 3668 matched radio sources within the GAMA fields listed in Table 1, and a spectroscopic completeness of 86–91 per cent was achieved for GAMA objects down to SDSS mag = 20.5 in these three fields. Ching et al. (2017) also assigned a value to each source, using the same convention as the GAMA team, to indicate the reliability of its redshift measurement.
We took the Ching et al. (2017) catalogue as a starting point for our study, but also used radio continuum data from our own FLASH observations to carry out additional radio-optical cross-matching as described in the next section.
3 ASKAP observations
3.1 The ASKAP telescope
The ASKAP telescope (DeBoer et al., 2009; Hotan et al., 2021) is located at the radio-quiet Murchison Radio-astronomy Observatory (MRO) in Western Australia. It consists of an array of 36 antennas, each 12 m in diameter, with a maximum baseline of 6 km and a total collecting area of m2. ASKAP has an instantaneous bandwidth of 288 MHz, which can be split into channels of 18.5 KHz for spectral-line observations. A prominent advantage of ASKAP is the installation of phased array feed (PAF) receivers that create up to 36 simultaneous beams and provide a field of view (FOV) of deg2 (e.g. Chippendale et al. 2015; McConnell et al. 2016; Hotan et al. 2021). This combination of large bandwidth and wide FOV makes ASKAP an efficient survey instrument (Johnston et al. 2007, 2008).
3.2 Pilot survey observations
In 2019–20, the FLASH team carried out a 100-hour pilot survey with the full 36 antenna ASKAP array. This time was split into 32 2 hr pointings covering 980 deg2 (6 pointings in the GAMA fields and the remainder other parts of the sky), along with a further 6 6 hr deep pointings covering the GAMA fields. We here define the fields covered by the 6 pointings as 6 GAMA sub-fields. The aim of the deeper 6 hr repeat observations was to test whether significant numbers of absorption lines towards faint radio continuum would be missed in the 2 hr observations planned for the full FLASH survey (Allison et al., 2022).
We observed the 6 GAMA sub-fields with the full 36 antenna ASKAP array in early 2020, and Table 2 lists the observing parameters used. Each 60 deg2 GAMA field was covered by two separate ASKAP pointings (A and B) as shown in Table 1, and Table 3 provides a log of observations.
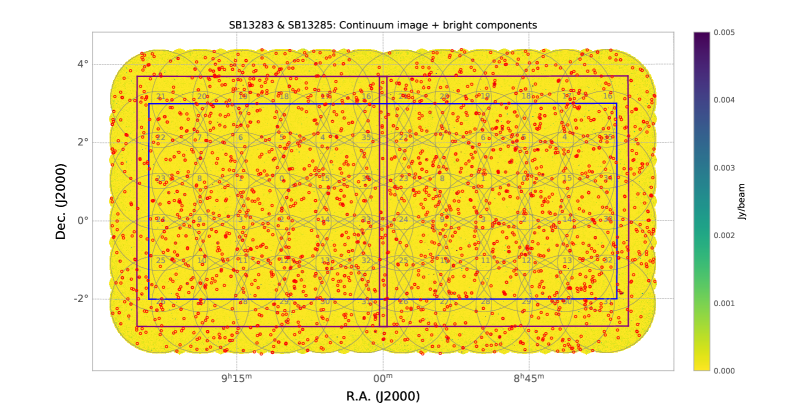
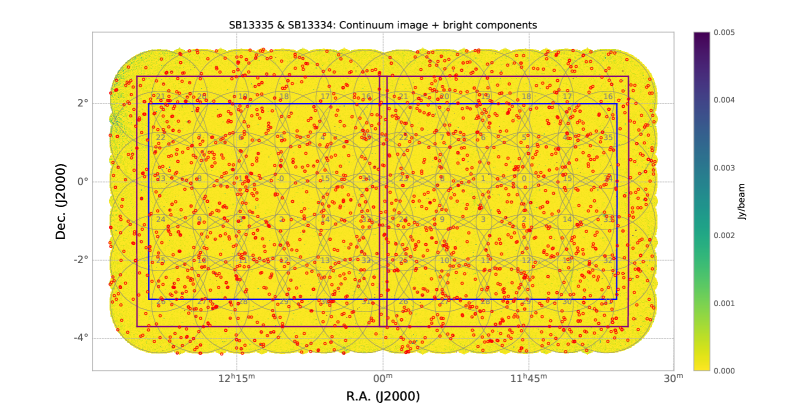
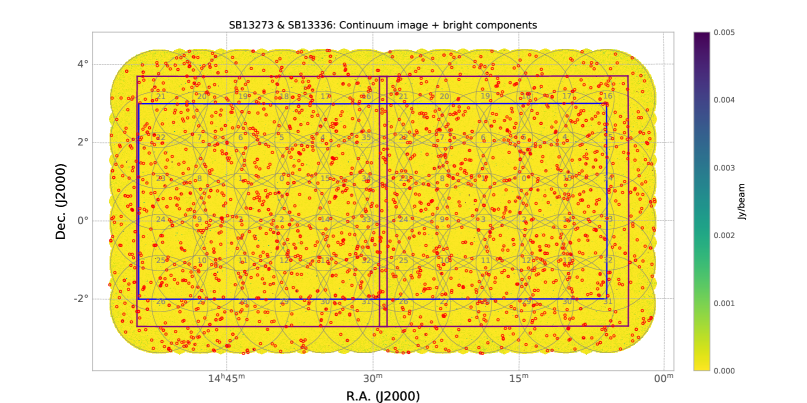
We show the footprints of the observations towards these six GAMA sub-fields in Fig. 1, where individual radio continuum sources with peak flux density larger than 10 mJy are also marked. The total area of the FLASH GAMA sub-fields is slightly larger than that of the optical GAMA 09, 12 and 15 fields and (as Fig. 1 shows) our ASKAP observations fully cover these fields.
| Central frequency | 855.5 MHz |
|---|---|
| Instantaneous bandwidth | 288 MHz |
| Frequency range | 711.5 – 999.5 MHz |
| Redshift range for H i | |
| Redshift range for OH | |
| Spectral channels | 15552 |
| Channel width | 18.5 kHz |
| Velocity per spectral channel | 5.5 – 7.8 km s-1 |
| rms noise per spectral channel | 3.2 – 5.1 mJy beam-1 |
Two of the six-hour observations (G_12B and G_15B) failed at the processing stage because of corrupted data, and these data were not released in CASDA. The six-hour data for G_09B were processed and released in CASDA, but were not used for an H i absorption search because of technical issues at the post-processing stage (see §3.3 of the text).
| Name | SBID | Pointing Centre | Obs. date | BF | Cont. resolution | Line resolution | ||||
| RA [J2000] | Dec. [J2000] | [UTC] | [h] | [MHz] | [arcsec arcsec] | [mJy beam-1] | ||||
| [1] | [2] | [3] | [4] | [5] | [6] | [7] | [8] | [9] | [10] | |
| Two-hour observations | ||||||||||
| G_09A | 13285 | 08:47:35.586 | +00:30:00.00 | 2020 April 18 | 2 | 9 | 4.96 | |||
| G_09B | 13283 | 09:12:25.241 | +00:30:00.00 | 2020 April 18 | 2 | 9 | 4.63 | |||
| G_12A | 13334 | 11:47:35.172 | -00:30:00.00 | 2020 April 21 | 2 | 9 | 4.75 | |||
| G_12B | 13335 | 12:12:24.827 | -00:30:00.00 | 2020 April 21 | 2 | 9 | 4.78 | |||
| G_15A | 13336 | 14:16:33.103 | +00:30:00.00 | 2020 April 21 | 2 | 9 | 4.81 | |||
| G_15B | 13273 | 14:41:22.758 | +00:30:00.00 | 2020 April 17 | 2 | 9 | 4.83 | |||
| Six-hour observations | ||||||||||
| G_09A_long | 13293 | 08:47:35.586 | +00:30:00.00 | 2020 April 19 | 6 | 9 | 2.75 | |||
| G_09B_long | 11068 | 09:12:25.241 | +00:30:00.00 | 2020 January 07 | 6 | 5 | 2.98 | |||
| G_12A_long | 13306 | 11:47:35.172 | -00:30:00.00 | 2020 April 20 | 6 | 9 | 2.78 | |||
| G_12B_long | 13366 | 12:12:24.827 | -00:30:00.00 | 2020 April 22 | 6 | 9 | … | … | … | |
| G_15A_long | 13294 | 14:16:33.103 | +00:30:00.00 | 2020 April 19 | 6 | 9 | 2.83 | |||
| G_15B_long | 13286 | 14:41:22.758 | +00:30:00.00 | 2020 April 18 | 6 | 9 | .. | … | … | |
Our observations used standard ASKAP techniques for observing and calibration, as described by Hotan et al. (2021) and McConnell et al. (2020). The primary calibration of the array was based on observations of the bright radio source PKS B1934-638, which was also used to set the flux density scale (Reynolds, 1994). The spatial resolution set by the longest (6 km) ASKAP baseline is around 12 arcsec at our central frequency of 855.5 MHz, but the longest baselines could not be used in making the spectral-line cubes because of processing constraints. Table 3 lists the final resolution for each observation.
3.3 Data processing
We used the standard ASKAP data reduction pipeline (Whiting, 2020; Hotan et al., 2021) for the initial processing of our GAMA data. The pipeline reduction includes calibration, continuum and spectral-line imaging, continuum subtraction, production of ‘component’ and ‘island’ continuum source catalogues, and measurement of a range of quality-control parameters. ‘Islands’ are associations of one or more Gaussian components belonging to the same source. as described by Whiting & Humphreys (2012). Fig. 3 shows some examples of single-component and multi-component sources. For multi-component sources, the island position listed by the pipeline (corresponding to the radio centroid for each island) is used to search for the optical host galaxy. A full description of data processing for the FLASH Pilot Survey will be given in a forthcoming data release paper by Yoon et al. (in preparation).
It was discovered during the initial processing that the beam-forming intervals used for FLASH observations (5 or 9 MHz, see Table 3) were not implemented as expected and the data showed jumps in phase and amplitude at 1 MHz intervals. These jumps were corrected in a further stage of data processing by smoothing the bandpass solutions on 1 MHz intervals and removing any residual artefacts by using 1 MHz intervals (rather the planned 5 or 9 MHz intervals) for the image-based continuum subtraction. At this point, the reduced pipeline data products were released through the CSIRO ASKAP Science Data Archive (CASDA).
3.4 Post-processing of the CASDA data
The FLASH spectral-line data released in CASDA were processed using 1 MHz intervals when smoothing the bandpass solutions and for image-based continuum subtraction. As a result, broad absorption lines with velocity widths above 300 km s-1 will be subtracted out by the pipeline processing and not detectable in the spectra provided in CASDA. High S/N lines of any width in the processed spectra may also be distorted by the continuum subtraction procedure of the pipeline.
To overcome this problem, some further post-processing of the FLASH Pilot Survey data was carried out by the FLASH team as described by Yoon et al. (in preparation). We first extracted spectra towards radio sources from initial cube with visibility-based continuum subtraction. Then we fitted the spectra with a polynomial to further remove the continuum over a wider (5 or 9 MHz) frequency band. These post-processed spectra were used for the current study and will be made available through CASDA in future as part of a wider ‘value-added’ FLASH pilot data release.
Ongoing technical efforts by the ASKAP team have made significant improvements in observing with larger beam-forming intervals, so it is unlikely that post-processing of this kind will be need for future FLASH observations carried out from mid-2021 onwards.
4 The GAMA radio-source sample
4.1 Sample selection
We now select a well-defined sample of radio galaxies in the GAMA fields that are both sufficiently bright (flux density mJy) and in the right redshift range ( for associated HI absorption to be detectable in our FLASH pilot observations. Our selection criteria are broadly similar to those used in the lower-redshift H i absorption search by Maccagni et al. (2017).
The sample was selected as follows:
- 1.
-
2.
We then cross-matched the CASDA island catalogue for each field with the SDSS photometric catalogue (Alam et al., 2015) to identify sources with optical counterparts. For most islands, there are at most a single SDSS counterpart within a 5.0 arcsec radius. For the islands with two or more possible SDSS counterparts, we carefully inspected their corresponding FIRST radio morphology to confirm any association. We then looked for redshift measurements from SDSS, GAMA and NASA/IPAC Extragalactic Database (NED222http://ned.ipac.caltech.edu/) and selected sources with redshifts in the range .
-
3.
We then used the Ching et al. (2017) catalogue to search for any additional sources that have a separation between islands and optical counterparts greater than 5.0 arcsec or additional redshift measurements that were missed in our second step.
-
4.
We excluded sources where the only available redshift measurements were flagged as unreliable (i.e. Q value in either Ching et al. (2017) or the GAMA survey).
-
5.
Finally, we visually inspected all these sources in FIRST images and classified them as either ‘compact’ or ‘extended’ (including multi-component sources). The ‘extended’ sources were considered as suitable for associated H i absorption searching if there was a radio component at the position of the optical galaxy, otherwise they were excluded. Fig. 3 shows some representative examples of ‘compact’ and ‘extended’ sources from our final sample.
This process yielded a final sample of 326 radio sources with optical counterparts in the redshift range and continuum peak flux densities, , in FLASH observations above 10 mJy beam-1. These objects are listed in Table 4 and 5. Table 8 in Appendix A lists the 73 extended sources that were excluded from our H i absorption search based on their radio properties. For optical objects with multiple radio components, we used the ASKAP spectrum from the component that is closest to optical coordinates to search for H i absorption. For the fields where data from both 2 hour and 6 hour observations are available, we used the spectrum from the deeper 6 hour observation in our initial search.
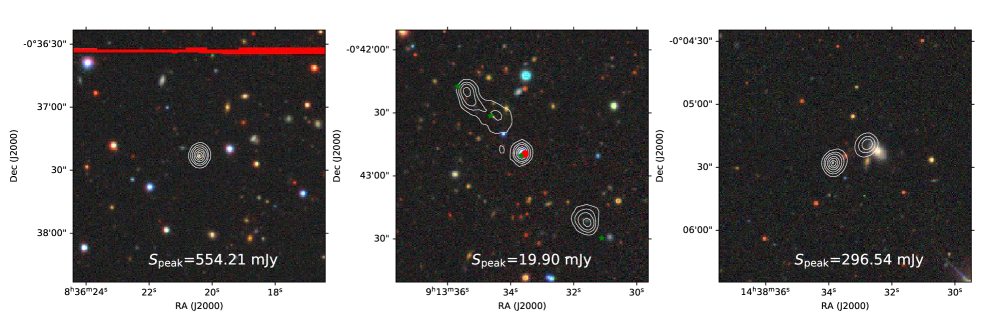
Right: a two-component ‘extended’ source that was not included in our H i absorption search because of the lack of a central core. In each case, the backgrounds are optical images from DESI Legacy Imaging Surveys (Dey et al., 2019). All the radio contours plotted are from the 1.4 GHz FIRST survey, with levels set at at 3, 10, 20, 40, 60, 80, and 95 percent of the FIRST peak flux density.
4.2 Sample properties
We now discuss some of the multi-wavelength properties of the sample of 326 radio sources that we will search for H i absorption in. Given the sensitivity of our 2 hr and 6 hr observations (around 4.6 mJy beam-1 and 2.8 mJy beam-1 per spectral channel respectively), we can divide the sample as follows:
-
•
The bright sub-sample: This is a sub-sample of 84 sources with peak flux densities above 45 mJy beam-1 at 855.5 MHz. For a 45 mJy source, a strong H i absorption line with a peak optical depth and velocity width km s-1 should be detectable at the level in a 2 hr ASKAP observation333A peak optical depth of roughly corresponds to the highest value seen for associated lines in the large Maccagni et al. (2017) sample, while a velocity width of km s-1 is the value assumed by Allison et al. (2022) for associated absorption lines. and so 40-50 mJy is considered to be the effective detection limit for a 2 hr FLASH survey (Allison et al., 2022). For sources brighter than 45 mJy, lines with correspondingly lower optical depth would be detectable at the same confidence level.
-
•
The faint sub-sample: This comprises the remaining 242 sources with peak flux densities between 10 and 45 mJy beam-1 at 855.5 MHz. These weaker sources were included mainly to search for H i absorption in the deeper 6 hr GAMA fields. For a 10 mJy source, an H i absorption line with velocity width km s-1 would need to have an optical depth of to be detectable at level in a 6 hr GAMA observation.
4.2.1 General properties
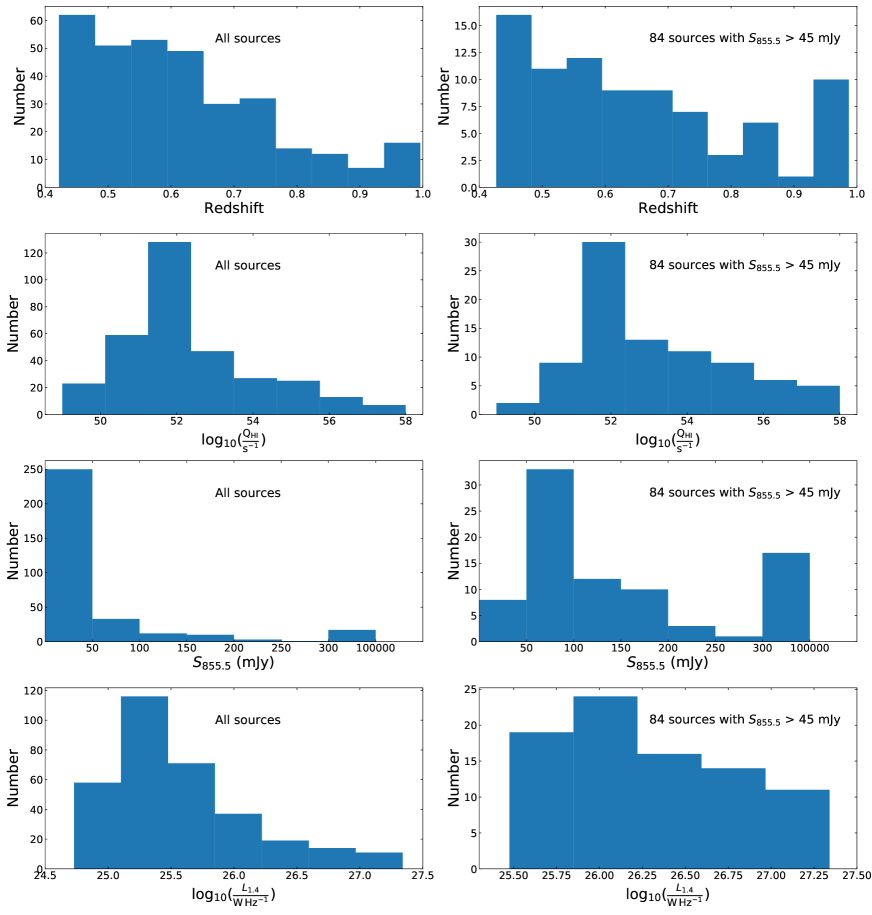
Table 5 lists some basic information for our targets. The weakest source used in our H i absorption search has a peak flux density of 10 mJy and the brightest source is 3.9 Jy. Fig. 5 shows some general properties of the sample. While the mid-point of our ASKAP observing band corresponds to for H i , the median redshift of the sample in Table 4 is 0.59. The under-representation of objects with in our sample arises mainly from the optical redshift limits of the SDSS and GAMA redshift surveys.
The rest-frame radio power at 1.4 GHz, , is calculated from the ASKAP integrated flux density and spans a range from W Hz-1 to W Hz-1. From visual inspection of the FIRST radio morphology of the 326 sources, 248 sources are compact ( 30 kpc in size at ) and 78 sources are extended (with a typical size of 180 kpc at ).
4.2.2 Optical spectroscopic properties
Based on the spectroscopic classifications in Ching et al. (2017), we find that our targets include 153 low-excitation radio galaxies (LERGs, see Heckman & Best (2014)), 32 high-excitation radio galaxies (HERGs) and 36 broad emission-line objects/QSOs (class AeB). There is one BL Lac object (SDSS J142526.18-011825.74) and three objects where the spectrum is classified as ‘unusual’. The remaining objects lack a spectroscopic classification in the Ching et al. (2017) paper. Of the objects with existing spectroscopic classifications, the majority (69%) are LERGs.
4.2.3 Mid-IR properties from WISE
We compiled the mid-infrared properties of our targets from the Wide-field Infrared Survey Explorer (WISE; Wright et al. 2010) catalogue. WISE is an all-sky survey operated at mid-infrared bands of 3.4, 4.6, 12, and 22 m.
This was done by cross-matching the SDSS coordinates of our targets with the ALLWISE catalogue (Cutri et al., 2013) using a 5-arcsec matching radius. Of the 326 sources in Table 5, 318 sources have a WISE counterpart in the W1 (3.4m) band. This high matching rate is what we would expect for radio-loud AGN in our target redshift range, since these objects are usually massive galaxies with an old stellar population that emits strongly at wavelengths near 2-3m (e.g. van Breugel et al., 1998). Of these 318 sources, all were detected in both the W1 (3.4m) and W2 (4.6m) bands and 115 were also detected in the W3 (12m) band.
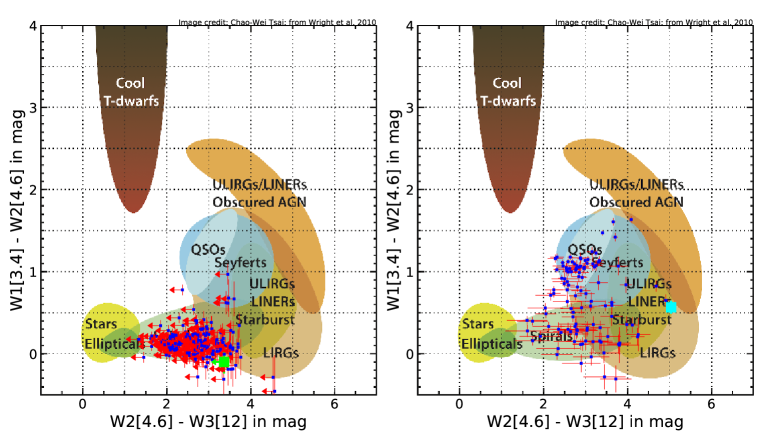
The WISE colour-colour diagram (Wright et al., 2010) is often used to separate various classes of objects, see Fig. 4. We were able to measure both W1-W2 and W2-W3 colours for 115 of the objects in Table 5, and upper limits on W2-W3 for a further 203 objects. The 203 objects with upper limits on W2-W3 could plausibly lie in either the ‘spiral galaxy’ or the ‘elliptical galaxy’ region in Fig. 4. What is interesting is that almost all of them have W1-W2 mag which means the mid-IR light comes mainly from stars (Stern et al., 2012). The 115 objects detected in the W3 band are more widely distributed with a relatively higher number density at QSO/Seyfert region.
Of the 318 objects, 53 (17%) have W1-W2 > 0.8, including 5 HERGs, placing them in the AGN region of the WISE diagram. 52 of these 53 objects have been detected in W3. This high fraction is not surprising, as W1-W2 has been proved to be a effective criterion in selecting AGN candidates (Stern et al., 2012). Sources with W1-W2 > 0.8 have a high probability of hosting an AGN with a high accretion rate, and the reddening of optical light from central AGN makes them more easily detected in WISE W3 band.
4.2.4 UV properties from GALEX
We investigated the UV properties of our targets by cross-matching their SDSS coordinates with Galaxy Evolution Explorer (GALEX) catalogue (Bianchi et al., 2017) using a 3 arcsec matching radius. We then made a power-law fit to the photometric data of SDSS bands and GALEX bands, if available, after applying Galactic extinction (Schlegel et al., 1998) and shifting to the rest frame. Finally we calculated the ionising photon rate by following the method described in Curran et al. (2017), which is listed in Table 5.
Most of our targets have an ionising photon rate below s-1, the critical value above which it is argued that all the neutral hydrogen in host galaxies could be ionised (Curran et al. 2008; Curran & Whiting 2012; Curran et al. 2017), see Fig. 5.
| Island ID | Island coordinates | Comp_ID | Component coordinates | Peak flux density | SDSS ID | Redshift | In Ching et al. (2017) | Sep. | ||
|---|---|---|---|---|---|---|---|---|---|---|
| RA [J2000] | Dec. [J2000] | RA [J2000] | Dec. [J2000] | mJy beam-1 | arcsec | |||||
| [1] | [2] | [3] | [4] | [5] | [6] | [7] | [8] | [9] | [10] | [11] |
| Islands that contain one component | ||||||||||
| SB13285_island_905 | 08:35:14.06 | +00:16:13.04 | a | 08:35:14.05 | +00:16:12.98 | 13.5 | J083514.23+001614.71 | 0.574s | yes | 3.09 |
| SB13285_island_788 | 08:36:26.34 | +03:40:54.81 | a | 08:36:26.34 | +03:40:54.71 | 15.7 | J083626.33+034055.31 | 0.663s | no | 0.53 |
| SB13285_island_1014 | 08:37:10.76 | +02:50:46.82 | a | 08:37:10.74 | +02:50:46.63 | 11.5 | J083710.75+025046.88 | 0.543g | yes | 0.19 |
| SB13285_island_675 | 08:37:22.77 | +02:21:01.89 | a | 08:37:23.18 | +02:21:03.12 | 18.0 | J083722.96+022104.65 | 0.606g | yes | 3.94 |
| SB13285_island_531 | 08:37:42.21 | +00:00:47.07 | a | 08:37:42.18 | +00:00:46.36 | 24.7 | J083742.25+000045.56 | 0.455g | yes | 1.62 |
| SB13285_island_138 | 08:38:11.76 | -01:59:35.49 | a | 08:38:11.76 | -01:59:35.72 | 88.9 | J083811.77-015935.40 | 0.561g | no | 0.20 |
| SB13285_island_201 | 08:38:34.59 | +00:02:08.21 | a | 08:38:34.58 | +00:02:07.89 | 65.0 | J083834.58+000208.24 | 0.608g | yes | 0.11 |
| SB13285_island_575 | 08:38:53.25 | +02:38:06.58 | a | 08:38:53.42 | +02:38:04.05 | 22.6 | J083853.48+023802.92 | 0.462g | yes | 5.04 |
| …… | ||||||||||
| Islands that contain multi components | ||||||||||
| SB13285_island_2 | 08:36:20.41 | -00:37:23.20 | a | 08:36:20.38 | -00:37:25.36 | 467.4 | J083620.43-003723.65 | 0.526g | yes | 0.60 |
| SB13285_island_2 | 08:36:20.41 | -00:37:23.20 | b | 08:36:20.45 | -00:37:22.16 | 431.7 | J083620.43-003723.65 | 0.526g | yes | 0.60 |
| SB13285_island_2 | 08:36:20.41 | -00:37:23.20 | c | 08:36:20.44 | -00:36:58.48 | 13.1 | J083620.43-003723.65 | 0.526g | yes | 0.60 |
| SB13285_island_47 | 08:38:14.27 | -00:26:00.77 | a | 08:38:14.39 | -00:26:01.72 | 115.4 | J083814.28-002600.92 | 0.460g | yes | 0.19 |
| SB13285_island_47 | 08:38:14.27 | -00:26:00.77 | b | 08:38:14.11 | -00:26:00.43 | 93.7 | J083814.28-002600.92 | 0.460g | yes | 0.19 |
| SB13285_island_150 | 08:45:13.11 | -00:43:13.71 | a | 08:45:13.34 | -00:42:57.57 | 81.1 | J084512.97-004318.22 | 0.701g | yes | 4.99 |
| SB13285_island_150 | 08:45:13.11 | -00:43:13.71 | b | 08:45:12.72 | -00:43:41.02 | 48.4 | J084512.97-004318.22 | 0.701g | yes | 4.99 |
| SB13285_island_305 | 08:47:00.63 | +00:37:16.78 | a | 08:47:00.40 | +00:37:15.62 | 40.3 | J084700.78+003718.36 | 0.428s | no | 2.77 |
| …… | ||||||||||
sredshift from SDSS. gredshift from GAMA. nredshift from NED. c redshift from Ching et al. (2017).
| SDSS ID | Redshift | D | Type | Structure | Field | SBID | rms | |||||||||||||
| Mpc | mJy | mJy | mag | mag | mag | mag | mag | mag | mJy chan-1 | |||||||||||
| [1] | [2] | [3] | [4] | [5] | [6] | [7] | [8] | [9] | [10] | [11] | [12] | [13] | [14] | [15] | [16] | [17] | [18] | [19] | [20] | [21] |
| J083514.23+001614.71 | 0.574 | 3345.64 | 9.7 | 15.53 | 25.12 | -0.96 | 15.000 | 0.035 | 14.932 | 0.072 | >12.797 | … | 52.15 | … | C | G9A | 13293 | 3.28 | <1.247 | <22.46 |
| J083620.43-003723.65 | 0.526 | 3010.90 | 560.0 | 876.93 | 26.79 | -0.91 | 16.821 | 0.105 | 16.139 | 0.202 | >12.660 | … | 53.49 | HERG | C | G9A | 13293 | 2.89 | <0.012 | <20.45 |
| J083626.33+034055.31 | 0.663 | 3986.27 | 14.3 | 17.83 | 25.31 | -0.45 | 14.741 | 0.032 | 14.751 | 0.066 | >11.888 | … | 52.56 | … | C | G9A | 13293 | 4.89 | <2.414 | <22.75 |
| J083710.75+025046.88 | 0.543 | 3128.55 | 9.6 | 13.99 | 25.03 | -0.76 | 15.038 | 0.035 | 14.689 | 0.061 | >12.296 | … | 53.03 | LERG | C | G9A | 13293 | 3.68 | <2.520 | <22.77 |
| J083722.96+022104.65 | 0.606 | 3573.09 | 21.0 | 37.25 | 25.55 | -1.16 | 13.140 | 0.043 | 13.180 | 0.049 | >11.722 | … | 50.14 | LERG | Ext | G9A | 13293 | 3.36 | <0.963 | <22.35 |
| J083742.25+000045.56 | 0.455 | 2530.80 | 29.3 | 25.42 | 25.13 | 0.29 | 15.870 | 0.052 | 15.276 | 0.088 | 11.646 | 0.239 | 51.78 | LERG | C | G9A | 13293 | 2.54 | <0.366 | <21.93 |
| J083811.77-015935.40 | 0.561 | 3254.21 | 72.5 | 89.65 | 25.86 | -0.43 | 14.755 | 0.032 | 14.684 | 0.059 | >12.185 | … | 53.4 | … | C | G9A | 13293 | 3.29 | <0.117 | <21.43 |
| J083814.28-002600.92 | 0.46 | 2563.99 | 138.0 | 209.42 | 26.05 | -0.85 | 16.053 | 0.060 | 15.932 | 0.159 | >12.435 | … | 49.45 | LERG | C | G9A | 13293 | 2.62 | <0.040 | <20.97 |
| J083834.58+000208.24 | 0.608 | 3587.42 | 42.0 | 67.28 | 25.81 | -0.96 | 15.023 | 0.035 | 14.947 | 0.067 | >12.491 | … | 50.27 | LERG | C | G9A | 13293 | 2.88 | <0.141 | <21.52 |
| J083853.48+023802.92 | 0.462 | 2577.30 | 20.3 | 38.44 | 25.32 | -1.3 | 15.512 | 0.043 | 15.353 | 0.098 | 12.346 | 0.460 | 49.44 | LERG | Ext | G9A | 13293 | 3.10 | <0.582 | <22.13 |
| J083929.72-005829.96 | 0.555 | 3212.20 | 10.9 | 17.76 | 25.15 | -0.99 | 14.715 | 0.033 | 14.531 | 0.057 | >12.601 | … | 50.25 | LERG | C | G9A | 13293 | 2.91 | <0.816 | <22.28 |
| J084002.46+003013.59 | 0.427 | 2346.71 | 22.7 | 37.19 | 25.23 | -1.0 | 15.007 | 0.035 | 14.838 | 0.070 | >12.027 | … | 52.21 | LERG | C | G9A | 13293 | 2.54 | <0.246 | <21.76 |
| J084026.37+000006.75 | 0.980 | 6444.69 | 16.0 | 19.68 | 25.69 | -0.42 | 15.004 | 0.035 | 13.932 | 0.039 | 11.462 | 0.247 | 56.01 | AeB | C | G9A | 13293 | 3.88 | <1.009 | <22.37 |
| J084225.51+025252.72 | 0.425 | 2333.68 | 16.7 | 16.89 | 24.89 | -0.02 | 14.488 | 0.030 | 14.152 | 0.046 | 12.027 | 0.380 | 54.27 | LERG | C | G9A | 13293 | 2.57 | <0.666 | <22.19 |
| J084253.77+031427.91 | 0.519 | 2962.75 | 12.8 | 18.99 | 25.12 | -0.8 | 15.096 | 0.038 | 15.155 | 0.087 | >12.521 | … | 52.02 | … | C | G9A | 13293 | 2.81 | <0.828 | <22.28 |
| J084428.51+014818.77 | 0.868 | 5548.03 | 15.1 | 29.05 | 25.76 | -1.33 | 15.296 | 0.038 | 14.560 | 0.055 | 11.546 | 0.199 | 55.3 | AeB | C | G9A | 13293 | 3.20 | <0.522 | <22.08 |
| J084453.56-004208.47 | 0.442 | 2444.95 | 11.1 | 16.98 | 24.93 | -0.86 | 15.089 | 0.036 | 14.685 | 0.057 | >11.968 | … | 51.31 | LERG | C | G9A | 13293 | 2.33 | <0.954 | <22.35 |
| J084512.97-004318.22 | 0.701 | 4267.15 | 109.8 | 163.77 | 26.32 | -0.81 | 15.290 | 0.039 | 14.509 | 0.052 | >12.131 | … | 54.97 | AeB | Ext | G9A | 13293 | 2.69 | <0.795 | <22.27 |
| J084543.95+005736.97 | 0.427 | 2346.71 | 157.8 | 203.13 | 25.97 | -0.51 | 15.145 | 0.038 | 14.829 | 0.072 | 11.785 | 0.292 | 52.43 | LERG | C | G9A | 13293 | 2.18 | <0.034 | <20.90 |
| J084553.45-024100.15 | 0.468 | 2617.30 | 54.9 | 67.85 | 25.58 | -0.43 | 12.614 | 0.024 | 11.516 | 0.021 | 8.773 | 0.028 | 57.14 | … | C | G9A | 13293 | 6.81 | <0.353 | <21.91 |
| J084615.46+021141.12 | 0.651 | 3898.46 | 39.6 | 61.66 | 25.83 | -0.9 | 14.971 | 0.035 | 14.899 | 0.070 | >12.661 | … | 52.24 | LERG | C | G9A | 13293 | 2.57 | <0.197 | <21.66 |
| J084620.68+020228.07 | 0.498 | 2819.35 | 10.2 | 19.0 | 25.08 | -1.26 | 15.271 | 0.038 | 14.886 | 0.068 | >11.820 | … | 50.64 | HERG | C | G9A | 13293 | 2.26 | <0.458 | <22.03 |
| J084623.12-012218.41 | 0.446 | 2471.30 | 7.8 | 11.0 | 24.75 | -0.7 | 15.147 | 0.035 | 15.086 | 0.076 | >12.120 | … | 51.52 | … | C | G9A | 13293 | 2.39 | <1.105 | <22.41 |
| J084700.78+003718.36 | 0.428 | 2353.24 | 41.4 | 60.72 | 25.45 | -0.78 | 15.305 | 0.038 | 14.666 | 0.059 | 12.097 | 0.336 | 50.46 | … | Ext | G9A | 13293 | 2.32 | <0.183 | <21.63 |
| J084709.97+005459.33 | 0.430 | 2366.29 | 45.8 | 72.73 | 25.53 | -0.94 | 15.264 | 0.040 | 15.104 | 0.094 | >12.592 | … | 52.09 | LERG | C | G9A | 13293 | 2.17 | <0.104 | <21.38 |
| Name | Redshift | SBID | ||||||
|---|---|---|---|---|---|---|---|---|
| [1] | [2] | [3] | [4] | [5] | [6] | [7] | [8] | [9] |
| SDSS J090331+010847 | 0.522 | 1 | 13283 | |||||
| SDSS J113622+004852 | 0.563 | 1 | 13306 | |||||
| 1 | 13334 |
5 Results
5.1 Line-finder results
We used the Bayesian method developed by Allison et al. (2012a) to detect and parametrize H i absorption lines. This method uses multi-modal nested sampling, a Monte Carlo sampling algorithm, to simultaneously find and fit any potential H i absorption line in a radio spectrum. The Bayes factor (e.g. Kass & Raftery 1995) is used to quantify the relative significance of a Gaussian spectral line model versus a noise model. > 1 means a Gaussian spectral line model is preferred over a model with no line, see Allison et al. (2012a) for the details of this method. In a simulation in which 1000 fake absorption lines were randomly produced, this method can find all lines with FWHM and peak signal noise ratio in a single 18.5-kHz channel, see Fig. 4 in Allison et al. (2020). This method has also been proved to be effective in finding H i absorption lines in observed ASKAP data (e.g. Allison et al. 2020; Sadler et al. 2020)
We first extracted spectra of our 326 targets, spanning from km s-1 to km s-1 in the rest frame and using the post-processed spectra from SBIDs 13293, 13283, 13306, 13335, 13294, and 13273. We then ran the FLASHfinder444https://github.com/drjamesallison/flash_finder on these cut-down spectra. To estimate the number of false-positive absorption features produced by noise or spectral glitches we then inverted our spectra and ran the FLASHfinder on them again. Lines due to noise rather than a genuine signal should produce similar distributions of features in both absorption and emission. For details of this method, please refer to Allison (2021). In this process, we detected 23 negative features with in our normal spectra and 18 negative features with in the inverted spectra.
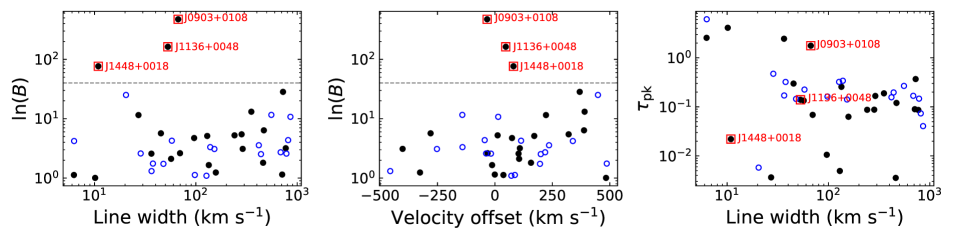
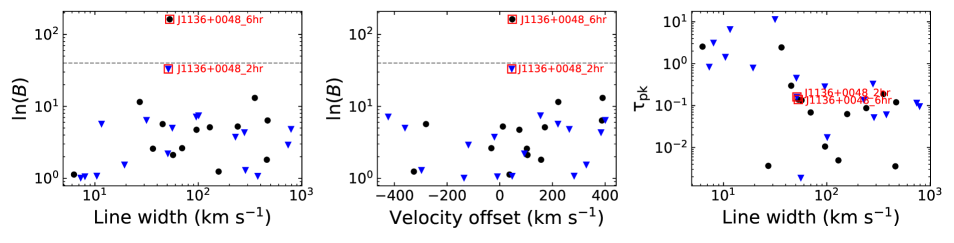
To distinguish the real detections from false features, we plotted the FLASHfinder results in various parameter spaces as shown in Fig. 6. Three sources, labelled as J0903+0108, J1136+0048, and J1448+0018 in Fig. 6, with value of 40 stand out in the vs line width and vs velocity offset plots. However, these three sources are clustered with others in the vs line width plot that was previously used to identify real detections in ATCA observations of compact radio sources (Allison et al., 2012b).
As a final step, we visually inspected the 326 radio spectra including those not reported with > 1 and confirmed the accurate reports from the FLASHfinder. We further confirmed that J0903+0108 and J1136+0048 are genuine detections, whereas the narrow J1448+0018 line is a spectral glitch at the edge of an ASKAP beam-forming interval (we plotted the edges of beam-forming intervals on the FLASH spectra).
5.2 Comparison of the 6hr and 2hr data
We have both 6 hour and 2 hour post-processed spectra for the GAMA_09A, GAMA_12A and GAMA_15A fields. As a comparison, we show the results of FLASHfinder of these fields in Fig. 7. In total, we detected 14 and 17 negative features with > 1 in the 6 hour and 2 hour spectra of the three fields respectively. The absorption line in SDSS J1136+0048 has = 162.8 and = 33.2 in the 6 hour and 2 hours observations respectively. Although the value in SDSS J1136+0048 for the 2 hour observation is lower than in the 6 hour observation, it is still a significant detection. Fig. 7 shows that, apart from SDSS J1136+0048, there is no other negative feature that stands out in . The number of spurious detections in the 6 hour observations is 13, compared to 16 in the 2 hour observation. The distributions of spurious negative features are similar in the 2 hour and 6 hour observations, consistent with these being random noise peaks.
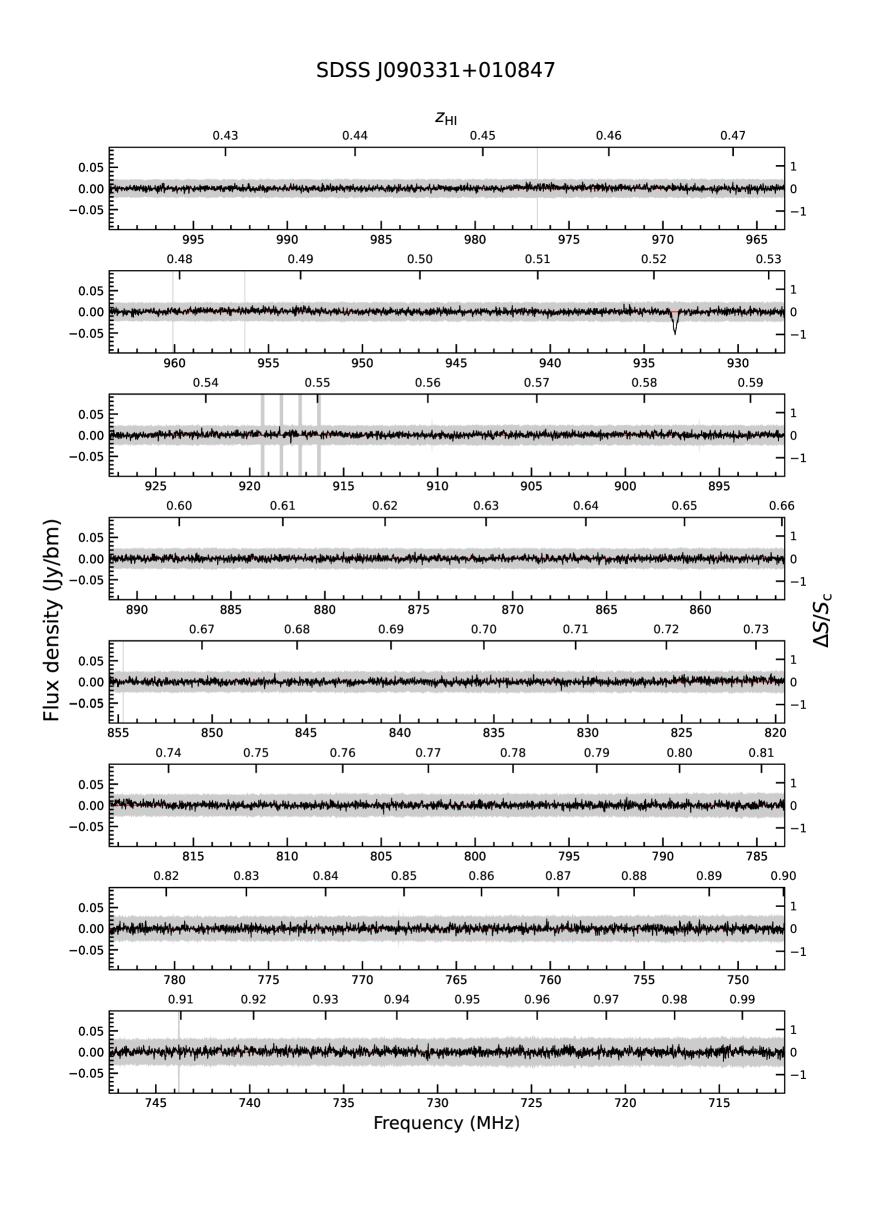
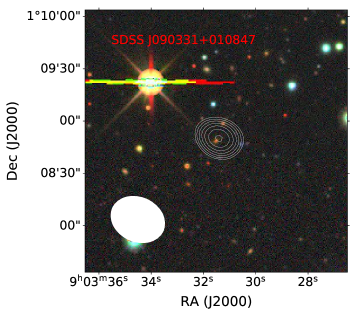
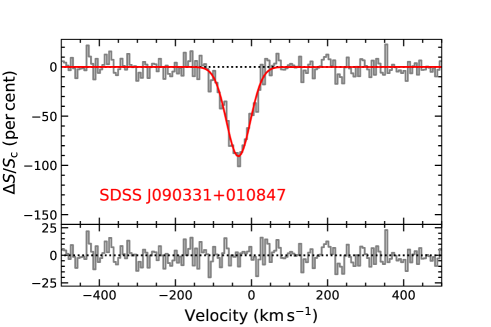
5.3 Detection of associated H i absorption in SDSS J090331+010847.
5.3.1 The H i spectrum
We detected an associated H i absorption line towards the radio galaxy SDSS J090331+010847 at redshift (Ching et al., 2017). We show the full-band radio spectrum for this object (from SBID 13283) in Fig. 11. The quality of the spectrum is good and the band is free of radio frequency interference (RFI), though a few glitches are seen, notably between 916 and 920 MHz. These are caused by a ‘correlator dropout’, an intermittent ASKAP issue in which some of the high-resolution frequency channels in a single correlator block cease to provide data.
An absorption line is seen at 933.352 MHz which is consistent with the GAMA optical redshift of SDSS J090331+010847. The measured average rms noise per channel around 933.352 MHz is 4.59 mJy beam-1. An enlarged spectrum of the line is shown in Fig. 13 and the line is best fitted with a single Gaussian component via a Bayesian approach as described by Allison et al. (2015). The fitted parameters for velocity width, peak optical depth, integral optical depth, and FWHM are listed in Table 6. The H i column density is given by:
| (1) |
For J090331+010847, this yields a value of NHI = atoms cm-2 which is much higher than the lowest H i column density used to define Damped Lyman Alpha absorbers (DLA; A DLA is defined to have an H i column density above atoms cm-2). In Eq. 1, is the spin temperature of the H i gas, V is the velocity in the rest frame and is the optical depth given by
| (2) |
Here, is the covering factor indicating the fraction of background radio continuum intercepted by the foreground H i gas, is the flux density in the line555For an absorption line, the value of is negative in equation 2 and is the continuum flux density. From the expression for we can see that it is indeed independent of redshift.
In our calculation, we assumed a covering factor of 1 and adopted a spin temperature of 100 K. The covering factor and spin temperature are two uncertain parameters, which can influence the calculated H i column density. In some very long baseline interferometry (VLBI) H i spectral observations where the absorbing H i has been resolved against its background radio continuum, the covering factor is generally less (or much less) than 1. For example, in the case of Cygnus A, the H i gas was detected only against about half of the central radio continuum (Struve & Conway, 2010). Similar situations have been also reported in other VLBI studies (e.g. Morganti et al. 2013; Schulz et al. 2021).
The H i spin temperature we adopted is also a fiducial value often used when a measurement of it is unavailable. In reality, the spin temperature may be higher than 100 K. Previously known measurements of H i spin temperature towards extra-galactic targets and those in our own Milky Way galaxy show that 100 K is at the low end of the distribution of H i spin temperatures (e.g. Reeves et al. 2015; Reeves et al. 2016; Kanekar et al. 2014; Murray et al. 2018; Allison 2021). Additionally, the H i spin temperature may change dramatically across regions in a galaxy. In the circumnuclear region of AGN, it could be as high as K (Bahcall & Ekers, 1969). Therefore, the H i column density we calculated based on Eq. 1 for SDSS J090331+010847 should be considered as only a lower limit.
5.3.2 Optical properties
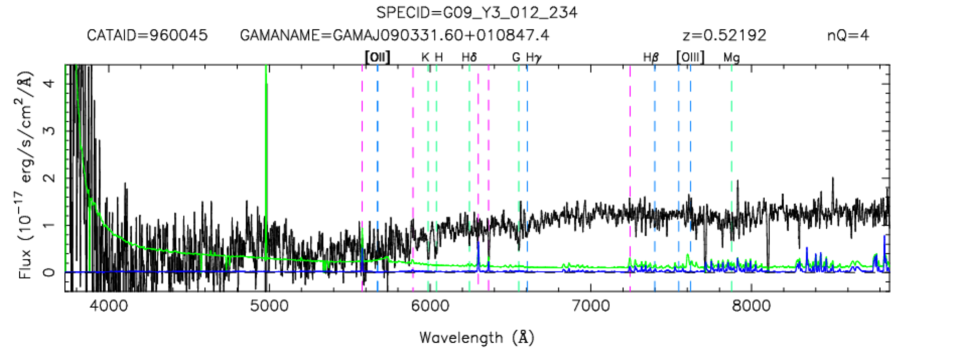
Based on its optical colours, SDSS J090331+010847 is a red galaxy. Fig. 13 shows ASKAP radio contours overplotted on a composite image from the DESI Legacy Imaging Surveys (Dey et al., 2019) . The GAMA optical spectrum of SDSS J090331+010847 gives a redshift of 0.522 with quality = 4, corresponding to a systemic velocity of 156,600 km s-1, see Fig. 8. There are no prominent emission lines in the spectrum but some stellar absorption lines are visible and Ching et al. (2017) classified this object as a LERG.
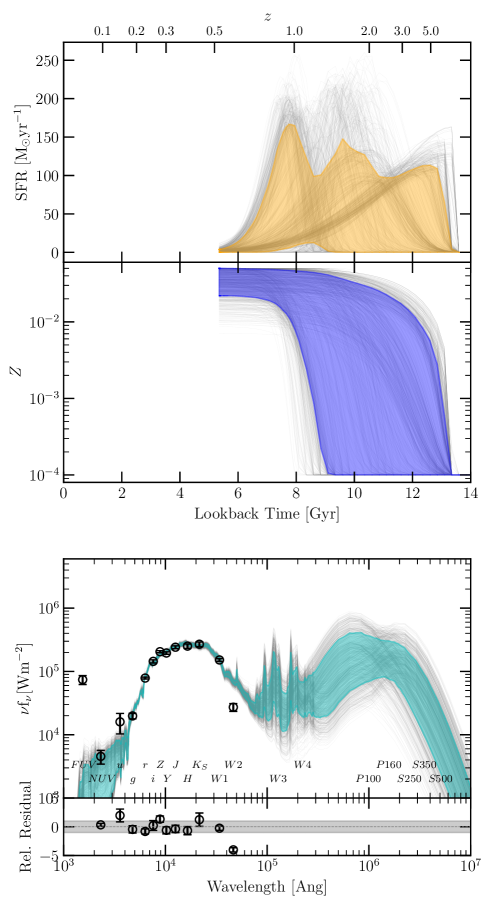
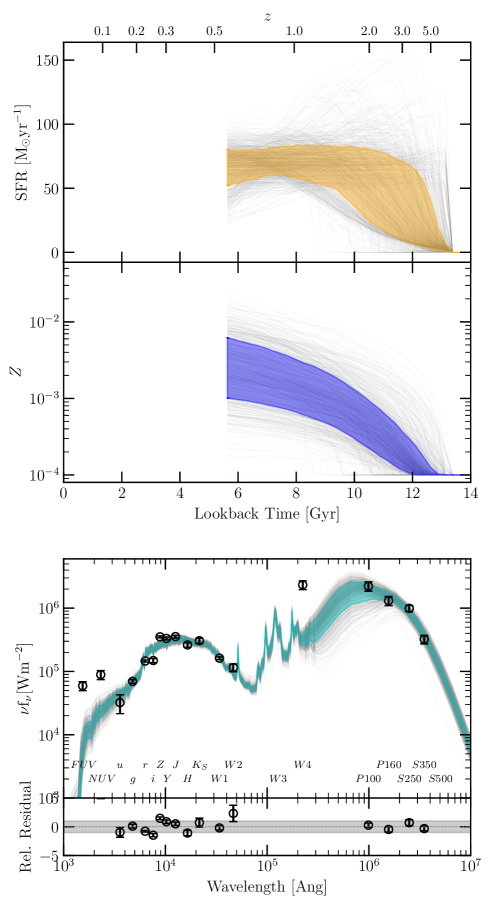
We fitted the UV-optical-infrared spectral energy distribution (SED) of SDSS J090331+010847 using the ProSpect code (Robotham et al., 2020) to simultaneously fit a stellar model, attenuation model, dust emission model, and Fig. 9 shows the fitted SED. From this fit, we estimate a stellar mass of , a metallicity , a dust mass of , and a star formation rate of .
The SED fit implies that SDSS J090331+010847 had a very high star formation rate early in its history, peaking above 100 . However, the star formation rate decreased dramatically between and and star formation now appears to be largely quenched in this galaxy.
5.3.3 Radio properties
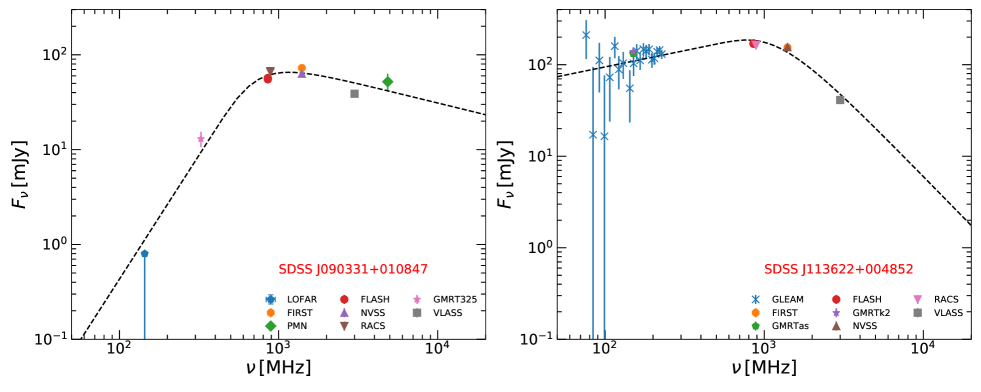
We explore the radio properties of SDSS J090331+010847 by combining the data from our own observation, FIRST, NVSS, VLA Sky Survey (VLASS, Gordon et al., 2020), and other literature measurements.
With ASKAP we observed SDSS J090331+010847 twice (SBID 13283 and 11068, see Table 3) and measured an unresolved radio source with flux densities of 56.9 and 55.1 mJy respectively. SDSS J090331+010847 is also compact in FIRST, NVSS and VLASS, with flux densities of 72.69, 63.1, and 38.3 mJy respectively. We note that the NVSS integrated flux density is 9.59 mJy lower than the FIRST flux density, which is unexpected as NVSS has a larger beam and is more sensitive to diffuse radio components. The most likely interpretation is that SDSS J090331+010847 hosts a variable radio source, which is not uncommon for AGN.
We added some additional radio continuum data points from the literature and fitted the radio spectrum for SDSS J090331+010847 using the equation:
| (3) |
where , , , and are peak flux density, peak frequency, optically thick index, and optically thin index, respectively (Snellen et al., 1998). The fitted radio SED is shown in Fig. 10 and the fitted parameters are listed in Table 7.
The radio SED of SDSS J090331+010847 peaks at 768 MHz in the observed frame, corresponding to 1167 MHz in the source rest frame, with an optically thick index of and optically thin index of . SDSS J090331+010847 is therefore a GPS radio source, indicating that this is a young radio source in a period when the radio jet is in growing but still confined within its host galaxy.
The fitted spectral index of below the peak is similar to that of the extreme GPS source PKS B0008-421 (Callingham et al., 2015), which has the steepest known slope below the turnover. The current low-frequency fit is constrained mainly by a single data point at 325 MHz, but the source is undetected in a recent LOFAR image (J.R. Callingham and T.W. Shimwell, private communication) with a flux density mJy at 144 MHz. This LOFAR upper limit is consistent with a steep spectrum below the peak (see Fig. 10). Deeper observations of this source at frequencies below 300 MHz would be extremely useful.
5.3.4 Infrared properties
The WISE W1 and W2 magnitudes for SDSS J090331+010847 are 15.6710.047 and 15.7670.132 respectively, with an upper limit of 12.397 in W3. The location in the WISE colour-colour diagram is shown by a green marker in Fig. 4. Taking into consideration the measurement errors, SDSS J090331+010847 could be located in any any of the Luminous Infrared Galaxy (LIRG), spiral galaxy, and elliptical galaxy regions.
The W1-W2 colour can reflect the fraction of emission from an AGN (Stern et al., 2012), so the low W1-W2 value of SDSS J090331+010847 means that the AGN in SDSS J090331+010847 contributes a small fraction to total emission which is consistent with that in LERGs with radiatively-inefficient accretion, where the dominant emission in the mid-IR comes from the host galaxy.
5.3.5 Summary
Given the high H i column density estimated from H i absorption and the stellar mass derived from UV-optical-infrared SED, we conclude that SDSS J090331+010847 is a massive and gas rich galaxy. If we assume an H i:dust mass ratio of like that in the Milky Way (e.g. Knapp & Kerr, 1974), then the fitted dust mass of M⊙ implies an H i mass around M⊙ for SDSS J090331+010847. If the H i mass:dust mass ratio is higher at than in the Milky Way, as suggested by the work of Ménard & Chelouche (2009), then the estimated H i mass will be somewhat higher. SDSS J090331+010847 therefore appears to be a massive, red, gas-rich galaxy with a high H i mass in which the current star formation rate is low and star formation appears to have been largely quenched over the previous 1–2 Gyr.
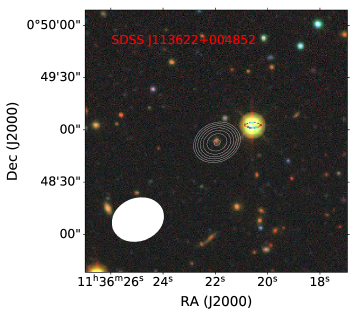
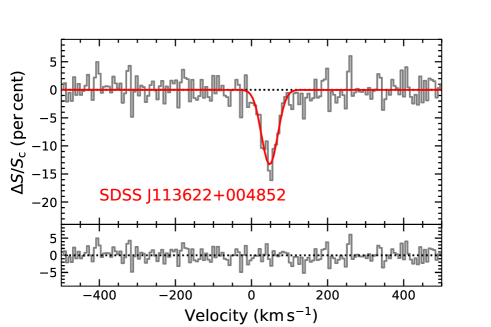
5.4 Associated H i absorption detection towards SDSS J113622+004854.
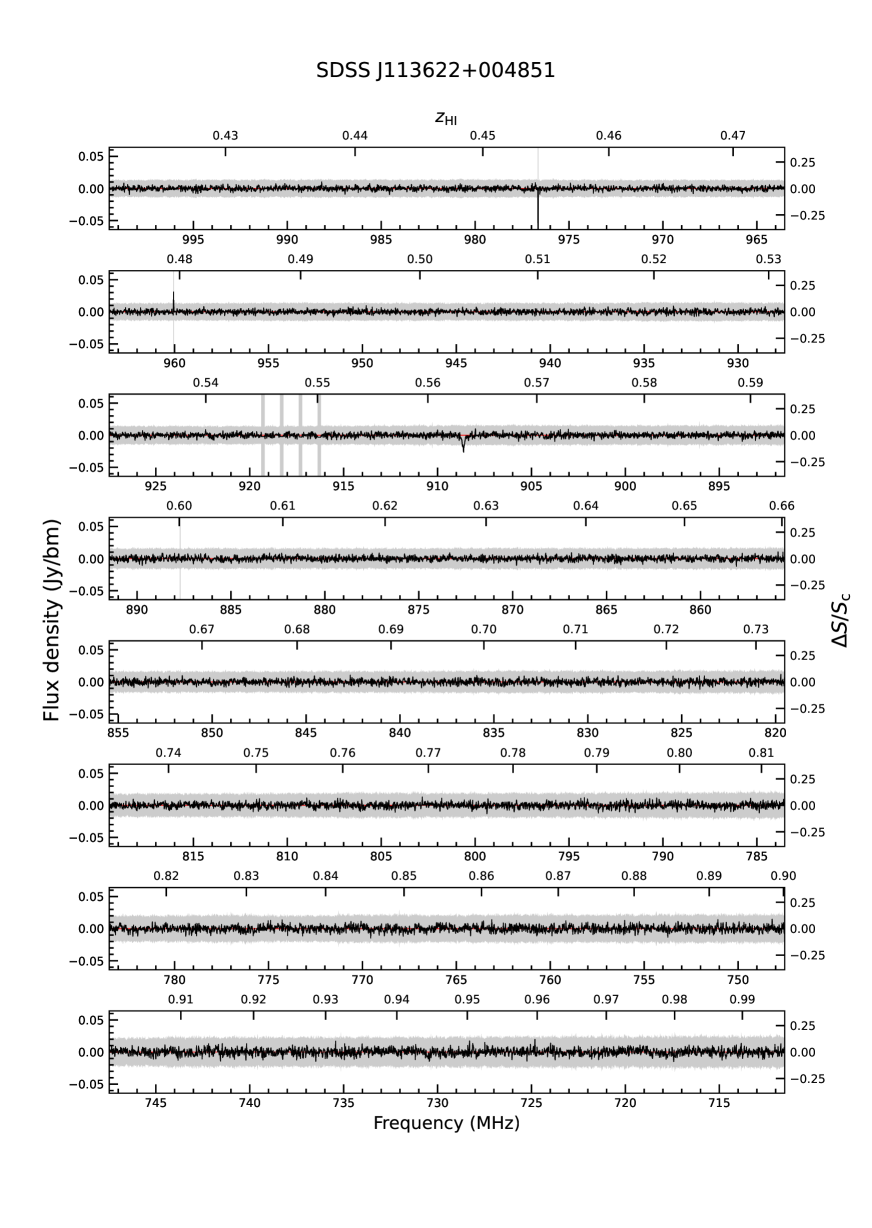
5.4.1 The H i spectrum
We also detected an associated H i absorption line towards the galaxy SDSS J113622+004852 at redshift . The full-band radio spectrum from SBID 13306 is shown in Fig. 12 and has an absorption line at 908.63 MHz. The H i absorption redshift is consistent with the GAMA optical redshift, implying associated H i absorption. An enlarged spectrum with rms noise of 2.98 mJy beam-1 channel-1 is shown in Fig. 13 and is best fitted with a single Gaussian component. The fitted parameters are listed in Table 6.
The estimated H i column density for SDSS J113622+004852 is atoms cm-2 using Eq. 1 and assuming a covering factor of 1 and a spin temperature of 100 K.
5.4.2 Optical properties
Fig. 13 shows a composite image of SDSS J113622+004852 from the DESI Legacy Imaging Surveys (Dey et al., 2019) with ASKAP radio contours overlaid. The accuracy of the SDSS optical photometry for this object is affected by the presence of a bright foreground star about 15 arcsec away, and also visible in Fig. 13.
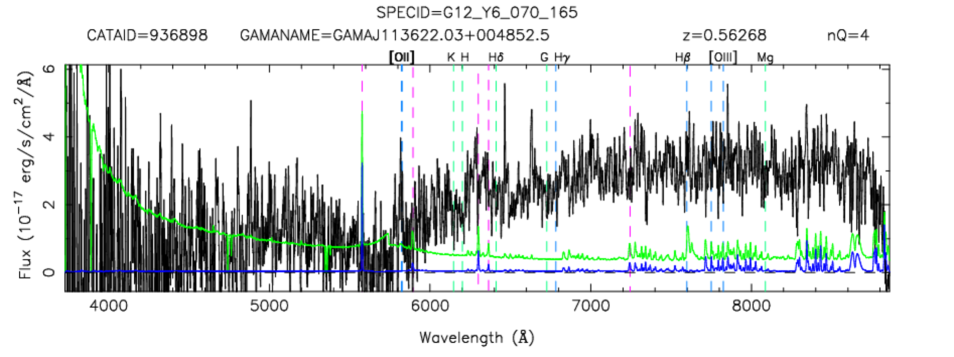
The GAMA optical spectrum of SDSS J113622+004852 gives a redshift of 0.563 (Baldry et al., 2018) with , corresponding to a systemic velocity of 168,900 km s-1. The spectrum (see Fig. 8) shows weak [OII] emission but no other obvious emission lines, and was classified as a LERG by Ching et al. (2017).
The ProSpect fit to the UV-optical-infrared SED for SDSS J113522+004852 is shown in Fig. 9. From the SED fitting, we derive a stellar mass of , a metallicity , a dust mass of , and a star formation rate of . The metallicity derived for this galaxy is lower than would be expected from its stellar mass, since galaxies as massive as SDSS J113622+004854 generally have above-solar metallicity (e.g. Bellstedt et al., 2021). We note however that metallicity information is a very subtle signature in the optical bands (Thorne et al., 2021) and more accurate photometry is needed to determine whether this object is a genuine outlier from the mass-metallicity relation at intermediate redshift.
5.4.3 Radio properties
We explored the radio SED of SDSS J113622+004852 in the same way as for SDSS J090331+010857, by combining the data from our own observations with measurements from the literature. SDSS J113622+004852 is an unresolved source in FIRST, NVSS and VLASS, but Table 4 lists SDSS J113622+004852 as a two-component island in the ASKAP image (though with a separation smaller than the ASKAP beam) - raising the possibility that some extended low-frequency emission may also be present. The fitted SED is shown in Fig. 10 and fitted parameters are listed in Table 7.
The radio spectrum of SDSS J113622+004852 peaks at 1279 MHz in the observed frame, corresponding to 1999.1 MHz in the source rest frame, with an optically thick spectral index of and optically thin index of . Like SDSS J090331+010847 therefore, SDSS J113622+004852 is also a peaked-spectrum radio source.
5.4.4 Infrared properties
The WISE W1, W2, and W3 magnitudes for SDSS J113622+004852 are 15.4090.040, 14.8390.068, and 9.7990.055 respectivey. Its location in the WISE two-colour diagram is shown by the cyan marker in Fig. 4.
SDSS J113622+004852 has (W1-W2), which is lower than the value of 0.8 often used to select AGN candidates (Stern et al., 2012) and implies that the mid-IR emission comes mainly from the stellar host galaxy. This is consistent with the optical classification of LERG by Ching et al. (2017). However, the (W2-W3) value of 5.04 mag implies a star-formation rate at the high end of starburst galaxies, and this is consistent with the star formation rate (SFR) of 68.65 derived from the ProSpect SED fit, which is much higher than the estimated SFR of 1.47 for SDSS J090331+010847.
5.4.5 Summary
The high H i column density measured from H i absorption and the properties derived from the UV-optical-infrared SED imply that SDSS J113622+004852 is a massive, gas-rich, and dust-obscured starburst galaxy. From the SED-derived dust mass, we estimate an H i mass of at least M⊙ for J113622+004852.
In contrast to J090331+010847, the ProSpect fit for SDSS J113622+004852 implies that it has sustained a high star-formation rate since at least and is continuing to form stars at the rate of over 50 with no sign of quenching. Its recent star formation history appears to be very different from that of J090331+010847, implying that the relationship between H i and star formation at intermediate redshift is far from straightforward.
5.5 Upper limits for H i non-detections
For the 324 sources that were not detected in H i absorption, we now estimate a 3 upper limit for the H i column density.
For a Gaussian absorption line, the integrated optical depth is = , where is the peak optical depth. We can combine this relation with Eq. 1 to calculate an upper limit in for each source assuming a Gaussian line profile:
| (4) |
where is the rms spectral noise listed in Table 5. For 49 of our faintest radio targets the 3 noise is larger than their continuum flux density, so we only calculate a 3 upper limit for the remaining 275 sources. We adopt values of = 100 K and = 1, and assume FWHM = 120 km s for an associated H i absorption line (Allison et al., 2022). The calculated 3 peak optical depth upper limit and the corresponding H i column density upper limit for each source are listed in columns 20 and 21 of Table 5.
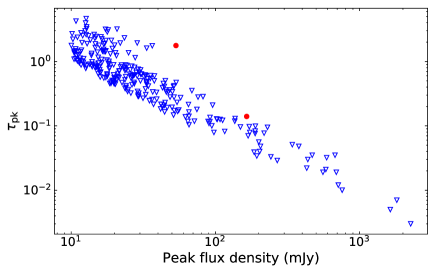
Fig. 14 shows the 3 upper limit in peak optical depth as a function of peak flux density for all the sources in our target sample. For most of these objects, we have limited sensitivity to lines with low H i optical depth. For sources with peak flux density above about 100 mJy we can make 3 detections of lines with . This is comparable to the detection limit of for the Maccagni et al. (2017) sample, but less sensitive than the limit of achieved by Vermeulen et al. (2003) for a sample of 57 sources.
Very strong lines like that seen in SDSS J090331+010847 with can however be detected against much fainter sources, and the inclusion of large numbers of relatively faint continuum sources in a single observation is one advantage of a wide-field absorption survey with ASKAP.
| Name | (mJy) | (MHz) | ||
|---|---|---|---|---|
| [1] | [2] | [3] | [4] | [5] |
| SDSS J090331+010847 | 56 7 | 768152 | 2.610.68 | -0.410.22 |
| SDSS J113622+004852 | 14935 | 1279577 | 0.360.81 | -1.781.06 |
6 The detection rate for associated H i absorption
6.1 Detection rate from this survey
We found two associated H i absorption detections from a sample of 326 targets with mJy. At first glance, this detection rate (%) is much lower than that in found in previous studies of low redshift sources (e.g. van Gorkom et al., 1989; Emonts et al., 2010; Chandola et al., 2011; Glowacki et al., 2017). However, the samples in several of these studies were pre-selected to be compact radio sources, dust-obscured galaxies, or very bright galaxies.
A useful comparison for our ASKAP sample is the representative study of a sample of 248 low-redshift () sources observed with the Westerbork radio telescope (WSRT). The WSRT observations had integration times of up to six hours and achieved a median rms noise level of 0.81 mJy beam-1 (Geréb et al., 2014, 2015; Maccagni et al., 2017). The detection rate for associated H i absorption in the WSRT sample was % for sources with a 1.4 GHz core flux density larger than 30 mJy.
In contrast to the WSRT study, FLASH is a relatively shallow survey with a typical rms spectral-line noise of 4.6 mJy in a 2 hour observation (see Table 3). To compare our results with the lower-redshift WSRT sample, we therefore compare the detection rate of H i 21-cm absorption with optical depth . In our observations, 35 of the 326 sources are bright enough to allow us to detect > 0.1 H i gas with at least 3 significance and we detected one of these sources, SDSS J113622+004852. (Our another associated absorber SDSS J090331+010847 is not one of these 35 sources due to its relatively low peak flux density). Our detection rate for sources with > 0.1, defined as DR, is % (where the quoted errors on the detection rates calculated in this paper are the 95% confidence level for a binomial distribution) (Brown et al., 2001).
6.2 Comparison with other surveys at different redshifts
To make a fair comparison with previous surveys at other redshifts, we choose to compare the occurrence of H i gas with > 0.1 for the reasons explained above.
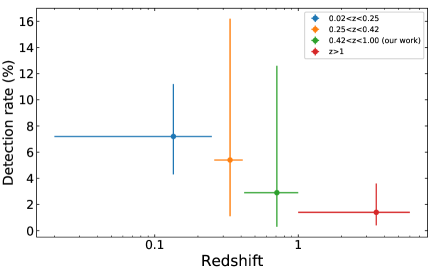
In the redshift range , we used the data from Maccagni et al. (2017). There are 222 sources in this sample for which it was possible to detect lines with with a significance greater than 3 and 16 of these sources were detected, giving a detection rate, DR of %.
In the redshift range , we consider several literature studies. Murthy et al. (2021) used Karl G. Jansky Very Large Array (JVLA) to observe 26 radio-loud AGN with FIRST peak flux densities of 400–800 mJy beam-1. Aditya & Kanekar (2018b) compiled observations of Caltech-Jodrell Bank Flat-spectrum (CJF) sources at redshift that had been searched for H i, and Grasha et al. (2019) compiled a sample of 145 compact and flat-spectrum radio sources at . to do a comparison. Between these three studies, there are 37 sources in the redshift range that are suitable for detecting > 0.1 with a significance above 3. Two of these sources were detected with > 0.1, giving a detection rate, DR, of % in this redshift range.
In the redshift range there are a few previous studies (e.g. Aditya & Kanekar 2018b; Aditya 2019; Murthy et al. 2022), but we chose to us our own data to minimize any selection bias. As noted above, the detection rate here is %.
For high-redshift searches at , we explored almost all the available literature (Aditya et al. 2016; Aditya et al. 2017; Aditya & Kanekar 2018a, b; Aditya et al. 2021; Carilli et al. 2007; Chowdhury et al. 2020; Curran et al. 2006; Curran et al. 2008; Curran et al. 2011; Curran et al. 2013b, a; Curran et al. 2016; Curran et al. 2017; de Waard et al. 1985; Dutta et al. 2020; Grasha et al. 2019; Gupta et al. 2006; Gupta et al. 2021; Ishwara-Chandra et al. 2003; Kanekar et al. 2009; Mhaskey et al. 2020; Röttgering et al. 1999; Uson et al. 1991; Yan et al. 2016) and found three detections with out of 221 sources for which 3 detections could have been made at this level. This gives a detection rate DR of %.
We plot the detection rates across these different redshift ranges in Fig. 15. Although the error bars are large, we can see a general trend for the H i detection rate to decrease with increasing redshift. This is consistent with the findings of other studies, (e.g. Aditya et al., 2016; Aditya & Kanekar, 2018b).
Previous studies (e.g. Maccagni et al., 2017) found a higher detection rate for H i absorption in compact (and gas-rich) radio galaxies compared to extended radio galaxies. Here, we tentatively compare our results with the WSRT survey by Maccagni et al. (2017) since both the FLASH and WSRT surveys are large and relatively unbiased with respect to source morphology.
Maccagni et al. (2017) divided their sources into three classes based on their WISE colours: ‘dust-poor’ (W1–W2 < 0.5 and W2–W3 < 1.6), ‘12-m-bright’ (W1–W2 < 0.5 and 1.6 < W2–W3 < 3.4), and ‘4.6-m-bright’ (W1–W2 > 0.5), and most of their sources were classified as dust-poor and 12-m-bright. In the FLASH survey, most of our targets with reliable W1, W2, and W3 measurements have 0 < W1–W2 < 0.5 and 2 < W2–W3 < 4 so would be classed as ‘12-m-bright’ in this scheme (see Fig. 4).
The classification of our detected source SDSS J090331+010847 is uncertain in the Maccagni et al. (2017) scheme because of the unrestrictive upper limit in W3, whereas SDSS J113622+004852 can be classified as a ‘4.6-m-bright’ source – allowing us to compare the detection rates for this class. In the WSRT survey, there are 44 4.6-m-bright sources (of the 49 4.6-m-bright sources in the table A1 of Maccagni et al. (2017)) suitable for detecting with a significance above 3. Six sources were detected with these requirements, giving a detection rate of %. In our observations, we obtained one detection out of 28, giving a detection rate of % which is lower than that in the WSRT survey.
Similarly, the corresponding detection rate for compact radio sources in the WSRT sample, %, is higher than our rate of of %, with one detection from 28 FLASH compact sources that were bright enough for a line to be detectable at the level of . In both cases however, the small number of associated H i detections in our sample means that the differences between the two samples are suggestive rather than statistically significant.
It would be interesting to know whether the H i detection rate for the various classes of radio galaxies evolves with redshift, but associated H i detections with at redshift are quite rare and more detections are needed to allow a detailed comparison, which is outside the scope of the current paper.
6.3 Possible reasons for a varying H i detection rate
There is growing evidence from the literature that the detection rate for associated H i absorption decreases at higher redshift, and we briefly discuss several possible reasons for this.
6.3.1 Redshift evolution of the H i content of radio-loud AGN
We can rule out a scenario in which the decline in H i detection rate with redshift occurs because there is less H i gas in higher redshift galaxies. Ly absorption and H i emission-line stacking studies have shown that this is not the case, and that the overall cosmic H i mass density increases at higher redshift (e.g. see Fig. 14 in Rhee et al. 2018).
6.3.2 UV luminosity effects and ionisation
Many studies for associated H i absorption in high redshift AGN pre-selected optically-bright sources that are luminous in the rest-frame UV band. Curran et al. (2008) and Curran & Whiting (2012) pointed out that if the UV luminosity of an AGN exceeds some critical value, all the neutral hydrogen in that galaxy could be ionised and no longer observable as H i . This hypothesis has been confirmed and applied widely (e.g. Curran et al. 2011, 2016; Curran et al. 2017; Aditya et al. 2016; Grasha et al. 2019).
As can be seen from Table 5 and Fig. 5 however, the ionising photon rate distribution of our targets peaks around s-1 and only a few objects have an ionising photo rate above the critical value of s-1. Thus it appears that the UV luminosity effect cannot account for the low detection rate in our sample.
6.3.3 Effects related to radio luminosity
Because the sensitivity of an H i absorption search depends on the flux density of the radio source used as a probe, the sources searched at higher redshift are likely to have higher radio luminosity. However, the WSRT search of 248 compact and extended sources did not find any significant difference in detection rate across a range of radio luminosity from P to P W Hz-1 (Geréb et al. 2014; Maccagni et al. 2017).
Aditya et al. (2016) suggested a lower detection rate towards higher radio luminosity () by analysing 52 flat-spectrum sources, but a study by Curran & Duchesne (2018) that compiled all known H i absorption detections found that the detection rate did not vary significantly with radio luminosity. We therefore conclude that radio luminosity effects are unlikely to account for the relatively low detection rate in our sample.
6.3.4 Changes in H i spin temperature
The gas spin temperature can affect the detection rate for an H i absorption survey because for a fixed H i column density the observed 21 cm optical depth will decrease as increases. The spin temperature was often assumed to be 100 K in previous studies when there is no direct measurement.
For distant galaxies, combining Ly absorption and H i absorption has been used to successfully measure the spin temperature. By analysing 37 DLA systems observed in H i absorption, Kanekar et al. (2014) found a statistically significant difference between the Tspin distributions in their high-redshift () and low-redshift () sub-samples, with higher average values of at high redshifts. Additionally, Allison (2021) used statistical methods to measure the harmonic mean spin temperature at redshifts between and 1.0 and found evidence that the typical H i gas at these redshifts may be colder than the Milky Way interstellar medium.
The Kanekar et al. (2014) and Allison (2021) spin temperature studies were both carried out on samples of intervening H i absorbers, rather than the associated systems studied in this paper. While it remains plausible that changes in spin temperature influence the detection rate for H i absorption at different redshifts, further work on larger samples is needed to understand the physical processes by which this might occur.
7 Summary and conclusions
In this paper, we have presented the results of a search for associated H i absorption in the GAMA 09, 12, and 15 fields, using data from the FLASH pilot survey.
We compiled a sample of 326 targets at and detected two associated H i absorption lines, in SDSS J090331+010847 and SDSS J113622+004852.
Both these galaxies are massive (stellar mass M⊙ at ) and contain compact, peaked-spectrum radio sources. These are relatively faint radio sources, with flux densities of 55 and 171 mJy respectively at 855.5 MHz (63 and 155 mJy at 1.4 GHz). Both absorption lines have high optical depth, for SDSS J090331+010847 and (from 6 hours observation with SBID 13306) for SDSS J113622+004852, implying H i column densities above cm-2.
The integrated H i optical depth of 118 km s-1 for SDSS J090331+010847 is the highest ever measured for an associated H i absorption line beyond the local Universe, well exceeding the previous highest value of km s-1 measured by Chowdhury et al. (2020) for the source J02290053 at .
We used the ProSpect SED fitting code (Robotham et al., 2020) to model the past star-formation history and find that star-formation has been largely quenched in SDSS J090331+010847 (SFR M⊙ yr-1), while SDSS J113622+004852 continues to sustain a high star-formation rate (SFR M⊙ yr-1). Thus even in our current small sample we see a diversity of star-formation properties for the galaxies detected in H i absorption.
By combining our data with the results from other H i absorption searches at lower and higher redshift, we find a tendency for the detection rate for associated H i absorption (with ) to decrease towards higher redshift. Similar results have been found in other recent studies (e.g. Aditya & Kanekar, 2018b; Chowdhury et al., 2020), but further work and larger samples will be needed both to establish the statistical significance of this trend and to understand the physical processes driving it.
Acknowledgements
RZS thanks CSIRO for their hospitality during his stay in Australia and acknowledges support from a joint SKA PhD scholarship.
RZS and MFG are supported by the National Science Foundation of China (grant 11873073), Shanghai Pilot Program for Basic Research–Chinese Academy of Science, Shanghai Branch (JCYJ-SHFY-2021-013), and the science research grants from the China Manned Space Project with NO. CMSCSST-2021-A06. This work is supported by the Original Innovation Program of the Chinese Academy of Sciences (E085021002). RS acknowledges grant number 12073029 from the National Science Foundation of China.
Parts of this research were supported by the Australian Research Council Centre of Excellence for All Sky Astrophysics in 3 Dimensions (ASTRO 3D), through project number CE170100013.
The Australian SKA Pathfinder is part of the Australia Telescope National Facility (grid.421683.a) which is managed by CSIRO. Operation of ASKAP is funded by the Australian Government with support from the National Collaborative Research Infrastructure Strategy. ASKAP uses the resources of the Pawsey Supercomputing Centre. Establishment of ASKAP, the Murchison Radio-astronomy Observatory and the Pawsey Supercomputing Centre are initiatives of the Australian Government, with support from the Government of Western Australia and the Science and Industry Endowment Fund. We acknowledge the Wajarri Yamatji people as the traditional owners of the Observatory site.
This research has made use of the NASA/IPAC Extragalactic Database (NED), which is operated by the Jet Propulsion Laboratory, California Institute of Technology, under contract with the National Aeronautics and Space Administration; the data products from the Wide-field Infrared Survey Explorer, which is a joint project of the University of California, Los Angeles, and the Jet Propulsion Laboratory/California Institute of Technology, funded by the National Aeronautics and Space Administration; the VizieR catalogue access tool, CDS, Strasbourg, France (DOI: 10.26093/cds/vizier);
GAMA is a joint European-Australasian project based around a spectroscopic campaign using the Anglo-Australian Telescope. The GAMA input catalogue is based on data taken from the Sloan Digital Sky Survey and the UKIRT Infrared Deep Sky Survey. Complementary imaging of the GAMA regions is being obtained by a number of independent survey programmes including GALEX MIS, VST KiDS, VISTA VIKING, WISE, Herschel-ATLAS, GMRT and ASKAP providing UV to radio coverage. GAMA is funded by the STFC (UK), the ARC (Australia), the AAO, and the participating institutions. The GAMA website is http://www.gama-survey.org/ .
Funding for the Sloan Digital Sky Survey IV has been provided by the Alfred P. Sloan Foundation, the U.S. Department of Energy Office of Science, and the Participating Institutions. SDSS acknowledges support and resources from the Center for High-Performance Computing at the University of Utah. The SDSS web site is www.sdss.org.
SDSS is managed by the Astrophysical Research Consortium for the Participating Institutions of the SDSS Collaboration including the Brazilian Participation Group, the Carnegie Institution for Science, Carnegie Mellon University, Center for Astrophysics | Harvard & Smithsonian (CfA), the Chilean Participation Group, the French Participation Group, Instituto de Astrofísica de Canarias, The Johns Hopkins University, Kavli Institute for the Physics and Mathematics of the Universe (IPMU) / University of Tokyo, the Korean Participation Group, Lawrence Berkeley National Laboratory, Leibniz Institut für Astrophysik Potsdam (AIP), Max-Planck-Institut für Astronomie (MPIA Heidelberg), Max-Planck-Institut für Astrophysik (MPA Garching), Max-Planck-Institut für Extraterrestrische Physik (MPE), National Astronomical Observatories of China, New Mexico State University, New York University, University of Notre Dame, Observatório Nacional / MCTI, The Ohio State University, Pennsylvania State University, Shanghai Astronomical Observatory, United Kingdom Participation Group, Universidad Nacional Autónoma de México, University of Arizona, University of Colorado Boulder, University of Oxford, University of Portsmouth, University of Utah, University of Virginia, University of Washington, University of Wisconsin, Vanderbilt University, and Yale University.
The Legacy Surveys consist of three individual and complementary projects: the Dark Energy Camera Legacy Survey (DECaLS; Proposal ID #2014B-0404; PIs: David Schlegel and Arjun Dey), the Beijing-Arizona Sky Survey (BASS; NOAO Prop. ID #2015A-0801; PIs: Zhou Xu and Xiaohui Fan), and the Mayall z-band Legacy Survey (MzLS; Prop. ID #2016A-0453; PI: Arjun Dey). DECaLS, BASS and MzLS together include data obtained, respectively, at the Blanco telescope, Cerro Tololo Inter-American Observatory, NSF’s NOIRLab; the Bok telescope, Steward Observatory, University of Arizona; and the Mayall telescope, Kitt Peak National Observatory, NOIRLab. The Legacy Surveys project is honored to be permitted to conduct astronomical research on Iolkam Du’ag (Kitt Peak), a mountain with particular significance to the Tohono O’odham Nation.
NOIRLab is operated by the Association of Universities for Research in Astronomy (AURA) under a cooperative agreement with the National Science Foundation.
This project used data obtained with the Dark Energy Camera (DECam), which was constructed by the Dark Energy Survey (DES) collaboration. Funding for the DES Projects has been provided by the U.S. Department of Energy, the U.S. National Science Foundation, the Ministry of Science and Education of Spain, the Science and Technology Facilities Council of the United Kingdom, the Higher Education Funding Council for England, the National Center for Supercomputing Applications at the University of Illinois at Urbana-Champaign, the Kavli Institute of Cosmological Physics at the University of Chicago, Center for Cosmology and Astro-Particle Physics at the Ohio State University, the Mitchell Institute for Fundamental Physics and Astronomy at Texas A&M University, Financiadora de Estudos e Projetos, Fundacao Carlos Chagas Filho de Amparo, Financiadora de Estudos e Projetos, Fundacao Carlos Chagas Filho de Amparo a Pesquisa do Estado do Rio de Janeiro, Conselho Nacional de Desenvolvimento Cientifico e Tecnologico and the Ministerio da Ciencia, Tecnologia e Inovacao, the Deutsche Forschungsgemeinschaft and the Collaborating Institutions in the Dark Energy Survey. The Collaborating Institutions are Argonne National Laboratory, the University of California at Santa Cruz, the University of Cambridge, Centro de Investigaciones Energeticas, Medioambientales y Tecnologicas-Madrid, the University of Chicago, University College London, the DES-Brazil Consortium, the University of Edinburgh, the Eidgenossische Technische Hochschule (ETH) Zurich, Fermi National Accelerator Laboratory, the University of Illinois at Urbana-Champaign, the Institut de Ciencies de l’Espai (IEEC/CSIC), the Institut de Fisica d’Altes Energies, Lawrence Berkeley National Laboratory, the Ludwig Maximilians Universitat Munchen and the associated Excellence Cluster Universe, the University of Michigan, NSF’s NOIRLab, the University of Nottingham, the Ohio State University, the University of Pennsylvania, the University of Portsmouth, SLAC National Accelerator Laboratory, Stanford University, the University of Sussex, and Texas A&M University.
BASS is a key project of the Telescope Access Program (TAP), which has been funded by the National Astronomical Observatories of China, the Chinese Academy of Sciences (the Strategic Priority Research Program “The Emergence of Cosmological Structures” Grant # XDB09000000), and the Special Fund for Astronomy from the Ministry of Finance. The BASS is also supported by the External Cooperation Program of Chinese Academy of Sciences (Grant # 114A11KYSB20160057), and Chinese National Natural Science Foundation (Grant # 11433005).
The Legacy Survey team makes use of data products from the Near-Earth Object Wide-field Infrared Survey Explorer (NEOWISE), which is a project of the Jet Propulsion Laboratory/California Institute of Technology. NEOWISE is funded by the National Aeronautics and Space Administration.
The Legacy Surveys imaging of the DESI footprint is supported by the Director, Office of Science, Office of High Energy Physics of the U.S. Department of Energy under Contract No. DE-AC02-05CH1123, by the National Energy Research Scientific Computing Center, a DOE Office of Science User Facility under the same contract; and by the U.S. National Science Foundation, Division of Astronomical Sciences under Contract No. AST-0950945 to NOAO.
We thank Joe Callingham and Tim Shimwell for examining LOFAR images of the field around SDSS J090331+010847 and providing the 144 MHz upper limit plotted in Fig. 10.
We thank the anonymous referee for helpful comments which have improved the paper.
Data availability
The data underlying this article will be shared on reasonable request to the corresponding author.
References
- Aditya (2019) Aditya J. N. H. S., 2019, MNRAS, 482, 5597
- Aditya & Kanekar (2018a) Aditya J. N. H. S., Kanekar N., 2018a, MNRAS, 473, 59
- Aditya & Kanekar (2018b) Aditya J. N. H. S., Kanekar N., 2018b, MNRAS, 481, 1578
- Aditya et al. (2016) Aditya J. N. H. S., Kanekar N., Kurapati S., 2016, MNRAS, 455, 4000
- Aditya et al. (2017) Aditya J. N. H. S., Kanekar N., Prochaska J. X., Day B., Lynam P., Cruz J., 2017, MNRAS, 465, 5011
- Aditya et al. (2021) Aditya J. N. H. S., Jorgenson R., Joshi V., Singh V., An T., Chandola Y., 2021, MNRAS, 500, 998
- Alam et al. (2015) Alam S., et al., 2015, ApJS, 219, 12
- Allison (2021) Allison J. R., 2021, MNRAS, 503, 985
- Allison et al. (2012a) Allison J. R., Sadler E. M., Whiting M. T., 2012a, Publ. Astron. Soc. Australia, 29, 221
- Allison et al. (2012b) Allison J. R., et al., 2012b, MNRAS, 423, 2601
- Allison et al. (2014) Allison J. R., Sadler E. M., Meekin A. M., 2014, MNRAS, 440, 696
- Allison et al. (2015) Allison J. R., et al., 2015, MNRAS, 453, 1249
- Allison et al. (2016) Allison J. R., et al., 2016, Astronomische Nachrichten, 337, 175
- Allison et al. (2017) Allison J. R., et al., 2017, MNRAS, 465, 4450
- Allison et al. (2020) Allison J. R., et al., 2020, MNRAS, 494, 3627
- Allison et al. (2022) Allison J. R., et al., 2022, Publ. Astron. Soc. Australia, 39, e010
- Araya et al. (2010) Araya E. D., Rodríguez C., Pihlström Y., Taylor G. B., Tremblay S., Vermeulen R. C., 2010, AJ, 139, 17
- Baan & Haschick (1981) Baan W. A., Haschick A. D., 1981, ApJ, 243, L143
- Bahcall & Ekers (1969) Bahcall J. N., Ekers R. D., 1969, ApJ, 157, 1055
- Baldry et al. (2014) Baldry I. K., et al., 2014, MNRAS, 441, 2440
- Baldry et al. (2018) Baldry I. K., et al., 2018, MNRAS, 474, 3875
- Bellstedt et al. (2020) Bellstedt S., et al., 2020, MNRAS, 496, 3235
- Bellstedt et al. (2021) Bellstedt S., et al., 2021, MNRAS, 503, 3309
- Bianchi et al. (2017) Bianchi L., Shiao B., Thilker D., 2017, ApJS, 230, 24
- Brown et al. (2001) Brown L. D., Cai T. T., DasGupta A., 2001, Statistical Science, 16, 101
- Callingham et al. (2015) Callingham J. R., et al., 2015, ApJ, 809, 168
- Carilli et al. (2007) Carilli C. L., Wang R., van Hoven M. B., Dwarakanath K., Chengalur J. N., Wyithe S., 2007, AJ, 133, 2841
- Catinella et al. (2018) Catinella B., et al., 2018, MNRAS, 476, 875
- Chandola et al. (2011) Chandola Y., Sirothia S. K., Saikia D. J., 2011, MNRAS, 418, 1787
- Ching et al. (2017) Ching J. H. Y., et al., 2017, MNRAS, 464, 1306
- Chippendale et al. (2015) Chippendale A. P., et al., 2015, in 2015 International Conference on Electromagnetics in Advanced Applications (ICEAA. pp 541–544 (arXiv:1509.00544), doi:10.1109/ICEAA.2015.7297174
- Chowdhury et al. (2020) Chowdhury A., Kanekar N., Chengalur J. N., 2020, ApJ, 900, L30
- Chung et al. (2009) Chung A., van Gorkom J. H., Kenney J. D. P., Crowl H., Vollmer B., 2009, AJ, 138, 1741
- Condon et al. (1998) Condon J. J., Cotton W. D., Greisen E. W., Yin Q. F., Perley R. A., Taylor G. B., Broderick J. J., 1998, AJ, 115, 1693
- Conway (1999) Conway J. E., 1999, New Astron. Rev., 43, 509
- Crighton et al. (2015) Crighton N. H. M., et al., 2015, MNRAS, 452, 217
- Curran & Duchesne (2018) Curran S. J., Duchesne S. W., 2018, MNRAS, 476, 3580
- Curran & Whiting (2012) Curran S. J., Whiting M. T., 2012, ApJ, 759, 117
- Curran et al. (2006) Curran S. J., Whiting M. T., Murphy M. T., Webb J. K., Longmore S. N., Pihlström Y. M., Athreya R., Blake C., 2006, MNRAS, 371, 431
- Curran et al. (2008) Curran S. J., Whiting M. T., Wiklind T., Webb J. K., Murphy M. T., Purcell C. R., 2008, MNRAS, 391, 765
- Curran et al. (2011) Curran S. J., et al., 2011, MNRAS, 413, 1165
- Curran et al. (2013a) Curran S. J., Whiting M. T., Sadler E. M., Bignell C., 2013a, MNRAS, 428, 2053
- Curran et al. (2013b) Curran S. J., Whiting M. T., Tanna A., Sadler E. M., Pracy M. B., Athreya R., 2013b, MNRAS, 429, 3402
- Curran et al. (2016) Curran S. J., Allison J. R., Whiting M. T., Sadler E. M., Combes F., Pracy M. B., Bignell C., Athreya R., 2016, MNRAS, 457, 3666
- Curran et al. (2017) Curran S. J., Hunstead R. W., Johnston H. M., Whiting M. T., Sadler E. M., Allison J. R., Bignell C., 2017, MNRAS, 470, 4600
- Cutri et al. (2013) Cutri R. M., et al., 2013, Explanatory Supplement to the AllWISE Data Release Products, Explanatory Supplement to the AllWISE Data Release Products
- DeBoer et al. (2009) DeBoer D. R., et al., 2009, IEEE Proceedings, 97, 1507
- Dey et al. (2019) Dey A., et al., 2019, AJ, 157, 168
- Dressel et al. (1983) Dressel L. L., Bania T. M., Davis M. M., 1983, ApJ, 266, L97
- Driver et al. (2011) Driver S. P., et al., 2011, MNRAS, 413, 971
- Driver et al. (2018) Driver S. P., et al., 2018, MNRAS, 475, 2891
- Dutta et al. (2019) Dutta R., Srianand R., Gupta N., 2019, MNRAS, 489, 1099
- Dutta et al. (2020) Dutta R., Raghunathan S., Gupta N., Joshi R., 2020, MNRAS, 491, 838
- Emonts et al. (2010) Emonts B. H. C., et al., 2010, MNRAS, 406, 987
- Geréb et al. (2014) Geréb K., Morganti R., Oosterloo T. A., 2014, A&A, 569, A35
- Geréb et al. (2015) Geréb K., Maccagni F. M., Morganti R., Oosterloo T. A., 2015, A&A, 575, A44
- Glowacki et al. (2017) Glowacki M., et al., 2017, MNRAS, 467, 2766
- Glowacki et al. (2019) Glowacki M., et al., 2019, MNRAS, 489, 4926
- Gordon et al. (2020) Gordon Y. A., et al., 2020, Research Notes of the American Astronomical Society, 4, 175
- Grasha et al. (2019) Grasha K., Darling J., Bolatto A., Leroy A. K., Stocke J. T., 2019, ApJS, 245, 3
- Griffith et al. (1995) Griffith M. R., Wright A. E., Burke B. F., Ekers R. D., 1995, ApJS, 97, 347
- Gupta et al. (2006) Gupta N., Salter C. J., Saikia D. J., Ghosh T., Jeyakumar S., 2006, MNRAS, 373, 972
- Gupta et al. (2012) Gupta N., Srianand R., Petitjean P., Bergeron J., Noterdaeme P., Muzahid S., 2012, A&A, 544, A21
- Gupta et al. (2021) Gupta N., et al., 2021, ApJS, 255, 28
- Hale et al. (2021) Hale C. L., et al., 2021, arXiv e-prints, p. arXiv:2109.00956
- Heckman & Best (2014) Heckman T. M., Best P. N., 2014, ARA&A, 52, 589
- Hopkins & Beacom (2006) Hopkins A. M., Beacom J. F., 2006, ApJ, 651, 142
- Hotan et al. (2021) Hotan A. W., et al., 2021, Publ. Astron. Soc. Australia, 38, e009
- Hurley-Walker et al. (2017) Hurley-Walker N., et al., 2017, MNRAS, 464, 1146
- Intema et al. (2017) Intema H. T., Jagannathan P., Mooley K. P., Frail D. A., 2017, A&A, 598, A78
- Ishwara-Chandra et al. (2003) Ishwara-Chandra C. H., Dwarakanath K. S., Anantharamaiah K. R., 2003, Journal of Astrophysics and Astronomy, 24, 37
- Johnston et al. (2007) Johnston S., et al., 2007, Publ. Astron. Soc. Australia, 24, 174
- Johnston et al. (2008) Johnston S., et al., 2008, Experimental Astronomy, 22, 151
- Kanekar & Chengalur (2008) Kanekar N., Chengalur J. N., 2008, MNRAS, 384, L6
- Kanekar et al. (2009) Kanekar N., Prochaska J. X., Ellison S. L., Chengalur J. N., 2009, MNRAS, 396, 385
- Kanekar et al. (2014) Kanekar N., et al., 2014, MNRAS, 438, 2131
- Kass & Raftery (1995) Kass R. E., Raftery A. E., 1995, Journal of the american statistical association, 90, 773
- Knapp & Kerr (1974) Knapp G. R., Kerr F. J., 1974, A&A, 35, 361
- Koribalski (2012) Koribalski B. S., 2012, Publ. Astron. Soc. Australia, 29, 359
- Koribalski et al. (2020) Koribalski B. S., et al., 2020, Ap&SS, 365, 118
- Lang et al. (2003) Lang R. H., et al., 2003, MNRAS, 342, 738
- Lee-Waddell et al. (2012) Lee-Waddell K., Spekkens K., Haynes M. P., Stierwalt S., Chengalur J., Chandra P., Giovanelli R., 2012, MNRAS, 427, 2314
- Lee et al. (2013) Lee K.-G., et al., 2013, AJ, 145, 69
- Liske et al. (2015) Liske J., et al., 2015, MNRAS, 452, 2087
- Maccagni et al. (2014) Maccagni F. M., Morganti R., Oosterloo T. A., Mahony E. K., 2014, A&A, 571, A67
- Maccagni et al. (2017) Maccagni F. M., Morganti R., Oosterloo T. A., Geréb K., Maddox N., 2017, A&A, 604, A43
- Mahony et al. (2013) Mahony E. K., Morganti R., Emonts B. H. C., Oosterloo T. A., Tadhunter C., 2013, MNRAS, 435, L58
- Mahony et al. (2021) Mahony E. K., et al., 2021, arXiv e-prints, p. arXiv:2110.09737
- Mauch et al. (2013) Mauch T., Klöckner H.-R., Rawlings S., Jarvis M., Hardcastle M. J., Obreschkow D., Saikia D. J., Thompson M. A., 2013, MNRAS, 435, 650
- McConnell et al. (2016) McConnell D., et al., 2016, Publ. Astron. Soc. Australia, 33, e042
- McConnell et al. (2020) McConnell D., et al., 2020, Publ. Astron. Soc. Australia, 37, e048
- Ménard & Chelouche (2009) Ménard B., Chelouche D., 2009, MNRAS, 393, 808
- Mhaskey et al. (2020) Mhaskey M., Paul S., Gupta N., Mukherjee D., Gopal-Krishna 2020, A&A, 643, A174
- Mirabel & Sanders (1989) Mirabel I. F., Sanders D. B., 1989, ApJ, 340, L53
- Moore et al. (1999) Moore C. B., Carilli C. L., Menten K. M., 1999, ApJ, 510, L87
- Morganti & Oosterloo (2018) Morganti R., Oosterloo T., 2018, A&ARv, 26, 4
- Morganti et al. (2002) Morganti R., Oosterloo T. A., Tinti S., Tadhunter C. N., Wills K. A., van Moorsel G., 2002, A&A, 387, 830
- Morganti et al. (2003) Morganti R., Oosterloo T. A., Emonts B. H. C., van der Hulst J. M., Tadhunter C. N., 2003, ApJ, 593, L69
- Morganti et al. (2005) Morganti R., Tadhunter C. N., Oosterloo T. A., 2005, A&A, 444, L9
- Morganti et al. (2013) Morganti R., Fogasy J., Paragi Z., Oosterloo T., Orienti M., 2013, Science, 341, 1082
- Moss et al. (2017) Moss V. A., et al., 2017, MNRAS, 471, 2952
- Murray et al. (2018) Murray C. E., Stanimirović S., Goss W. M., Heiles C., Dickey J. M., Babler B., Kim C.-G., 2018, ApJS, 238, 14
- Murthy et al. (2021) Murthy S., Morganti R., Oosterloo T., Maccagni F. M., 2021, A&A, 654, A94
- Murthy et al. (2022) Murthy S., Morganti R., Kanekar N., Oosterloo T., 2022, arXiv e-prints, p. arXiv:2201.06625
- Noterdaeme et al. (2012) Noterdaeme P., et al., 2012, A&A, 547, L1
- Prescott et al. (2016) Prescott M., et al., 2016, MNRAS, 457, 730
- Reeves et al. (2015) Reeves S. N., Sadler E. M., Allison J. R., Koribalski B. S., Curran S. J., Pracy M. B., 2015, MNRAS, 450, 926
- Reeves et al. (2016) Reeves S. N., et al., 2016, MNRAS, 457, 2613
- Reynolds (1994) Reynolds J., 1994, AT Technical Document AT/39.3/040
- Rhee et al. (2018) Rhee J., Lah P., Briggs F. H., Chengalur J. N., Colless M., Willner S. P., Ashby M. L. N., Le Fèvre O., 2018, MNRAS, 473, 1879
- Robotham et al. (2018) Robotham A. S. G., Davies L. J. M., Driver S. P., Koushan S., Taranu D. S., Casura S., Liske J., 2018, MNRAS, 476, 3137
- Robotham et al. (2020) Robotham A. S. G., Bellstedt S., Lagos C. d. P., Thorne J. E., Davies L. J., Driver S. P., Bravo M., 2020, MNRAS, 495, 905
- Rodriguez et al. (2009) Rodriguez C., Taylor G. B., Zavala R. T., Pihlström Y. M., Peck A. B., 2009, ApJ, 697, 37
- Röttgering et al. (1999) Röttgering H., de Bruyn G., Pentericci L., 1999, in Röttgering H. J. A., Best P. N., Lehnert M. D., eds, The Most Distant Radio Galaxies. p. 113
- Sadler et al. (2020) Sadler E. M., et al., 2020, MNRAS, 499, 4293
- Schlegel et al. (1998) Schlegel D. J., Finkbeiner D. P., Davis M., 1998, ApJ, 500, 525
- Schulz et al. (2021) Schulz R., Morganti R., Nyland K., Paragi Z., Mahony E. K., Oosterloo T., 2021, A&A, 647, A63
- Snellen et al. (1998) Snellen I. A. G., Schilizzi R. T., de Bruyn A. G., Miley G. K., Rengelink R. B., Roettgering H. J., Bremer M. N., 1998, A&AS, 131, 435
- Srianand et al. (2008) Srianand R., Gupta N., Petitjean P., Noterdaeme P., Saikia D. J., 2008, MNRAS, 391, L69
- Stern et al. (2012) Stern D., et al., 2012, ApJ, 753, 30
- Struve & Conway (2010) Struve C., Conway J. E., 2010, A&A, 513, A10
- Taylor (1996) Taylor G. B., 1996, ApJ, 470, 394
- Taylor et al. (1999) Taylor G. B., O’Dea C. P., Peck A. B., Koekemoer A. M., 1999, ApJ, 512, L27
- Teng et al. (2013) Teng S. H., Veilleux S., Baker A. J., 2013, ApJ, 765, 95
- Thorne et al. (2021) Thorne J. E., et al., 2021, MNRAS, 505, 540
- Tingay et al. (2016) Tingay S. J., Hancock P. J., Wayth R. B., Intema H., Jagannathan P., Mooley K., 2016, AJ, 152, 82
- Uson et al. (1991) Uson J. M., Bagri D. S., Cornwell T. J., 1991, Phys. Rev. Lett., 67, 3328
- Vermeulen et al. (2003) Vermeulen R. C., et al., 2003, A&A, 404, 861
- White et al. (1997) White R. L., Becker R. H., Helfand D. J., Gregg M. D., 1997, ApJ, 475, 479
- Whiting (2020) Whiting M. T., 2020, in Ballester P., Ibsen J., Solar M., Shortridge K., eds, Astronomical Society of the Pacific Conference Series Vol. 522, Astronomical Data Analysis Software and Systems XXVII. p. 469
- Whiting & Humphreys (2012) Whiting M., Humphreys B., 2012, Publ. Astron. Soc. Australia, 29, 371
- Winkel et al. (2016) Winkel B., Kerp J., Flöer L., Kalberla P. M. W., Ben Bekhti N., Keller R., Lenz D., 2016, A&A, 585, A41
- Wright et al. (2010) Wright E. L., et al., 2010, AJ, 140, 1868
- Yan et al. (2016) Yan T., Stocke J. T., Darling J., Momjian E., Sharma S., Kanekar N., 2016, AJ, 151, 74
- Yoon et al. (2017) Yoon H., Chung A., Smith R., Jaffé Y. L., 2017, ApJ, 838, 81
- de Waard et al. (1985) de Waard G. J., Strom R. G., Miley G. K., 1985, A&A, 145, 479
- van Breugel et al. (1998) van Breugel W. J. M., Stanford S. A., Spinrad H., Stern D., Graham J. R., 1998, ApJ, 502, 614
- van Driel et al. (2016) van Driel W., et al., 2016, A&A, 595, A118
- van Gorkom et al. (1989) van Gorkom J. H., Knapp G. R., Ekers R. D., Ekers D. D., Laing R. A., Polk K. S., 1989, AJ, 97, 708
- van Langevelde et al. (2000) van Langevelde H. J., Pihlström Y. M., Conway J. E., Jaffe W., Schilizzi R. T., 2000, A&A, 354, L45
Appendix A Catalogue of extended sources that have been excluded from our target sample
| Island ID | Island coordinates | Comp_ID | Component coordinates | Flux density | SDSS ID | Redshift | In Ching et al. (2017) | Sep. | ||
|---|---|---|---|---|---|---|---|---|---|---|
| RA [J2000] | Dec. [J2000] | RA [J2000] | Dec. [J2000] | mJy | arcsec | |||||
| [1] | [2] | [3] | [4] | [5] | [6] | [7] | [8] | [9] | [10] | [11] |
| SB13285_island_811 | 08:35:33.66 | -00:07:29.35 | a | 08:35:35.37 | -00:07:42.04 | 12 | J083533.58-000733.19 | 0.470s | yes | 4.02 |
| SB13285_island_1121 | 08:36:20.94 | 01:35:30.62 | a | 08:36:20.70 | 01:35:22.21 | 10.1 | J083621.01+013530.37 | 0.640s | no | 1.14 |
| SB13285_island_194 | 08:38:20.99 | 02:35:11.74 | a | 08:38:19.94 | 02:35:23.73 | 64.4 | J083820.82+023516.10 | 0.428g | no | 5.05 |
| SB13285_island_194 | 08:38:20.99 | 02:35:11.74 | b | 08:38:22.26 | 02:34:57.32 | 52.2 | J083820.82+023516.10 | 0.428g | no | 5.05 |
| SB13285_island_124 | 08:38:23.22 | 01:50:08.04 | a | 08:38:22.80 | 01:50:18.54 | 85 | J083823.10+015012.46 | 0.559s | no | 4.74 |
| SB13285_island_124 | 08:38:23.22 | 01:50:08.04 | d | 08:38:23.38 | 01:50:18.71 | 14.6 | J083823.10+015012.46 | 0.559s | no | 4.74 |
| SB13285_island_124 | 08:38:23.22 | 01:50:08.04 | c | 08:38:23.41 | 01:50:02.10 | 26.7 | J083823.10+015012.46 | 0.559s | no | 4.74 |
| SB13285_island_124 | 08:38:23.22 | 01:50:08.04 | b | 08:38:23.71 | 01:49:51.58 | 57.7 | J083823.10+015012.46 | 0.559s | no | 4.74 |
| SB13285_island_579 | 08:43:25.20 | 02:41:13.64 | b | 08:43:24.51 | 02:41:04.09 | 16.9 | J084325.19+024112.07 | 0.540s | yes | 1.59 |
| SB13285_island_579 | 08:43:25.20 | 02:41:13.64 | a | 08:43:25.80 | 02:41:21.92 | 22.2 | J084325.19+024112.07 | 0.540s | yes | 1.59 |
| SB13285_island_480 | 08:44:26.77 | 02:27:57.03 | b | 08:44:26.19 | 02:28:06.79 | 17.7 | J084426.64+022757.28 | 0.450s | no | 2.09 |
| SB13285_island_480 | 08:44:26.77 | 02:27:57.03 | a | 08:44:27.25 | 02:27:51.80 | 18 | J084426.64+022757.28 | 0.450s | no | 2.09 |
| SB13285_island_763 | 08:44:34.92 | 03:10:20.45 | a | 08:44:34.89 | 03:10:20.49 | 16.6 | J084434.86+031020.36 | 0.723s | no | 0.87 |
| SB13285_island_96 | 08:48:13.79 | 01:15:11.40 | b | 08:48:13.12 | 01:14:11.34 | 56.8 | J084813.71+011502.36 | 0.570c | yes | 9.12 |
| SB13285_island_96 | 08:48:13.79 | 01:15:11.40 | d | 08:48:13.39 | 01:14:34.35 | 36 | J084813.71+011502.36 | 0.570c | yes | 9.12 |
| SB13285_island_96 | 08:48:13.79 | 01:15:11.40 | e | 08:48:13.98 | 01:15:34.50 | 25.6 | J084813.71+011502.36 | 0.570c | yes | 9.12 |
| SB13285_island_96 | 08:48:13.79 | 01:15:11.40 | c | 08:48:14.29 | 01:16:00.44 | 45.5 | J084813.71+011502.36 | 0.570c | yes | 9.12 |
| SB13285_island_96 | 08:48:13.79 | 01:15:11.40 | a | 08:48:14.47 | 01:16:06.24 | 83.6 | J084813.71+011502.36 | 0.570c | yes | 9.12 |
| SB13285_island_604 | 08:48:27.03 | 00:01:40.67 | b | 08:48:26.44 | 00:01:36.42 | 18.1 | J084826.98+000141.36 | 0.569s | yes | 1.01 |
| SB13285_island_604 | 08:48:27.03 | 00:01:40.67 | a | 08:48:27.53 | 00:01:43.95 | 20.7 | J084826.98+000141.36 | 0.569s | yes | 1.01 |
| …… | ||||||||||
sredshift from SDSS. gredshift from GAMA. nredshift from NED. c redshift from Ching et al. (2017).