The X-ray emission of Be+stripped star binaries††thanks: Based on spectra obtained with XMM-Newton, Swift, and Chandra
Abstract
Using observations from Chandra, Swift and XMM-Newton, we investigate the high-energy properties of all known (18) Be+sdO systems as well as 7 additional Be binaries suspected to harbour stripped stars. The observed X-ray properties are found to be similar to those observed for other Be samples. The vast majority of these systems (15 out of 25) display very faint (and soft) X-ray emission, and six others are certainly not bright X-ray sources. Only two systems display Cas characteristics (i.e. bright and hard X-rays), and one of them is a new detection: HD 37202 ( Tau). It presents an extremely hard spectrum, due to a combination of high temperature and high absorption (possibly due to its high inclination). In parallel, it may be noted that the previously reported cyclic behaviour of this Be star has disappeared in recent years. Instead, shorter cycles and symmetric line profiles are observed for the H line. It had been recently suggested that the peculiar X-ray emissions observed in Cas stars could arise from a collision between the disk of a Be star and the wind of its hot, stripped-star companion. The small fraction of Cas analogs in this sample, as well as the properties of the known companions of the Cas cases (low mass or not extremely hot, contrary to predictions), combined to the actual stripped-star and colliding-wind empirical knowledge, make the disk-wind collision an unlikely scenario to explain the Cas phenomenon.
keywords:
stars: early-type – stars: massive – stars: emission-line,Be – binaries: general – X-rays: stars1 Introduction
While nearly all types of stars have been detected to emit X-rays, the high-energy emissions from most massive stars could be linked up to now to a single cause: their stellar winds. Indeed, the line-driven winds are intrinsically unstable, so shocks naturally arise between different wind parcels, leading to X-ray emission (Feldmeier et al., 1997). Such X-rays have been recorded for tens of OB stars and their properties are well known (e.g. Berghoefer et al., 1996; Oskinova, 2005; Sana et al., 2006; Nazé et al., 2011; Rauw et al., 2015b): they are soft ( keV on average) and rather faint (). In addition, when a strong dipolar magnetic field is present, as occurs in 7% of OB stars (Fossati et al., 2015; Wade et al., 2016), it channels the wind flows from both stellar hemispheres towards the magnetic equator where they collide, generating additional X-rays (for a review, see ud-Doula & Nazé, 2016). Also, the winds of the two components in a massive binary system can collide, which may generate X-rays in some systems (for a review, see Rauw & Nazé, 2016). In both cases, this additional X-ray production leads to an enhanced luminosity (up to ) with an emission often harder in nature.
Up to now, this general portrait did not include the peculiar Cas category. Stars classified as Cas analogs all belong to the Oe/Be category, i.e. they display Balmer emission lines associated with the presence of a Keplerian circumstellar decretion disk. Furthermore, they all emit peculiar X-rays, at odds with the properties recorded for other OB stars. Indeed, the X-ray emission comes from very hot ( keV) plasma, is ‘flaring’ on very short timescales, and appears very bright (, of –6.2 to –4) although less extreme in character than for Be X-ray binaries (Smith et al., 2016; Nazé & Motch, 2018; Nazé et al., 2020).
Recently, Langer et al. (2020) proposed that this Cas emission too was linked to stellar winds, although not those of the Be stars. These authors advocated for an X-ray generation in a collision between the Be disk and the wind of a stripped-star companion. Such a pair arises following binary interactions in many current models aimed at explaining the origin of Be stars. In this context, the companion was initially the most massive star of the system but, as it evolved, it transferred mass to the other star. The gain in mass and angular momentum for the latter object following the interaction transforms it into a Be star while the companion, stripped of its envelope (which explains the nickname “stripped-star”), is burning helium in its core (explaining the alternative name of “helium star”). The hot surface of the companion, combined to its low luminosity, makes it appear as a O-type subdwarf (sdO) or, for the rare cases with very high mass-loss rates, with a quasi Wolf-Rayet (qWR) spectrum (Götberg et al., 2018).
| HD | Alt. name | sp. type(Be) | (Be) | (Be) | (Be) | (comp) | (comp) | (comp) | ||||||
|---|---|---|---|---|---|---|---|---|---|---|---|---|---|---|
| (pc) | (kK) | (R⊙) | (M⊙) | (Be) | (d) | (∘) | (kK) | (R⊙) | (M⊙) | (comp) | ||||
| Confirmed Be+sdO sample | ||||||||||||||
| HD 10516 | Per | B1.5Vem15 | 1848 | 0.162t13 | 29.3m15 | 4.60.4m15 | 9.60.3m15 | 4.160.04 | 126.6982m15 | 77.6m15 | 53m15 | 0.930.09m15 | 1.20.2m15 | 3.790.13m15 |
| HD 29441 | V1150 Tau | B2.5Vnew21 | 62217 | 0.198w21 | 20.35w21 | 4.510.32w21 | 3.470.02 | 40w21 | 0.240.03w21 | 2.11 | ||||
| HD 41335 | HR2142 | B1.5IV-Vep16 | 50761 | 0.1s | 21p16 | 5p16 | 4.170.10 | 80.913p16 | 85p16 | 0.13p16 | 0.7p16 | 1.7p16 | ||
| HD 43544 | HR2249 | B3Vw21 | 3076 | 0.155w21 | 21.5w21 | 4.340.38w21 | 8.5w21 | 3.550.02 | 38.2w21 | 0.500.08w21 | 2.68 | |||
| HD 51354 | QY Gem | B3Vew21 | 54017 | 0.172w21 | 20w21 | 4.520.29w21 | 3.490.03 | 43.5w21 | 0.420.08w21 | 2.75 | ||||
| HD 55606 | B2Vnnpew21 | 95737 | 0.22w21 | 27.35w21 | 3.520.20w21 | 5.97-6.55c18 | 3.600.03 | 93.76c18 | 75-85c18 | 40.9w21 | 0.270.04w21 | 0.83-0.9c18 | 2.27 | |
| HD 58978 | FY CMa | B0.5IVew18 | 55822 | 0.14p08 | 27.5p08 | 6.8 (5.3-9.7)p08 | 10-13p08 | 4.430.03 | 37.255p08 | 66p08 | 45p08 | 0.81 (0.6-1.2)p08 | 1.1-1.5p08 | 3.38 |
| HD 60855 | V378 Pup | B3IVw21 | 47117 | 0.204w21 | 20w21 | 8.040.62w21 | 3.990.03 | 42w21 | 0.490.07w21 | 2.83 | ||||
| HD 113120 | LS Mus | B2IVnew21 | 42415 | 0.176w21 | 22.8w21 | 5.681.09w21 | 3.860.03 | 45w21 | 0.410.14w21 | 2.80 | ||||
| HD 137387 | kap01 Aps | B2Vnpew21 | 3228 | 0.125w21 | 23.95w21 | 5.380.29w21 | 3.830.02 | 40w21 | 0.430.06w21 | 2.64 | ||||
| HD 152478 | V846 Ara | B3Vnpew21 | 2985 | 0.252w21 | 19.8w21 | 4.070.19w21 | 3.390.01 | 42w21 | 0.260.04w21 | 2.28 | ||||
| HD 157042 | Ara | B2.5IVew21 | 2797 | 0.187w21 | 25.86w21 | 5.790.42w21 | 3.950.02 | 33.8w21 | 0.580.09w21 | 2.60 | ||||
| HD 194335 | V2119 Cyg | B2IIIew21 | 3648 | 0.122w21 | 25.6w21 | 5.130.34w21 | 8.650.35k22 | 3.830.02 | 63.146k22 | 49.4k22 | 43.5w21 | 0.510.07w21 | 1.620.28k22 | 2.92 |
| HD 200120 | 59 Cyg | B1Vew18 | 41459 | 0.041s | 21.8p13 | 6.7p13 | 6.3-9.4p13 | 4.140.12 | 28.1871p13 | 60-80p13 | 52.1p13 | 0.41p13 | 0.62-0.91p13 | 3.00.1p13 |
| HD 200310 | 60 Cyg | B1Vew18 | 37518 | 0.036s | 27w17 | 5.00.3k22 | 7.31.1k22 | 3.990.04 | 147.68k22 | 83.4k22 | 42w17 | 0.465w17,k22 | 1.20.2k22 | 2.78 |
| Remaining Wang et al. (2018) systems | ||||||||||||||
| HD 157832 | V750 Ara | B1.5Vew21 | 97249 | 0.229w21 | 25w21 | 10.710.95w21 | 4.490.04 | 45w21 | 0.33w21 | 2.61w21 | ||||
| HD 191610 | 28 Cyg | B3IVew21 | 2557 | 0.182w21 | 20.47w21 | 5.890.37w21 | 3.760.02 | 246:k22 | 118k22 | 45w21 | 0.26w21 | 2.39w21 | ||
| HD 214168 | 8 Lac A | B1IVew21 | 52027 | 0.025w21 | 27.38w21 | 5.270.98w21 | 4.170.05 | 45w21 | 0.37w21 | 2.71w21 | ||||
| Other Be binaries | ||||||||||||||
| HD 37202 | Tau | B1IVe | 1366 | 0.044t13 | 19.3c19 | 6.1c19 | 11r09 | 3.750.04 | 132.987r09 | 60-90r09 | 0.87-1.02r09 | |||
| ALS 8775 | B3Ves20 | 2108175 | 0.397i20 | 18s20 | 3.7s20 | 72s20 | 3.100.07 | 78.7999s20 | 39s20 | 12.7s20 | 5.3s20 | 1.5s20 | 2.8s20 | |
| HD 63462 | o Pup | B1IV:nnek12 | 35522 | 0.022s | 4.320.05 | 28.903k12 | 0.064 x m(be)k12 | |||||||
| HD 68980 | MX Pup | B1.5IIIc02 | 40915 | 0.025s | 25.1c19 | 8.6c19 | 15c02 | 4.240.03 | 5.1526c02 | 5-50c02 | 0.6-6.6c02 | |||
| HD 148184 | Oph | B2Vne | 1534 | 0.354t13 | 20.9t08 | 5.8t08 | 10.9t08 | 3.750.02 | 34.1h87/138.8a78 | 20h87 | 3.8h87 | |||
| HD 161306 | B0:nek14 | 4515 | 0.47s | 3.560.01 | 99.9k14 | 0.0567 x m(be)k14 | ||||||||
| HD 167128 | HR6819 | B2.5Veb20 | 36817 | 0.089s | 20b20 | 4.20.8b20 | 72b20 | 3.770.04 | 40.335b20 | 32b20 | 16b20 | 4.80.4b20 | 0.460.26b20 | 3.120.10b20 |
References: a78 Abt & Levy (1978), b20 Bodensteiner et al. (2020), c02 Carrier et al. (2002), c18 Chojnowski et al. (2018), c19 (Cochetti et al., 2019), h87 Harmanec (1987), i20 Irrgang et al. (2020), k12 Koubský et al. (2012), k14 Koubský et al. (2014), k22 Klement et al. (2022), m15 Mourard et al. (2015), p08 Peters et al. (2008), p13 Peters et al. (2013), p16 Peters et al. (2016), r09 Ruždjak et al. (2009), s20 Shenar et al. (2020), s Stilism (Lallement et al. 2014 and https://stilism.obspm.fr/), t08 Tycner et al. (2008), t13 Touhami et al. (2013), w17 Wang et al. (2017), w21 (Wang et al., 2021) and references therein. When no reference for spectral type is provided, that coming from Simbad is used. If the distance used in the radius reference is different from the one adopted here, a scaling was made. Note that the errors for bolometric luminosities reflect only the errors on the distances.
Massive stars often lie in binary systems and Cas are no exception. Indeed, two Cas stars have long been known to lie in a binary system: Cas (Harmanec et al., 2000) and Aqr (Bjorkman et al., 2002). The multiplicity of other Cas analogs has been recently studied (Nazé et al., 2022a). In total, orbits could be derived in eight cases (out of 25 Cas objects) and five additional stars show hints of binarity. The remaining Be stars were either too faint or had too variable line profiles to study binarity signatures. The observed properties of the Cas analogs (long periods and small velocity amplitudes) are similar to those seen in other Be binaries and point towards companions with low masses. However, their exact nature could not yet be determined: white dwarfs, neutron stars, late-type non-degenerate stars, and stripped stars have all been proposed at some point.
Even though the presence of stripped stars in some Cas analogs remains circumstantial, there are several known cases of Be stars with a stripped-star companion (called Be+sdO or BeHeB). Such companions were detected thanks to their high temperature, which gives them an apparent spectral type O. The high temperature also leads to a strong UV emission. The first cases were reported in analyses of individual systems: HD 10516 ( Per, Gies et al. 1998; Mourard et al. 2015), HD 58978 (FY CMa, Peters et al. 2008), HD 41335 (HR2142, Peters et al. 2016), HD 200120 (59 Cyg, Peters et al. 2013), and HD 200310 (60 Cyg, Koubský et al. 2000; Wang et al. 2017). Then a general search in IUE data detected twelve additional cases (Wang et al., 2018). Follow-up HST spectroscopy confirmed the presence of a stripped companion to nine of these, with an additional case not previously studied (Wang et al., 2021). The three unconfirmed cases would be analogs to HD 41335, where the signature of the stripped star was detected only at some orbital phases. This suggests that the stripped companion does exist, but is less luminous and cooler than in other systems.
The X-ray properties of these 18 Be+sdO systems are largely unknown since they were not studied in detail. With two exceptions (see below), only flux limits are reported for some cases in the literature (Berghoefer et al., 1996). This paper thus tries to fill this gap by performing a global X-ray study of these Be+sdO systems, with the ultimate aim of evaluating the validity of the Langer et al. scenario. Additional Be binaries, for which the nature of the companion is unknown but could be a stripped star (e.g. HD 161306, Koubský et al., 2014), were also added to the sample for completeness. Section 2 presents the collected data while Section 3 reports on their analysis. Section 4 then discusses the Langer et al. scenario, with the constraints brought by previous data and our observations highlighted. Section 5 finally summarizes our findings.
2 Data
2.1 The sample
Our sample consists of the 18 known Be+sdO systems plus seven spectroscopic Be binaries never studied in X-rays and for which the nature of the companion remains unclear. Table 1 lists those stars, along with their known properties. The distances were taken from Bailer-Jones et al. (2021), except for HD 37202 (which has no Gaia data, and so the Hipparcos value of van Leeuwen 2007 is used) and HD 200120 (which has a clearly deviant distance in the Gaia catalog, Peters et al. 2013; Nazé & Motch 2018). When this distance was different from that adopted in the references used for stellar radii of the stars and for bolometric luminosities of the companions, these parameters were appropriately scaled. Bolometric luminosities of the Be stars were estimated using the -band magnitudes from Simbad, the interstellar reddenings and distances quoted in the Table, as well as bolometric corrections derived for the adopted temperatures of the Be stars using the formula of Pedersen et al. (2020). When the (Be) was unknown, the correction used for stars with the closest spectral types were used. We find that these bolometric luminosities agree well with those derived using the temperatures and the radii, when known.
2.2 X-ray observations
Most of our targets were observed in 2021 with XMM-Newton in the framework of our dedicated program #088003. In addition, HD 200120 had been previously observed for us during another project (Nazé et al., 2020) and two additional archival datasets of GJ 674 (0551020101, PI Schmitt - see also Nazé & Motch 2018, and 0810210301, PI Froning) observed HD 157832 off-axis. All XMM-Newton data were processed with the Science Analysis Software (SAS) v20.0.0 using calibration files available in January 2022 and following the recommendations of the XMM-Newton team111SAS threads, see
http://xmm.esac.esa.int/sas/current/documentation/threads/ . After their pipeline processing, the European Photon Imaging Camera (EPIC) event files were filtered to keep only the best-quality data (pattern 0–12 for MOS and 0–4 for pn). Light curves for energies above 10 keV revealed contamination by background proton flares for all but the HD 51354, HD 152478, and HD 200120 datasets. Thresholds on lightcurve count rates above 10 keV were then applied to eliminate the flaring intervals.
Source detection was performed in the total, 0.5–10. keV, energy band, as well as for soft (0.5–2. keV) and hard (2.–10. keV) bands to constrain the hardness of the detected X-ray sources. Images binned by a factor of 20, i.e. to a 1″ pixel size, and likelihoods of 10 were used. A trial was also performed with lower thresholds. This resulted in the detection of two additional sources, associated to HD 137387 and HD 157042. Both have combined EPIC likelihoods 10, which was our initial limit, and so we have added them to the list of detections. For HD 152478, an X-ray source is detected 18.7″ away from the Simbad J2000 position or Gaia J2016 position of the target. This difference is much too large for a secure association (its positional error is 0.8″ and the absolute measurement accuracy of XMM-Newton is 4″ half-cone angle, see Jansen et al., 2001) and we therefore tag this source as undetected. Sensitivity maps using the standard Poisson mode were built for a likelihood of 3.0 (corresponding to a probability of 95%), to estimate upper limits on count rates for undetected targets. Table 2 provides the final count rates or upper limits on count rates. For completeness, we may note that an alternative way to build such maps exists in SAS. It relies on the “delta-C” mode but requires larger pixels to be applied. Using 4″ pixels, this method leads to limits 30 to 100% larger than those of the standard mode.
When a target was bright enough, XMM-Newton spectra were extracted for each EPIC camera. The source regions were circles centered on the Simbad positions of the targets and with typical radii of 30″ while background regions were chosen from nearby circles devoid of sources. For HD 194335 and HD 200120, the individual EPIC spectra have low signal-to-noise hence we combined them using the task epicspeccombine. A grouping was applied to all XMM-Newton spectra to obtain an oversampling factor of maximum five and a minimum signal-to-noise ratio of 3.
Four additional targets were covered by Chandra observations, two for our dedicated program (ObsIDs 25112, 25115, 25116) and two from archival datasets (ObsIDs 20928, PI Liu, and 26239, PI Koss). Source detection was performed in the total, 0.5–10. keV, energy band using both a sliding square detect cell (task celldetect) and wavelets (task wavdetect). This led to two detections: HD 37202 and HD 58978. In the former case, the detection occurs at 1.3″ of the Simbad position of the source (J2000) or 0.9″ of the Gaia position (J2016). This is quite far away for Chandra, but not unheard of as “the 99% limit on positional accuracy is 1.4″” for Chandra222https://cxc.harvard.edu/mta/ASPECT/celmon/. Also, the target appears quite isolated, with no known star or extragalactic source nearby. Therefore we consider the detection as secure. However, this target appears extremely bright in X-rays ( cts s-1) and is therefore affected by pile-up. Its spectrum was derived using the task specextract, a source region of 20 pixels radius centered on the wavdetect position and a surrounding annular background region of 20 and 70 pixels radii. The examination of the spectrum clearly reveal an extremely hard tail typical of pile-up. The use of the “pileup” model within Xspec did not lead to a good result. Therefore, a new extraction was performed, using an annular source region with 3 and 20 pixels radii. The inner radius was chosen as a compromise between pile-up elimination and sensitivity, after trials with 1, 3, and 5 pixels for inner radius. Such annular extractions clearly showed the progressive disappearance of the tail, confirming its origin as due to pile-up. However, to obtain the correct effective area for the annular source region, the arf had to be modified using the task arfcorr. A grouping by minimum 10 counts led to the final spectra.
For HD 58978, the wavelet detection algorithm found it but with only 6 counts (all appearing in the soft X-ray range). For this target as well as the two undetected ones, the Chandra count rates were estimated in the 0.5–10. keV energy band using the task srcflux for a source region of 10 pixels radius centered on the Simbad positions of the targets and an annular background region of 10 and 50 pixels radii. The confidence level was set to 68% to find the 1 error on the rate of HD 58978 while a level of 95% was used to derive upper limits (Table 2). Note that the listed value for HD 41335 corresponds to the combination of two observations, which improves the limit determination.
Some observations from the Neil Gehrels Swift observatory covered our targets and were processed with the on-line tool333https://www.swift.ac.uk/user_objects/. However, the Swift X-ray telescope (XRT) suffers from optical loading in case of optically-bright sources. This restricted the use of Swift data taken in PC mode to HD 55606 and ALS 8775. For the latter, a stricter limit on its X-ray emission was provided by the Chandra data and so the Swift data were not used. In parallel, we requested an observation of HD 10516 in WT mode, to avoid optical loading. The derived 2 upper limits on the sources’ count rates (in the 0.3–10. keV band) are provided in Table 2.
Finally, the remaining targets were not observed during dedicated pointed observations but were sampled during XMM-Newton slews between observations. The upper limit server444http://xmmuls.esac.esa.int/upperlimitserver/ (hereafter “uls”) provided in such cases upper limits on pn count rates in the 0.2–12. keV energy band and with 2 significance (corresponding to 95% probability). These values are listed in Table 2.
| Name | ObsID | Count rates ( cts s-1) | Count hardness | (H) | ||||||||
|---|---|---|---|---|---|---|---|---|---|---|---|---|
| ( | XRT/ACIS/ | (tot, | (Å) | |||||||||
| cm-2) | MOS1 | MOS2 | pn | MOS1 | MOS2 | pn | erg s-1) | |||||
| Bright detections | ||||||||||||
| HD 194335 | 0880030501x | 9364.813 | 0.075 | 4.800.85 | 4.540.90 | 19.02.1 | 0.14 | 0.14 | 0.06 | 0.550.03 | 0.02 | –1.3 |
| HD 200120 | 0820310501x | 8255.971 | 0.025 | 4.340.87 | 3.870.74 | 32.42.4 | 0.04 | 0.08 | 0.03 | 0.840.27 | 0.07 | –11.1 |
| HD 157832 | 0551020101x | 4715.251 | 0.14 | 2446 | 2647 | 63111 | 0.02 | 0.080.03 | 0.02 | 32033 | 0.008 | |
| HD 157832 | 0810210301x | 8211.944 | 0.14 | 1725 | 2437 | 0.140.03 | 0.350.03 | 28530 | 0.011 | –28.0 | ||
| HD 37202 | 26239c | 9573.664 | 0.027 | 36.79.2 | 0.05 | –13.4 | ||||||
| Faint detections | ||||||||||||
| HD 43544 | 0880031301x | 9498.389 | 0.095 | 1.070.50 | 0.850.49 | 3.001.07 | 0.11 | 0.18 | 0.20 | 0.110.03 | 0.01 | –18.6 |
| HD 58978 | 25112c | 9557.777 | 0.086 | 1.10 (0.64..1.7) | 4.1 (2.4..6.3) | |||||||
| HD 137387 | 0880030201x | 9442.584 | 0.077 | 0.870.51 | 0.660.45 | 2.911.12 | 0.57 | 0.27 | 0.20 | 0.090.03 | 0.01 | |
| HD 157042 | 0880030701x | 9468.515 | 0.11 | 1.020.66 | 1.060.52 | 3.611.19 | 0.22 | 0.31 | 0.23 | 0.090.02 | 0.01 | |
| HD 191610 | 0880031101x | 9526.353 | 0.11 | 1.230.64 | 1.870.68 | 5.151.52 | 0.27 | 0.32 | 0.26 | 0.150.04 | 0.01 | –8.8 |
| Non-detections | ||||||||||||
| HD 10516 | 00015011001s | 9595.940 | 0.099 | 15. | 1.6..2.6 | –33.0 | ||||||
| HD 29441 | 0880031501x | 9632.720 | 0.12 | 0.32 | 0.33 | 0.35 | 0.03..0.17 | –28.9 | ||||
| HD 41335 | 25115c | 9711.340 | 0.061 | 0.57 | 0.31..1.7 | |||||||
| 25116c | 9568.596 | |||||||||||
| HD 51354 | 0880031401x | 9660.617 | 0.11 | 0.41 | 0.41 | 0.48 | 0.03..0.16 | |||||
| HD 55606 | 00011412001s | 8627.005 | 0.13 | 3.6 | 13..19 | |||||||
| HD 60855 | 0880030301x | 9508.014 | 0.12 | 0.92 | 1.1 | 2.8 | 0.17..0.42 | |||||
| HD 113120 | 0880030601x | 9444.580 | 0.11 | 1.0 | 1.1 | 2.1 | 0.10..0.30 | |||||
| HD 152478 | 0880030801x | 9626.659 | 0.15 | 0.83 | 0.84 | 1.4 | 0.03..0.13 | |||||
| HD 200310 | ulsx | 3484.186 | 0.022 | 690 | 9.1..30 | |||||||
| HD 214168 | 0880031001x | 9408.685 | 0.015 | 0.47 | 0.50 | 0.99 | 0.05..0.18 | 3.8 | ||||
| ALS 8775 | 20928c | 8132.204 | 0.24 | 0.96 | 10..80 | |||||||
| HD 63462 | ulsx | 5876.503 | 0.013 | 470 | 5.0..18 | |||||||
| HD 68980 | ulsx | 9146.051 | 0.015 | 390 | 56..194 | |||||||
| HD 148184 | ulsx | 6905.410 | 0.22 | 830 | 7.8..10 | –41.2 | ||||||
| HD 161306 | ulsx | 3999.213 | 0.29 | 100 | 7.3..11 | |||||||
| HD 167128 | ulsx | 3648.710 | 0.054 | 610 | 11..29 | |||||||
A superscript on the ObsID identifies the facility used (x for XMM-Newton, c for Chandra, s for Swift). The interstellar hydrogen columns were evaluated using the reddening from Table 1 and the relation cm-2 (Gudennavar et al., 2012). For XMM-Newton, the count rates are provided for pn in the 0.2–12. keV energy band for the uls data, and for MOS1, MOS2, and pn in the 0.5–10. keV energy band otherwise. The associated count hardnesses are calculated from where and correspond to count rates in the energy bands 2.–10. keV and 0.5–2. keV, respectively. For Chandra, count rates are for ACIS-S in the 0.5–10. keV energy band. For Swift, count rates are for XRT in the 0.3–10. keV energy band. All upper limits are 95%, and all X-ray luminosities provided after correction for interstellar absorption and in the 0.5–10. keV energy band. The last column provides equivalent widths of the H line, evaluated from –600 km s-1 to 600 km s-1 in the closest optical spectrum available in the Bess database (Neiner et al. 2011, http://basebe.obspm.fr/basebe/). The spectra were considered only if taken within six months of the X-ray dataset (but most often are taken within weeks).
| Name | /dof | ||||||
|---|---|---|---|---|---|---|---|
| ( cm-2) | (keV) | (cm-5) | (tot, erg cm-2 s-1) | ||||
| HD 194335 | 0.960.12 | 0.150.02 | (4.116.71)e-3 | 28.89/16 | (2.790.10)e-14 | 3.48e-14 | (7.50.8)e-4 |
| HD 200120 | 0.000.01 | 0.270.01 | (3.710.36)e-5 | 38.23/25 | (3.740.57)e-14 | 4.10e-14 | (1.20.4)e-3 |
| HD 157832a | 0.140.01 | 9.430.79 | (1.650.02)e-3 | 429.07/413 | (2.680.05)e-12 | 2.83e-12 | 2.970.08 |
| HD 157832b | 0.630.05 | 9.43 (fixed) | (1.700.05)e-3 | 192.45/200 | (2.460.06)e-12 | 2.52e-12 | 5.100.20 |
| HD 37202 | 15.52.0 | 11.14.3 | (2.290.26)e-2 | 30.01/38 | (1.660.20)e-11 | 1.66e-11 | 23921831 |
Fitted models were of the form phabsphabsapec, with the first absorption fixed to the interstellar value (see Table 2). a,b refer to XMM-Newton datasets with ObsID 0551020101 and 0810210301, respectively. The flux hardness ratios are defined by , with the flux after correction for interstellar absorption and soft and hard energy bands being defined as 0.5–2.0 keV and 2.0–10.0 keV, respectively (the total band being 0.5–10.0 keV). Errors correspond to 1 uncertainties; they correspond to the larger value if the error bar is asymmetric.
3 Results
X-ray observations of four targets collected enough counts for a meaningful extraction of spectra. These spectra were then fitted in Xspec v12.11.1 using absorbed optically thin thermal emission models with solar abundances from Asplund et al. (2009). The chosen models were similar to those of Nazé & Motch (2018) and results are provided in Table 3. For XMM-Newton, note that all EPIC spectra (pn, MOS1, MOS2) of each exposure of HD 157832 were fitted simultaneously. Moreover, as the fitting to the second exposure leads to an extremely high temperature which cannot be constrained ( keV), an alternative fitting fixing the temperature to that of the first exposure was tried. As both fitting attempts yield similar reduced (just below 1), only the alternative results, with lower flux errors, were kept. Slight differences with results reported in Nazé & Motch (2018) and Nazé et al. (2020) for the same exposures arise from a combination of small analysis changes (improved atomic parameters of the fitting tool, combination of spectra for HD 200120, slightly lower distance and stronger interstellar absorption for HD 157832). They do not alter the conclusions in this or these previous papers.
For five targets faintly detected in X-rays, only a count rate is available. In such cases, the count rates need to be converted to obtain X-ray fluxes, which was done with the WebPIMMS tool555https://heasarc.gsfc.nasa.gov/cgi-bin/Tools/w3pimms/w3pimms.pl. To this aim, we have assumed an absorbed optically thin thermal emission model, with its absorption fixed to the interstellar one and a temperature of 0.2 keV. This temperature was chosen because all sources appear soft. For example, in XMM-Newton data, the proportions of soft and hard counts in HD 43544, HD 137387, HD 157042 and HD 191610 agree with those of HD 194335 and HD 200120 (see columns count hardnesses in Table 2) and the spectral fits of the latter two sources suggest a low plasma temperature (Table 3). The derived luminosities are presented in Table 2.
For the 16 undetected targets, only a 95% upper limit on the count rates could be derived. Again, they were converted using WebPIMMS and an absorbed thermal model. The absorption was again fixed to the interstellar one but, in the absence of any hint of the hardness, three temperatures (=0.2, 0.6, and 5.4 keV or =6.4, 6.85, and 7.8) were tried. This led to a range of X-ray luminosities (Table 2).
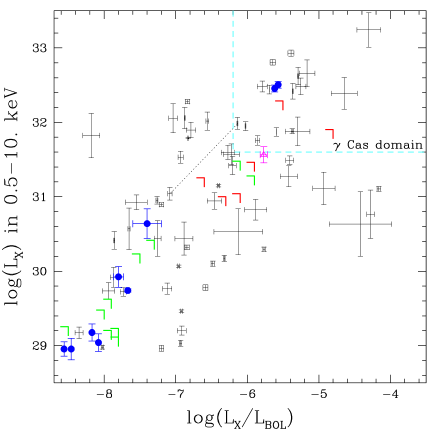
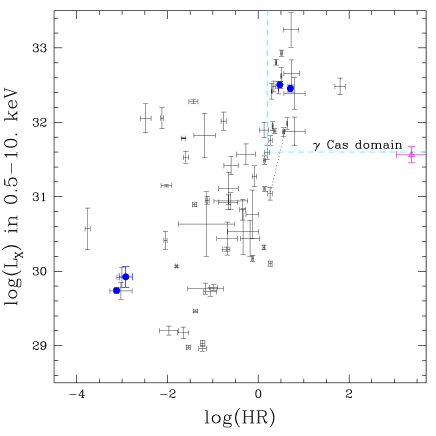
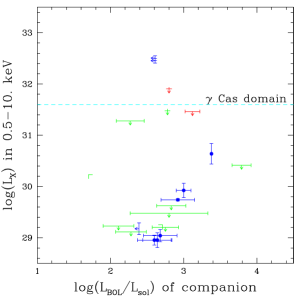
With the X-ray properties at hand for all systems, we can now examine the results. First of all, a comparison with the known properties of Be stars in the X-ray range (Nazé & Motch, 2018; Nazé et al., 2020) should be made. Figure 1 compares the brightness and hardness of our targets to those of other Be samples. Here, brightness corresponds to the X-ray luminosity in the 0.5–10. keV energy band, while the hardness is the ratio of hard (2.–10. keV) to soft (0.5–2. keV) X-ray fluxes after correction for interstellar absorption. Neither the Be+sdO systems nor the other Be binaries seem to display X-ray characteristics differing from those reported in previous Be X-ray studies. The known binarity of our targets thus does not seem to have a significant impact overall on the observed X-ray properties of Be stars. Incidentally, this result may appear quite normal if one considers that most (if not all) Be stars are binaries, often with a stripped-star companion (e.g. Shao & Li, 2014; Klement et al., 2019). Nonetheless, one could argue that the detected companions of our targets represent the tip of the iceberg in this context. They would therefore be special in some way (e.g. hotter, more massive) and the absence of consequences on the X-ray emission then remains a significant result.
In parallel, one may be tempted to argue against the presence of a massive compact companion when X-ray emission well below the X-ray binary luminosity range is detected for a Be star. However, caution should be applied here, as such X-ray luminosities can only discard the presence of “usual”, actively accreting objects. Indeed, some neutron stars may appear X-ray fainter if in the propeller regime (Postnov et al., 2017) and some black holes may be quiescent hence X-ray faint (Pszota et al., 2008; Reynolds et al., 2014). It may finally be noted that the presence of black hole companions to our targets ALS 8775 and HD 167128 (see references in Table 1), as well as to the Be star HD 215227 (=MWC 656, see Alexander & McSwain 2015 and Rivinius et al., in press), has been recently rejected. Their high-energy characteristics are thus not peculiar anymore.
Second, we may wonder whether some of these stars are Cas in character. Nazé & Motch (2018) and Nazé et al. (2020) listed the criteria for such a classification. Two of them are particularly relevant for this study (others require more detailed information): brightness of the X-ray emission ( between –6.2 and –4, between 31.6 and 33.2 for the total band) and hardness of the X-ray emission (, 5 keV, for the hard band). Using these criteria, one star of the sample appears to be a Cas analog: the Be+sdO system HD 157832. However, this has already been known for a decade (Lopes de Oliveira & Motch, 2011). One more exposure is now available, compared to this discovery paper, and it reveals some variations in flux and hardness, as often seen in Cas stars. However, it must be noted that the star fulfills the Cas criteria at both epochs. One additional target displays interesting properties: the Be binary HD 37202 ( Tau). It fulfills the , , criteria, but is exactly at the limit for the 0.5–10. keV X-ray luminosity (). In this context, it needs to be noted that HD 37202 appears as an extreme case. Indeed, its spectrum shows few counts below 2 keV and that is due to a very strong circumstellar absorption ( cm-2, Table 3). This lowers the X-ray luminosity in the full, 0.5–10. keV, energy band. Therefore, it appears quite logical to add HD 37202 to the list of Cas stars. One possible avenue to explain the high absorption of this target could be its high inclination as it is well known that its Be disk is seen edge-on (Quirrenbach et al., 1997; Gies et al., 2007; Carciofi et al., 2009; Touhami et al., 2011). Only a few Cas analogs were previously found to have strong X-ray absorptions, i.e. cm-2 (Nazé & Motch, 2018; Nazé et al., 2020), although not as extreme as HD 37202: V782 Cas, V771 Sgr, and V2156 Cyg. Unfortunately, no evaluation of the disk inclination can be found for them in the literature. However, it may be noted that other Cas objects, for which such evaluation exists, have lower inclinations and do not display high absorbing columns. Trying to put the X-ray data in context, we have also analyzed the recent optical data of HD 37202, which reveal large differences with previously reported behaviour (see Appendix).
Regarding other stars, the quite high upper limits derived for two stars (ALS 8775, HD 68980) do not permit to formally exclude a Cas nature for them (Fig. 1). Six additional ones (HD 55606, HD 63462, HD 148184, HD 161306, HD 167128, HD 200310) have limits close, albeit clearly lower, than the Cas threshold. It would therefore be surprising if they were Cas analogs (Fig. 1). For HD 167128, Manchanda et al. (2021) reported an X-ray detection in the soft X-ray range by AstroSat. The quoted luminosity ( erg cm-2 s-1 in 0.3–3.0 keV, no error mentioned) and quoted spectral properties (0.12 keV blackbody temperature) would lead to erg s in the 0.5–10. keV band, or ), just slightly above our upper limit. Details are very scarce in this Telegram, but the softness of the X-ray emission clearly excludes the target from the Cas category. If the X-ray luminosity level is confirmed, HD 167128 would be somewhat atypical amongst Be stars, the soft X-ray cases being generally fainter. The last eight targets with limits on their X-ray emission as well as the seven other detected sources are far from the Cas domain. Therefore, they certainly do not belong to the Cas category, without any ambiguity (Fig. 1). Their X-ray emission is clearly faint and, when known, soft.
There are no comprehensive and unbiased statistics yet available enabling us to derive a secure incidence rate of Cas stars amongst Be stars - only hints can be derived. Nevertheless, if we compare the three large-scale Be studies in the X-ray range, we find that the fraction of Cas stars was 15/84 in Nazé & Motch (2018), 3/18 in Nazé et al. (2020), and 2/25 (one amongst 18 Be+sdO and one amongst 7 other Be binaries) in this work. Alternatively, 66/84, 14/18, and 21/25 of the Be stars in the same papers were definitely not Cas or candidates. Despite the small number statistics and the different biases666This work examines only known binaries, Nazé et al. (2020) studied some stars which could a priori be interesting candidates for presenting the Cas phenomenon, and Nazé & Motch (2018) analyzed all available X-ray exposures covering Be stars in the last two decades - some data having been required specifically to study Cas stars while others serendipitously covered the position of a Be star in the field-of-view. It may be also noted that both studies mostly considered early-type (B3) Be stars, which also applies to the targets of this paper. , these fractions appear remarkably similar, with about 80% of non- Cas stars and 10–20% of Cas stars in these samples. With current data, it thus appears that our sample of Be binaries is fully in line with the known Be population. Combining the three samples, we then find a global incidence rate of the Cas phenomenon of 19/12515% amongst Be stars observed in the X-ray range.
4 Discussion
Gies et al. (1998) and Krtička et al. (2016) have independently imagined the possibility of a collision between the Be disk material and the wind of a stripped star companion. Langer et al. (2020) hearkened back this idea and applied it with the aim of reproducing the Cas peculiarities. In this context, we will examine each step of their scenario in turn, beginning with the properties of stripped stars, then looking into the characteristics of colliding-wind systems and of additional features presented as supportive of their scenario, to conclude with the constraints brought by the actual X-ray data presented in the previous section.
4.1 The properties of stripped stars
By definition, hot subluminous stars, classified using the spectral types sdO, display luminosities below those of the corresponding main-sequence stars (for a review, see e.g. Heber 2016). They are considered as stellar cores stripped of most of their envelopes and burning helium in the core or in a shell around it (hence the alternative name of “Helium-stars”). The common features of all such stars are their low masses and relatively high effective temperatures. Regarding the origin of these objects, evolutionary effects appear to play a prominent role. However, no single evolutionary path can be identified. The stripping may thus occur through a helium flash after leaving the red giant branch, a merger event, or an interaction between stars in a binary system.
The He-star companions to Be stars are expected to come from the latter channel. Detailed models of such systems were made by several authors (e.g. the recents studies of Shao & Li, 2014, 2021). Shao & Li (2014) evolved a population of massive systems, considering a range of periods, masses, and mass-transfer properties. They found that the observed mass distribution of Be stars having a neutron star companion and ranging from 8 to 22 M⊙ is best reproduced in the case of moderately non-conservative mass-transfer without any common envelope phase. In addition, the vast majority of Be binaries should possess white dwarf or He-star companions, neutron star or black holes being orders of magnitude less frequent. Shao & Li (2021) further showed that their models reproduce well the properties of the observed Be+sdO systems. They also revealed a correlation between the Be star and the He-star masses, with few (if any) stripped stars above 4 M⊙.
As they emit most of their light in the ultraviolet range, it seems quite natural to expect line-driven outflows for these stripped stars. Models of massive stars were extended (or just applied) by some authors to study these objects, while several pieces of observational evidence revealed direct signature of their winds.
Theoretically, atmosphere models of stripped stars were made by several authors. Krtička et al. (2016) limit models to a single mass (0.5 M⊙) with a range of temperatures and radii. They demonstrated that the winds may be difficult to launch for stars with high gravities. Also, with too low densities, ion decoupling may occur, which strongly limits the acceleration of the bulk material. Finally, they found ratios between wind velocities and escape velocities to typically lie between 1.5 and 2.5, i.e. lower than for the winds of O-stars. Vink (2017) rather considers objects with a single effective temperature (50 kK) and a range of masses. In those models, the mass-loss rates and wind velocities have higher values than in Krtička et al. (2016), although wind velocities remain below 3000 km s-1 for stripped stars with masses M⊙ (the useful range as it corresponds to the observed objects, see below). For these stars, the wind-to-escape velocity ratio can be derived to be 1.7–3.1. Finally, Götberg et al. (2018) studied the evolution of various binaries, leading to stripped stars with a wide range of masses. They do not determine the wind properties, but use the mass-loss formula of Krtička et al. (2016) and a wind-to-escape velocity ratio of 1.5. It may be underlined that their low-mass models reproduce well the observed properties of stripped stars in Be+sdO systems (Wang et al., 2021).
Observationally, there is little doubt that stripped stars may power winds. First, since those line-driven winds should be as unstable as those of OB stars, shocks should occur and X-ray emission similar to that recorded for single, non-magnetic, OB stars could be expected. This was indeed detected in a handful cases of sdO stars, although all sdBs and most sdOs remained undetected in the X-ray range, most probably because of too tenuous winds (for a review, see Mereghetti & La Palombara, 2016). These X-ray emissions displayed plasma temperatures and bolometric-to-X-ray luminosity ratios similar to those of classical Population I OB stars, a consistency check of their common origin.
In addition, some subdwarf spectra display lines clearly associated with outflows, notably P Cygni profiles in some UV lines. Atmosphere modelling was then performed to determine the stellar and wind properties. Jeffery & Hamann (2010) fitted the spectra of six putatively isolated “extreme He-stars”, deriving effective temperatures of 18.5–48.0 kK, mass-loss rates of 10-10 to 10-7 M⊙ yr-1, and wind velocities between 400 and 2000 km s-1. Only two stars, the two hottest cases, displayed wind velocities larger than 600 km s-1 and both are amongst the few known X-ray emitters (see previous paragraph). In this paper, masses or radii were not directly determined but they can be reconstructed using the fitted , , and luminosities. The wind velocities appear to be between 1.5 and 3.5 times the escape velocities. Krtička et al. (2019) analyzed in detail two other subdwarfs, one of them showing no trace of wind. The other one (in the binary HD 49798) has an effective temperature of 45.9 kK, a mass loss-rate of 2–3 M⊙ yr-1, and a wind velocity of 1600 km s-1 (which is 3.5 times the escape velocity). Again, it is one of the known X-ray emitting subdwarfs. In addition, Groh et al. (2008) reported on the analysis of the stripped star, of qWR type, in the binary HD 45166777Götberg et al. (2018) found a continuous sequence, explained by mass, between subdwarf spectra with absorption lines (appearing as sdOs) and stripped star spectra with emission lines (appearing as qWR): such stars are therefore relevant to the problem examined here.. This qWR star has a temperature of 50 kK, a strong mass-loss rate (2–3 M⊙ yr-1), but a low wind velocity (425 km s-1, which is one third of the escape velocity). Data suggest a latitude-dependent wind, but even the fast polar wind would reach only 1300 km s-1. Finally, Drout, Götberg, et al. (submitted) have performed a search for stripped-star companions to B/Be stars in the Magellanic Clouds. They found that none of these companions exhibit emission lines, suggesting that all of them actually display low mass-loss rates, in agreement with the above results found in the Galaxy.
Finally, orbits derived for the Be+sdO systems yield masses of 6–13 M⊙ for the Be stars and 0.6–2. M⊙ for their companions (Table 1). We note that this agrees well with the masses derived for Cas systems and other Be binaries (see Nazé et al., 2022a, for a summary), but we will come back to that below. In addition, temperatures of the stripped stars in Be+sdO systems were found to be 34–53 kK (Table 1), similar to those of other studied subdwarfs (see above). In parallel, luminosities of the Be stars in Be+sdO systems (Table 1) as well as those of Cas analogs (Nazé & Motch, 2018) are far from extreme, being L⊙.
In summary, both observations and models suggest that stripped stars with Be companions have low masses, moderate temperatures, and not extremely fast winds. In parallel, the Be stars known to be in binaries with stripped stars or to be Cas analogs are found to have around ten solar masses. All this contrasts with the hypotheses of Langer et al. models numbered 4 to 6, which have high masses for both the stripped star and its OB companion (2.6–5.3 and 25.3–35.9 M⊙, respectively), very high luminosities for both of stars ( and L⊙, respectively), very high temperatures for the stripped stars (74–98 kK), and extremely fast winds ( km s-1, assuming ). Langer et al. (2020) acknowledged in their Sect. 5.2 that model 6 in fact represents a WR+O system rather than a Be with a stripped star, but they also considered the models with the most massive and luminous companions as the best candidates for Cas-like emission. Eliminating these unrealistic models strictly limits the available wind luminosities to (see more in next section). Their models 1–3 agree better with the evolutionary tracks of Götberg et al. (2018) and the observed properties of stripped stars in known Be+sdO systems. Only these models will therefore be considered as relevant to the examined problem.
4.2 The properties of colliding winds
Colliding winds in massive binaries have now been studied for several decades and their properties over a large range of wavelengths are well known. In the X-ray range, several specific features have been identified (for a review, see Rauw & Nazé, 2016, and references therein).
First, it must be recalled that such X-ray bright emission is the exception rather than the rule for massive binaries. For example, in the Carina region, the X-ray emission of 60 O-type stars was studied (Nazé et al., 2011). Only three objects were found to be significantly overluminous: one magnetic star with confined winds and two binaries. Furthermore, the wind luminosity cannot be considered as a good proxy for the X-ray luminosity. Depending on the nature of the collision, the difference between these luminosities can be large. For example, Zhekov (2012) found for a sample of WR+OB systems. Considering the available for stripped systems (, see previous subsection), this renders it difficult to achieve high enough X-ray luminosities (for Cas analogs, ).
Second, the emission arises from the hot plasma generated by the collision: it is thermal in nature. More precisely, it corresponds to optically-thin thermal plasma (e.g. xspec models “mekal”, “apec”). High-resolution X-ray spectroscopy has confirmed this, by revealing the emission to consist of lines with a faint (bremsstrahlung) continuum (e.g. Schild et al., 2004). The emission is thus not a blackbody emission, as assumed by Langer et al. (2020).
Furthermore, since strong shocks are involved, the temperature of the hot plasma should be evaluated with the well-known Rankine-Hugoniot relationship (and not by , as assumed by Langer et al. 2020). In this formula, the wind velocity is the pre-shock velocity perpendicular to the shock: it is not necessarily the terminal wind velocity . Indeed, the stars must be separated enough for their winds to reach their maximum velocities before colliding. In addition, the UV emission from the companion may slow down the wind of a star as it is line-driven by nature (this effect is known as radiative braking/inhibition, see e.g. Stevens & Pollock 1994). Finally, the winds collide in a face-on manner only at the apex of the collision cone, on the line joining the stars’ centers. Winds collide more obliquely further away from the line-of-centers, lowering the post-shock temperature. A more representative temperature estimate actually is half the Rankine-Hugoniot value at apex, or , where is provided in keV and is expressed in units of 1000 km s-1 (Parkin & Sim, 2013). This leads to a factor of five difference between expected temperatures and those calculated in Langer et al. (2020), not even taking the radiative effects into account888Actually, one could argue that the real difference is larger as Langer et al. (2020) uses the proton mass in their formula while the Rankine-Hugoniot formula applies to the mean particle mass , which is about half the proton mass in an ionized medium.. To reach temperatures over 5 keV (and even up to 25 keV), as observed in Cas analogs, shock velocities larger than 3000 km s-1 (up to 6500 km s-1) are in fact needed, which are not typical wind velocities of stripped stars (see previous subsection).
Such high temperatures are not typical of colliding wind binaries either, despite the well-known fast winds of massive stars. In observed systems, the X-ray emission is generally harder than the usual intrinsic emission of single non-magnetic massive stars but the hot plasma remains at a much lower temperature than found in Cas stars (Rauw & Nazé, 2016, and references therein). To advocate for extreme temperatures, Langer et al. (2020) referred to the review of Gagné et al. (2012). In this review, the vast majority of colliding-wind systems display keV (typically 0.5–2 keV). Only three systems are mentioned with a hotter plasma: CEN 1A, HD 5980, and Brey 16. The first system was studied in detail using XMM-Newton by Mernier & Rauw (2013): the hottest plasma component had a temperature of 3.8 keV. The difference with the previous Chandra value most probably comes from pile-up effects, known to artificially shift X-rays towards higher energies. The second system, analyzed by Nazé et al. (2002), is embedded in patchy soft X-rays from a supernova remnant. A clean spectrum of the system is difficult to extract, even with Chandra, and possibly explains the anomalous temperature. The X-ray properties from the last system were reported by Guerrero & Chu (2008). Only few counts were available for this system and the median energy of the recorded X-rays is about 2 keV. A tentative999From Guerrero & Chu (2008): ”We note that LMC-WR 19, 20, and 99 have small numbers of counts detected, and consequently the quality of their spectral fits is poor.” - LMC-WR19 is Brey 16. fit does formally land on a plasma temperature of 7 keV, but with a wide confidence interval (from 2 to 22 keV at 1). Clearly the faintness of the source did not allow reliable results to be reached. Furthermore, in all three cases, the well-known trade-off between absorbing column and plasma temperature may also skew the results somewhat. Therefore, the basis for a claim of extremely high temperatures associated with colliding winds appears unsubstantiated.
Besides, Langer et al. (2020) themselves also advocated in their Sect. 5.2 that temperatures of their model need to be lowered to 1.3 keV to be reconciled with the observed hardness ratios of Cas analogs. This is clearly at odds with the observed properties of Cas X-ray spectra (which show keV), but may come from a combination of the inadequate choice of a blackbody model with an inadequate definition of hardness ratios101010These authors compare observed ratios which are ratios of fluxes integrated in two wide energy bands (0.5–2.0 keV and 2.0–10. keV) with ratios of blackbody fluxes at two specific energies (1 and 5 keV)..
A last defining characteristic of colliding winds is their variability. This variability is locked to the orbital phase, for a large range of periods (from a few days to several years) - repeatability was verified for several systems (e.g. in 20 cycles of WR 21a, see Gosset & Nazé, 2016). It was linked to several origins: change in shock strength due to the varying separation in eccentric binaries (e.g. Nazé et al., 2012), change in absorption along the line-of-sight as the binary revolves (e.g. Willis et al., 1995), or eclipse of the colliding wind region (Lomax et al., 2015). Such variations are now rather well understood and can be reproduced by models (e.g. Pittard & Parkin, 2010). Such features appear in stark contrast with the X-ray properties of Cas analogs. These objects show ‘flare’-like variations on short timescales (seconds, see Smith et al. 1998) and smoother long-term variations, but not linked with the known orbital periods (see Motch et al. 2015 for Cas, and Nazé et al. 2019a for Aqr).
Recently, Chen et al. (2021) have asserted to bring support to the Langer et al. scenario by examining the consequences of the detection of a wind-blown bubble around Cas. Amongst other things (see also below), they stated that wind-wind collisions can produce hot plasma but, as seen before, actual colliding winds never reach the typical plasma temperatures of Cas analogs. The authors also added that short-term ‘flare’-like variability of Cas could come from the intrinsic variability of winds (i.e., not linked to colliding winds). While some variations of that embedded wind shock emission are indeed expected (Oskinova et al., 2001a), they should occur on timescales related to the wind expansion, not on the very short timescales observed for the X-ray lightcurve of Cas (down to 4 s, Smith et al. 1998). Moreover, even the best observational datasets of single massive stars did not reveal such short-term X-ray variability (Nazé et al., 2013). Because of the high number of wind clumps, the natural embedded wind shock variability is actually smoothed out when observing the whole wind output, leading to a constant level for the observed emission. Besides, by nature, those intrinsic X-rays are soft, not hard. Chen et al. (2021) finally explain the long-term X-ray variations as usual phase-dependent changes seen in colliding winds, linking them to a varying stellar separation or absorption. Unfortunately, Cas does not display any flux variations in phase with its orbital period in the X-ray range (Rauw et al., 2022), its orbit is circular (e.g. Nemravová et al., 2012), and high-absorption events are not only unrelated to orbital phase but are sharp events occurring on rather short timescales (Smith et al., 2012; Hamaguchi et al., 2016; Rauw et al., 2022) whereas absorption effects in colliding winds are smooth and phase-dependent (Rauw & Nazé, 2016, and references therein).
4.3 Additional features
Regarding the incidence of Cas systems, Langer et al. (2020) conclude in their Sect. 5.1.3 that Cas stars should represent at most 10% of X-ray binaries with a Be component, i.e. there should be many more Be X-ray binaries than Cas stars. While this statement may be true if one takes a quick look at current X-ray binaries catalog numbers, it must be remembered that X-ray binaries are detected from afar while most Cas stars were found by chance or from limited surveys of nearby stars. In fact, few Be stars (other than those in X-ray binaries) have been observed in the X-ray range (e.g. Nazé & Motch, 2018). Therefore, the exact incidence of the Cas phenomenon is unknown. However, even if distance-limited samples remain to be investigated, the number of current Cas detections already indicates that the incidence of the Cas phenomenon goes well over, not well below, that of Be X-ray binaries in the Be population at large (see a thorough discussion in Sect. 6.1 of Smith et al. 2017).
Langer et al. (2020) also discuss the impact of structured winds on the X-ray emission of massive stars. Indeed, discrete emission components (DACs) in spectral lines have been spotted in several Cas analogs, notably in Cas itself (Cranmer et al., 2000), as they have been in many OB stars. These DACs are produced in large-scale wind structures thought to ultimately arise from surface features (Cranmer & Owocki, 1996). Such “spots” were indeed found in the analysis of the high-quality, high-cadence photometry available for some massive stars presenting DACs (Ramiaramanantsoa et al., 2014, 2018). X-rays associated with large-scale wind structures have also been studied for a sample of massive stars (Oskinova et al., 2001b; Rauw et al., 2015a; Massa et al., 2019; Nichols et al., 2021). They produce variability of a limited amplitude (10–20%), with a specific timescale (set by rotation), and only at energies where intrinsic X-rays arise, i.e. in the soft band. Those properties disagree with those observed for Cas stars. Furthermore, Langer et al. (2020) envisaged that a collision between the Be wind and the stripped star wind could be modulated on a “broad range” of timescales because of such features in the Be star wind. As acknowledged by Langer et al. (2020), DACs are ubiquitous amongst massive stars. Therefore, such variations should already have been detected in colliding winds systems, but this is not the case. This leaves little support for DACs as the origin of the ‘flare’-like behaviour of Cas analogs.
If a disk-wind collision occurs, one could expect some deviation from pure symmetry in the disk of the Be star (Langer et al., 2020). Asymmetries (e.g. one-sided arms) are often reported for Be stars from analyses of the H line profiles. Indeed, the relative amplitude of the emission peaks changes with time (the so-called modulation) and this can be related to structures in the disks. Such disk features are thought to be triggered by the Be star oblateness (Papaloizou et al., 1992) or by companions (Panoglou et al., 2018). Langer et al. (2020) quotes the case of Aqr as an example of asymmetric disk bringing (indirect) support to their scenario. However, while its disk strongly developed in recent years, the modulation observed in Aqr disappeared but not its Cas character (Nazé et al., 2019a, b). It may be important to note in this context that the disk estimated size remains well below the binary separation, so that an engulfing of the companion (as proposed in some cases by Langer et al. 2020) cannot apply here. Furthermore, Langer et al. (2020) also mentioned the possibility for the collision zone to produce H emission. If that occurs, it means that the collision is efficiently cooled and has become highly radiative. In such a case, the plasma temperature and its associated X-ray emission would drastically drop, which becomes a problem for the envisaged scenario (see also above discussion on ). In addition, in both Aqr (Nazé et al., 2019a) and Cas itself (Rauw et al., 2022), tomographic mapping of the H emission did not reveal any stable structure linked to a companion, as would be expected in such a case.
Chen et al. (2021) found a cavity of radius 2.1–3 pc around Cas expanding with a velocity of 5 km s-1 and a kinematic timescale of 0.3 Myr. Using wind properties derived for the Be star in the literature, they estimated the wind luminosity and found it to be in good agreement with that derived from wind-blown bubble properties. This implies that the Be star alone can carve this bubble. Then the authors used two relations established for embedded wind shocks (i.e. for massive stars without X-ray bright colliding winds). They concluded that the derived X-ray luminosity can be reconciled with the observed one of Cas, despite the facts that the intrinsic X-rays from massive stars are soft and follow a specific relation, in sharp contrast to the known X-ray properties of Cas. Note that, in all this, nothing relates to the Langer et al. scenario (i.e. presence of a stripped companion with strong mass-loss, presence of a disk-wind collision) therefore this scenario cannot be supported by the bubble discovery. Finally, WISE data are presented as evidence for binarity, quoting previous studies. However, these studies do not tell the same story: Bodensteiner et al. (2018) found those data to indicate a morphological classification “not classified” for Cas, while Langer et al. (2020) found these data providing “weak evidence” for the presence of a bow shock (which could have been linked to a kick after a supernova explosion - this is actually one argument used by Langer et al. to reject the neutron star nature of the companions in Cas and Aqr). Neither paper considers WISE data as support for the binarity of Cas.
4.4 Testing the Langer et al. model
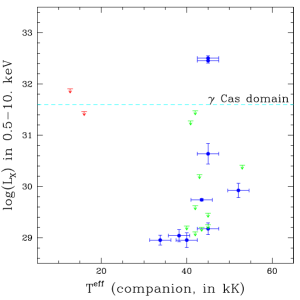
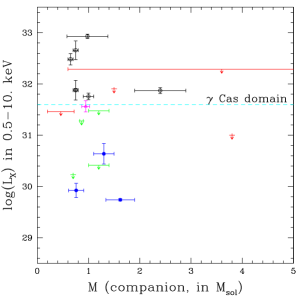
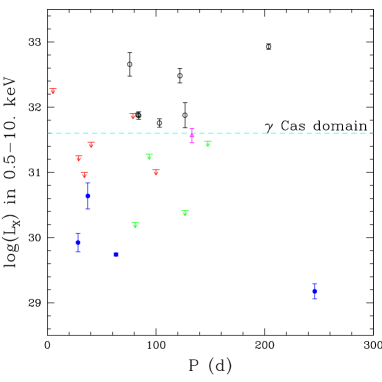
While the analogy of Cas stars with known colliding-wind systems remains elusive, it is nevertheless of great interest to examine how X-ray properties of Be stars depend (or not) on binarity. Amongst the cases studied in the X-ray range, there are eight Cas stars which are known binaries (Nazé et al., 2022a), in addition to the 18 Be+sdO systems and 7 other Be binaries studied in this work. Figures 2 and 3 compare the X-ray luminosities of these systems to the temperature, mass, and luminosity of the companions and to the orbital period of the systems (see Table 1 or Nazé et al. 2022a for their values).
Langer et al. (2020) expected a higher X-ray luminosity for systems with more massive companions, with only the most massive companions leading to a Cas appearance: “only Cas binaries with sufficiently massive helium-star companions are predicted to have detectable X-ray fluxes” (their Sect. 5.1), “Other predictions resulting from the given ansatz are that Cas stars might have rather massive helium-star companions” (their Sect. 5.3). This can now be tested with observations. The middle panel of Fig. 2 graphically shows the absence of correlation between the companion mass and the X-ray luminosity in our sample. It also fails to demonstrate a clear mass segregation in relation to the presence or absence of the Cas character. To this, it must be added that the Cas binaries studied before have not revealed companions with particularly high masses. For example, the well studied case of Cas led to a mass estimate around 1 M⊙ (Nemravová et al., 2012; Smith et al., 2012). In fact, there does not seem to be a significant difference between companions in Cas systems and companions in other Be binaries (Nazé et al., 2022a, and Fig. 2). The Langer et al. prediction thus appears falsified.
One could also expect a stronger disk-wind collision if the companion’s wind is stronger. Since the wind depends on temperature or, equivalently, on the bolometric luminosity (Krtička et al., 2016; Vink, 2017), the left and right panels of Fig. 2 also compare the X-ray luminosities to these parameters, when known. Some marginal correlation may be seen by eye for the five X-ray detections without a Cas character, but (1) this relies on so few systems that spuriosity cannot be excluded and (2) this neglects both the upper limits and the Cas case. In particular, it is important to note that the sole Cas analog amongst the presented sample is HD 157832 (the sole blue symbol above the Cas border in Fig. 2). This target harbours a faint and not-very-hot stripped star companion (Wang et al., 2021), notably contradicting Sect. 5.2 of Langer et al. (2020, “the known Cas stars should correspond to the most luminous models that predict the Cas phenomenon.”). Combining its luminosity limit (Table 1, Wang et al. 2021) with formulae of Krtička et al. (2016) or Vink (2017) yields or –9.75, respectively, for this stripped star. This implies that the Cas character may well exist with a stripped-star companion having a tenuous stellar wind, at odds with a disk-collision scenario.
One could also consider the separation between the binary components as a potentially important parameter. Indeed, with wider separations, the disk must extend farther before the collision with the companion’s wind takes place. The disk material would then be more tenuous, and the collision would then be weaker. Figure 3 therefore compares the X-ray luminosities to the orbital periods. No obvious correlation stands out. For example, the two long-period systems ( Cas and HD 191610) harbour X-ray luminosities at both extremes of the range. There is one caveat, however: Be disks are known to vary and not all disks may be large enough at the time of the X-ray observations to reach the companions. In this context, Table 2 also lists the equivalent width of the H line close to the time of the X-ray observations, when available. Most of the strongest disk emissions are found for systems which are not Cas in character! Furthermore, it may be remembered that the Be disks are often truncated (Klement et al., 2019). For Be X-ray binaries Okazaki & Negueruela (2001) showed that this truncation often occurred at about one third of the orbital separation. All this implies that little disk material would be present in the companion’s neighbourhood, even when the disk appears massive. Moreover, dedicated monitorings have shown that the Cas character may exist even with a very limited disk (see the cases of Aqr, HD 119682, and V767 Cen in Nazé et al. 2019a, 2022b). All these pieces of evidence provide additional arguments against a disk-collision scenario.
Finally, since orbital solutions are known in some cases (Table 1), one may wonder at which phases the dedicated X-ray observations were taken. ALS 8775, HD 41335 (second observation), and HD 58978 were observed as the companion was in front of the Be star (i.e. at superior conjunction of the Be star). HD 10516, HD 41335 (first observation), and HD 200120 were observed near quadratures. HD 37202 was observed just after superior conjunction of the Be star. HD 55606 was observed between quadrature and inferior conjunction of the Be star. HD 194335 was observed when the Be star was in front. In all cases but the latter one, there is no reason to expect an X-ray source close to the companion to be eclipsed by the Be star or its disk. Furthermore, even in the latter case, such an eclipse could be avoided since its inclination is “intermediate” (Klement et al., 2022). One can thus conclude that there was no specific reason for a Cas character, if present, to remain hidden in those systems.
5 Conclusion
Using XMM-Newton, Chandra, and Swift observations, we have examined the X-ray emission of a set of Be binaries: 18 known to harbour a stripped-star companion and 7 for which the companion nature is debated. The derived X-ray properties appear fully in line with those found for other samples of Be stars, revealing no specific effect of the presence of these companions on the X-ray emission. In particular, 21 systems display faint (and soft) X-rays while two others clearly appear as Cas analogs (one of them, HD 37202, being a new detection). This incidence rate appears similar to that seen for other Be samples. No relationship could be found between the X-ray luminosities and the periods of the systems or the properties of the companions. In particular, there is a single case of a Cas star with constrained companion’s luminosity, HD 157832, and this companion appears faint. The Cas character may thus exist even if the companion ejects little wind. In addition, the link between the Cas character and the companion’s mass predicted by Langer et al. (2020) is not verified. Combined with problematic analogies with wind-wind phenomenology and stripped-star properties, this makes a disk-wind collision an unlikely explanation for the Cas phenomenon.
Acknowledgements
The authors thank the referee for his comments that helped improved the paper. Y.N. and G.R. acknowledge support from the Fonds National de la Recherche Scientifique (Belgium), the European Space Agency (ESA) and the Belgian Federal Science Policy Office (BELSPO) in the framework of the PRODEX Programme (contracts linked to XMM-Newton). M.A.S. acknowledges support from Chandra grant #362675. ADS and CDS were used for preparing this document. This work has made use of the BeSS database, operated at LESIA, Observatoire de Meudon, France (http://basebe.obspm.fr).
Data availability
The BeSS, XMM-Newton, Swift, and Chandra data used in this article are available in their respective public archives.
References
- Abt & Levy (1978) Abt, H. A. & Levy, S. G. 1978, ApJS, 36, 241. doi:10.1086/190498
- Adams (1905) Adams, W. S. 1905, ApJ, 22, 115. doi:10.1086/141246
- Alexander & McSwain (2015) Alexander, M. J. & McSwain, M. V. 2015, MNRAS, 449, 1686. doi:10.1093/mnras/stv400
- Asplund et al. (2009) Asplund, M., Grevesse, N., Sauval, A.J., & Scott, P. 2009, ARA&A, 47, 481
- Bailer-Jones et al. (2021) Bailer-Jones, C. A. L., Rybizki, J., Fouesneau, M., et al. 2021, AJ, 161, 147. doi:10.3847/1538-3881/abd806
- Berghoefer et al. (1996) Berghoefer, T. W., Schmitt, J. H. M. M., & Cassinelli, J. P. 1996, A&AS, 118, 481
- Bjorkman et al. (2002) Bjorkman, K. S., Miroshnichenko, A. S., McDavid, D., & Pogrosheva, T. M. 2002, ApJ, 573, 812
- Bodensteiner et al. (2018) Bodensteiner, J., Baade, D., Greiner, J., et al. 2018, A&A, 618, A110. doi:10.1051/0004-6361/201832722
- Bodensteiner et al. (2020) Bodensteiner, J., Shenar, T., Mahy, L., et al. 2020, A&A, 641, A43. doi:10.1051/0004-6361/202038682
- Carciofi et al. (2009) Carciofi, A. C., Okazaki, A. T., Le Bouquin, J.-B., et al. 2009, A&A, 504, 915. doi:10.1051/0004-6361/200810962
- Carrier et al. (2002) Carrier, F., Burki, G., & Burnet, M. 2002, A&A, 385, 488. doi:10.1051/0004-6361:20020174
- Chen et al. (2021) Chen, X., Guo, W., Sun, L., et al. 2021, ApJ, 922, 183. doi:10.3847/1538-4357/ac2507
- Chojnowski et al. (2017) Chojnowski, S. D., Wisniewski, J. P., Whelan, D. G., et al. 2017, AJ, 153, 174. doi:10.3847/1538-3881/aa64ce
- Chojnowski et al. (2018) Chojnowski, S. D., Labadie-Bartz, J., Rivinius, T., et al. 2018, ApJ, 865, 76. doi:10.3847/1538-4357/aad964
- Cochetti et al. (2019) Cochetti, Y. R., Arcos, C., Kanaan, S., et al. 2019, A&A, 621, A123. doi:10.1051/0004-6361/201833551
- Cranmer & Owocki (1996) Cranmer, S. R. & Owocki, S. P. 1996, ApJ, 462, 469. doi:10.1086/177166
- Cranmer et al. (2000) Cranmer, S. R., Smith, M. A., & Robinson, R. D. 2000, ApJ, 537, 433. doi:10.1086/309008
- Feldmeier et al. (1997) Feldmeier, A., Puls, J., & Pauldrach, A. W. A. 1997, A&A, 322, 878
- Fossati et al. (2015) Fossati, L., Castro, N., Schöller, M., et al. 2015, A&A, 582, A45. doi:10.1051/0004-6361/201526725
- Gagné et al. (2012) Gagné, M., Fehon, G., Savoy, M. R., et al. 2012, Proceedings of a Scientific Meeting in Honor of Anthony F. J. Moffat, 465, 301
- Gies et al. (1998) Gies, D. R., Bagnuolo, W. G., Ferrara, E. C., et al. 1998, ApJ, 493, 440. doi:10.1086/305113
- Gies et al. (2007) Gies, D. R., Bagnuolo, W. G., Baines, E. K., et al. 2007, ApJ, 654, 527. doi:10.1086/509144
- Gies & Wang (2020) Gies, D. R. & Wang, L. 2020, ApJ, 898, L44. doi:10.3847/2041-8213/aba51c
- Gosset & Nazé (2016) Gosset, E. & Nazé, Y. 2016, A&A, 590, A113. doi:10.1051/0004-6361/201527051
- Götberg et al. (2018) Götberg, Y., de Mink, S. E., Groh, J. H., et al. 2018, A&A, 615, A78. doi:10.1051/0004-6361/201732274
- Groh et al. (2008) Groh, J. H., Oliveira, A. S., & Steiner, J. E. 2008, A&A, 485, 245. doi:10.1051/0004-6361:200809511
- Gudennavar et al. (2012) Gudennavar, S. B., Bubbly, S. G., Preethi, K., & Murthy, J. 2012, ApJS, 199, 8
- Guerrero & Chu (2008) Guerrero, M. A. & Chu, Y.-H. 2008, ApJS, 177, 216. doi:10.1086/587059
- Hamaguchi et al. (2016) Hamaguchi, K., Oskinova, L., Russell, C. M. P., et al. 2016, ApJ, 832, 140
- Harmanec (1987) Harmanec, P. 1987, Bulletin of the Astronomical Institutes of Czechoslovakia, 38, 283
- Harmanec et al. (2000) Harmanec, P., Habuda, P., Štefl, S., et al. 2000, A&A, 364, L85
- Heber (2016) Heber, U. 2016, PASP, 128, 082001. doi:10.1088/1538-3873/128/966/082001
- Irrgang et al. (2020) Irrgang, A., Geier, S., Kreuzer, S., et al. 2020, A&A, 633, L5. doi:10.1051/0004-6361/201937343
- Jansen et al. (2001) Jansen, F., Lumb, D., Altieri, B., et al. 2001, A&A, 365, L1. doi:10.1051/0004-6361:20000036
- Jeffery & Hamann (2010) Jeffery, C. S. & Hamann, W.-R. 2010, MNRAS, 404, 1698. doi:10.1111/j.1365-2966.2010.16410.x
- Klement et al. (2019) Klement, R., Carciofi, A. C., Rivinius, T., et al. 2019, ApJ, 885, 147. doi:10.3847/1538-4357/ab48e7
- Klement et al. (2022) Klement, R., Schaefer, G. H., Gies, D. R., et al. 2022, ApJ, 926, 213. doi:10.3847/1538-4357/ac4266
- Koubský et al. (2000) Koubský, P., Harmanec, P., Hubert, A. M., et al. 2000, A&A, 356, 913
- Koubský et al. (2012) Koubský, P., Kotková, L., Votruba, V., et al. 2012, A&A, 545, A121. doi:10.1051/0004-6361/201219679
- Koubský et al. (2014) Koubský, P., Kotková, L., Kraus, M., et al. 2014, A&A, 567, A57. doi:10.1051/0004-6361/201424022
- Krtička et al. (2016) Krtička, J., Kubát, J., & Krtičková, I. 2016, A&A, 593, A101. doi:10.1051/0004-6361/201628433
- Krtička et al. (2019) Krtička, J., Janík, J., Krtičková, I., et al. 2019, A&A, 631, A75. doi:10.1051/0004-6361/201936208
- Lallement et al. (2014) Lallement, R., Vergely, J.-L., Valette, B., et al. 2014, A&A, 561, A91. doi:10.1051/0004-6361/201322032
- Langer et al. (2020) Langer, N., Baade, D., Bodensteiner, J., et al. 2020, A&A, 633, A40. doi:10.1051/0004-6361/201936736
- Lomax et al. (2015) Lomax, J. R., Nazé, Y., Hoffman, J. L., et al. 2015, A&A, 573, A43. doi:10.1051/0004-6361/201424468
- Lopes de Oliveira & Motch (2011) Lopes de Oliveira, R. & Motch, C. 2011, ApJ, 731, L6. doi:10.1088/2041-8205/731/1/L6
- Manchanda et al. (2021) Manchanda, R. K., Katoch, T., & Antia, H. M. 2021, The Astronomer’s Telegram, 14739
- Massa et al. (2019) Massa, D., Oskinova, L., Prinja, R., et al. 2019, ApJ, 873, 81. doi:10.3847/1538-4357/ab0283
- Mereghetti & La Palombara (2016) Mereghetti, S. & La Palombara, N. 2016, Advances in Space Research, 58, 809. doi:10.1016/j.asr.2015.11.022
- Mernier & Rauw (2013) Mernier, F. & Rauw, G. 2013, New Astron., 20, 42. doi:10.1016/j.newast.2012.09.005
- Motch et al. (2015) Motch, C., Lopes de Oliveira, R., & Smith, M. A. 2015, ApJ, 806, 177
- Mourard et al. (2015) Mourard, D., Monnier, J. D., Meilland, A., et al. 2015, A&A, 577, A51. doi:10.1051/0004-6361/201425141
- Nazé et al. (2002) Nazé, Y., Hartwell, J. M., Stevens, I. R., et al. 2002, ApJ, 580, 225. doi:10.1086/343079
- Nazé et al. (2011) Nazé, Y., Broos, P. S., Oskinova, L., et al. 2011, ApJS, 194, 7
- Nazé et al. (2012) Nazé, Y., Mahy, L., Damerdji, Y., et al. 2012, A&A, 546, A37. doi:10.1051/0004-6361/201219442
- Nazé et al. (2013) Nazé, Y., Oskinova, L. M., & Gosset, E. 2013, ApJ, 763, 143. doi:10.1088/0004-637X/763/2/143
- Nazé & Motch (2018) Nazé, Y., & Motch, C. 2018, A&A, 619, A148
- Nazé et al. (2019a) Nazé, Y., Rauw, G., & Smith, M. 2019a, A&A, 632, A23. doi:10.1051/0004-6361/201936307
- Nazé et al. (2019b) Nazé, Y., Rauw, G., Guarro Fló, J., et al. 2019b, New Astron., 73, 101279. doi:10.1016/j.newast.2019.101279
- Nazé et al. (2020) Nazé, Y., Motch, C., Rauw, G., et al. 2020, MNRAS, 493, 2511. doi:10.1093/mnras/staa457
- Nazé et al. (2022a) Nazé, Y., Rauw, G., Czesla, S., et al. 2022a, MNRAS, 510, 2286
- Nazé et al. (2022b) Nazé, Y., Rauw, G., Bohlsen, T., Heathcote, B., Mc Gee, P., Cacella, P., Motch, C., 2022b, MNRAS, 512, 1648. doi:10.1093/mnras/stac314
- Neiner et al. (2011) Neiner, C., de Batz, B., Cochard, F., et al. 2011, AJ, 142, 149. doi:10.1088/0004-6256/142/5/149
- Nemravová et al. (2012) Nemravová, J., Harmanec, P., Koubský, P., et al. 2012, A&A, 537, A59
- Nichols et al. (2021) Nichols, J. S., Nazé, Y., Huenemoerder, D. P., et al. 2021, ApJ, 906, 89. doi:10.3847/1538-4357/abca3a
- Okazaki & Negueruela (2001) Okazaki, A. T. & Negueruela, I. 2001, A&A, 377, 161. doi:10.1051/0004-6361:20011083
- Oskinova et al. (2001a) Oskinova, L. M., Ignace, R., Brown, J. C., et al. 2001, A&A, 373, 1009. doi:10.1051/0004-6361:20010669
- Oskinova et al. (2001b) Oskinova, L. M., Clarke, D., & Pollock, A. M. T. 2001, A&A, 378, L21. doi:10.1051/0004-6361:20011222
- Oskinova (2005) Oskinova, L. M. 2005, MNRAS, 361, 679. doi:10.1111/j.1365-2966.2005.09229.x
- Panoglou et al. (2018) Panoglou, D., Faes, D. M., Carciofi, A. C., et al. 2018, MNRAS, 473, 3039. doi:10.1093/mnras/stx2497
- Papaloizou et al. (1992) Papaloizou, J. C., Savonije, G. J., & Henrichs, H. F. 1992, A&A, 265, L45
- Parkin & Sim (2013) Parkin, E. R. & Sim, S. A. 2013, ApJ, 767, 114. doi:10.1088/0004-637X/767/2/114
- Pedersen et al. (2020) Pedersen, M. G., Escorza, A., Pápics, P. I., et al. 2020, MNRAS, 495, 2738. doi:10.1093/mnras/staa1292
- Peters et al. (2008) Peters, G. J., Gies, D. R., Grundstrom, E. D., et al. 2008, ApJ, 686, 1280. doi:10.1086/591145
- Peters et al. (2013) Peters, G. J., Pewett, T. D., Gies, D. R., et al. 2013, ApJ, 765, 2. doi:10.1088/0004-637X/765/1/2
- Peters et al. (2016) Peters, G. J., Wang, L., Gies, D. R., et al. 2016, ApJ, 828, 47. doi:10.3847/0004-637X/828/1/47
- Pittard & Parkin (2010) Pittard, J. M. & Parkin, E. R. 2010, MNRAS, 403, 1657. doi:10.1111/j.1365-2966.2010.15776.x
- Pollmann (2017) Pollmann, E. 2017, Information Bulletin on Variable Stars, 6208, 1. doi:10.22444/IBVS.6208
- Postnov et al. (2017) Postnov, K., Oskinova, L., & Torrejón, J. M. 2017, MNRAS, 465, L119. doi:10.1093/mnrasl/slw223
- Pszota et al. (2008) Pszota, G., Zhang, H., Yuan, F., et al. 2008, MNRAS, 389, 423. doi:10.1111/j.1365-2966.2008.13587.x
- Quirrenbach et al. (1997) Quirrenbach, A., Bjorkman, K. S., Bjorkman, J. E., et al. 1997, ApJ, 479, 477. doi:10.1086/303854
- Ramiaramanantsoa et al. (2014) Ramiaramanantsoa, T., Moffat, A. F. J., Chené, A.-N., et al. 2014, MNRAS, 441, 910. doi:10.1093/mnras/stu619
- Ramiaramanantsoa et al. (2018) Ramiaramanantsoa, T., Moffat, A. F. J., Harmon, R., et al. 2018, MNRAS, 473, 5532. doi:10.1093/mnras/stx2671
- Rauw et al. (2015a) Rauw, G., Hervé, A., Nazé, Y., et al. 2015a, A&A, 580, A59. doi:10.1051/0004-6361/201526057
- Rauw et al. (2015b) Rauw, G., Nazé, Y., Wright, N. J., et al. 2015b, ApJS, 221, 1. doi:10.1088/0067-0049/221/1/1
- Rauw & Nazé (2016) Rauw, G. & Nazé, Y. 2016, Advances in Space Research, 58, 761. doi:10.1016/j.asr.2015.09.026
- Rauw et al. (2022) Rauw, G., Nazé, Y., Motch, C., et al. 2022, A&A, in press (arXiv:2206.08730)
- Reynolds et al. (2014) Reynolds, M. T., Reis, R. C., Miller, J. M., et al. 2014, MNRAS, 441, 3656. doi:10.1093/mnras/stu832
- Ruždjak et al. (2009) Ruždjak, D., Božić, H., Harmanec, P., et al. 2009, A&A, 506, 1319. doi:10.1051/0004-6361/200810526
- Sana et al. (2006) Sana, H., Rauw, G., Nazé, Y., et al. 2006, MNRAS, 372, 661. doi:10.1111/j.1365-2966.2006.10847.x
- Schaefer et al. (2010) Schaefer, G. H., Gies, D. R., Monnier, J. D., et al. 2010, AJ, 140, 1838. doi:10.1088/0004-6256/140/6/1838
- Schild et al. (2004) Schild, H., Güdel, M., Mewe, R., et al. 2004, A&A, 422, 177. doi:10.1051/0004-6361:20047035
- Shao & Li (2014) Shao, Y. & Li, X.-D. 2014, ApJ, 796, 37. doi:10.1088/0004-637X/796/1/37
- Shao & Li (2021) Shao, Y. & Li, X.-D. 2021, ApJ, 908, 67. doi:10.3847/1538-4357/abd2b4
- Shenar et al. (2020) Shenar, T., Bodensteiner, J., Abdul-Masih, M., et al. 2020, A&A, 639, L6. doi:10.1051/0004-6361/202038275
- Smith et al. (1998) Smith, M. A., Robinson, R. D., & Corbet, R. H. D. 1998, ApJ, 503, 877
- Smith et al. (2012) Smith, M. A., Lopes de Oliveira, R., Motch, C., et al. 2012, A&A, 540, A53
- Smith et al. (2016) Smith, M. A., Lopes de Oliveira, R., & Motch, C. 2016, Advances in Space Research, 58, 782
- Smith et al. (2017) Smith, M. A., Lopes de Oliveira, R., & Motch, C. 2017, MNRAS, 469, 1502. doi:10.1093/mnras/stx926
- Štefl et al. (2009) Štefl, S., Rivinius, T., Carciofi, A. C., et al. 2009, A&A, 504, 929. doi:10.1051/0004-6361/200811573
- Stevens & Pollock (1994) Stevens, I. R. & Pollock, A. M. T. 1994, MNRAS, 269, 226. doi:10.1093/mnras/269.2.226
- Touhami et al. (2011) Touhami, Y., Gies, D. R., & Schaefer, G. H. 2011, ApJ, 729, 17. doi:10.1088/0004-637X/729/1/17
- Touhami et al. (2013) Touhami, Y., Gies, D. R., Schaefer, G. H., et al. 2013, ApJ, 768, 128. doi:10.1088/0004-637X/768/2/128
- Tycner et al. (2008) Tycner, C., Jones, C. E., Sigut, T. A. A., et al. 2008, ApJ, 689, 461. doi:10.1086/592097
- ud-Doula & Nazé (2016) ud-Doula, A. & Nazé, Y. 2016, Advances in Space Research, 58, 680. doi:10.1016/j.asr.2015.09.025
- van Leeuwen (2007) van Leeuwen, F. 2007, A&A, 474, 653. doi:10.1051/0004-6361:20078357
- Vink (2017) Vink, J. S. 2017, A&A, 607, L8. doi:10.1051/0004-6361/201731902
- Wade et al. (2016) Wade, G. A., Neiner, C., Alecian, E., et al. 2016, MNRAS, 456, 2. doi:10.1093/mnras/stv2568
- Wang et al. (2017) Wang, L., Gies, D. R., & Peters, G. J. 2017, ApJ, 843, 60. doi:10.3847/1538-4357/aa740a
- Wang et al. (2018) Wang, L., Gies, D. R., & Peters, G. J. 2018, ApJ, 853, 156. doi:10.3847/1538-4357/aaa4b8
- Wang et al. (2021) Wang, L., Gies, D. R., Peters, G. J., et al. 2021, AJ, 161, 248. doi:10.3847/1538-3881/abf144
- Willis et al. (1995) Willis, A. J., Schild, H., & Stevens, I. R. 1995, A&A, 298, 549
- Zhekov (2012) Zhekov, S. A. 2012, MNRAS, 422, 1332. doi:10.1111/j.1365-2966.2012.20706.x
Appendix A The optical emission of HD 37202 ( Tau)


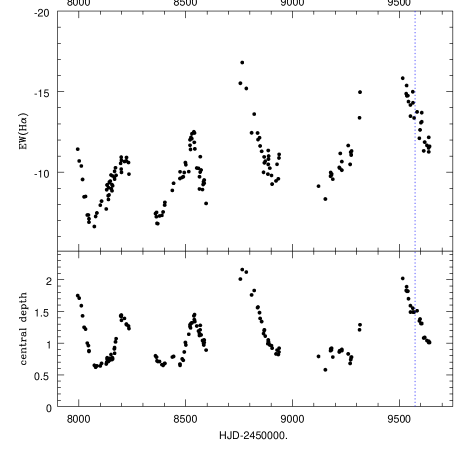
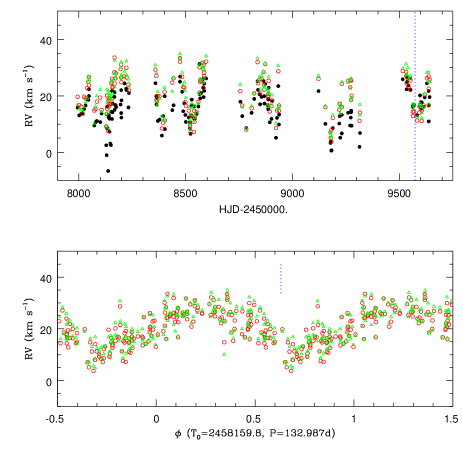
Thanks to its brightness, HD 37202 ( Tau) has been observed for a very long time. Its binarity is known since Adams (1905) and the high inclination of the disk of its Be component was long assumed because of the presence of shell-type profile (and demonstrated through interferometric measurements since at least Quirrenbach et al. 1997). In parallel, long-term spectral variations can be spotted for this star due to a changing disk, as in other Be stars. In this context, a unique decadal monitoring covering 1997–2008 revealed a cyclic behaviour of duration 1400 d (e.g. Štefl et al., 2009). Focusing on H, the line profile first displayed a very asymmetric shape, with the violet peak largely dominating. Then the amplitude difference between the peaks decreased and the profile, because of the central absorption, took a clear “shell” aspect. In a third phase, the profile became again asymmetric, but this time with the red peak dominating. Finally, the line returned to a symmetrical situation but not with a shell appearance - instead, a pure emission line with multiple small subpeaks could be seen.
This behaviour was interpreted in several ways. Carciofi et al. (2009) performed 3D NLTE radiative transfer modelling. They could reproduce the observed profile variations by considering a viscous decretion disk with a one-armed spiral. Schaefer et al. (2010) rather interpreted the profile variations by considering a precessing disk.
Over that 1997–2008 decade, the average equivalent width of the line remained quite stable near –20Å, but the emission strength subsequently dropped to reach a minimum in early 2013 (see Fig. 2 in Pollmann, 2017). The disk has since (partially) recovered, but the behaviour seems to have changed. Typically, the target is observed from Fall to Spring and the previous study (Pollmann, 2017) stopped in Spring 2017. We therefore decided to focus on data taken since then, i.e. in the last five observing seasons.
Spectra were downloaded from the BeSS database (Neiner et al., 2011, and http://basebe.obspm.fr): five low-resolution () spectra were discarded as most spectra have . Signal-to-noise ratios ranged from 20 to 700, with a typical value of 150–350. In total, 162 spectra were examined, splitted in the following manner: 47 in 2017–8, 44 in 2018–9, 27 in 2019–20, 20 in 2020–21, and 24 in 2021–2. These spectra were corrected for telluric absorption within IRAF and then normalized using low-order polynomials through the same wavelength windows.
Figure 4 displays the observed profile variations of the H line. The strongly asymmetric profiles, which were common in 1997–2008, have now totally disappeared. Instead, the profiles remain symmetric, with little V/R changes. The only source of variations comes from the changing depth of the central absorption. Figure 5 provides the evolution of and of the normalized amplitude of the lowest point in the central absorption (see also Table 4). Both parameters show a good correlation, showing that the variations are indeed mostly driven by the changing absorption depth.
The profile variations appear to repeat, albeit not in an identical way. The were indeed larger in the last three seasons than in the first two. Moreover, the duration of these cycles does not remain constant as there are 200–400 d between two consecutive minima or two consecutive maxima. Such timescales appear to be in agreement with preliminary findings from Pollmann (2017) but they are well below the previously reported cycle length of 1400 d, however. It is thus difficult to explain the cyclic behaviour of HD 37202 by precession, since the period of that phenomenon would not change over a few decades. If disk structure are instead responsible for the profile variations, then the observations indicate a change in the disk geometry over time, with a recent disappearance of the spiral arm spotted in 1997–2008.
Finally, we have evaluated the radial velocity of the H line. To this aim, we have first computed the first-order moment of the line. However, since the core of the line varies quite a lot, this estimate may be biased. Therefore, we also calculate the using two other methods. The mirror method compares the blue wing to the mirrored (i.e. reversed in velocities) red wing, for several shifts. It has been used notably for Cas itself (Nemravová et al., 2012). The wings were considered between normalized amplitudes 1.16 and 1.5, which enables us to totally avoid the central absorption. The double-Gaussian method, also used on Cas (Smith et al., 2012), correlates the line profile with a function composed of two Gaussians with identical widths (here, 15 km s-1), opposed amplitudes and centers (here, centers were set at km s-1). Both methods avoid considering the central core, which is often strongly affected by disk variations in Be stars. The results of these determinations are provided in Table 4 and shown in Fig. 6.
A period search, using notably a modified Fourier algorithm (see e.g. Nazé et al. 2022a), was applied to the velocities. It yielded a period of 133.31.1 d for the mirror and 132.51.1 d for the double-Gaussian . These periods agree with previous determinations but are less precise. We therefore adopted the same period value as Ruždjak et al. (2009): d. Orbital solutions were then calculated for this period. When considering excentric solutions, the best-fit eccentricity does not appear to be significant: . Circular solutions are thus favored, with parameters: km s-1, km s-1, and (conjunction with the Be primary in front). Those values agree well with the orbital solution of Ruždjak et al. (2009).
| (H) | depth | (km s-1) | (H) | depth | (km s-1) | (H) | depth | (km s-1) | |||||||||
|---|---|---|---|---|---|---|---|---|---|---|---|---|---|---|---|---|---|
| (Å) | M1 | mirror | 2G | (Å) | M1 | mirror | 2G | (Å) | M1 | mirror | 2G | ||||||
| 7994.666 | -11.4 | 1.75 | 15.8 | 19.7 | 16.9 | 8394.557 | -7.5 | 0.65 | 12.8 | 10.5 | 11.3 | 8887.393 | -10.8 | 1.02 | 18.8 | 20.7 | 20.6 |
| 8001.662 | -10.7 | 1.71 | 13.1 | 16.7 | 15.3 | 8401.580 | -8.0 | 0.68 | 19.9 | 21.5 | 22.9 | 8888.414 | -11.0 | 1.00 | 22.9 | 25.3 | 26.7 |
| 8011.663 | -10.4 | 1.59 | 13.7 | 16.2 | 15.0 | 8402.606 | -8.1 | 0.68 | 8.2 | 11.3 | 11.4 | 8893.424 | -10.3 | 0.97 | 10.6 | 14.5 | 16.1 |
| 8017.674 | -9.6 | 1.43 | 13.9 | 13.6 | 14.6 | 8437.445 | -8.9 | 0.78 | 14.9 | 24.7 | 21.6 | 8901.446 | -9.8 | 0.96 | 11.9 | 16.3 | 17.0 |
| 8024.635 | -8.5 | 1.25 | 15.3 | 19.7 | 16.0 | 8443.469 | -9.3 | 0.79 | 16.7 | 26.3 | 26.5 | 8904.327 | -9.3 | 0.92 | 18.1 | 18.4 | 20.3 |
| 8031.564 | -8.5 | 1.22 | 16.6 | 19.1 | 17.7 | 8473.408 | -9.6 | 0.67 | 25.0 | 33.4 | 33.3 | 8922.378 | -9.5 | 0.83 | 5.2 | 8.7 | 10.3 |
| 8039.554 | -7.3 | 1.00 | 18.8 | 22.7 | 19.1 | 8473.693 | -10.0 | 0.65 | 26.8 | 32.1 | 34.9 | 8927.373 | -10.5 | 0.89 | 12.2 | 14.8 | 15.1 |
| 8044.637 | -7.3 | 0.96 | 18.6 | 25.0 | 24.7 | 8483.687 | -9.7 | 0.75 | 21.5 | 26.8 | 28.3 | 8933.343 | -9.6 | 0.82 | 23.4 | 28.7 | 30.7 |
| 8047.493 | -7.1 | 0.88 | 22.3 | 26.7 | 26.7 | 8488.687 | -9.7 | 0.73 | 14.6 | 23.1 | 23.8 | 8936.348 | -10.9 | 0.86 | 9.9 | 14.7 | 16.0 |
| 8047.529 | -6.9 | 0.87 | 19.9 | 23.7 | 25.8 | 8493.429 | -10.0 | 0.86 | 17.4 | 22.9 | 24.8 | 8937.314 | -11.1 | 0.92 | 13.4 | 16.6 | 16.9 |
| 8072.540 | -6.6 | 0.65 | 9.5 | 14.8 | 10.1 | 8498.416 | -10.6 | 1.01 | 13.2 | 17.8 | 21.7 | 9121.577 | -9.1 | 0.79 | 21.7 | 26.0 | 27.1 |
| 8078.569 | -7.3 | 0.62 | 10.7 | 15.3 | 16.4 | 8500.774 | -10.5 | 0.97 | 10.8 | 16.5 | 19.3 | 9153.556 | -8.3 | 0.58 | 10.1 | 16.0 | 16.4 |
| 8084.477 | -7.5 | 0.64 | 11.1 | 18.0 | 20.0 | 8514.336 | -10.0 | 1.14 | 12.3 | 14.8 | 16.1 | 9177.449 | -9.8 | 0.88 | 3.3 | 7.1 | 6.7 |
| 8100.455 | -8.0 | 0.64 | 10.7 | 19.4 | 22.2 | 8520.295 | -11.7 | 1.26 | 10.7 | 10.2 | 11.5 | 9178.453 | -10.0 | 0.91 | 3.9 | 5.1 | 7.1 |
| 8106.489 | -8.2 | 0.68 | 13.8 | 15.0 | 14.4 | 8520.398 | -12.0 | 1.29 | 8.5 | 9.2 | 10.1 | 9181.475 | -9.8 | 0.89 | 0.6 | 3.7 | 5.5 |
| 8128.308 | -7.7 | 0.67 | 2.5 | 9.2 | 9.3 | 8522.784 | -11.4 | 1.24 | 6.5 | 7.1 | 8.2 | 9182.465 | -9.9 | 0.92 | 0.7 | 8.1 | 4.9 |
| 8130.409 | -8.9 | 0.70 | -1.0 | 13.6 | 13.8 | 8524.446 | -12.2 | 1.31 | 12.9 | 13.2 | 13.2 | 9188.412 | -9.6 | 0.78 | 8.6 | 12.2 | 13.2 |
| 8132.300 | -9.2 | 0.77 | 16.2 | 20.2 | 22.2 | 8528.416 | -12.1 | 1.32 | 18.7 | 16.5 | 17.3 | 9218.495 | -10.3 | 0.86 | 10.2 | 15.2 | 15.7 |
| 8132.353 | -9.2 | 0.75 | 8.5 | 15.4 | 17.6 | 8529.315 | -12.4 | 1.32 | 16.6 | 12.7 | 15.7 | 9220.482 | -10.3 | 0.88 | 12.8 | 17.2 | 17.2 |
| 8137.370 | -8.5 | 0.75 | -6.6 | 7.6 | 8.8 | 8538.261 | -12.5 | 1.43 | 12.1 | 7.2 | 10.5 | 9223.302 | -11.2 | 0.88 | 5.2 | 13.1 | 13.8 |
| 8138.542 | -8.3 | 0.71 | 13.2 | 18.3 | 21.8 | 8540.271 | -11.9 | 1.37 | 16.3 | 14.7 | 16.5 | 9230.371 | -10.7 | 0.90 | 6.7 | 16.0 | 15.8 |
| 8139.413 | -9.0 | 0.73 | 12.4 | 19.2 | 20.8 | 8541.435 | -12.4 | 1.45 | 12.1 | 10.8 | 12.2 | 9230.620 | -10.1 | 0.88 | 13.3 | 24.2 | 25.0 |
| 8141.447 | -8.6 | 0.74 | 13.0 | 16.3 | 14.9 | 8542.741 | -11.5 | 1.34 | 11.9 | 12.6 | 13.2 | 9260.286 | -11.7 | 0.83 | 14.0 | 25.4 | 24.6 |
| 8143.319 | -9.4 | 0.76 | 11.9 | 18.7 | 18.8 | 8551.704 | -10.3 | 1.27 | 13.6 | 14.3 | 14.3 | 9269.661 | -10.5 | 0.68 | 9.5 | 23.1 | 22.6 |
| 8143.470 | -9.4 | 0.73 | 7.3 | 17.0 | 19.9 | 8559.745 | -10.2 | 1.19 | 16.2 | 17.9 | 17.3 | 9272.366 | -11.2 | 0.74 | 12.3 | 25.6 | 25.7 |
| 8147.444 | -9.5 | 0.75 | 3.1 | 17.1 | 18.9 | 8564.339 | -9.0 | 1.12 | 31.3 | 30.1 | 30.8 | 9274.281 | -11.1 | 0.77 | 14.3 | 18.6 | 18.2 |
| 8150.385 | -9.8 | 0.82 | 2.6 | 17.0 | 19.9 | 8564.554 | -9.7 | 1.15 | 20.6 | 21.2 | 20.7 | 9274.434 | -11.1 | 0.78 | 14.8 | 25.4 | 26.2 |
| 8151.515 | -9.0 | 0.74 | 14.4 | 24.5 | 24.6 | 8567.768 | -10.0 | 1.21 | 19.1 | 24.9 | 26.0 | 9276.365 | -11.3 | 0.78 | 9.4 | 20.0 | 19.4 |
| 8155.309 | -9.2 | 0.76 | 11.8 | 18.7 | 18.4 | 8568.326 | -11.0 | 1.28 | 20.8 | 25.6 | 25.9 | 9313.356 | -13.4 | 1.21 | 2.0 | 11.2 | 13.1 |
| 8155.466 | -8.8 | 0.74 | 21.7 | 26.1 | 25.5 | 8572.323 | -10.1 | 1.13 | 21.0 | 25.4 | 25.5 | 9315.641 | -15.0 | 1.29 | 6.8 | 14.1 | 16.9 |
| 8157.378 | -9.8 | 0.77 | 14.2 | 22.9 | 25.3 | 8578.675 | -8.9 | 1.04 | 25.6 | 31.8 | 31.8 | 9515.556 | -15.8 | 2.02 | 25.9 | 28.8 | 29.7 |
| 8158.534 | -9.2 | 0.75 | 17.2 | 23.2 | 20.8 | 8581.677 | -9.2 | 1.04 | 23.0 | 29.5 | 30.0 | 9531.722 | -14.9 | 1.83 | 27.1 | 28.5 | 31.3 |
| 8166.316 | -9.7 | 0.91 | 19.7 | 28.4 | 27.8 | 8583.690 | -9.4 | 1.00 | 19.6 | 22.8 | 24.6 | 9533.736 | -15.4 | 1.89 | 22.3 | 24.4 | 27.3 |
| 8167.310 | -10.1 | 0.93 | 21.2 | 33.5 | 32.6 | 8584.692 | -9.3 | 0.97 | 26.2 | 31.1 | 31.0 | 9534.749 | -14.7 | 1.82 | 24.9 | 26.6 | 27.7 |
| 8167.453 | -9.6 | 0.84 | 15.1 | 24.3 | 23.1 | 8586.367 | -9.5 | 1.05 | 24.3 | 27.1 | 26.2 | 9539.480 | -14.8 | 1.82 | 26.2 | 26.5 | 29.9 |
| 8171.387 | -10.3 | 1.02 | 16.8 | 26.2 | 26.3 | 8586.678 | -9.3 | 1.01 | 21.7 | 28.2 | 29.2 | 9542.451 | -14.4 | 1.70 | 23.7 | 23.2 | 25.9 |
| 8174.497 | -9.8 | 1.07 | 16.0 | 28.0 | 27.9 | 8595.687 | -8.1 | 0.89 | 26.1 | 32.1 | 34.1 | 9551.493 | -14.2 | 1.59 | 26.1 | 25.4 | 27.0 |
| 8195.579 | -10.6 | 1.43 | 16.9 | 29.5 | 29.9 | 8755.682 | -15.5 | 2.01 | 17.9 | 21.7 | 24.0 | 9551.675 | -13.5 | 1.49 | 22.2 | 22.1 | 26.2 |
| 8198.320 | -10.2 | 1.42 | 22.0 | 31.1 | 32.0 | 8764.668 | -16.8 | 2.16 | 12.8 | 16.6 | 16.0 | 9562.434 | -15.0 | 1.55 | 16.0 | 14.4 | 15.9 |
| 8198.359 | -10.9 | 1.44 | 13.9 | 26.5 | 27.3 | 8783.624 | -15.2 | 2.12 | 8.6 | 8.0 | 8.5 | 9563.431 | -14.3 | 1.49 | 16.6 | 12.9 | 17.1 |
| 8199.303 | -10.7 | 1.44 | 12.3 | 24.8 | 26.5 | 8808.537 | -12.4 | 1.76 | 14.0 | 15.6 | 16.3 | 9568.655 | -13.4 | 1.49 | 16.7 | 14.5 | 16.7 |
| 8199.394 | -10.0 | 1.36 | 18.4 | 26.6 | 27.4 | 8820.698 | -13.6 | 1.83 | 18.9 | 20.9 | 20.8 | 9582.672 | -13.7 | 1.51 | 13.2 | 11.3 | 12.5 |
| 8213.646 | -10.7 | 1.39 | 24.4 | 26.9 | 28.7 | 8836.372 | -12.4 | 1.56 | 25.2 | 31.9 | 33.3 | 9593.309 | -12.1 | 1.35 | 16.2 | 14.1 | 16.2 |
| 8222.368 | -10.7 | 1.30 | 22.6 | 29.9 | 32.3 | 8838.481 | -12.0 | 1.57 | 22.1 | 24.4 | 25.3 | 9596.466 | -12.6 | 1.38 | 20.1 | 17.0 | 17.2 |
| 8223.323 | -10.9 | 1.29 | 22.0 | 26.5 | 27.3 | 8845.517 | -12.1 | 1.48 | 20.5 | 25.8 | 26.6 | 9600.548 | -13.1 | 1.31 | 17.8 | 15.3 | 16.1 |
| 8232.338 | -10.6 | 1.27 | 15.9 | 24.0 | 25.9 | 8848.437 | -11.6 | 1.39 | 17.0 | 20.9 | 22.4 | 9604.381 | -13.1 | 1.31 | 15.6 | 11.1 | 12.2 |
| 8234.605 | -9.9 | 1.23 | 21.0 | 21.9 | 23.4 | 8855.503 | -11.3 | 1.34 | 19.6 | 25.8 | 27.1 | 9604.413 | -13.7 | 1.31 | 17.7 | 14.7 | 14.1 |
| 8358.681 | -7.4 | 0.80 | 24.5 | 29.3 | 30.8 | 8864.304 | -10.0 | 1.15 | 25.2 | 28.4 | 28.6 | 9613.605 | -11.3 | 1.08 | 16.1 | 16.6 | 15.9 |
| 8362.668 | -7.2 | 0.78 | 19.9 | 27.1 | 28.3 | 8867.472 | -11.0 | 1.20 | 19.9 | 23.9 | 23.6 | 9618.402 | -11.9 | 1.09 | 19.4 | 20.5 | 20.9 |
| 8363.581 | -7.5 | 0.78 | 16.9 | 18.7 | 18.0 | 8868.282 | -10.6 | 1.21 | 17.3 | 22.2 | 23.0 | 9628.595 | -11.7 | 1.04 | 24.4 | 26.3 | 28.2 |
| 8365.641 | -6.8 | 0.72 | 19.3 | 18.1 | 16.6 | 8872.422 | -10.7 | 1.11 | 24.2 | 31.2 | 31.5 | 9636.681 | -11.5 | 1.01 | 21.7 | 26.8 | 28.3 |
| 8369.601 | -6.8 | 0.71 | 11.1 | 20.0 | 21.4 | 8884.387 | -9.9 | 0.99 | 16.4 | 16.7 | 16.3 | 9637.292 | -11.3 | 1.02 | 10.9 | 16.7 | 17.1 |
| 8377.608 | -7.3 | 0.71 | 11.6 | 19.8 | 19.0 | 8886.284 | -10.5 | 1.02 | 15.3 | 19.7 | 22.3 | 9637.402 | -12.2 | 1.03 | 16.6 | 22.6 | 24.8 |
| 8388.695 | -7.3 | 0.66 | 5.9 | 8.5 | 12.8 | 8886.362 | -11.4 | 1.05 | 18.7 | 20.1 | 21.5 | 9641.307 | -11.6 | 1.01 | 19.6 | 25.8 | 24.9 |
were evaluated between –600 km s-1 and 600 km s-1; ‘depth’ corresponds to the normalized amplitude of the lowest point in the central absorption ( if below continuum, if above it); were evaluated by three methods (see text): the first order moment (column M1), the mirror method (column mirror), and the double-Gaussian method (column 2G).